the Creative Commons Attribution 4.0 License.
the Creative Commons Attribution 4.0 License.
 | 07 Feb 2018
The river absorption capacity determination as a tool to evaluate state of surface water
Paweł Wilk
Paulina Orlińska-Woźniak
Joanna Gębala
In order to complete a thorough and systematic assessment of water quality, it is useful to measure the absorption capacity of a river. Absorption capacity is understood as a pollution load introduced into river water that will not cause permanent and irreversible changes in the aquatic ecosystem and will not cause a change in the classification of water quality in the river profile. In order to implement the method, the Macromodel DNS/SWAT basin for the Middle Warta pilot (central Poland) was used to simulate nutrient loads. This enabled detailed analysis of water quality in each water body and the assessment of the size of the absorption capacity parameter, which allows the determination of how much pollution can be added to the river without compromising its quality class. Positive values of the calculated absorption capacity parameter mean that it is assumed that the ecosystem is adjusted in such a way that it can eliminate pollution loads through a number of self-purification processes. Negative values indicate that the load limit has been exceeded, and too much pollution has been introduced into the ecosystem for it to be able to deal with through the processes of self-purification. Absorption capacity thus enables the connection of environmental standards of water quality and water quality management plans in order to meet these standards.


The Water Framework Directive (WFD) (Directive 2000/60/EC) implemented in the European Union treats water as a common good and obligates the sustainable management of its resources, among other things, by preventing degradation, improving the state of water resources, and protecting aquatic and water-dependent ecosystems (Orlińska-Wozniak et al., 2013; Boeuf and Fritsh, 2016). The WFD determines the search for new and more effective solutions for the state of the aquatic environment and, consequently, the assessment of the effectiveness of action plans in areas deemed polluted. What is important here is that surface water pollution, in most cases, is not an irreversible state, so pollutant input to surface water will not always lead to irreversible contamination. Water has the ability to self-purify (Dubnyak and Timchenko, 2000; Gorecki, 2007; Jancarkova et al., 1997; Karrasch et al., 2006; Jarosiewicz and Dalszewska, 2008; McColl, 1974; Vagnetti, 2003; Zagorc-Končan and Somen, 1999; Zalewski, 2003).
Generally, self-purification is a biochemical transformation of pollutants (containing mainly organic compounds) into simpler forms, often inorganic, that have microorganism activity; this is done at the expense of the consumption of oxygen from the air and water and through sedimentation processes that cause the physical elimination of water pollution (Jarosiewicz, 2007; Kowalewski, 2009; Elósegui et al., 1995; Vagnetti, 2003). The most important factors influencing a river's self-purification ability include, among others, topography, soil type, vegetation, the hydraulic characteristics of the river, the retention time of water in the catchment, biodiversity and temperature (Spellman and Drinan, 2001; Schulz et al., 2003; Vaikasas and Dumbrauskas, 2010; Marsili-Libelli and Giusti, 2008; Popek, 2011; Van der Lee et al., 2004). To evaluate indirectly the possibility of a river performing self-purification – through the comparison of actual loads in the river to limit loads – the river absorption capacity (RAC) parameter is useful. The establishment of limits aims to determine a threshold below which there is a possibility of a river's self-purification.
It should be noted that beyond a certain critical level of pollutants it may be impossible for an aquatic ecosystem to return to its original condition (Kowalkowski, 2009; Nixon, 2009). This was confirmed, inter alia, by Duarte et al. (2009) in the article “Return to Neverland...”, which referred to the process of eutrophication. This work was motivated by attempts to improve water quality aimed at restoring ecosystems to their original conditions. Observations of many ecosystems were made and, despite the elimination of sources of pollution, they did not return to their original state, even after more than 30 years. Owing to this, the authors concluded that above a certain critical value of pollution, an ecosystem is not able to return to its original state. Understanding an ecosystem's response to multiple shifting baselines is essential in setting reliable targets for restoration efforts.
The most advanced work related to the determination of the so-called assimilative capacity of the river, which has similar assumptions to the river absorption capacity, is led by the US Environmental Protection Agency (EPA) through the implementation of the Clean Water Act (Federal Water Pollution Control Act, 2002). Institute of Meteorology and Water Management (IMGW) National Research Institute (PIB) started studies on river the utilization of the absorption capacity parameter in water management in 2011 by proposing the calculation of absorption capacity on the basis of the advanced Macromodel Discharge–Nutrient–Sea (DNS), which has the ability to determine of the amount of point and nonpoint sources of pollution in a given river section.
This paper presents a method of assessing the surface water state by determining the river absorption capacity parameter. Absorption capacity is defined as the maximum load that can be input into a river without exceeding limit load and changing the water quality state class or, when the absorption capacity is negative, the load that should be removed to accomplish limit loads. The method assumes the use of mathematical modelling. The Macromodel DNS, developed at IMGW-PIB, was used (Ostojski, 2012). It allows, inter alia, for daily flow simulations, as well as average daily loads of selected pollutants, which is essential for the determination of river retention. The simulation of these loads allows for the calculation of river absorption capacity.
The proposed method of evaluating the status of surface water by using the river absorption capacity parameter is an alternative to the ratio commonly used by the EPA, defined as the assimilative capacity of the river, and which is called the total maximum daily load (TMDL) (Bulsathaporn et al., 2013; Magley and Joyner, 2008; Mohlar, 2011; Radcliffe et al., 2009; Reckhow and Wostl, 2001).
This is defined as the maximum amount of a pollutant that can occur in a waterbody, designates the necessary reductions to one or more pollutant sources, allocates a planning tool and points out a potential starting point for restoration or protection activities with the ultimate goal of attaining or maintaining water quality standards (EPA, 2016). Procedures for determining the TMDL were first defined in 1992 and have been repeatedly revised and updated since then. This method is based on the identification of point and nonpoint pollution and then the calculation of their sum for the river sections previously recognized as endangered by excessive pollution.
WLAs are the point source loads, LAs are the nonpoint source loads, and MOS is the margin of safety.
Knowledge of a river's absorption capacity enables the implementation of action plans aimed at preventing the degradation of water quality, and consequently that of aquatic and water-dependent ecosystems, which occurs as a result of human activity, that is, “anthropopressure”. Currently there is no universal methodology to determine the absorption capacity of a river. In the few publications on the subject, only general equations are available (Chmielowski and Jarząbek, 2008; Monka, 2005; Tyszewski et al., 2008). The general RAC equations in this publication for calculating this parameter are sufficient for their purpose. However, when a more in-depth analysis of both the calculations and the results is required, knowledge of the entire RAC methodology is required, taking into account the pollutant load used for the calculation and a selected flow characteristic. There is also no information on the natural background of pollution identified as actual natural load (ANL), which should be taken into account when analysing the RAC parameter.
The aim of the study was to develop a method for the evaluation of the physico-chemical surface water state through the definition of the absorption capacity of a river. For this purpose, the Macromodel DNS/SWAT was used, which was calibrated, verified and validated for the Middle Warta pilot catchment. The model was prepared to take into account the individual processes of pollutant transformation and transport, from the moment pollutants enter the environment until their discharge into the sea, and to allow the determination of nutrient loads at estuary profiles of water bodies. Using data from the simulation, the method of calculating the absorption capacity of the river was implemented. The absorption capacity is understood as pollution load entered into a section of river that will not cause permanent and irreversible changes in the aquatic ecosystem and will not change the classification of water quality in the profile (Chmielowski and Jarząbek, 2008). Afterwards the results of absorption capacity at river profiles were evaluated and the consequences of positive and negative values of absorption capacity for the analysed area were analysed, linking the reference of water quality environmental standards with water quality management plans in order to meet these standards.
2.1 Absorption capacity
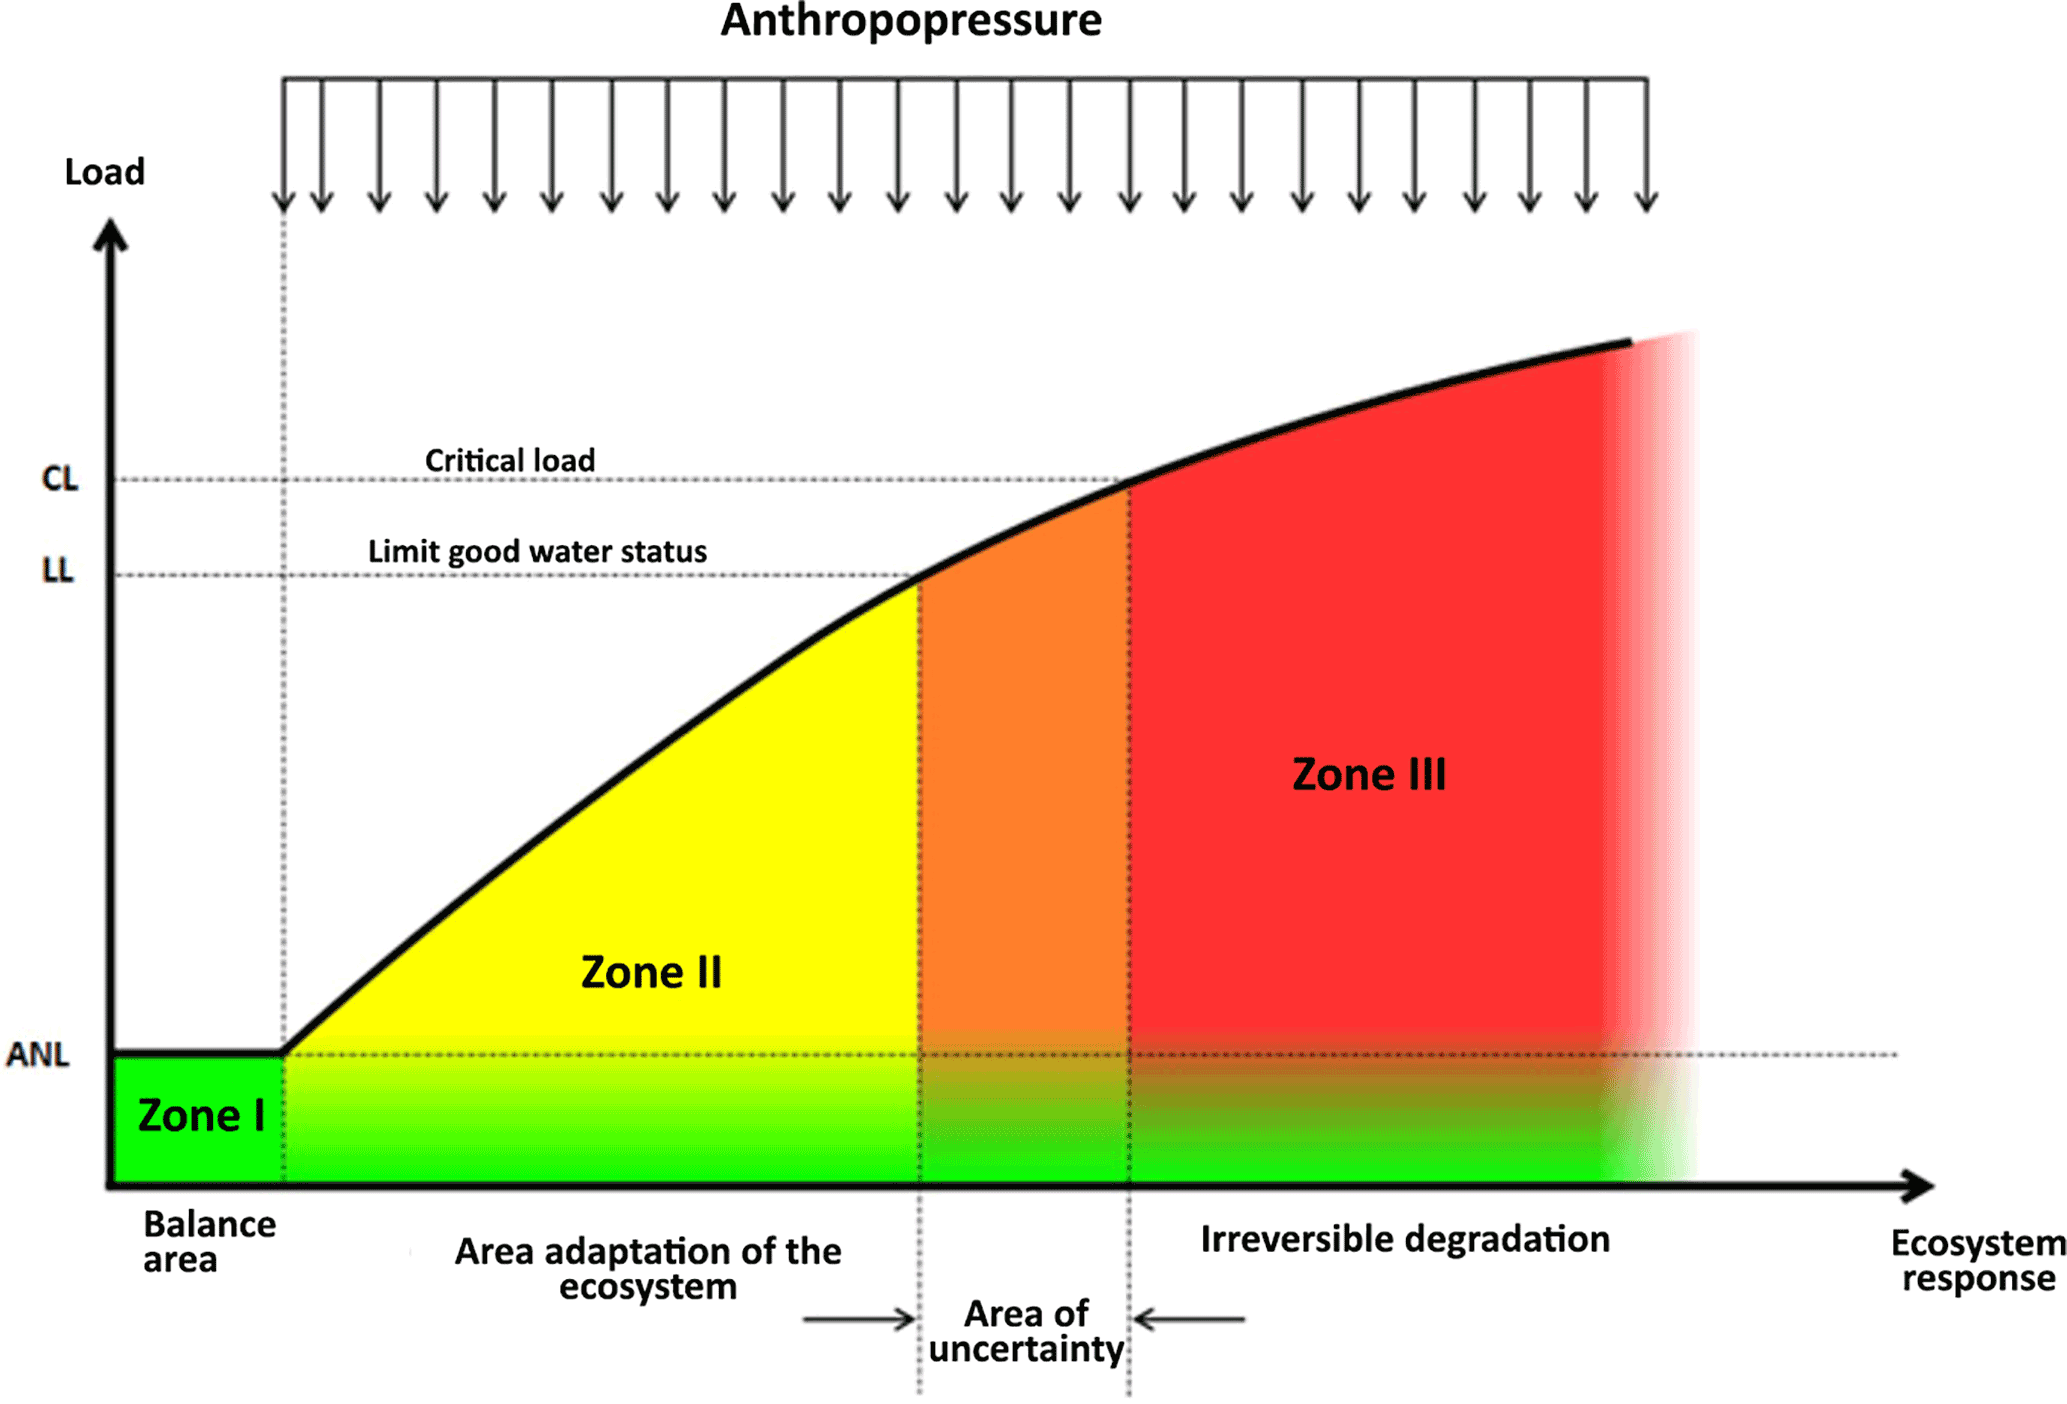
The phenomenon of absorption capacity is described by the schematic impact of pollutant discharges originating from human activity on the ecosystem of the basin presented in Fig. 1. When a natural river devoid of anthropopressure has only natural background pollution (Brodie et al., 2009; Helsinki Commission, 2004; Henriksson and Milijokonsulter, 2007), then we talk about the state of balance in the river (zone I), while the maximum pollution load in the river can be called ANL. This is a very rare situation and in Europe there are virtually no basins without human pressure. Some such basins are in the northern parts of Scandinavia and Russia (Helsinki Commission, 2004). Therefore, the only way to determine the natural background is to use a mathematical model which allows the creation of a scenario in which the entire human pressure on a catchment is removed. At the moment that anthropogenic discharge appears in a catchment, an ecosystem changes and enters a state of adaptation (zone II). This means that the pollution introduced to the basin will interfere with the balance of the ecosystem, but not cause permanent changes in it. An ecosystem adapts to pollution's “elimination” through a series of processes collectively called the self-purification of the river. Generally, it is assumed that after the removal of a pollution source, an ecosystem will return to a state of equilibrium (or close to it). In river ecosystems in zone II, retention can be up to 30 % of the total amount of nitrogen (Dziopak, 2007; Neverova-Dziopak, 2009). Therefore, the pollution discharged into a stream at any point will not be equal to the load of these pollutants registered at the control profile located below this discharge. Moreover, if there is too much pollution introduced into the ecosystem, the critical load (CL) can be exceeded, which will cause irreversible changes in the ecosystem. This causes an “overload” of the ecosystem (zone III). CL cannot be defined as the critical size of load in practice, as it it is very difficult to determine. Of course, it is possible to try to estimate the critical load value for selected catchment fragments, but this will always be approximate. The critical load can also be defined as the limit beyond which a return to good status is no longer possible. The amount of pollutants in a river is then so great that the previous self-cleaning processes are permanently impaired and no longer function. To prevent irreversible consequences of exceeding the CL, the concept of limit load (LL) is introduced, and its value is defined as the limit of good water status set by administrative decisions in accordance with the WFD and the regulation of the Minister of the Environment (Regulation of the Minister of the Environment, 2011). Limit load is the maximum load of a selected pollutant, which may be in a selected river section of an analysed river, which has been classified in class II of clean water (good water status). This load was calculated on the basis of the limit concentration (LC), which is determined in Poland by the ordinance of the Minister of the Environment, and also the selected characteristic flow (CF). A good water status is defined as waters that meet, for most water quality indicators, the requirements for surface waters used to supply the population with water for consumption. As well as the values of biological water quality, indicators show little indication of anthropogenic impact.
Actual natural load (background pollution) is determined based on the concentration of pollutants in the river without the anthropopressure impact (ANC) and characteristic flow (CF), which is the extreme value of water levels observed in the analysed period (Eq. 1).
CL is difficult to determine in practice, mainly because there is an area of uncertainty between the limit load value and the critical load value (Fig. 1). It is impossible to determine the boundaries of the area. Incorrect determination of CL can lead to erroneous conclusions, and consequently actions taken on this basis could result in irreversible changes in an ecosystem. Therefore, it is preferred that the LL is determined on the basis of LC of good water status (Regulation of the Minister of the Environment, 2011) and the CF. LL should be lower than the CL. It is the difference between LL and CL that defines whether we are dealing with a positive or negative RAC parameter (Fig. 2). In addition, the LL along with the CL define the so-called area of uncertainty (Fig. 1). The size of this area will be different for each water body, and its precise definition is very difficult because it is practically impossible to determine the critical load value beyond which a catchment will be permanently and irreversibly polluted.
Absorption capacity of the river is the difference between two loads: the first of these is the limit load calculated on the basis of a limit concentration determined in Poland for different types of water by the Regulation of the Minister of the Environment (Regulation of the Minister of the Environment, 2011); the second is the actual load calculated based on the actual concentration at a selected river profile. When calculating both mentioned loads, the selected characteristic flow is used. Absorption capacity of the river is calculated for each pollutant separately and should consider all potential sources of pollution (both point and nonpoint sources). The results of absorption capacity are obtained for selected river profiles.
River absorption capacity for a selected control profile is described by the following equation:
where LL is the limit load for selected pollutant (103 kg yr−1), and AL is the actual load for selected pollutant (103 kg yr−1).
The actual load at a control profile is described by the following equation:
where AC is the actual concentration of selected pollutant (mg L−1), and CF is the characteristic flow (m3 s−1).
While the limit load at a control profile is described by the following equation:
LC is the limit concentration of the selected pollutant (mg L−1).
In the research, the mean low flow (SNQ), which is the arithmetic mean of the lowest yearly flows, was chosen as a characteristic flow.
where n is the number of elements in the analysed set.
2.2 Absorption capacity cases
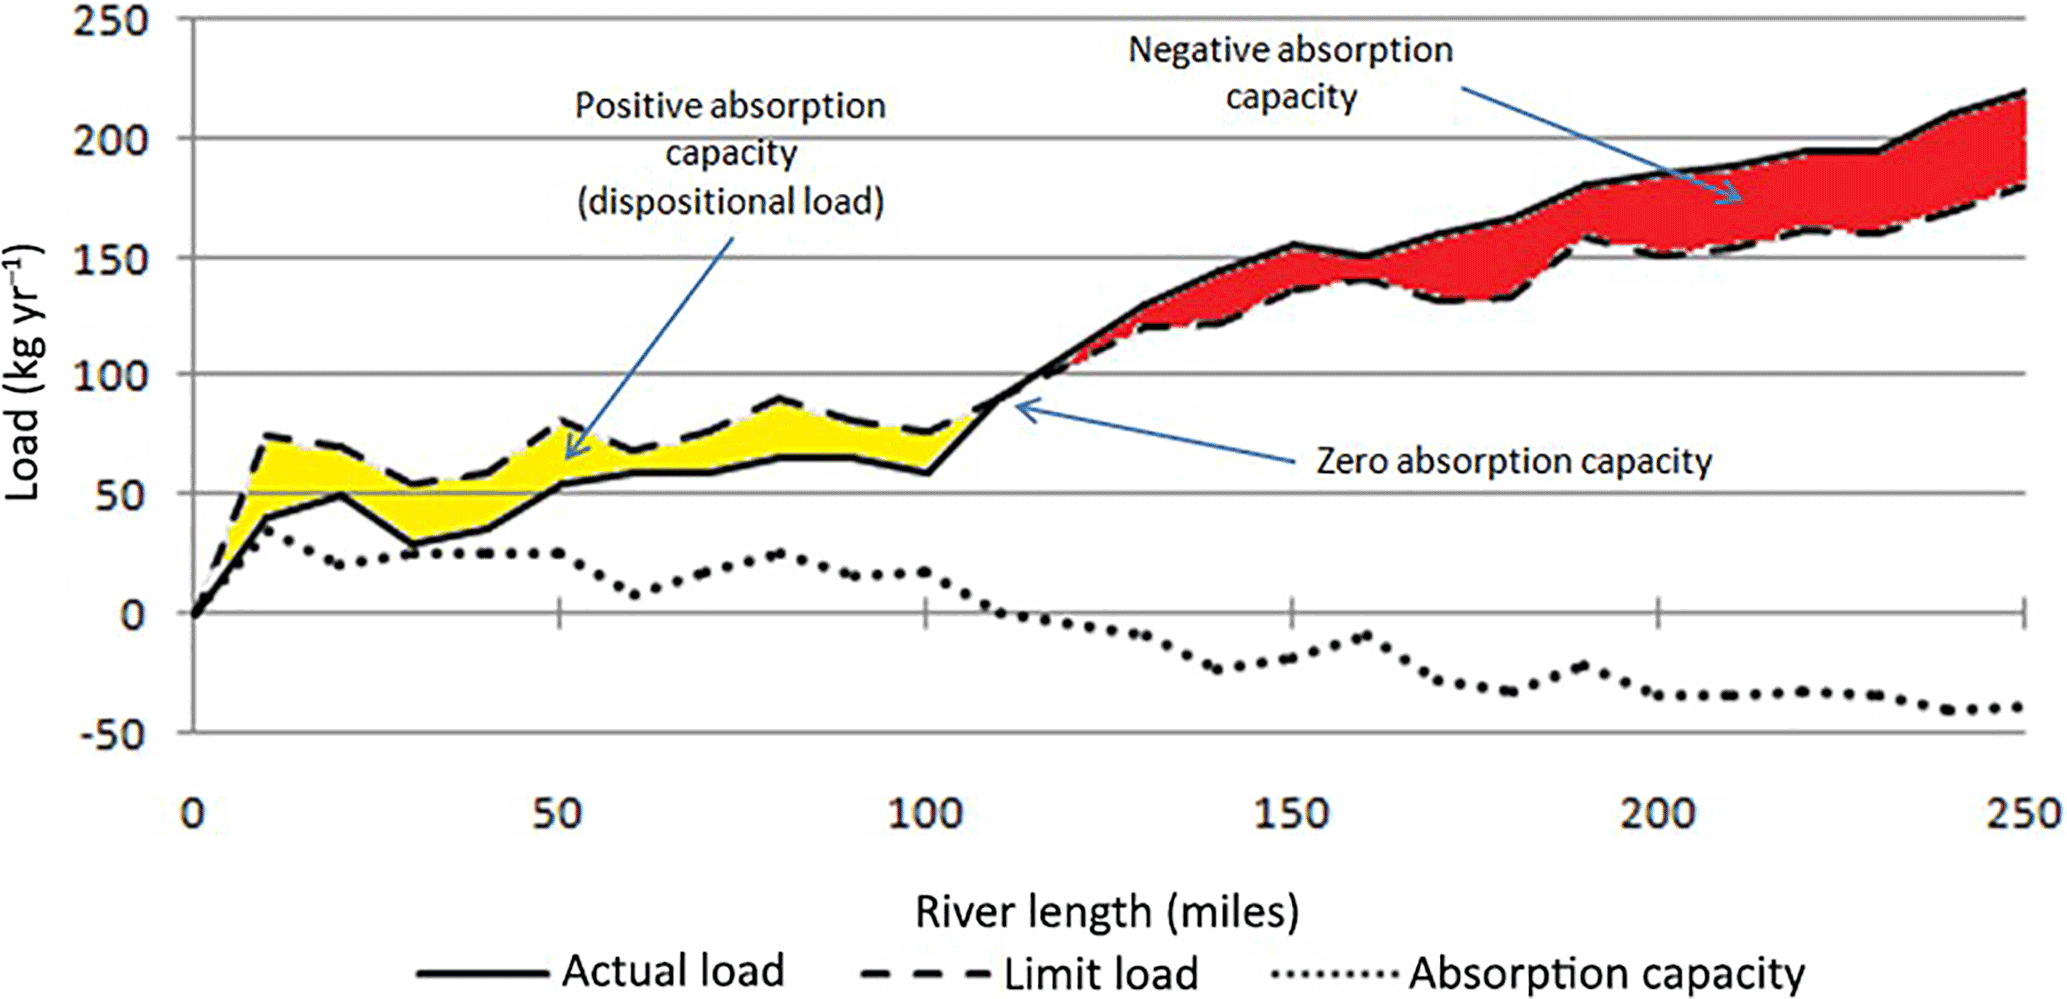
Analysis of the relation between the LL and actual load (AL) of a selected pollutant at a control profile shows that RAC of a river section can have positive values, negative values and, theoretically, values equal to zero. These cases are shown in Fig. 2.
Values of RAC are as follows.
-
Positive – means that AL at the profile is lower than LL of selected pollutant:
Thus, there is a possibility of additional load input into the river section equal to the difference between the AL and LL without causing an exceedance of environmental limits;
-
Equal to zero – means that the AL and LL at the profile are equal:
This is a hypothetical situation in which there is no possibility of the input of any load of pollutant, although there is still no necessity to make radical steps to purify the river water. In practice, the absorption equal to zero is difficult to determine.
-
Negative – means that at the profile the AL is greater than LL of a selected pollutant:
Therefore, there is an exceedance of the limit value for environmental standards for a good water state at the profile and there is an obligation to take action aimed at reducing pollutant loads discharged into the river. If the critical load is not exceeded, in the case of negative absorption capacity, the reduction of pollutant loads should cause a spontaneous return of the ecosystem to its original state, understood as a state before a change caused by anthropopressure.
2.3 Macromodel DNS/SWAT
The appropriate amount of monitoring data covering a sufficiently long period of time is pivotal to the analysis of the state of surface water pollution. When monitoring data are limited, which is a common situation, it becomes essential to use supplemental tools as mathematical models. They provide an opportunity not only for complementing spatial and temporal resolution data, but also allow analysis to be carried out on, inter alia, processes responsible for the self-purification of the river. Utilization of the correctly chosen and adapted mathematical model for the determination absorption capacity enables extensive knowledge about the state of surface water to be obtained and the selected scenarios of action programmes to be simulated to improve water quality on a selected river section.
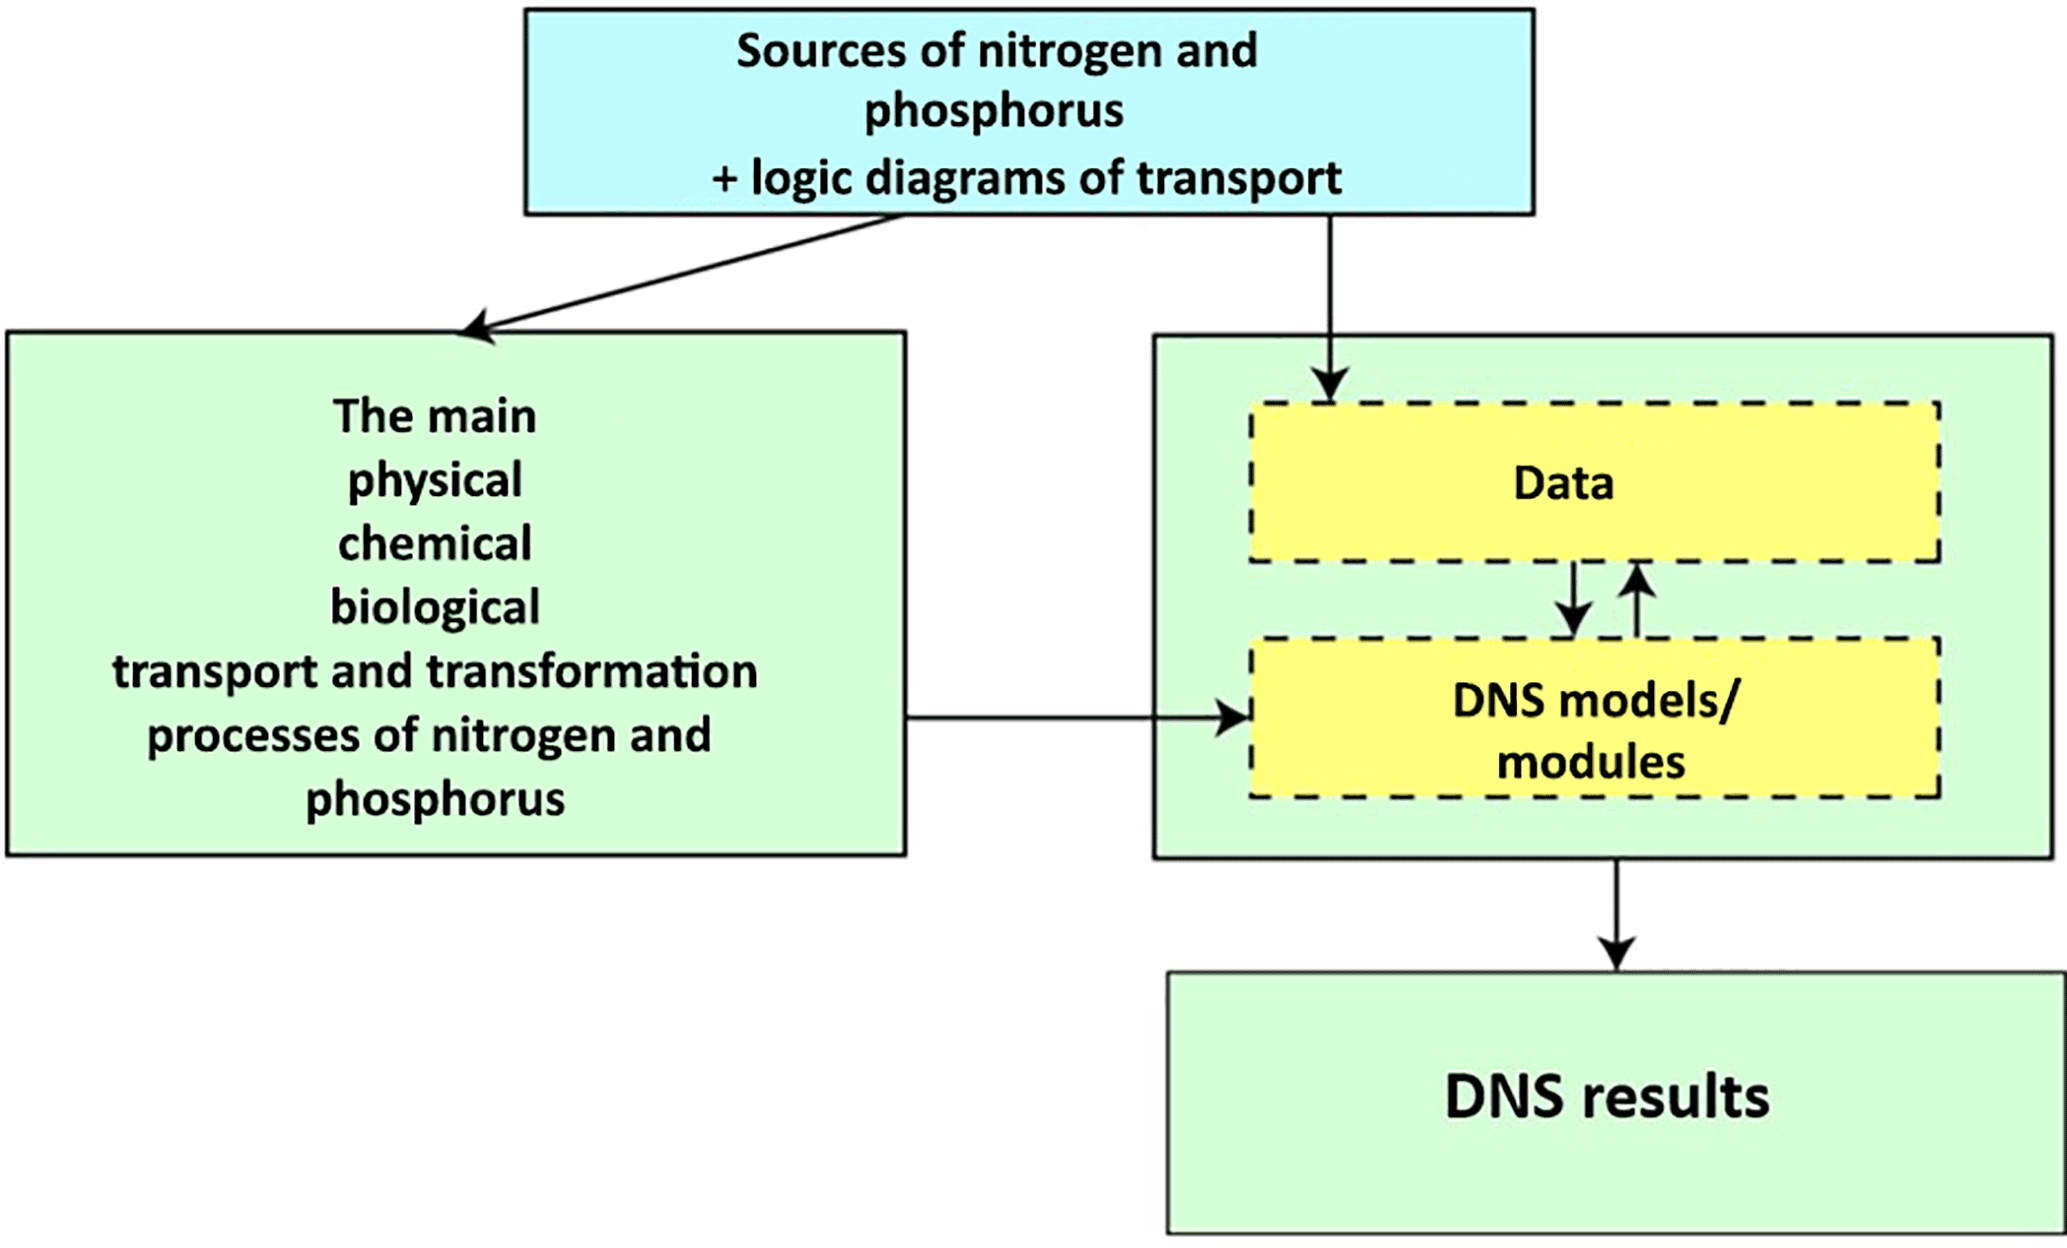
The Macromodel DNS (Discharge–Nutrient–Sea) was designed at The Institute of Meteorology and Water Management – National Research Institute (Poland) for the analysis of processes taking place in a catchment, such as water and matter cycles (Ostojski, 2012). The Macromodel is a unified tool combining existing and verified mathematical models and equations of hydrological transport process units. It allows the simulation of the long-term impact of land use on water quality and the impact of pollutant discharges to surface waters. It is a merger of data processing modules, data replenishment modules, water quantity models and water quality models (Figs. 3 and 4). The Macromodel DNS defines the AL description at a control profile as follows:
LPOINT is the sum of load discharged from point sources, LNON is the sum of load discharged from nonpoint sources, LINF is the sum of load discharged from infiltration, LDEP is the sum of load discharged from atmospheric deposition and AL−1 is the load flowing from upper river profile, R is the section retention.
The values of the individual components of Eq. (9) were obtained by using the Macromodel DNS in conjunction with the SWAT module. The possibility of introducing detailed catchment data allows for modelling data on both point and nonpoint pollutants (LPOINT,LNON), pollutant loads entering the river along with infiltration waters (LINF) and retention (R). Data on atmospheric deposition (LDEP) were obtained from the Norwegian Meteorological Institute, whose mathematical models cover the area of Poland.
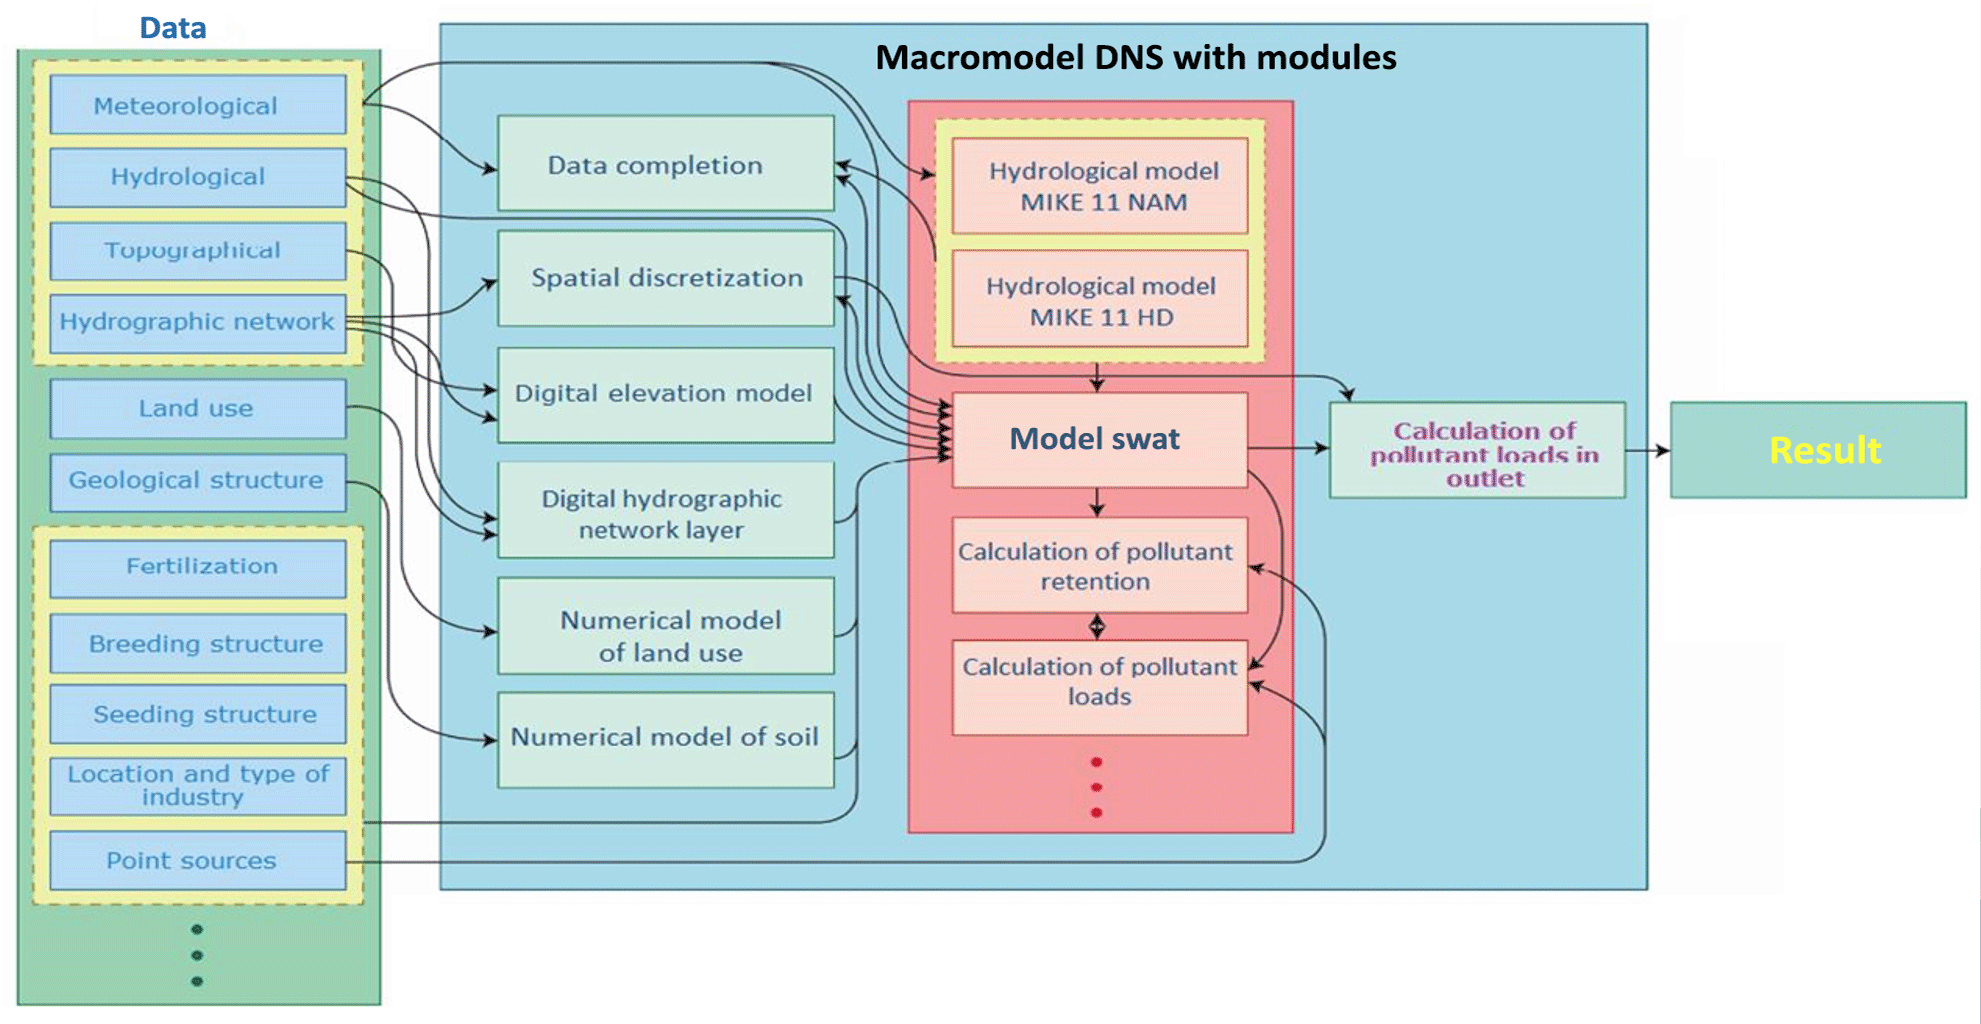
SWAT (Soil and Water Assessment Tool) (Neitsch et al., 2004, 2005) can be one of the modules of the Macromodel DNS. SWAT is a continuous long-term yield model. SWAT is a physically based model where processes associated with water and nutrient cycles are directly modelled by internal algorithms to describe the relationship between input and output variables. Physical processes are simulated within hydrologic response units (HRUs). HRUs are lumped land areas within a sub-basin that are comprised of unique land cover, soil and management combinations. To accurately predict the movement of pesticides, sediment or nutrients, firstly the hydrologic cycle is simulated. The simulation is divided into two major phases – a land phase which controls the amount of water (and nutrients) loading to the main channel, and a routing phase which is the movement of water (and nutrients) through the channel network of a watershed to the outlet (Neitsch et al., 2011). The Macromodel DNS containing the SWAT model as an integral module was called the Macromodel DNS/SWAT (Fig. 4).
With the use of the Macromodel DNS/SWAT, all the elements form a homogenous, numerical catchment model that enables the analysis of different scenarios of catchment exploitation in different meteorological and hydrologic conditions. The Macromodel DNS/SWAT can be used to analyse the loads of nutrients at any selected control point (Gębala et al., 2014; Ostojski, 2012).
2.3.1 Research area
The methodology proposed in the article for calculating absorption capacity of a river has been implemented on the example of a fragment of the catchment of the Warta (the Middle Warta). The Warta is the third longest river in Poland. The selected basin has an area of 6039 km2, which represents approximately 11 % of the entire Warta catchment. The study area was divided into water bodies that are the basic unit of water management in the EU. Numbers were assigned from 1 to 70 to each water body, and water bodies located in the main stream received numbers from 56 to 63. As the beginning of the basin, the Nowa Wies Podgórna profile was selected, and at the end the profile Oborniki was chosen (Fig. 5). The analysed part of the catchment is characterized by a significant amount of area exposed to nitrogen pollutants of an agricultural origin. The area is characterized by a high proportion of nitrate-vulnerable zones (NVZs) – areas particularly vulnerable to nitrogen pollution from agricultural sources (Directive 91/676/EEC). The main soil types on the selected catchment area are light and very light soils. The major sources of pollution are constant and seasonal discharges of domestic, economic and industrial sewage from cities located near the river as well as surface runoff from agricultural areas. In the basin area is the largest metropolitan area of Warta catchment, Poznań, which is the fifth most populous city in Poland and has a very rapidly growing suburban area. Monitoring research which has been conducted for many years on the water state of the Warta indicates that the quality of its waters is strongly differentiated into individual river sections, and pollution flowing into the river can locally affect the process of eutrophication, among other aspects.
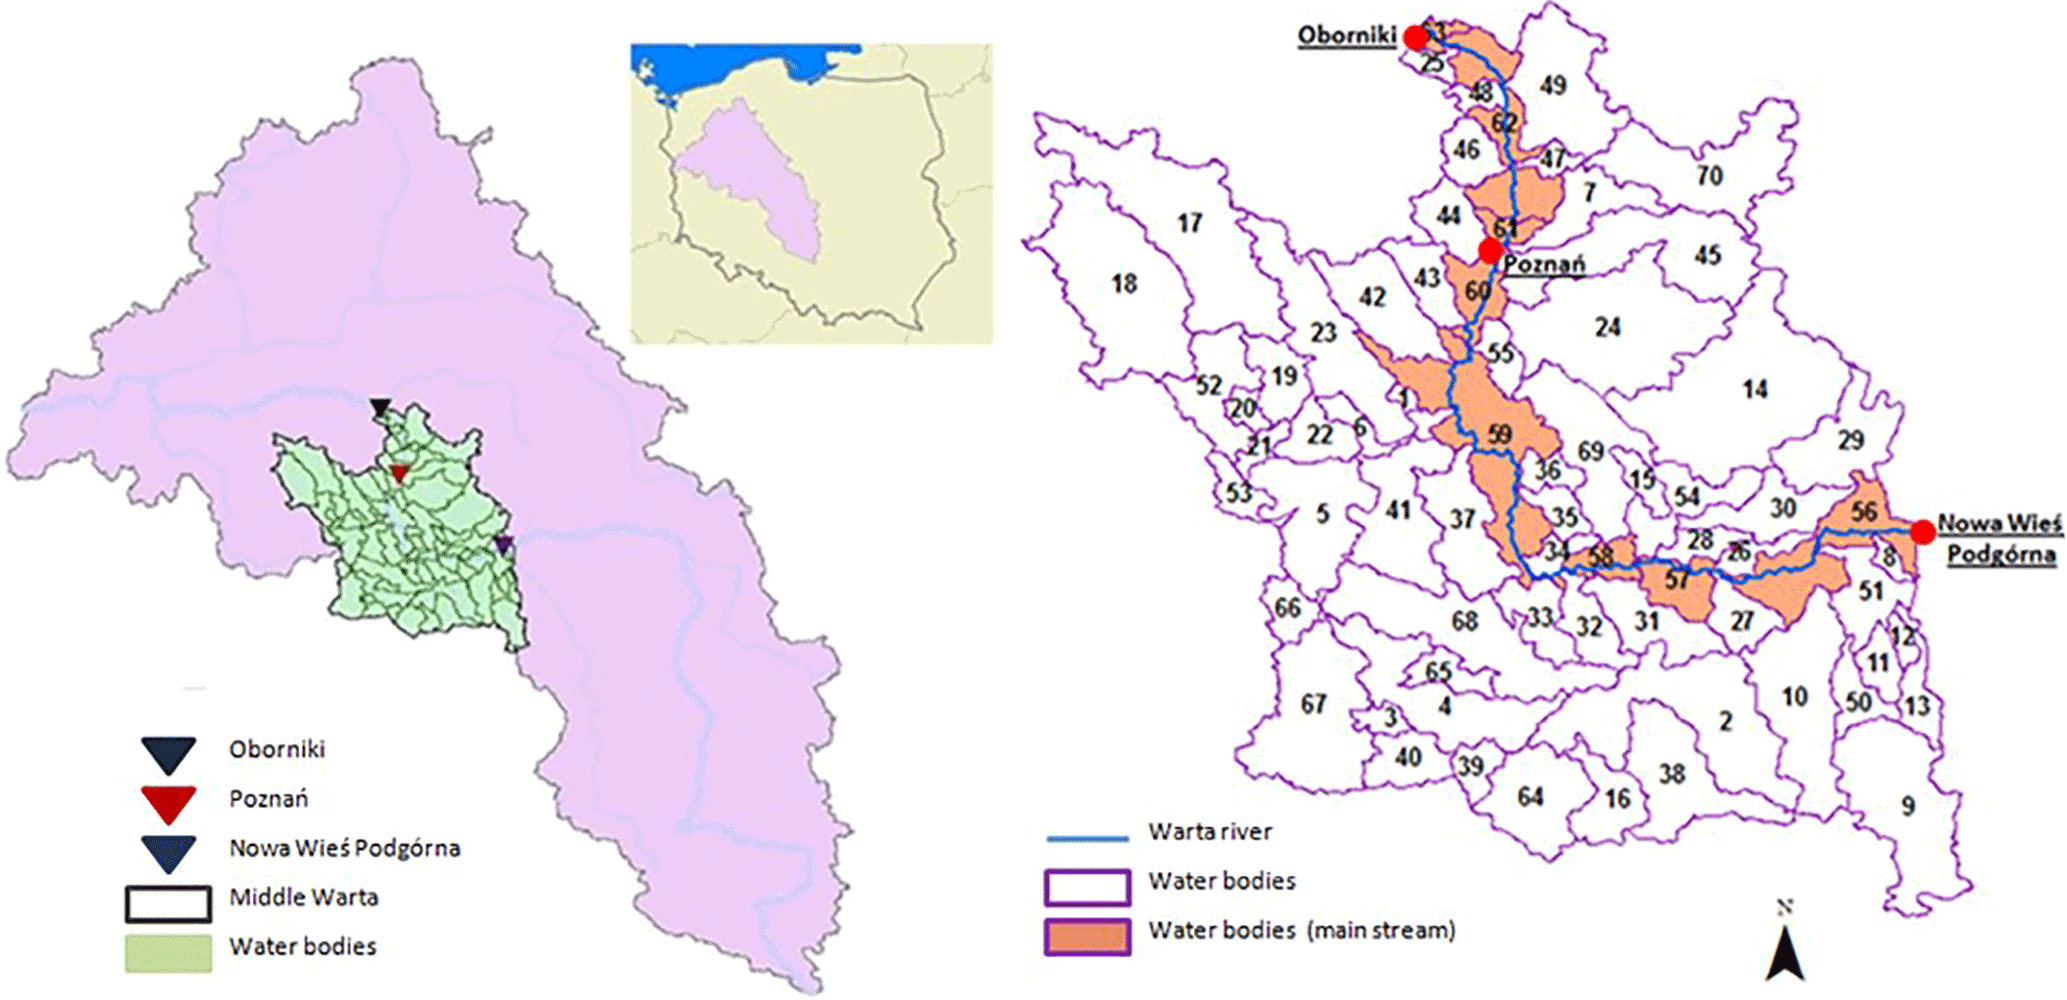
Figure 5Location of catchments in Poland the Middle Warta catchment with an indication of profiles for calibration and verification (Poznań) and validation (Oborniki).
2.3.2 Data
For the pivotal river catchments and for the use of the Macromodel DNS/SWAT, the input data were prepared, namely digital elevation model (DEM), hydrology map, soil map, land use map, data concerning a wastewater treatment plant, the daily meteorological and hydrological data, and the amount of fertilizers. The gathered data were developed in the form of a database required by the model (Abbaspour, 2008; Srinivasan, 2006, 2011).
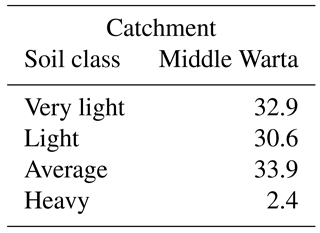
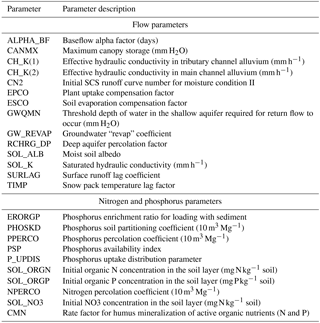
The DEM remains the national, central geodesic and cartographic resource and is created on the basis of aerial photographs within a flat and rectangular system of coefficients. The Map of Hydrographical Divisions of Poland (MPHP, 2009) is the basis for the information system of water management. The map containing the details of river networks and water bodies within the boundaries of the analysed catchments on a scale of 1:50 000 was used. Data concerning wastewater treatment plants located in the area of the analysed catchments were obtained from the National Water Management Authority in Poland. The data contained detailed information, including the geographic coordinates of a given wastewater treatment plant, the amount of public wastewater treated within a year in thousands of cubic metres per year, total suspended solids (mg L−1), total nitrogen (mg L−1) and total phosphorus (mg L−1). Meteorological input data had a daily time step and included solar radiation, wind speed, precipitation, relative moisture, and maximum and minimum temperatures. Soil maps on a scale of 1:100 000 with the soil types very light, light, average and heavy (Table 1) were obtained from the Institute of Soil Science and Plant Cultivation National Research Institute (IUNG, 2009).
Table 1Soil class with the percentage of participation in the catchment area (source: IUNG, 2009).
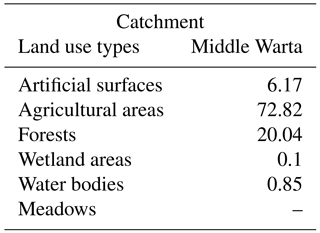
Land use maps of the Middle Warta catchment were created based on the CORINE Land Cover information system (Bossard, 2000; CORINE, 2009), which divides land use into five classes, each attributed to the relevant abbreviations that can be accepted and read by the model (Table 2).
Table 2Land use types with the percentage of participation in the catchment area (source: CORINE, 2009).
Input data used to calculate phosphorus loads from manure and mineral fertilizers were obtained from the Polish Local Database (BDL) and included information regarding livestock and the surface area of arable lands in hectares at the provincial level. The average dose of nitrate fertilizers was 158.5 kg N ha−1 and phosphate fertilizers 47.08 kg P ha−1. The Middle Warta River catchment has been divided into 70 sub-basins in line with the boundaries of water bodies, which are the basic unit of water management in Poland, according to Directive 2000/60/EC.
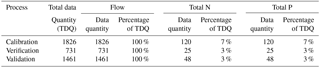
Table 3The amount of data available from the State Environmental Monitoring and IMGW for selected catchments. TDQ: total data quantity.
2.3.3 Sensitivity analysis and calibration
Sensitivity analysis demonstrates the impact that change to an individual input parameter has on the model response and can be performed using a number of different methods. The method in the ArcSWAT Interface combines the Latin hypercube (LH) and one-factor-at-a-time (OFAT) sampling. During sensitivity analysis, the SWAT runs times, where p is the number of parameters being evaluated and m is the number of LH loops. For each loop, a set of parameter values is selected such that a unique area of the parameter space is sampled. That set of parameter values is used to run a baseline simulation for that unique area. Then, using OAT sampling, a parameter is randomly selected, and its value is changed from the previous simulation by a user-defined percentage. SWAT is run on the new parameter set, and then a different parameter is randomly selected and varied. After all the parameters have been varied, the LH algorithm locates a new sampling area by changing all the parameters.
In further work, sensitivity analysis of the parameters in the model was carried out. The main purpose of applying sensitivity analysis is to define a set of parameters with the highest sensitivity, meaning those which have the greatest impact on the parameters affecting flow and phosphorus load in the analysed profile of the river. The parameters were developed for ranges typical for Polish conditions.
After conducting the sensitivity analysis, the next stage of study was the model calibration. Model calibration was performed through an iterative value selection process of a single parameter of the model, in order to achieve the greatest possible modelling accuracy in regard to observational data. The estimation of model parameters, in the assumed conditions, in order to achieve the highest convergence of the simulation and observation results, was carried out with the OAT method (one-at-a-time), a repeated iterative loop. The values of parameters received during the sensitivity analysis (Table 4) were successively changed in ranges with a high probability of occurrence in a given area. These values were based on expertise gained from analysis and consulting in the field of hydrology as well as the sources and dynamics of phosphorus change in surface waters in the area of the pilot catchment. It was recognized that such a calibration method enables the fitting of the appropriate model to real conditions, especially for general phosphorus, for which automatic calibration is problematic due to the small amount of observational data. To evaluate model matching with observation in subsequent iterations of the loop, three statistical measures, R2 (coefficient of determination), percent bias (PBIAS) and the Nash–Sutcliffe efficiency (NSE), were used (Moriasi and Arnold, 2007; Ostojski et al., 2016).
The calibration of the flow, total nitrogen and total phosphorus loads was carried out for the data derived from multi-year analyses from 1 January 2003 to 31 December 2007, with the daily time step for Poznań – Most Rocha measuring point, located at 241.76 km (150.22 miles). The verification of the models was conducted from 1 January 2008 to 31 December 2009 with the daily time step for Poznań – Most Rocha measuring point. As for validation, this was conducted from 1 January 2003 to 31 December 2006 with a daily time step for the Oborniki measuring point located at 205.2 km (127.5 miles). In the mentioned periods, the full range of daily data for flow was available, as was 3 to 7 % of data for both total nitrogen loads and total phosphorus loads (Table 3). The flow rate data were derived from the Hydrology System conducted by the IMGW. Total nitrogen and total phosphorus data were from the SEM database.
Table 4The most sensitive parameters obtained from the sensitivity analysis in SWAT model for the analysed catchments (source: Gębala, 2015; Wilk, 2015).
The monitoring data we used to calibrate, validate and validate the mathematical model come from the years 2003–2009. It was decided that calibration and validation of the mathematical model for this period would be made, as IMGW was conducting its own parallel SEM monitoring of the Middle Warta then. Therefore, for this period of time, we have the largest possible database to better match modelling results to observations (especially for general nitrogen). The monitoring measures currently underway have confirmed that the values of general nitrogen concentrations in the Middle Warta basin remain at a similar level. In a revised version of the article, we will describe the data so that it is clear to every reader why this time period has been used. For each of these processes, robust statistics were used to calculate the winsorized robust statistical measures (Ostojski et al., 2016).
For the pilot catchment model Middle Warta and Rega (within the functionality of SWAT, which is in this case a DNS Macromodel module), sensitivity analysis of parameters associated with the flow, total nitrogen and total phosphorus was conducted according to the description in Sect. 3.3.3. The results of this sensitivity analysis are presented in Table 4. There are 14 parameters presented which are most sensitive and associated with the flow in the control point. For total nitrogen loads, from a range of parameters that may be manipulated during the calibration of the model, four parameters obtained the highest sensitivity and seven parameters for total phosphorus loads. The parameters selected during the sensitivity analysis were used during the model calibration.
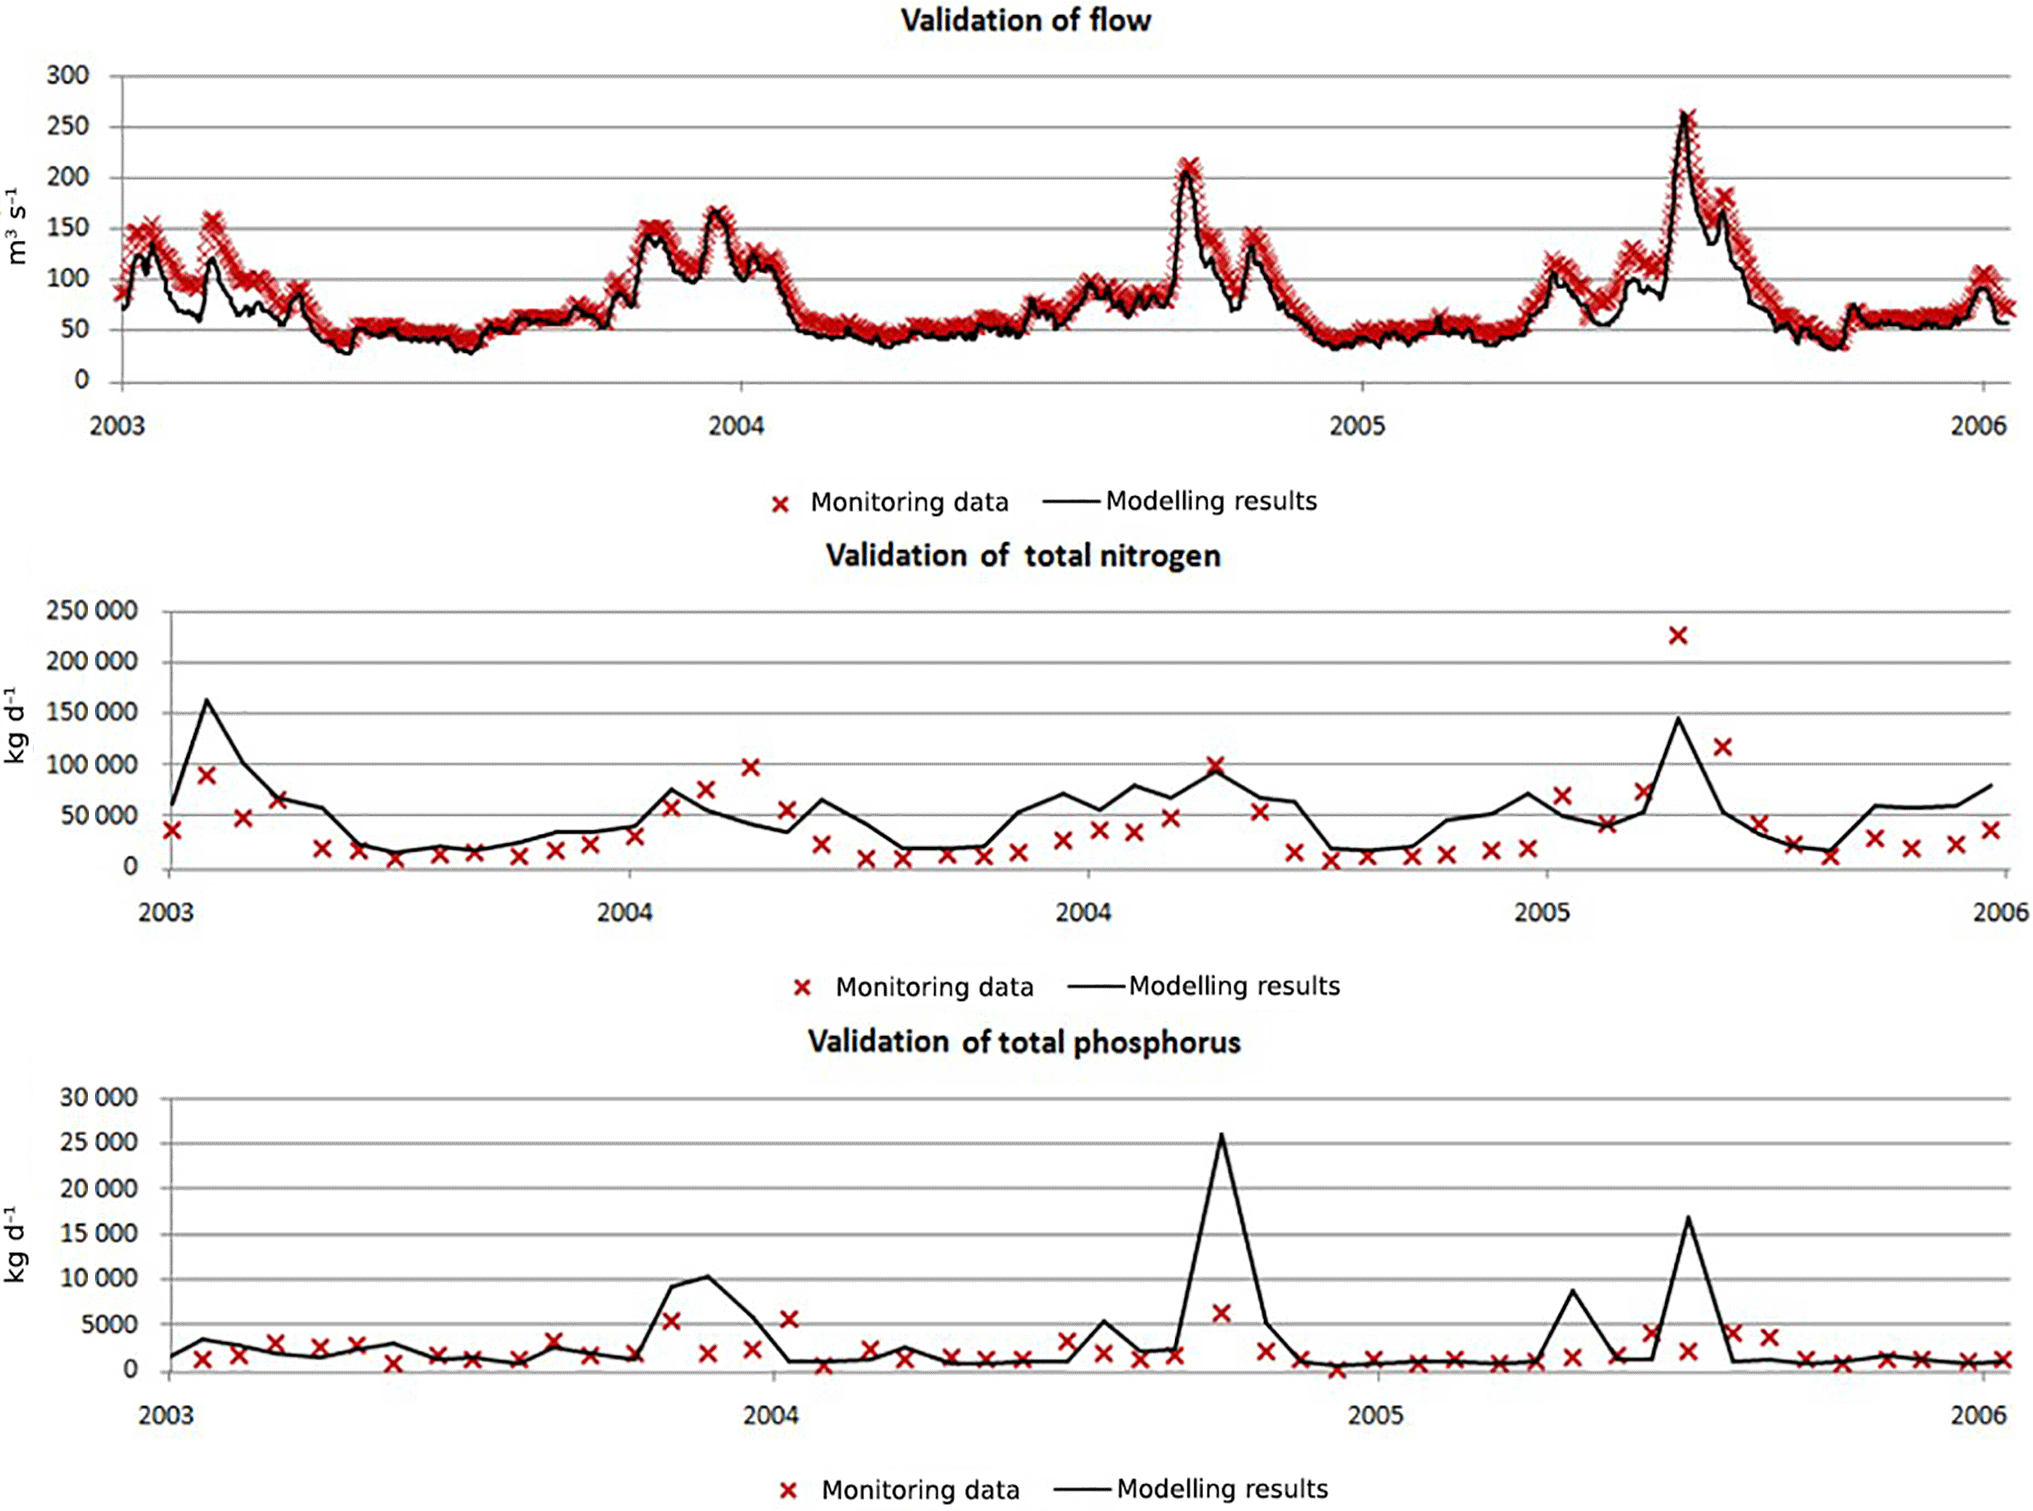
Charts showing the matching of modelling results and monitoring results for the period of calibration and verification are shown in Fig. 6, with their validation in Fig. 7.

Figure 6Matching of modelling results and monitoring results for the period of calibration and verification.
To describe the results of the calibration, verification and validation, three statistical measures were used: the coefficient of determination (R2), the PBIAS and NSE (Alansi et al., 2009; Bosch et al., 2011; Chu et al., 2004; Pai et al., 2011; Rathjens and Oppelt, 2012). The results are presented in Table 5. An assessment of the modelling conducted using robust statistics and winsorized L estimators were used (Ostojski et al., 2016).
Table 5The results of the calibration, verification and validation for flow, total nitrogen and total phosphorus.
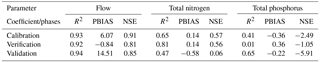
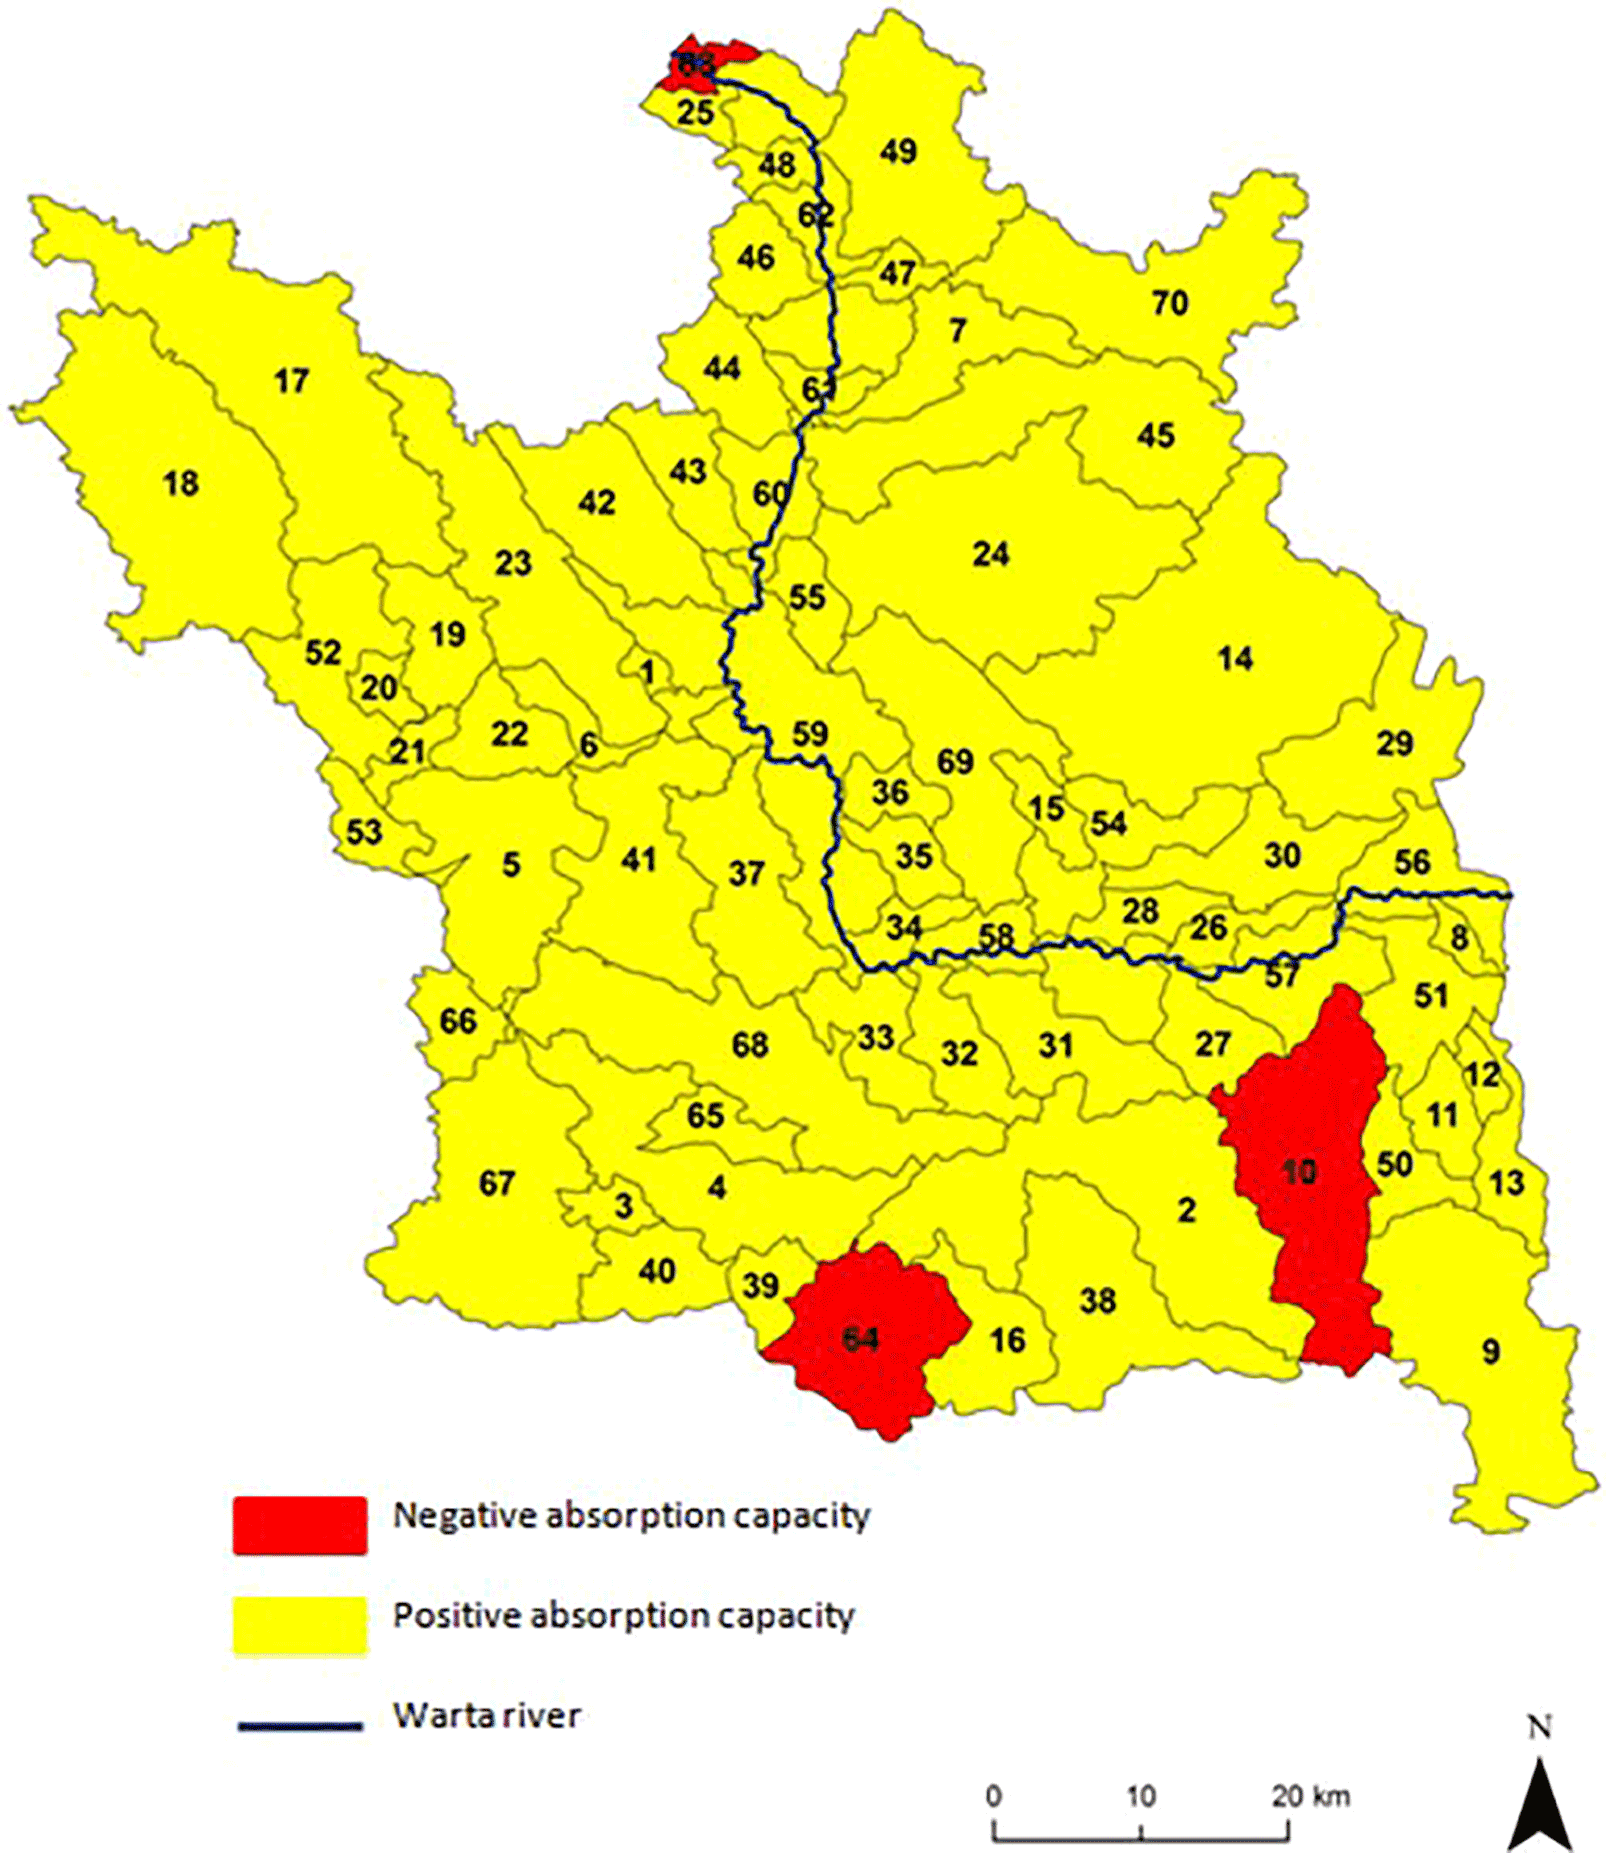
Figure 8Actual absorption capacity for each water body of the Middle Warta for total nitrogen based on characteristic flow SNQ.
In the case of calibration, verification and validation of flow, all statistical measures obtained “very good” or “good” (Alansi et al., 2009; Chiang et al., 2012; Krause, 2005; Moriasi et al., 2007) results of model fit. For calibration and verification of total nitrogen, “very good” or “good” fit results of the model were obtained. Only in the case of the validation for the coefficient of determination R2 and the NSE coefficient were the achieved results “satisfactory”. As expected, the biggest difficulty during calibration, verification and validation was with total phosphorus loads – this was due to, among other reasons, the high volatility of daily and seasonal concentrations of this parameter in the environment and the limited amount of monitoring data. The coefficients of determination R2 at the stage of calibration and verification of the received values were “satisfactory” and “unsatisfactory” respectively. PBIAS in all cases obtained values classifying it as “very good”, as opposed to the NSE values, which were in all cases “unsatisfactory”. Due to the lack of methodology enabling a joint assessment of these three coefficients, R2 was prioritized and the results of total phosphorous calibration were evaluated as satisfactory.
3.1 Absorption capacity results
After the calibration, verification and validation processes of the SWAT module, daily loads of nitrogen and total phosphorus for the selected period of time were obtained. This database has enabled the calculation of the precise absorption capacity at closing profiles of all 70 water bodies located in the analysed basin. Absorption capacity was calculated for total nitrogen and total phosphorus where, for the characteristic flow, average low-flow QSNQ was used.
3.1.1 Total nitrogen
Absorption capacity values of total nitrogen for individual water bodies in the vast majority (67 water bodies) obtained positive values (Fig. 8). The highest positive values of absorption capacity were observed at closing profiles of the individual water bodies located in the main stream of the Middle Warta sub-catchments 56 to 60 (values of up to 3500 t yr−1). A clear drop in absorption capacity on the main stream was noted from the closing profile of 61 water bodies where absorption reached 880 t yr−1, that is, on water bodies located directly behind the city of Poznań. The lowest values, that are still positive, of absorption capacity were at the closing profiles of small streams characterized by low flows.
Negative absorption capacity values for total nitrogen only occurred at three water bodies (10, 63 and 64). Two of them (10 and 64) are small reaches with low flows which should limit the amount of total nitrogen by about 55 and 2 t yr−1, respectively. Basin 63 is the last section of the main stream of the analysed catchment where absorption capacity obtained the value of 880 t yr−1.
The results of absorption capacity of total nitrogen load based on a characteristic flow of QSNQ are shown in Fig. 8. A summary of the results for all analysed closing profiles of water bodies are presented in Table 6.
Table 6Total nitrogen absorption capacity for each profile of Middle Warta water bodies based on characteristic flow SNQ. The negative values are in boldface.
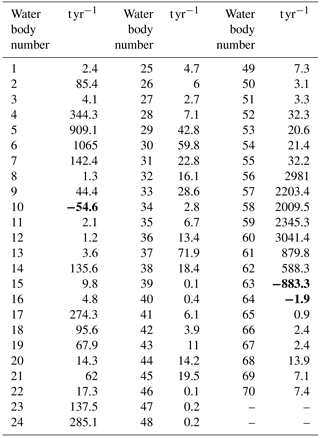
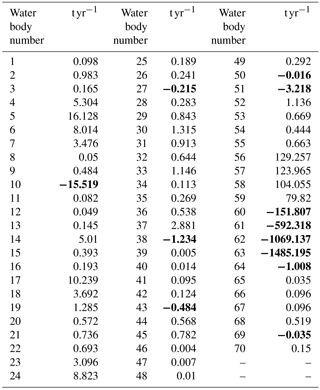
Table 7Total phosphorous absorption capacity for each profile of Middle Warta water bodies based on characteristic flow SNQ. The negative values are in boldface.
3.1.2 Total phosphorus
The values of absorption capacity for most closing profiles of water bodies (58) for total phosphorus were positive, as shown in Fig. 9. The highest values were obtained for water bodies located between Nowa Wieś Podgórna and the city of Poznań – these were up to 130 t yr−1. There is a clearly visible negative impact of the city of Poznań on the absorption capacity of profiles located on the main stream below the agglomeration (60, 61, 62, 63). There, negative values of absorption capacity were up to −1500 t yr−1. Other water bodies that obtained negative values of absorption are numbers 10, 27, 38, 43, 64, 69, 50 and 51. Most of these are located in the southern part of the analysed catchment area. Graphic results of the absorption capacity of total phosphorus load, based on a characteristic flow of QSNQ, are shown in Fig. 9. A summary of the results for all analysed closing profiles of water bodies are presented in Table 7.
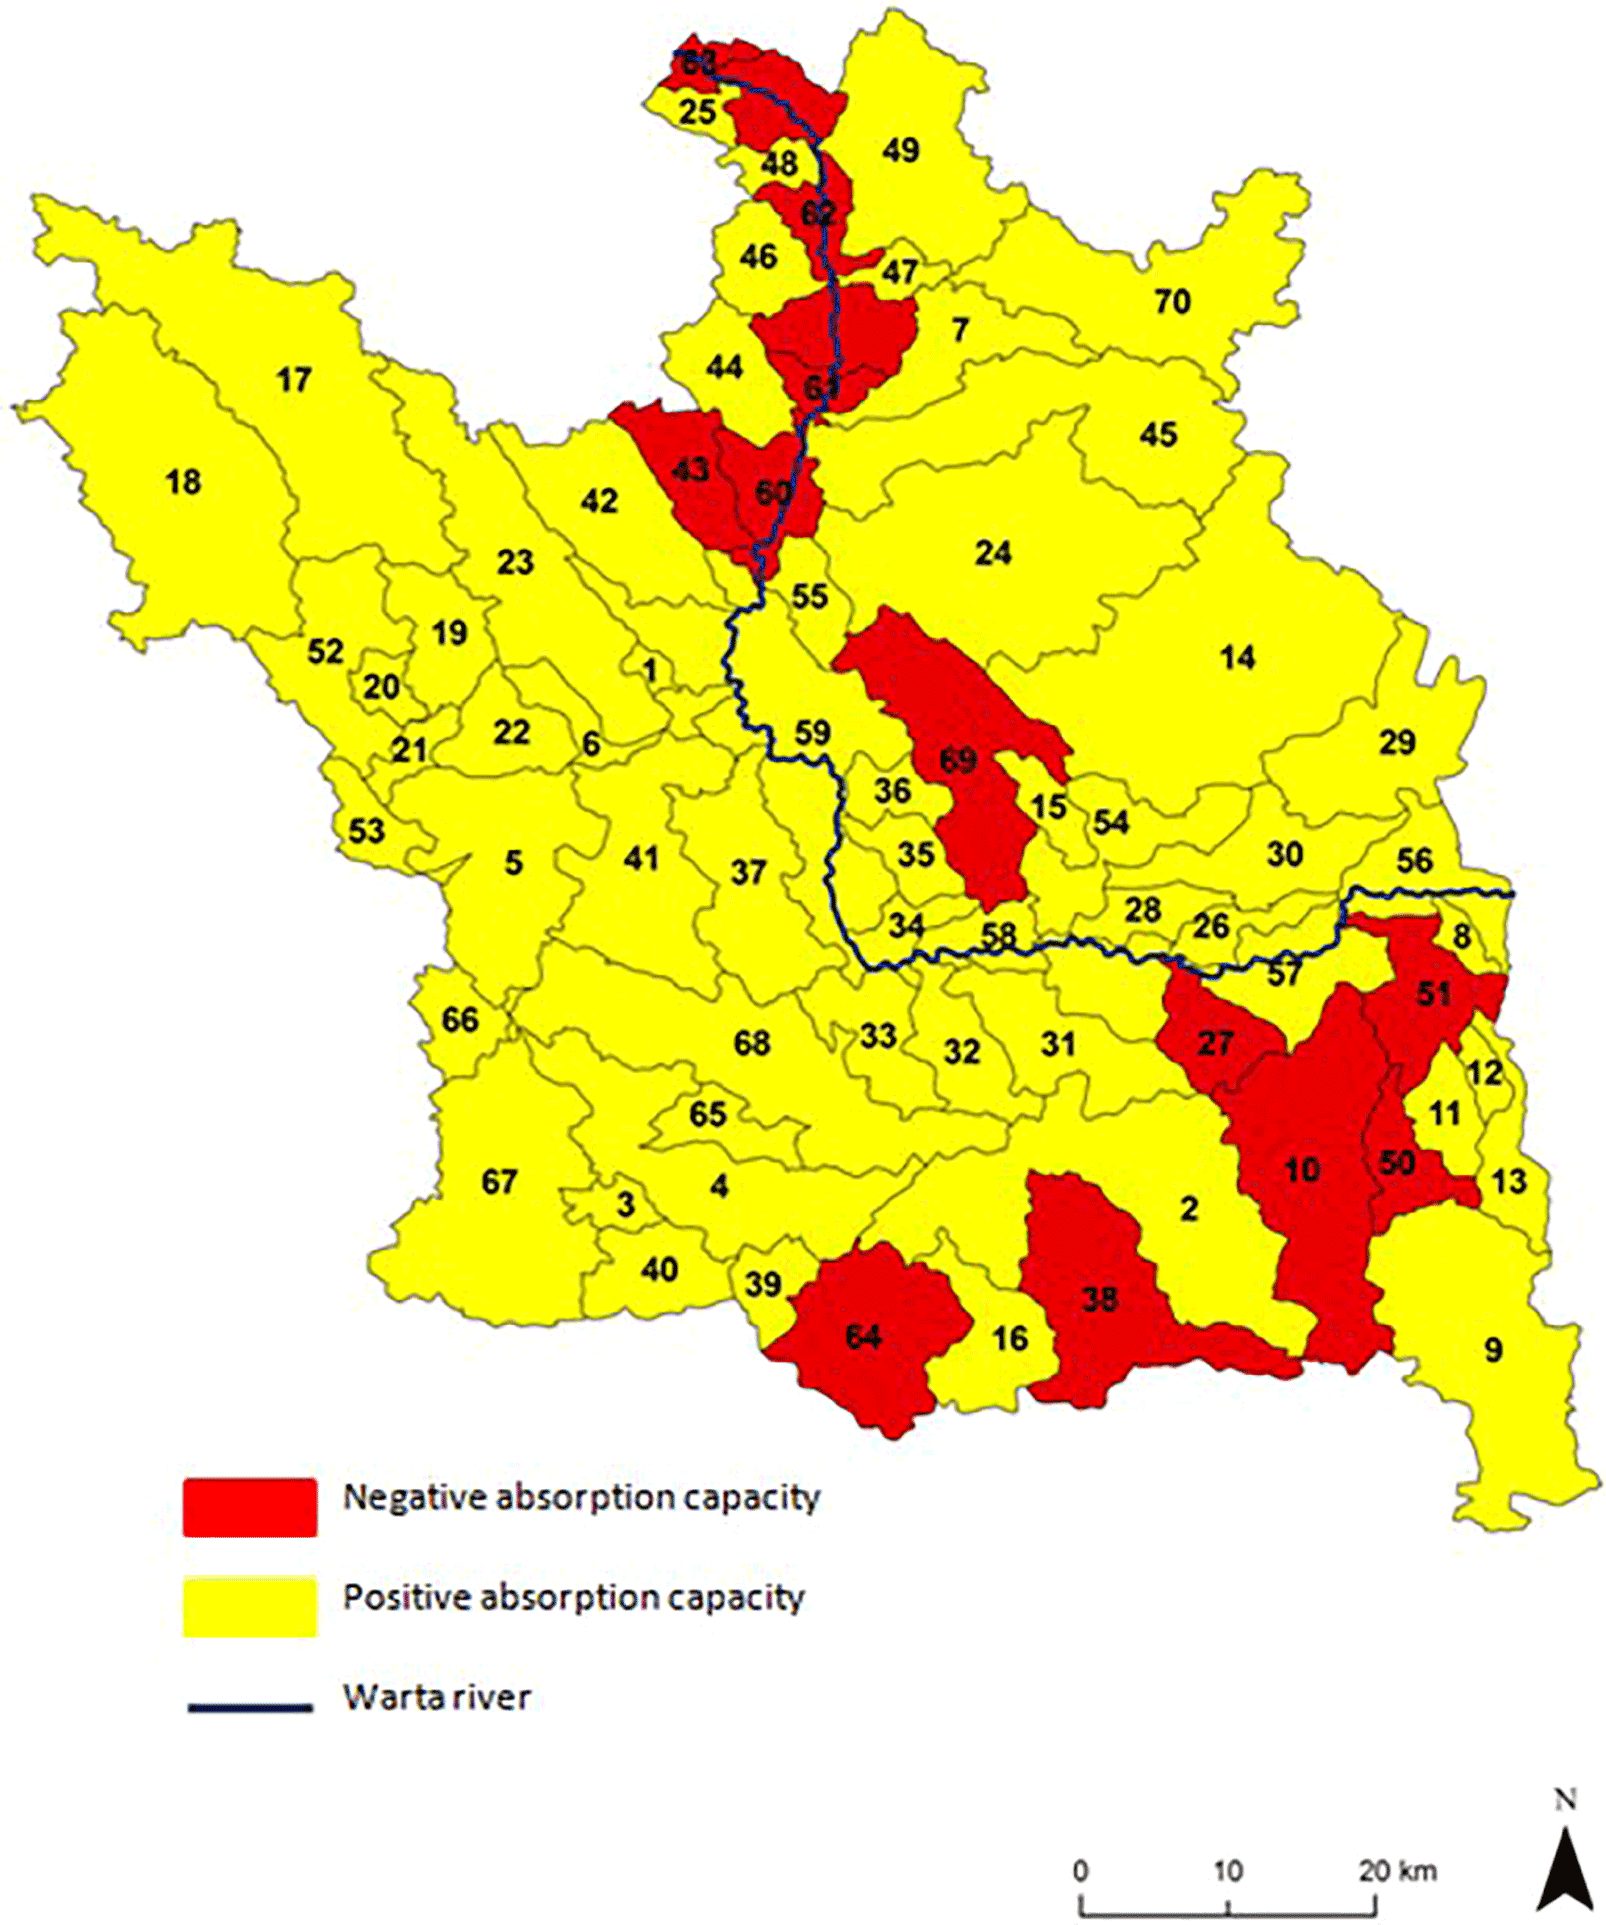
Figure 9Actual absorption capacity for each water body of the Middle Warta for total phosphorous based on characteristic flow SNQ.
The Macromodel DNS/SWAT, developed at the Institute of Meteorology and Water Management (Poland), is an effective tool for the determination of river absorption capacity. The utilization of mathematical modelling for the calculation of absorption capacity allowed the precise determination of total nitrogen and total phosphorous overloads at each river profile, according to limit values, as well as the determination of the disposal capacity of the reach when the absorption capacity has positive values.
Research results show, simply but precisely, the water state at the estuarine profiles of selected basins. The method assumes the performance of the analysis at closing profiles of water bodies. For the analysed pilot catchment, 95 % of estuarine profiles of water bodies have a positive absorption capacity for the load of total nitrogen and 80 % for a load of total phosphorus, which means that in these areas the ecosystem is able to adapt to the “elimination” of these pollutants by a series of processes generally referred to as the self-purification of the river. In such cases, it is assumed that after the removal of pollution sources, an ecosystem returns to a state of equilibrium, or close to it (Fig. 1). The highest values of absorption capacity for both total nitrogen and total phosphorus were observed at profiles of water bodies located within the main stream, to the north of the city of Poznań (water bodies 56 to 59). This area is characterized by low population density and low industrialization, although there are a large number of large-scale farms. It should also be taken into account that the main reach of the Warta River is characterized by a high flow (average 195 m3 s−1), which has a direct impact on the dilution of contaminants in the water mass. It may thus be concluded that major streams characterized by low time variability of flow are more resistant to contamination, and higher values of absorption can be expected there. Negative absorption capacity for total nitrogen was noted for three water bodies (10, 63, 64), which means that limit load was exceeded there. Two profiles belong to two water bodies located in the southern part of the basin (10, 64). These basins are characterized by very low flows (they sometimes dry up in the summer) and industrial plants, and numerous illegal sewage discharges are located in their territory. A small reservoir characterized by a high concentration of nitrates is also located in water body 10. The third case of negative absorption capacity for total nitrogen is the last control profile of the main stream – estuarine profile 63 of the pilot Middle Warta catchment. There is a problem here related to the rapid expansion of the city of Oborniki and the insufficient development of its sewage system; there is also intensive agriculture in this area. A large number of leaking septic tanks are responsible for a significant load of nutrients in surface waters in the area.
For total phosphorous, 12 water bodies were obtained with negative values of absorption capacity (10, 27, 38, 43, 50, 51, 60, 61, 62, 63, 64, 69). Half of them are located in the southern part of the study area and are water bodies of small streams characterized by low flows; their territories feature large-scale farms, industrial plants, sewage treatment plants and, as has already been mentioned, numerous illegal discharges of wastewater (water bodies numbers 10, 27, 38, 50, 51, 64). Negative values of absorption capacity for total phosphorus were also noted at closing profiles of water bodies on the main reach located south of the city of Poznań (water bodies numbers 60, 61, 62, 63), which proves that high loads of pollutants are discharged from the area of this agglomeration to the waters of the Warta. The results of the proposed method coincide with previous field research conducted by the Voivodeship Inspectorate for Environmental Protection.
Data on the analysed Middle Warta catchment obtained with the use of the calibrated, verified and validated Macromodel DNS/SWAT were used to calculate the absorption capacity of the river. The results of general phosphorus calibration using the Macromodel DNS/SWAT are worse than for general nitrogen. This is due to the high daily and seasonal volatility of this element in river waters and the relatively small amount of monitoring data needed to calibrate, verify and validate the model. In spite of this, results of the statistical measures identified as “unacceptable” were obtained mainly for the NSEs, so the authors decided to use the obtained model data for general phosphorus. The obtained RAC results for general phosphorus largely coincide with the actual state occurring in the basin; the water bodies that have been negatively affected by the RAC parameter are located in, among other areas, the main watercourse south of the city of Poznań, which has a negative impact on the waters of the Warta. The remaining water bodies, which had negative RAC values for total phosphorus, are small watercourses in the southern part of the analysed basin, characterized by low flow rates and the location of sewage treatment sites and other points of wastewater discharges. Discussion of the results in the article will be extended with information on this subject. The use of mathematical modelling was intended to simulate daily loads of pollutants at any selected river profile and then to classify the sources of pollution occurring in the basin. The absorption capacity determined on this basis for individual water bodies enables detailed knowledge of the condition of the aquatic environment and the possibility of its adaptation to pollution to be obtained. This is key information for assessing whether the intended water management has a significant impact on the state of a water body. The obtained information concerns the location of polluted areas as well as areas not currently at risk of pollution and where reserves of absorption capacity occurred; this is important during the development of management plans for water in basins, as well as in other contexts.
The article presents the possible response of the river ecosystem to the pollutant load conveyed to it (Fig. 1). In addition to the three zones marked I, II and III, there is one more area of uncertainty. A river's width defines the difference between CL and LL, but only the LL value is known in this case. As previously described, it is not possible to determine the CL value beyond which it will no longer return to good water status. The actual volume of CL loads is influenced by a number of processes occurring in surface waters; these vary with the intensity of the river flow and the seasons. It is not known how wide the zone, defined as the area of uncertainty, is. Knowledge of the existence of the area of uncertainty and CL is important in various contexts, including for governmental authorities dealing with the definition of LL which should be designed to guarantee the protection of the aquatic environment.
The knowledge of ANL is important information for the proper determination of pollutant loads in rivers. Much of the biogenic compounds in surface waters are found there as a result of human activity, but nutrients are also leached from the soil under natural conditions. Estimating ANL is difficult because in Europe there are no longer virtually any anthropogenic drainage basins that could become a benchmark for determining ANL. The Macromodel DNS/SWAT can be used to help create scenarios for the use of catchments. This allows you to “remove” the anthropopressure from the analysed basin and estimate the amount of naturally occurring pollutants. This will be the subject of further research.
In this study, river absorption capacity was calculated for 70 estuarine profiles of individual water bodies for the pilot catchment. This enabled the identification of those water bodies which need urgent action aimed at reducing the amount of nutrients entering the surface water from point and nonpoint sources. However, there were areas identified where acceptable limits of pollution are not exceeded and, moreover, it was possible to accurately determine the pollutant load, which, if necessary, can even lead to the river not changing its class of quality state. In both cases exploitation of the Macromodel DNS/SWAT does not have to be limited to only determining the amount of pollutant loads but can also allow the assessment of the impact of planned activities on the catchment. In the case of the described studies a division of the basin into water bodies was used, but if necessary it is possible to split pilot catchment into any selected basin areas.
During planning of the research described in the paper, similar methods used in other regions of the world were analysed. Primarily, the TMDL ratio, described in Sect. 1, were analysed. However, this parameter is based only on the identification of pollution sources in the catchment without the utilization of limit loads. In Poland, limit loads are placed in acts of national law. As well as this, developing TMDLs for nutrients is also difficult because nitrogen and phosphorus can come from any number of sources – e.g. a significant amount of nitrogen can come from agricultural or atmospheric sources. Therefore, the proposed method of determining the absorption capacity is especially suitable for nutrients due to the fact that it is based largely on the Macromodel DNS/SWAT adapted to the modelling of nutrients, and this refers to the load limit of pollutants for a specific class of water quality, as described in this article. Both the parameter TMDL and river absorption capacity are parameters related to the determination of the assimilative capacity of the river; however, the calculation of these parameters is based on different assumptions.
For both TMDL and absorption capacity one of the most important elements for calculations is the proper selection of characteristic flow. If the absorption capacity of the river is a parameter on the basis of which decisions of water quality improvement could be made, the choice of characteristic flow becomes crucial. Depending on the country, different characteristic flows are used for environmental calculations. More and more often in publications (Dyson et al., 2003; European Commission, 2015) the question is being raised concerning the use of environmental flows (taking into account the meaning of medium and high flows in maintaining a good state of river ecosystems). However, the determination of environmental flows requires field and computation research of hydraulic and ecological characteristics. At the current stage of knowledge and research related to Polish catchments, this type of analysis for all estuarine profiles of water bodies is impossible to implement. This is one of the reasons why in Poland, similarly to in the United States, commonly used characteristic flows are those emphasizing only low flows (SNQ, 7Q10). The 7Q10 parameter (the lowest flow of a 7-day period for a decade) statistically has a predisposition for often achieving zero values; this is a clear disadvantage of using 7Q10 in environmental analysis. It also requires a 10-year measurement series. For the purposes of research conducted on the possibility of using the absorption capacity as a parameter to control the quality of water in the catchment, the SNQ flow was chosen as adequate. The proposed designation of absorption capacity includes water quality standards in accordance with the law acts, which also recommend the use of SNQs to calculate the environmental calculation. In addition, for basins with a negative absorption, the use of flow lower than SNQ results in lowering the load that should be removed from the river in order to achieve environmental standards. However, the use of either SNQ or 7Q10 is a hydrological approach characterized by the simplicity of calculations and the possibility of its utilization at uncontrolled reaches due to the revised method of handling this type of statistic between the profiles. It is assumed that, in the case of research described in the paper, hydrological conditions reflect biological needs.
-
To assess the quality of surface water, it is useful to use the concept of a river's absorption capacity. This is understood as the maximum load of a pollutant which can still enter the river without exceeding the limit load and, consequently, without changing its quality class; or, when the load limit is exceeded, this is the load that must be removed from the water in order meet environmental standards. Knowledge of the river absorption capacity enables the planning of actions that prevent the degradation of water quality in the river and, consequently, damage to aquatic and water-dependent ecosystems that occurs due to anthropogenic pressure.
-
Calculations of absorption capacity of a river segment are based on pollutant loads from the nearest profiles; however, it is not equal to a load introduced directly into the surface water on that segment due to the self-purification processes of the river water on the way from the introduction of the pollutant into the river to the control profile. The dynamics of self-purification processes affect absorption capacity.
-
Positive values of absorption capacity mean that an ecosystem adapts to the elimination of introduced pollution loads through a number of self-purification processes. It is assumed that pollution that is already introduced does not cause permanent change and after the elimination of the source of the pollution, the ecosystem will return to equilibrium, or close to a state of balance. Positive values of absorption capacity allow the disposable load of pollutant in the catchment to be determined.
-
Negative values of absorption capacity indicate areas where anthropogenic activities – agricultural or municipal – are responsible for excessive pollution of nutrients. This means that the limit load has been exceeded, and too much pollution has been introduced to the ecosystem for the possibility of the river's self-purification. There is an amount of load that must be removed from the river segment to attain water quality standards; however, this is not tantamount to a complete return to the initial state of the ecosystem, especially for nutrients, and this may affect many processes in the catchments. It is also unknown whether the critical load has been exceeded or not. Nevertheless, in this case, the excessive pollution should be reduced and methods should be implemented to revitalize the ecosystem.
-
The Macromodel DNS/SWAT can be an effective tool for the analysis of the absorption capacity of a river segment, as was shown with the example of the Middle Warta basin for average daily loads of nitrogen and total phosphorus.
-
Information on the river absorption capacity can be a good basis for the creation of action scenarios which could help in determining the impact of the realization of land development plans or investment planning on surface water and aquatic and water-dependent ecosystems.
-
For a more detailed analysis of water quality for selected catchments, hydrological units smaller than water bodies should be considered.
-
To summarize, the developed absorption capacity parameter is a valuable element of the assessment of water quality. It allows the connection of water quality according to reference values of environmental standards and water quality management plans in order to meet these standards. This parameter is designated by detailed mathematical calculations in combination with precise modelling techniques. This enables the consideration within the modelling of many hydrological, geological and soil conditions; weather and water quality parameters; and then the implementation of the obtained results during mathematical calculations. Absorption capacity of a river segment explains the relationship between the load of pollutants in the river, limit values of environmental standards and water quality assessment, along with identifying sources of pollution and possibilities for improving water quality and the state of aquatic and water-dependent ecosystems.
-
The analysis of absorption capacity using QSNQ as a characteristic flow has proven to be efficient and useful. However, at the stage of practical implementation of this parameter in order to allow in-depth assessment of nutrient pollution (e.g. in terms of eutrophication), the utilization of characteristic flow based on low flows may not be sufficient. Therefore, it is necessary to continue research on the utilization of environmental flows which additionally takes into account medium and high flow, as well as the number of elements affecting the hydrological regime, such as the size, time of occurrence, duration and frequency of floods, and low waters.
The data have been downloaded among others from Central Historical Database – IMGW and database of the State Environmental Monitoring the acquired data may not be used for commercial purposes (e.g., by passing on the data to third parties, by publishing them on the internet). As a consequence, we cannot offer direct access to the data used in this study.
PW worked on the development of a method for calculating the river absorption capacity using the Macromodel DNS/SWAT as well as on the calibration, verification and validation of the model. POW and JG prepared the data necessary to build the Macromodel DNS/SWAT. MO worked on the development of the Macromodel DNS.
The authors declare that they have no conflict of interest.
This article is part of the special issue “Coupled
terrestrial-aquatic approaches to watershed-scale water resource
sustainability”. It is not associated with a conference.
Edited by: Zhenyao Shen
Reviewed by: two anonymous referees
Abbaspour, K. C.: SWAT-CUP2: SWAT Calibration and Uncertainty Programs – A User Manual, Department of Systems Analysis, Integrated Assessment and Modelling (SIAM), Eawag, Swiss Federal Institute of Aquatic Science and Technology, Switzerland, 2008.
Alansi, A. W., Amin, M. S. M., Abdul Halim, G., Shafri, H. Z. M., and Aimrun, W.: Validation of SWAT model for stream flow simulation and forecasting in Upper Bernam humid tropical river basin, Malaysia, Hydrol. Earth Syst. Sci. Discuss., https://doi.org/10.5194/hessd-6-7581-2009, 2009.
Arnold, J. G., Kiniry, J. R., Srinivasan, R., Williams, J. R., Haney, E. B., and Neitsch, S. L.: Soil and Water Assessment Tool input/output file documentation: Version 2009, Texas Water Resources Institute Technical Report No. 365, 2011.
Boeuf, B. and Fritsch, O.: Studying the implementation of the Water Framework Directive in Europe: a meta-analysis of 89 journal articles, Ecol. Soc., 21, 19, https://doi.org/10.5751/ES-08411-210219, 2016.
Bosch, N. S., Allan, J. D., Dolan, D. M., Han, H., and Richards, R. P.: Application of the soil and water assessment tool for six watersheds of Lake Erie: model parameterization and calibration, J. Great Lakes Res., 37, 263–271, 2011.
Bossard, M., Feranec, J., and Otahel, J.: CORINE Land Cover Technical Guide, EEA Copenhagen, Denmark, 2000.
Brodie, E., Waterhouse, J., Lewis, E., Bainbridge, T., and Johnson, J.: Current loads of priority pollutants discharged from Great Barrier Reef Catchments to the Great Barrier Reef. ACTFR Report Number 09/02, Australian Centre for Tropical FreshWater Research, Townsville, 2009.
Bulsathaporn, A., Bhaktikul, K., Arunlertaree, Ch., Sueadee, W., and Suttigarn, A.: The Application of Mathematical Models for an Environmental Flow Assessment and Total Maximum Daily Load (TMDL) of Prachinburi-Bangpakong River, Thai National Committee on Irrigation Drainage, World Water, Mahidol University, Thailand, 2013.
Chiang, L. C., Chaubey, I., Hong, N. M., Lin, Y. P., and Huang, T.: Implementation of BMP strategies for adaptation to climate change and land use change in a pasture-dominated watershed, Int. J. Env. Res. Pub. He., 9, 3654–3684, 2012.
Chmielowski, W. Z. and Jarząbek, A.: Ćwiczenia i projekty z przedmiotu gospodarka wodna: pomoc dydaktyczna, Politechnika Krakowska, Kraków, 2008.
Chu, T. W., Shirmohammadi, A., Montas, H., and Sadeghi, A.: Evaluation of the SWAT model's sediment and nutrient components in the Piedmont physiographic region of Maryland, T. ASAE, 47, 1523–1538, 2004.
CORIN: CORINE LAND COVER, available at: http://www.eea.europa.eu/themes/landuse/interactive/clc-download, last access: 12 July 2013.
Directive: Nitrate, Council Directive 91/676/EEC of 12 December 1991 concerning the protection of waters against pollution caused by nitrates from agricultural sources, Official Journal L, 375, 8 pp., 1991.
Duarte, C. M., Conley, D. J., Carstensen, J., and Sánchez-Camacho, M.: Return to Neverland: shifting baselines affect eutrophication restoration targets, Estuar. Coast., 32, 29–36, 2009.
Dubnyak, S. and Timchenko, V.: Ecological role of hydrodynamic processes in the Dnieper reservoirs, Ecol. Eng., 16, 181–188, 2000.
Dyson, M., Bergkamp, G., and Scanlon, J.: Flow, International Union for Conservation of Nature and Natural Resources, IUCN, Gland, Switzerland, 2003.
Elósegui, A., Arana, X., Basaguren, A., and Pozo, J.: Self-purification processes along a medium-sized stream, Environ. Manage., 19, 931–939, 1995.
EPA – Environmental Protection Agency: Implementing Clean Water Act Section 303(d): Impaired Waters and Total Maximum Daily Loads (TMDLs), available at: https://www.epa.gov/tmdl, last access: 20 September 2016.
European Commission: Ecological flows in the implementation of the Water Framework Directive, Technical Report, Policy Summary, CIS Guidance Document No. 31, 2015.
Federal Water Pollution Control Act: As Amended Through P. L. 107–303, US Congress, Washington, DC, 2002.
Gębala, J., Orlińska-Woźniak, P., and Wilk, P.: Zastosowanie modelu SWAT w metodykach identyfikacji źródełzanieczyszczeń związkami biogennymi w zlewniach. Wybrane przykłady systemów wspomagania decyzji i modelowania w gospodarce wodnej, IMGW, Warszawa, 2014.
Gębala, J.: Method for assessing the impact of agricultural anthropopressure on surface water quality, PhD thesis, IMGW-PIB, 2015 (in Polish).
Górecki, K.: Zmiany stężenia i ładunku składników biogennych w wodzie rzeki warty między przekrojami Oborniki i Skwierzyna, Acta Scientiarum Polonorum. Formation Circumiectus, 6, 29–42, 2007.
Helsinki Commission: The Fourth Baltic Sea Pollution Load Compilation (PLC-4), Baltic Marine Environment Protection Commission, Helsinki, Baltic Sea Environment Proceedings No. 93, 2004.
Henriksson, A. and Miljökonsulter, A.: Actions against phosphorus losses from agriculture in the countries surrounding the Baltic Sea, Sveriges lantbruksuniversitet, Uppsala, 2007.
IUNG: Mapy kategorii glebowych Ministerstwa Rolnictwa i Rozwoju Wsi – Instytut Uprawy Nawożenia i Gleboznawstwa PIB, available at: http://www.susza.iung.pulawy.pl/index.html?str=mapkat, last access: 20 July 2012, 2009.
Jancarkova, I., Larsen, T. A., and Gujer, W.: Distribution of nitrifying bacteria in a shallow stream, Water Sci. Technol., 36, 161–166, 1997.
Jarosiewicz, A.: Proces samooczyszczania w ekosystemach rzecznych, Słupskie Prace Biologiczne, 4, 27–41, 2007.
Jarosiewicz, A. and Dalszewska, K.: Dynamika składników biogenicznych w rzece Słupi-ocena zdolności samooczyszczania rzeki, Słupskie prace biologiczne, 5, 63–73, 2008.
Karrasch, B., Parra, O., Cid, H., Mehrens, M., Pacheco, P., Urrutia, R., and Zaror, C.: Effects of pulp and paper mill effluents on the microplankton and microbial self-purification capabilities of the Biobio River, Chile, Sci. Total Environ., 359, 194–208, 2006.
Kowalewski, Z.: Metody oceny stanu troficznego wód powierzchniowych. IV Krakowska Konferencja Młodych Uczonych, Akademia Górniczo-Hutnicza im., Kraków, Stanisława Staszica w Krakowie, 343–351, 2009.
Kowalkowski, T.: Classification of nutrient emission sources in the Vistula River system, Environ. Pollut., 157, 1867–1872, 2009.
Krause, P., Boyle, D. P., and Bäse, F.: Comparison of different efficiency criteria for hydrological model assessment, Adv. Geosci., 5, 89–97, https://doi.org/10.5194/adgeo-5-89-2005, 2005.
Magley, W. and Joyner, D.: Total Maximum Daily Load for Nutrients for the Lower St. Johns River, Bureau of Watershed Management, Florida Department of Environmental Protection, 2008.
Marsili-Libelli, S. and Giusti, E: Water quality modelling for small river basins, Environ. Modell. Softw., 23, 451–463, 2008.
McColl, R. H. S.: Self-purification of small freshwater streams: phosphate, nitrate, and ammonia removal, New Zeal. J. Mar. Fresh., 8, 375–388, 1974.
Mohlar, R.: Penobscot River, Phosphorus Waste Load Allocation, Maine Department of Environmental Protection (DEP), Maine, USA, 2011.
Mońka, B.: Planowanie w gospodarowaniu wodami w Polsce przed i po wejściu do Unii Europejskiej, Regionalny Zarząd Gospodarki Wodnej we Wrocławiu, Wrocław, 2005.
Moriasi, D. N., Arnold, J. G., Van Liew, M. W., Bingner, R. L., Harmel, R. D., and Veith, T. L.: Model evaluation guidelines for systematic quantification of accuracy in watershed simulations, T. ASABE, 50, 885–900, 2007.
Neitsch, S. L., Arnold, J. G., Kiniry, J. R., and Williams, J. R.: Soil and water assessment tool theoretical documentation version 2009, Texas Water Resources Institute, USA, 2011.
Neverova-Dziopak, E.: New approach to estimation of permissible discharge of biogenic matter into water bodies (example of the Neva estuary of the Baltic Sea), Environ. Prot. Eng., 33, 121–128, 2007.
Neverova-Dziopak, E.: Problems of ecological monitoring of surface waters, Environ. Prot. Eng., 35, 81–91, 2009.
Nixon, S. W.: Eutrophication and the macroscope, Hydrobiologia, 629, 5–19, 2009.
Orlińska-Woźniak, P., Wilk, P., and Gębala, J.: Water availability in reference to water needs in Poland, Meteorology Hydrology and Water Management, Research and Operational Applications, IMGW, Warsaw 2013.
Ostojski, M. S.: Modelowanie procesów odprowadzania do Bałtyku związków biogennych: na przykładzie azotu i fosforu ogólnego, Wydawnictwo Naukowe PWN, Warszawa, 2012.
Ostojski, M. S., Gębala, J., Orlińska-Woźniak, P., and Wilk, P.: Implementation of robust statistics in the calibration, verification and validation step of model evaluation to better reflect processes concerning total phosphorus load occurring in the catchment, Ecol. Model., 332, 83–93, 2016.
Pai, N., Saraswat, D., and Daniels, M.: Identifying priority subwatersheds in the Illinois river drainage area in Arkansas watershed using a distributed modeling approach, T. ASABE, 54, 2181–2196, 2011.
Popek, Z.: Analiza możliwości zwiększania retencji na obszarach zurbanizowanych w dorzeczu Wisły Środkowej–stan wiedzy i dalsze kierunki działań. Program bezpieczeństwa powodziowego w dorzeczu Wisły Środkowej, Warszawa, 2011.
Radcliffe, D. E., Freer, J., and Schoumans, O.: Diffuse phosphorus models in the United States and Europe: their usages, scales, and uncertainties, J. Environ. Qual., 38, 1956–1967, 2009.
Rathjens, H. and Oppelt, N.: SWAT model calibration of a grid-based setup, Adv. Geosci., 32, 55–61, https://doi.org/10.5194/adgeo-32-55-2012, 2012.
Reckhow and Pahl-Wostl, C.: Directive, W. F. Water Policy in the USA and the EU KH Case Study: Total Maximum Daily Load and Water Framework Directive, Ecol. Econ., 64, 484–495, 2001.
Regulation of the Minister of the Environment: W sprawie sposobu klasyfikacji stanu jednolitych części wód powierzchniowych oraz środowiskowych norm jakości dla substancji priorytetowych, Dz. U. Nr 257, Poz. 1545, Warsaw, 2011.
Schulz, M., Kozerski, H. P., Pluntke, T., and Rinke, K: The influence of macrophytes on sedimentation and nutrient retention in the lower River Spree (Germany), Water Res., 37, 569–578, 2003.
Spellman, F. R. and Drinan, J.: Stream Ecology and Self Purification: An Introduction, CRC Press, https://doi.org/10.1016/S0043-1354(02)00276-2, 2001.
Srinivasan, R.: Soil and Water Assessment Tool, Introductory Manual – Teaching Materials, Texas A&M University, Texas, USA, 2011.
Srinivasan, R., Hadley, J., Uhlenbrook, S., Van Griensven, A., Holvoet, K., and Bauwens, W.: European SWAT summer school 2006, UNESCO – IHE, Institute for Water Education, Delft, Netherlands, 2006.
Tyszewski, S., Herbich, P., Indyk, W., Jarząbek, A., Pusłowska-Tyszewska, D., and Rutkowski, M.: Metodyka opracowywania warunków korzystania z wód regionu wodnego oraz warunków korzystania z wód zlewni, PRO WODA, Warszawa, 2008.
Vagnetti, R., Miana, P., Fabris, M., and Pavoni, B.: Self-purification ability of a resurgence stream, Chemosphere, 52, 1781–1795, 2003.
Vaikasas, S. and Dumbrauskas, A.: Self-purification process and retention of nitrogen in floodplains of River Nemunas, Hydrol. Res., 41, 338–345, 2010.
Van der Lee, G. E. M., Olde Venterink, H., and Asselman, N. E. M.: Nutrient retention in floodplains of the Rhine distributaries in the Netherlands, River Res. Appl., 20, 315–325, 2004.
WFD (Water Framework Directive): Directive 2000/60/EC of the European Parliament and of the Council Establishing a Framework for the Community Action in the Field of Water Policy, The European Parliament and the Council of the European Union, Brussels, Belgium, 2000.
Wilk, P. (2015) The method of calculating river absorption capacity (RAC) as a tool to assess the physicochemical state of surface flowing waters, PhD thesis, IMGW-PIB (in Polish).
Zagorc-Končan, J. and Šömen, J.: A simple test for monitoring biodegradable industrial pollution in a receiving stream, Water Sci. Technol., 39, 221–224, 1999.
Zalewski, M.: Ecohydrology – Integrative tool for achieving good ecological status of freshwater ecosystems, International Centre for Ecology of the Polish Academy of Sciences, Warsaw/Lodz Department of Applied Ecology University of Lodz, available at: http://www.inbo-news.org/IMG/pdf/EH_Krakow.pdf (last access: July 2016), 2003.