the Creative Commons Attribution 4.0 License.
the Creative Commons Attribution 4.0 License.
 | 28 Feb 2018
Citizen observations contributing to flood modelling: opportunities and challenges
Thaine H. Assumpção
Ioana Popescu
Andreja Jonoski
Dimitri P. Solomatine
Citizen contributions to science have been successfully implemented in many fields, and water resources is one of them. Through citizens, it is possible to collect data and obtain a more integrated decision-making process. Specifically, data scarcity has always been an issue in flood modelling, which has been addressed in the last decades by remote sensing and is already being discussed in the citizen science context. With this in mind, this article aims to review the literature on the topic and analyse the opportunities and challenges that lie ahead. The literature on monitoring, mapping and modelling, was evaluated according to the flood-related variable citizens contributed to. Pros and cons of the collection/analysis methods were summarised. Then, pertinent publications were mapped into the flood modelling cycle, considering how citizen data properties (spatial and temporal coverage, uncertainty and volume) are related to its integration into modelling. It was clear that the number of studies in the area is rising. There are positive experiences reported in collection and analysis methods, for instance with velocity and land cover, and also when modelling is concerned, for example by using social media mining. However, matching the data properties necessary for each part of the modelling cycle with citizen-generated data is still challenging. Nevertheless, the concept that citizen contributions can be used for simulation and forecasting is proved and further work lies in continuing to develop and improve not only methods for collection and analysis, but certainly for integration into models as well. Finally, in view of recent automated sensors and satellite technologies, it is through studies as the ones analysed in this article that the value of citizen contributions, complementing such technologies, is demonstrated.


The necessity to understand and predict the behaviour of floods has been present in societies around the world. This comes from the fact that floods impact their surroundings – in negative or positive ways. The most common way used currently to better understand and often predict flood behaviour is through modelling and, depending on the system at hand, a variety of models can be used (Teng et al., 2017).
In order to have adequate representation of floods, most models require large amounts of data, both for model building and model usage. This is especially true for pluvial flood modelling, where flooding may not occur in gauged rivers and hence, flow gauging stations outside of flooded zones may be of little use. Remote sensing technologies are a part of the solution, as they offer spatially distributed information. However, their availability may be limited, also in terms of space and time, and their uncertainties often are not quantifiable (Di Baldassarre et al., 2011; Grimaldi et al., 2016; Jiang et al., 2014; Li et al., 2017). Thus, acquiring the necessary data for simulations and predictions can still be expensive, particularly for rapidly changing systems that require frequent model updates.
In this context, sources of abundant data at low cost are needed, together with modified modelling approaches that can use these data and can adapt to changes as fast as they occur. Citizen observatory (CO) is an emerging concept in which citizens monitor the environment around them (Montargil and Santos, 2017). It is often considered under the umbrella of citizen science (including citizen participation up to the scientist level) and it is also related to the concept of crowdsourcing (distributing a task among many agents). With technology at hand, it is possible to empower citizens to not only participate in the acquisition of data but also in the process of scientific analysis and even in the consequent decision-making process (Evers et al., 2016). Citizen observatories have been researched in several EU-funded projects. Finished projects (CITI-SENSE, Citclops, COBWEB, OMNISCIENTIS and WeSenseIt) have already resulted in valuable contributions to the field (Alfonso et al., 2015; Aspuru et al., 2016; Friedrichs et al., 2014; Higgins et al., 2016; Uhrner et al., 2013). For example, the CITI-SENSE project managed to simultaneously collect perception data and acoustic measurements in an approach that can be used to develop citizen empowerment initiatives in case of noise management (Aspuru et al., 2016), while in COBWEB project processes of quality assurance, data conflation and data fusion were studied and recommendations were made (Friedrichs et al., 2014). The currently running CO projects (Ground Truth 2.0, LANDSENSE, SCENT and GROW Observatory) propose to investigate this concept further.
Citizen science concepts have been researched and applied in various fields such as ecology and galaxy inspection (Lintott et al., 2008; Miller-Rushing et al., 2012). Volunteer geographic information (VGI), as one of the most active citizen science areas, has developed over the past decade and several researchers have reviewed the state of the art of citizen science in the field of geosciences (Heipke, 2010; Klonner et al., 2016). There is also a part of the scientific community dedicated to investigating damage data crowdsourced after flood emergencies (Dashti et al., 2014; Oxendine et al., 2014) and evaluating the cycle of disaster management (Horita et al., 2013). In the context of water resources, Buytaert et al. (2014) reviewed and discussed the contribution of citizen science to hydrology and water resources, addressing the level of engagement, the type of data collected (e.g. precipitation, water level) and case studies where more participatory approaches are being implemented. Le Coz et al. (2016) provided examples and reflections from three projects related to flood hydrology and crowdsourcing, which involve the derivation of hydraulic information from pictures and videos in Argentina, France and New Zealand.
The present review aims to look at studies that used citizen science connected to floods. Specifically, it focusses on the data collected by citizens that are relevant in a flood modelling context, benchmarking difficulties and benefits of their collection and integration into models. Integration is considered for the purposes of model set up, calibration, validation, simulation and forecasting.
The review process involved defining web platforms, keywords and criteria for searching and selecting publications. The main platforms used were Scopus and Google Scholar. The keywords are a combination of words related to citizen science (e.g. “citizen science” and “crowdsourcing”) and to flood-related variables (e.g. “water level” and “flood extent”). The obtained articles were scanned for their content. Articles were selected mainly if crowdsourced data were obtained for quantitative use in monitoring, mapping or modelling. There were studies that were not selected because they just mention the use of crowdsourced data and do not provide more relevant information on collection, analysis, use and quantity of data, such as Merkuryeva et al. (2015). The same was the case for studies that evaluate variables qualitatively, in ways that could not be directly associated with modelling (Kim et al., 2011). This review included articles published up to April 2017.
Further in this section, we introduce the concept of citizen science and related classification systems. In Sect. 2 of the article, we overview studies on citizen contributions for flood modelling, classifying them according to the corresponding flood-related variables, followed by a summary of the pros and cons of measurement and analysis methods. Section 3 aggregates the studies that involve flood modelling and analyses the contributions considering the component of the modelling process where they were used, also including a discussion of the factors that affect flood modelling. Section 4 describes the challenges and opportunities of using data contributed by citizens in flood modelling, and finally, Sect. 5 presents the conclusions and recommendations.
1.1 Citizen science
Buytaert et al. (2014) defined citizen science as “the participation of the general public (i.e. non-scientists) in the generation of new knowledge”. In the same manner that the involvement of citizens can be diverse, such is the way their participation is found in the scientific literature:
-
citizen science (Buytaert et al., 2014);
-
citizen observatory (Degrossi et al., 2014);
-
citizen sensing (Foody et al., 2013);
-
trained volunteers (Gallart et al., 2016);
-
participatory data collection methods (Michelsen et al., 2016);
-
crowdsourcing (Leibovici et al., 2015);
-
participatory sensing (Kotovirta et al., 2014);
-
community-based monitoring (Conrad and Hilchey, 2011);
-
volunteered geographic information (Klonner et al., 2016);
-
eyewitnesses (Poser and Dransch, 2010);
-
non-authoritative sources (Schnebele et al., 2014);
-
human sensor network (Aulov et al., 2014);
-
crowdsourced geographic information (See et al., 2016).
Some of the terms used by the above-mentioned articles have specific definitions that are used to delineate debates on the social mechanisms of citizen participation. Others are just the best form the researcher found to characterise the contribution or the citizen (e.g. eyewitnesses). Citizen science and adjacent areas have become fields of research in themselves that, for instance, focus on understanding the motivation of citizens or their interaction with public institutions (Gharesifard and Wehn, 2016).
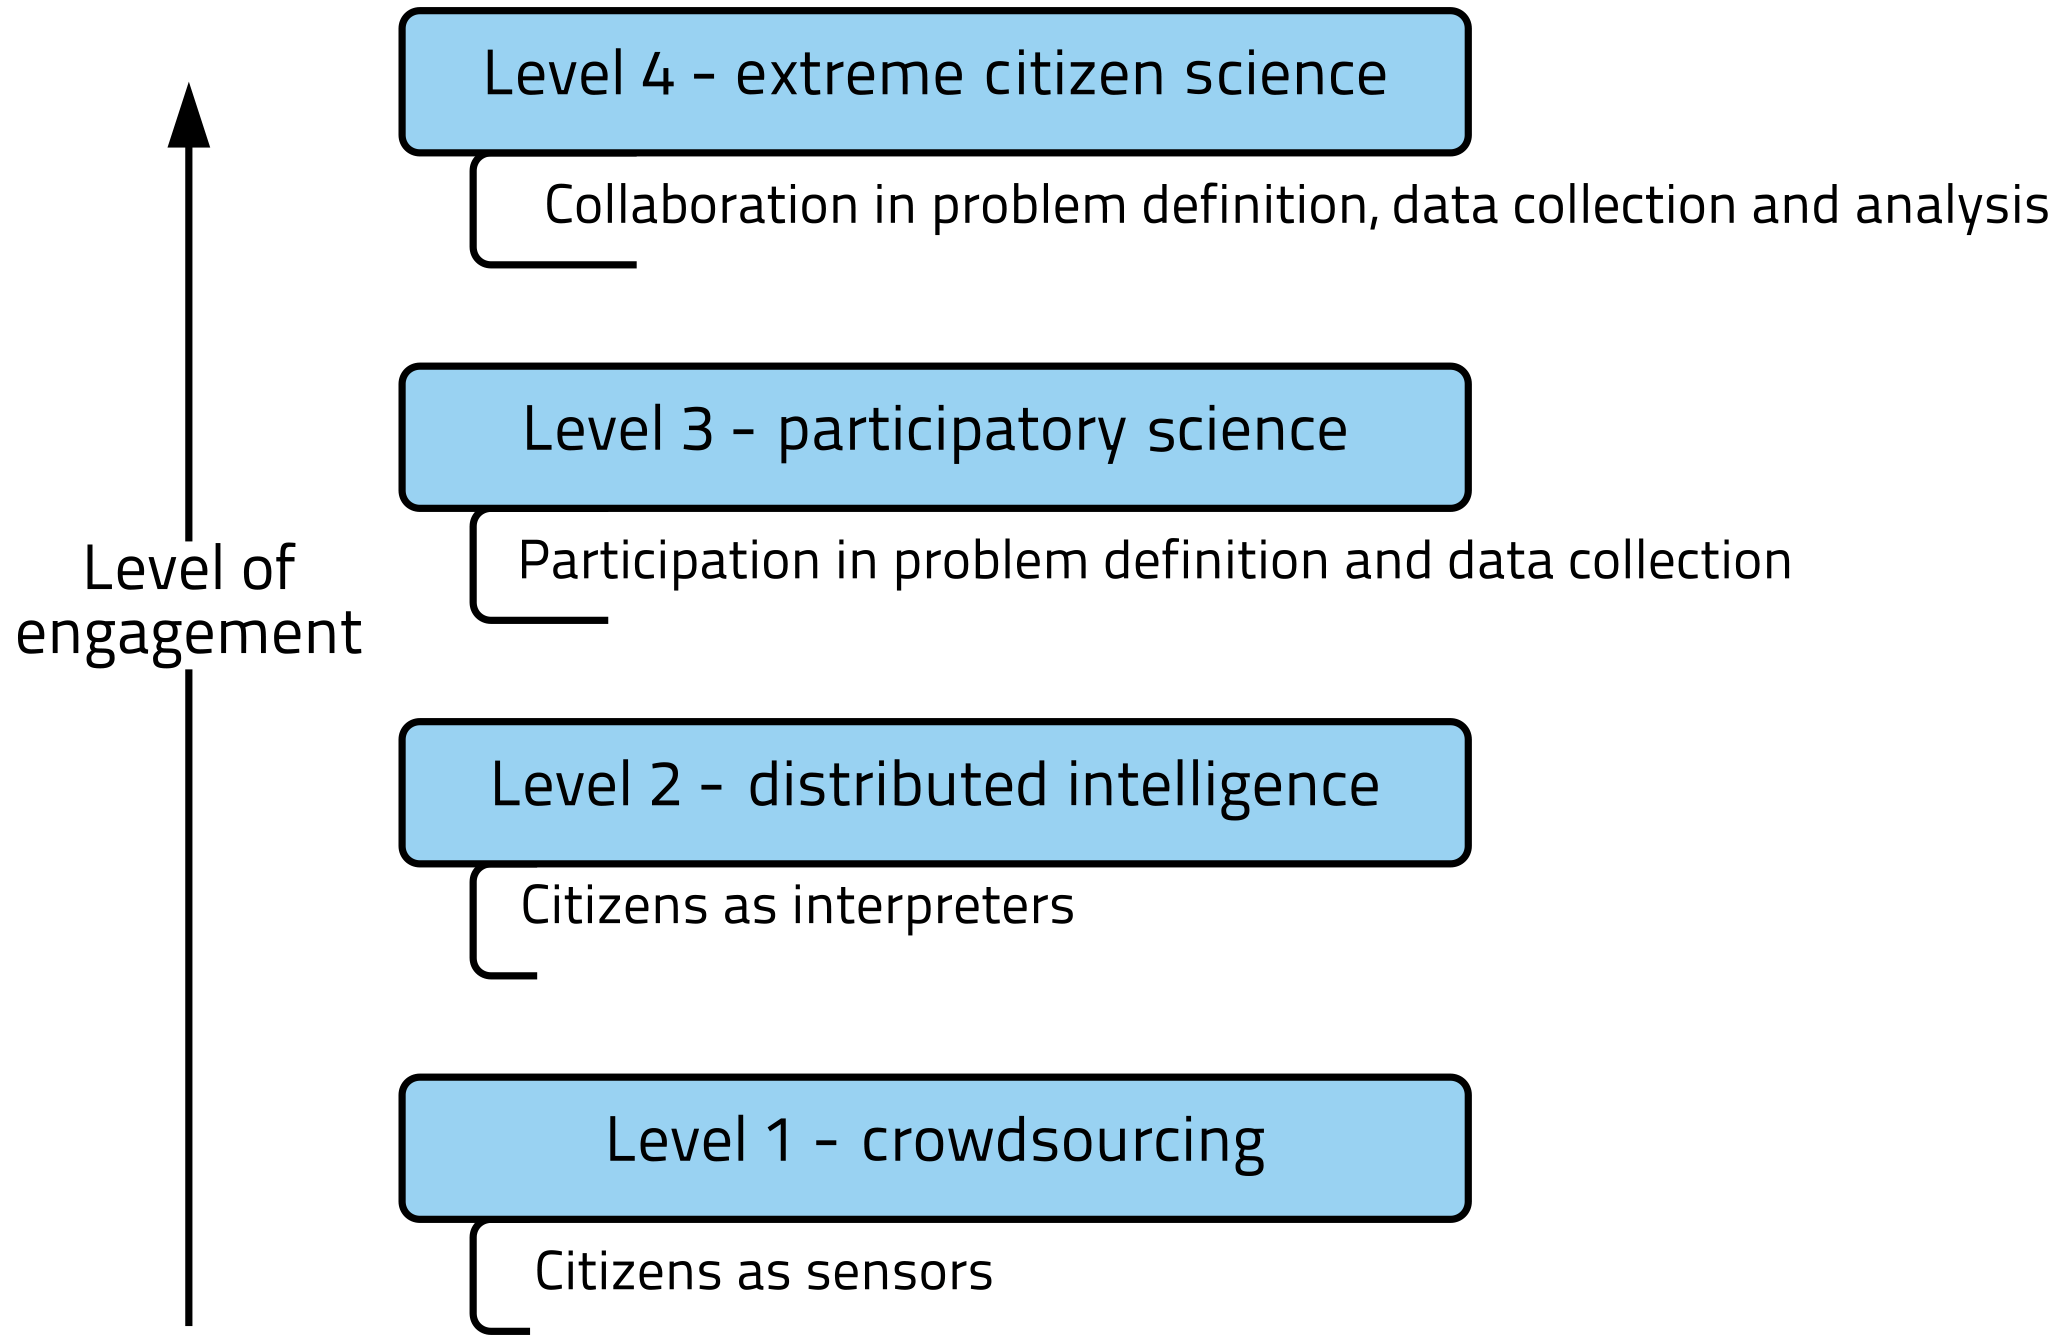
Figure 1Levels of participation and engagement in citizen science projects. Adapted from Haklay (2013).
In this field, one of the classifications of citizen science is by level of engagement. Haklay (2013) built a model that has four levels (Fig. 1), in which the first one refers to the participation of citizens only as data collectors, passing through a second level in which citizens are asked to act as interpreters of data, going towards the participation in definition of the problem in the third level and finally, being fully involved in the scientific enterprise at hand. The review presented in this current article is focused on the contribution towards flood modelling only, coming most prominently from the two lowest levels of engagement. We do not discuss topics related to engagement for the generation of (quantitative) data. Further in this article, for readability, only the term crowdsourced data is used to refer to data from these two levels of engagement.
Another way to classify citizen science initiatives (within the context of VGI) is by organising them as implicitly/explicitly volunteered and implicitly/explicitly geographic (Craglia et al., 2012). In this classification system, geographic refers to the main information conveyed through the contributed data; therefore, geo-tagged data are not necessarily geographic. For example, in the Degree Confluence Project (Iwao et al., 2006), citizens were instructed to go to certain locations, take pictures, make notes and deliberately make available their material on the project's website. In this case, the information is explicitly volunteered and geographic. Most land use/cover projects related to citizen science collect geographic information. Differently, in the study conducted by Lowry and Fienen (2013) citizens would also willingly send text messages to the researchers, in this case providing water level readings from installed water level gauges. Although explicitly volunteered, the message was non-geographic (just geo-tagged). Another type of implicitly geographic information was derived from Twitter by Smith et al. (2015) to obtain flood water level, flow rate and flood inundation estimates. As the citizens did not make the information public with the specific purpose to provide estimates, it is implicitly volunteered.
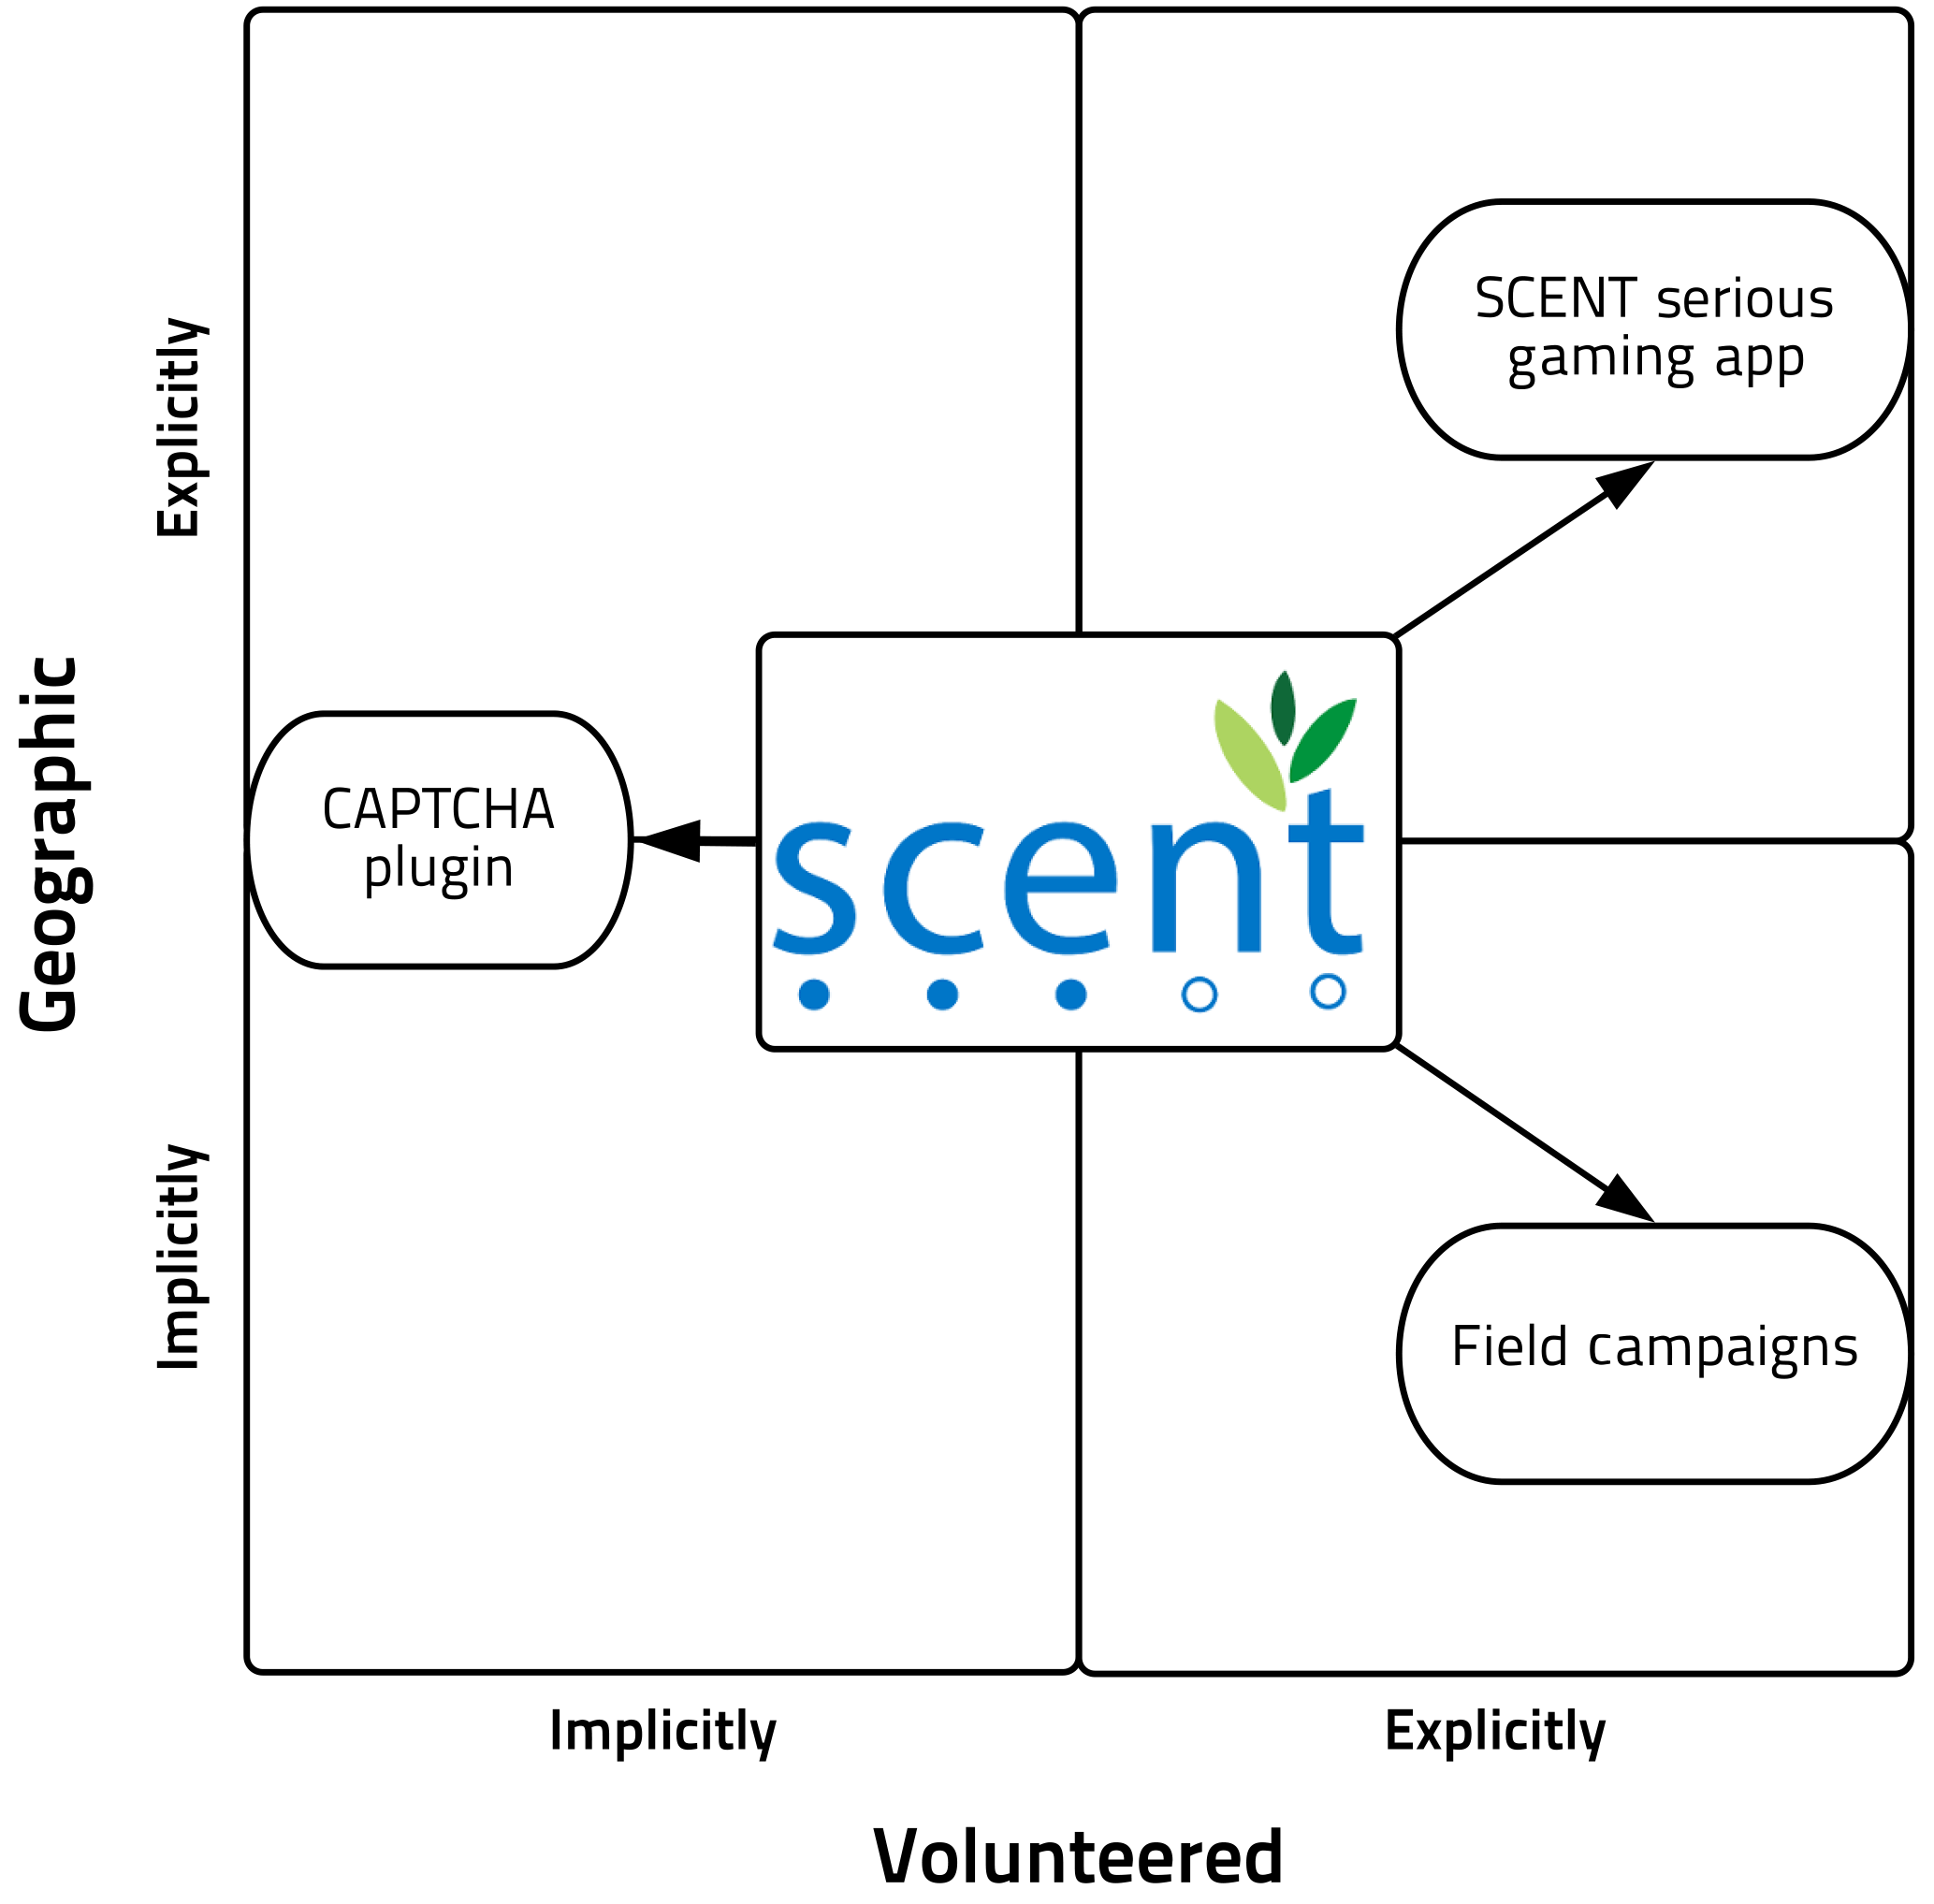
Figure 2SCENT project represented in the typology of VGI (volunteered geographic information).
The concepts defined by Craglia et al. (2012) can be graphically represented as in Fig. 2. The SCENT project1 (Smart Toolbox for Engaging Citizens in a People-Centric Observation Web) is one of the four projects funded by Horizon 2020 focussing on citizen observatories. It lies in the middle of this quadrant as it encourages citizens to participate in gaming to collect land cover/use data, in field campaigns to collect other implicitly geographic information (e.g. water level), and also aims to obtain implicitly volunteered contributions through a CAPTCHA2 plug-in, in which citizens tag images of, for example, land cover/use or water level in order to access online content. Tagging images is uncorrelated to the CAPTCHA, it is a task performed after the test, on the same platform.
There are many types of flood-related data that can be collected by citizens. Likewise, there are many ways to collect, analyse and use them (for monitoring, mapping and modelling). In the next subsections we address how these aspects were explored in the scientific literature. Each subsection discusses a data type corresponding to a flood modelling variable: water level, velocity, flood extent, land cover and topography. Depending on the type of flooding, other variables are relevant, such as precipitation. The scientific literature already shows that citizen contributions could be useful for observation of this variable (Muller et al., 2015; De Vos et al., 2017). However, rainfall is not included in this section because it was already covered by the review of Muller et al. (2015). Moreover, in general it is a variable of greater importance for hydrological models, whilst the present review is focussed on a hydrodynamic representation of floods. Regarding the presented articles, there are some mentioned and reviewed in more than one section because they evaluated more than one variable, as in, for example, the case of Smith et al. (2015).
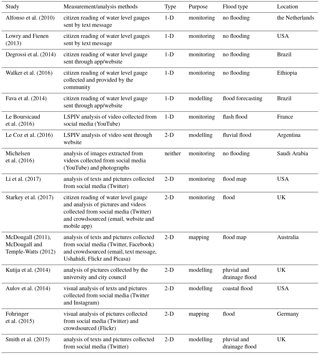
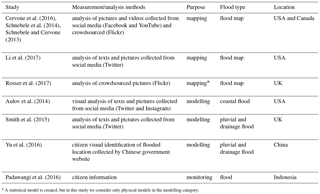
Table 1Scientific literature on citizen contributions to measurement and analysis of water level
2.1 Water level
Table 1 gives an overview of the articles about collection of water level data. The studies presented started to involve citizens in the collection of water level data with the explicit goal of improving flood management. This is due to the ease of collecting such data, which mostly consists of comparing the water level with a clearly defined reference. In some cases, the reference is a water level gauge, the comparison is made by the citizen, and readings are submitted to the researchers (Alfonso et al., 2010; Degrossi et al., 2014; Fava et al., 2014; Lowry and Fienen, 2013; Walker et al., 2016). Such kinds of reading practically do not require further analysis, although they entail the installation of water level gauges.
In other cases, the citizen provides qualitative data that will be compared to references by researchers. Citizens provide pictures (Fohringer et al., 2015; Kutija et al., 2014; Li et al., 2017; McDougall, 2011; McDougall and Temple-Watts, 2012; Smith et al., 2015; Starkey et al., 2017) or videos (Le Boursicaud et al., 2016; Le Coz et al., 2016; Michelsen et al., 2016), mostly during flooding situations. In the case of pictures/images, the water level is compared with objects in the images that have known or approximately known dimensions. For videos, although water level was estimated, the main goal was to obtain discharge values, via estimates of flow velocity. In two cases, texts from citizens were used (e.g. water over the knee) to calculate water level values or to assume a certain value when no value was provided (Li et al., 2017; Smith et al., 2015). This sort of data (text, pictures and videos) was mostly collected through social media and public image repositories. Gathering data from such sources requires mining of the relevant material (i.e. extraction of specific data from a dataset) and dealing with uncertainties in the spatio-temporal characterisation of the data of interest.
One aspect that varies across the studies is the level of detail in the comparison method used for determining the water level measurement. For example, McDougall (2011) and McDougall and Temple-Watts (2012) explicitly state that field visits to the selected photo locations are required in order to properly analyse the image and extract water level values. On the other hand, Fohringer et al. (2015), Smith et al. (2015) and Starkey et al. (2017) do not mention any method.
In most cases, crowdsourcing was used to monitor water level, followed by the use of such data for modelling and lastly for mapping. In the case of Starkey et al. (2017), although hydrological modelling was done and water levels were converted into discharge to allow for comparisons, only qualitative comparisons were made.
2.2 Velocity
As velocities and discharges traditionally require more complex measuring methods, the collection of this type of data by citizens has not been explored on a scientific basis. However, it is common to include direct measurements of velocity in protocols to monitor the environment and water quality, as it is the case of Hoosier Riverwatch (IDEM, 2015). In these cases, the citizens perform measurements that involve more processing (e.g. definition of transects to measure flow, use of formulas).
Table 2Scientific literature on citizen contributions to measurement and analysis of velocity.
To the best of the authors' knowledge, only three studies were found that make use of velocity data collected by citizens, all for the study of floods, as presented in Table 2. Le Boursicaud et al. (2016) evaluated the surface velocity field in a channel from a YouTube video, using the LSPIV methodology (large-scale particle image velocimetry), an established method to obtain velocity from a sequence of images. Ïn order to do this analysis, several visible elements are required, such as fixed reference points and both river banks. It is also necessary to know information about the camera model and lens type. Although the method calculates the velocity in two dimensions, in Table 2 we referred to it as 1-D because it was carried out in a channel considered to be a 1-D domain in the context of flood modelling. A complementary project was discussed by Le Coz et al. (2016), in which the same technique is applied to a video crowdsourced by a citizen, this time using the result to estimate discharge and the latter to calibrate a 1-D hydraulic model. For this, a visit to the location was needed to extract cross-sectional data. In this context, Yang and Kang (2017) developed a method for crowd-based velocimetry of surface flows, based on particle image velocimetry, in which citizens mark features in the picture. The method has not been tested with citizen-collected data yet.
The third study, conducted by Smith et al. (2015), selected Twitter messages that include terms of semantic value related to the citizen's location, water depth (e.g. knee-deep) and velocity. The terms were then associated with quantitative values/ranges. The authors did not go into detail on the reliability and uncertainty in such data, even though the issue is recognised.
Table 3Scientific literature on citizen contributions to measurement and analysis of flood extent.
* A statistical model is created, but in this study we consider only physical models in the modelling category.
2.3 Flood extent
Flood extent, similarly to water level, is a variable that is simple to measure as it consists of binary values: flooded or non-flooded area. As a 2-D variable, it needs a lot of spatial information, which is the main reason related studies gather flood extent estimates in data rich environments, through social media/photo sharing services mining, as shown in Table 3. In some cases, the citizens act only as sensors, providing pictures to be analysed by the research team, while in other cases they also act as interpreters by providing the flooded/non-flooded information. As can be expected, all studies found were carried out in urban areas.
In some of the studies the text and images indicate if the location where they are taken was flooded (georeferenced or inferred; Aulov et al., 2014; Smith et al., 2015; Yu et al., 2016), whilst in others further processing is used to infer surrounding inundated areas (Cervone et al., 2016; Li et al., 2017; Rosser et al., 2017; Schnebele et al., 2014; Schnebele and Cervone, 2013). Additionally, the last group of studies mentioned fused flood extent data from citizens with satellite data or with gauge data.
2.4 Land cover/land use
Land cover is not a variable in flood-related models but we include it in this review for its importance in inferring roughness (i.e. the parameter representing momentum loss due to friction, to the ground resistance encountered by the flow). Other valuable aspects of land use data are the information on roads and structures that can be obstacles to floods, which can be incorporated in the model structure, as well as the information on vulnerability (e.g. hospitals, dense residential areas, industrial zones), which can be used to obtain flood risk maps. According to Klonner et al. (2016), when reviewing the literature on VGI for natural hazard analysis, there are few studies for vulnerability analysis. The aspects of land use related to vulnerability and risk are complex and study topics onto themselves, so these aspects are not discussed further in this article.
Table 4Scientific literature on citizen contributions to measurement and analysis of land cover/land use.
* Many other articles related to crowdsourcing through GeoWiki.
Table 4 presents the articles considered for this review. Compared to previously discussed variables, the contribution of citizens to land cover map generation has already been proven as a concept (Albrecht et al., 2014; Fritz et al., 2012), and is currently being researched further for data quality (Salk et al., 2016) and fusion of maps (Lesiv et al., 2016).
One of the first publications on the subject was from Iwao et al. (2006), in which they describe the Degree Confluence Project. The objective was to generate a global land cover map, which implies obtaining ground truth data from around the globe. For obvious reasons, it was unfeasible to make field campaign or analyse low-resolution images with sufficient resolution. Thus, they launched a website that invited citizens to visit integer coordinates (e.g. 25∘ N, 25∘ W) locations, take photos from the four cardinal directions and provide comments on the region. They discovered that citizen-generated data had similar quality to those provided by specialists.
Another significant project in the area is GeoWiki. It started in 2009 as a platform for people to validate global land cover maps, by comparing their classification to high-resolution images (Fritz et al., 2009). The project has grown since and has recently achieved its main goal: to generate a hybrid global land cover map by fusing existing maps and performing calibration and validation using the analyses made by citizens (See et al., 2015a). Current initiatives in the GeoWiki project include gamification and analysis of pictures uploaded onto the platform (See et al., 2015b). Many studies stemmed from the data collected, generally focused on specific land cover types. A similar approach is taken by Dong et al. (2012) that analyses pictures uploaded by citizens using a different web application. The research conducted by Dorn et al. (2014) goes one step further, as it attributes roughness values to multiple land cover maps, including OpenStreetMap3.
2.5 Topography
The digital elevation model (DEM) is one of the most important components of flood modelling, as it generally heavily influences flood propagation. It is particularly important in urban settings, where spatial variability in refined scales has a considerable effect on the direction of water flows. Unfortunately, this is a complex variable to measure that so far relies either on fully trained professionals going into the field, or on expensive airborne technologies. The use of drones, also called unmanned aerial vehicles (UAVs), is potentially a low-cost alternative that is increasingly studied (Hamshaw et al., 2017); however, so far studies on citizen-generated drone data are limited to evaluating the spatial distribution of contributions (Hochmair and Zielstra, 2015) or to the analysis of repositories for image sharing (Johnson et al., 2017). However, recently, Shaad et al. (2016) studied a terrain capturing low-cost alternative to lidar remote sensing images and other expensive methods. The low-cost technique is ground-based close-range photogrammetry (CRP) that consists of collecting images/videos from the ground, post-processing them and obtaining terrain information. Volunteers made the videos in a designated location, where even UAVs would not be able to collect data. After comparing the results to other methods, they concluded that the result had acceptable quality.

Figure 3Selected studies represented in the typology of VGI (volunteered geographic information).
2.6 Summary analysis
By classifying the discussed studies according to Craglia et al. (2012), there is an overall similarity in the number of studies that crowdsource data implicitly and explicitly (Fig. 3). It is however apparent that this aspect does not translate into a homogeneous distribution of flood-related variables, as most implicitly volunteered contributions are related to flood extent and most explicitly volunteered contributions are related to water level. There is a slightly higher concentration of modelling studies that are explicitly volunteered, but not enough to be able to draw any conclusions.
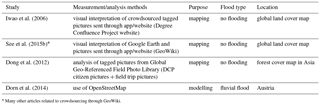
Considering the temporal distribution of studies evaluated in this review, it is evident that there is a trend: the rise in number of studies from 2014 onwards (Fig. 4). This relates to the initial barrier in acknowledging citizen data as being of high enough quality for scientific studies (Buytaert et al., 2014). This resistance has reduced over time as such data are being proven useful, protocols are being designed and the data uncertainty is being better understood and quantified.
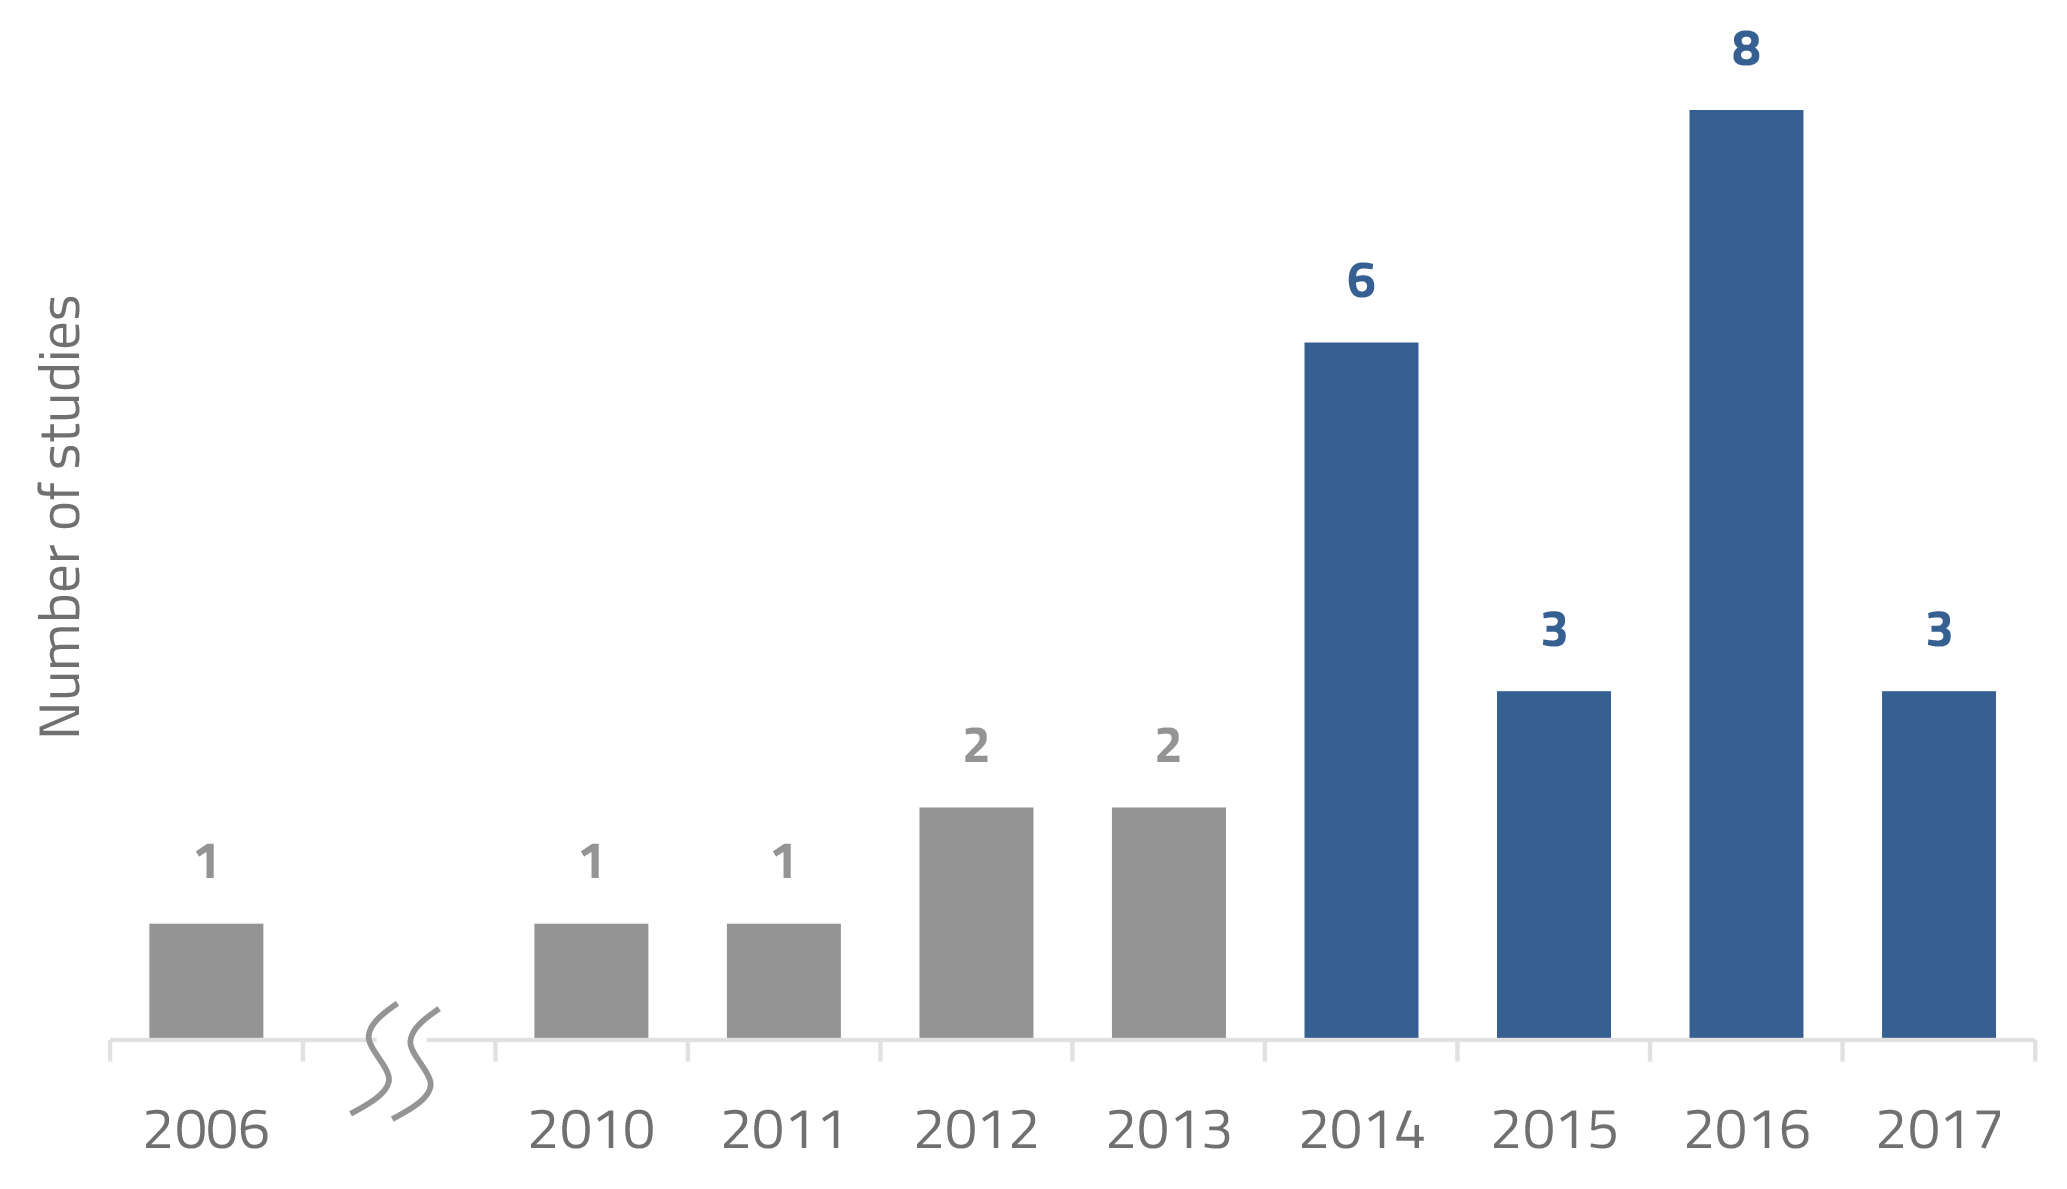
Figure 5Number of studies analysed per flood-related variable per category: mapping, monitoring and modelling.
If the analysed studies are aggregated into categories (Fig. 5), it can be seen that modelling studies have approximately the same quantity as monitoring ones, but they are only about a third of all studies reviewed. This is expected because using data in models requires monitoring them first. Also, monitoring and mapping applications involve more general end uses; for example, water levels can be monitored for water allocation planning and flood modelling. Specifically for land cover, there is an unexplored field in modelling (there are more mapping studies than the ones in the graph; see Sect. 2.4). The reason may be that modellers do not tend to validate their own land cover maps and thus will not do it with citizen science data. What can be noted, though, is the lack of exploration of velocity and topography variables, which, as mentioned, could be due to the complexity in analysing and setting up the experiment.
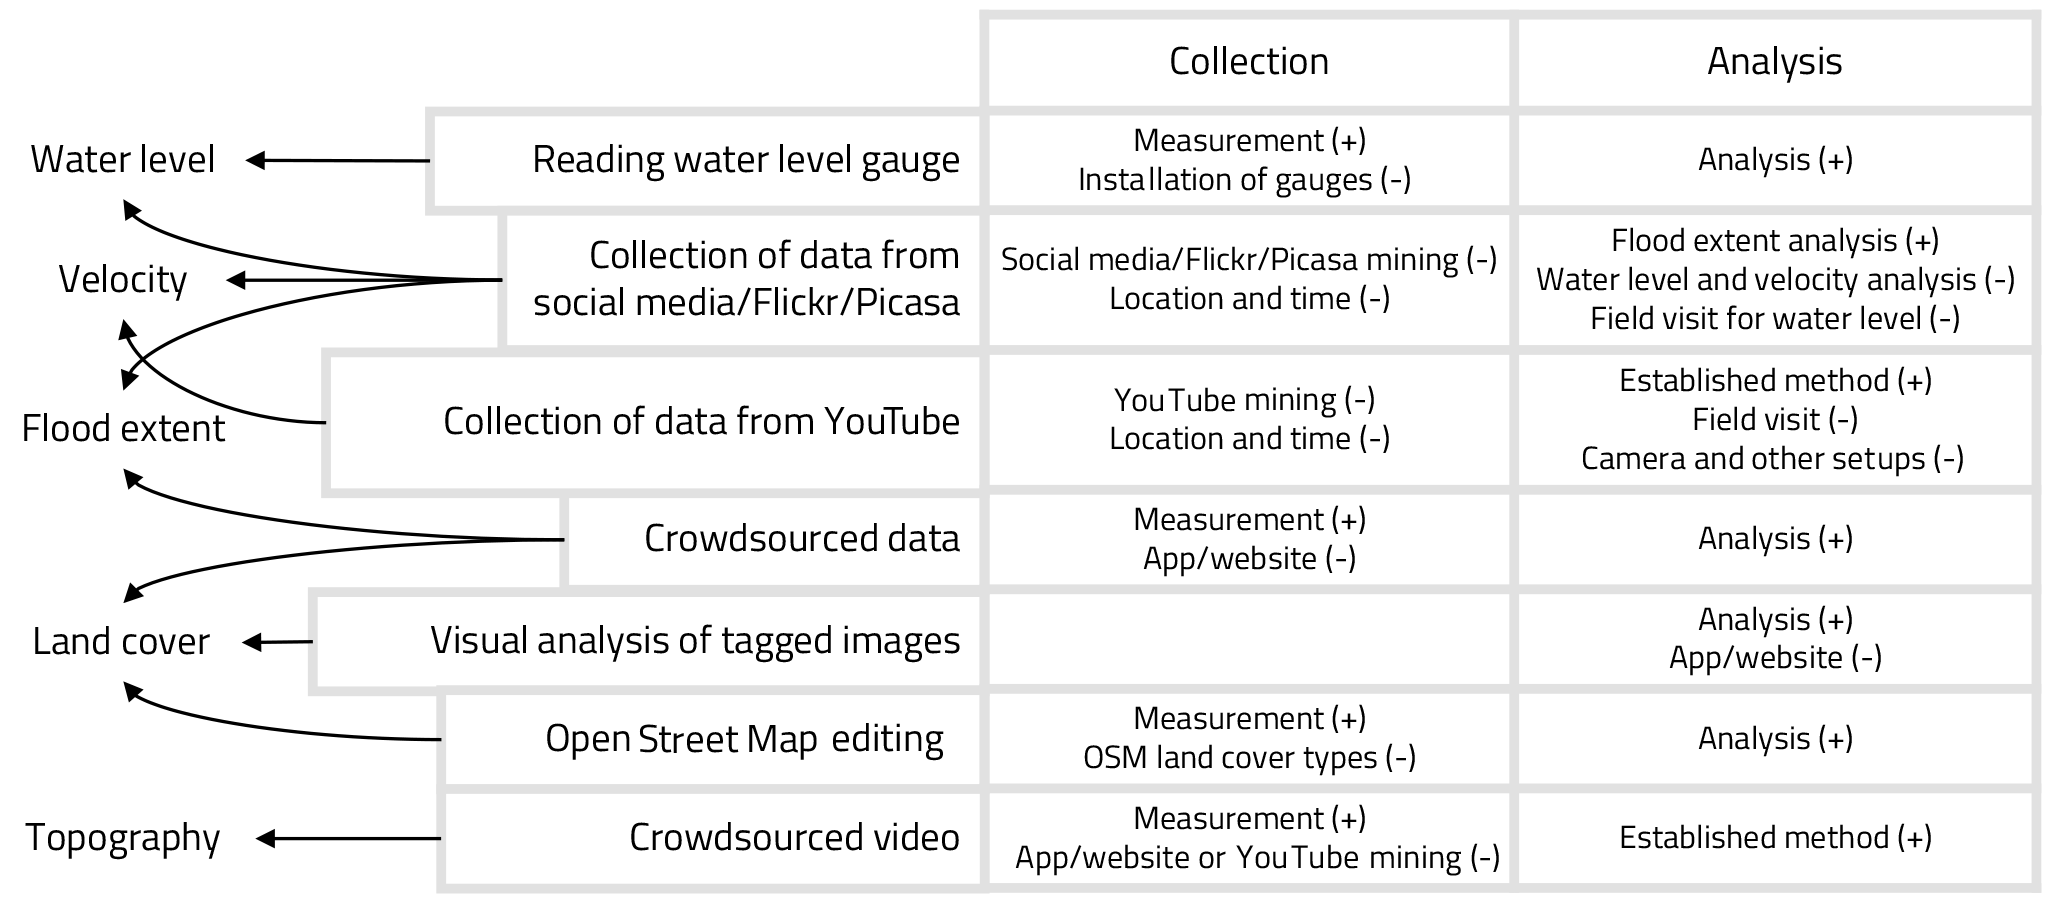
Figure 6Pros and cons of collection and analysis methods used to collect flood-related data by citizens.
Related to this, previous subsections discussed in detail the methods for collection and analysis of flood-related data obtained through crowdsourcing. For example, water level data obtained by reading a water level gauge is easy to collect and easy to analyse. On the other hand, it requires the installation of gauges (Fig. 6). In summary, whenever data are collected from the internet, there is the disadvantage of needing social media/photo sharing services mining, entailing computational efforts and dealing with a high percentage of data that is not georeferenced or time-stamped. Further, in the case of water level and velocity, some studies suggest that field visits are also necessary and the methods for analysing data are complex. Considering crowdsourced data on land cover and topography, it is straightforward to measure and analyse them, although their delivery to the interested parties may require a smartphone app or a website to be set up and maintained (with the exception of OpenStreetMap).
By concentrating on the studies in which modelling was performed, we explore in detail how crowdsourced data were integrated into each component of flood models.
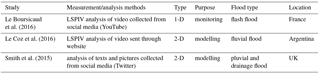
Table 5Scientific literature on crowdsourced data used in flood modelling.
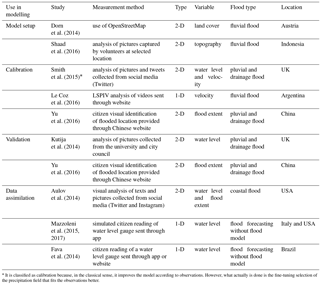
* It is classified as calibration because, in the classical sense, it improves the model according to observations. However, what actually is done is the fine-tuning selection of the precipitation field that fits the observations better.
There is a variety of flood models developed to deal with different types of floods, including fluvial, pluvial, coastal and drainage floods. The main driver of fluvial, pluvial and coastal floods is respectively upstream river discharge, precipitation and storm surges. In urban drainage floods, the flows inside, through and outside of drainage systems are pivotal for flood representation. Moreover, there are complex cases where more than one flood process needs to be represented. Although in physically based flood models water flow is computed by the same principles, different sets of data are needed for different types of flood models. We focus on a general hydrodynamic model definition and its common inputs but present the flood types evaluated in the scientific literature (Table 5).
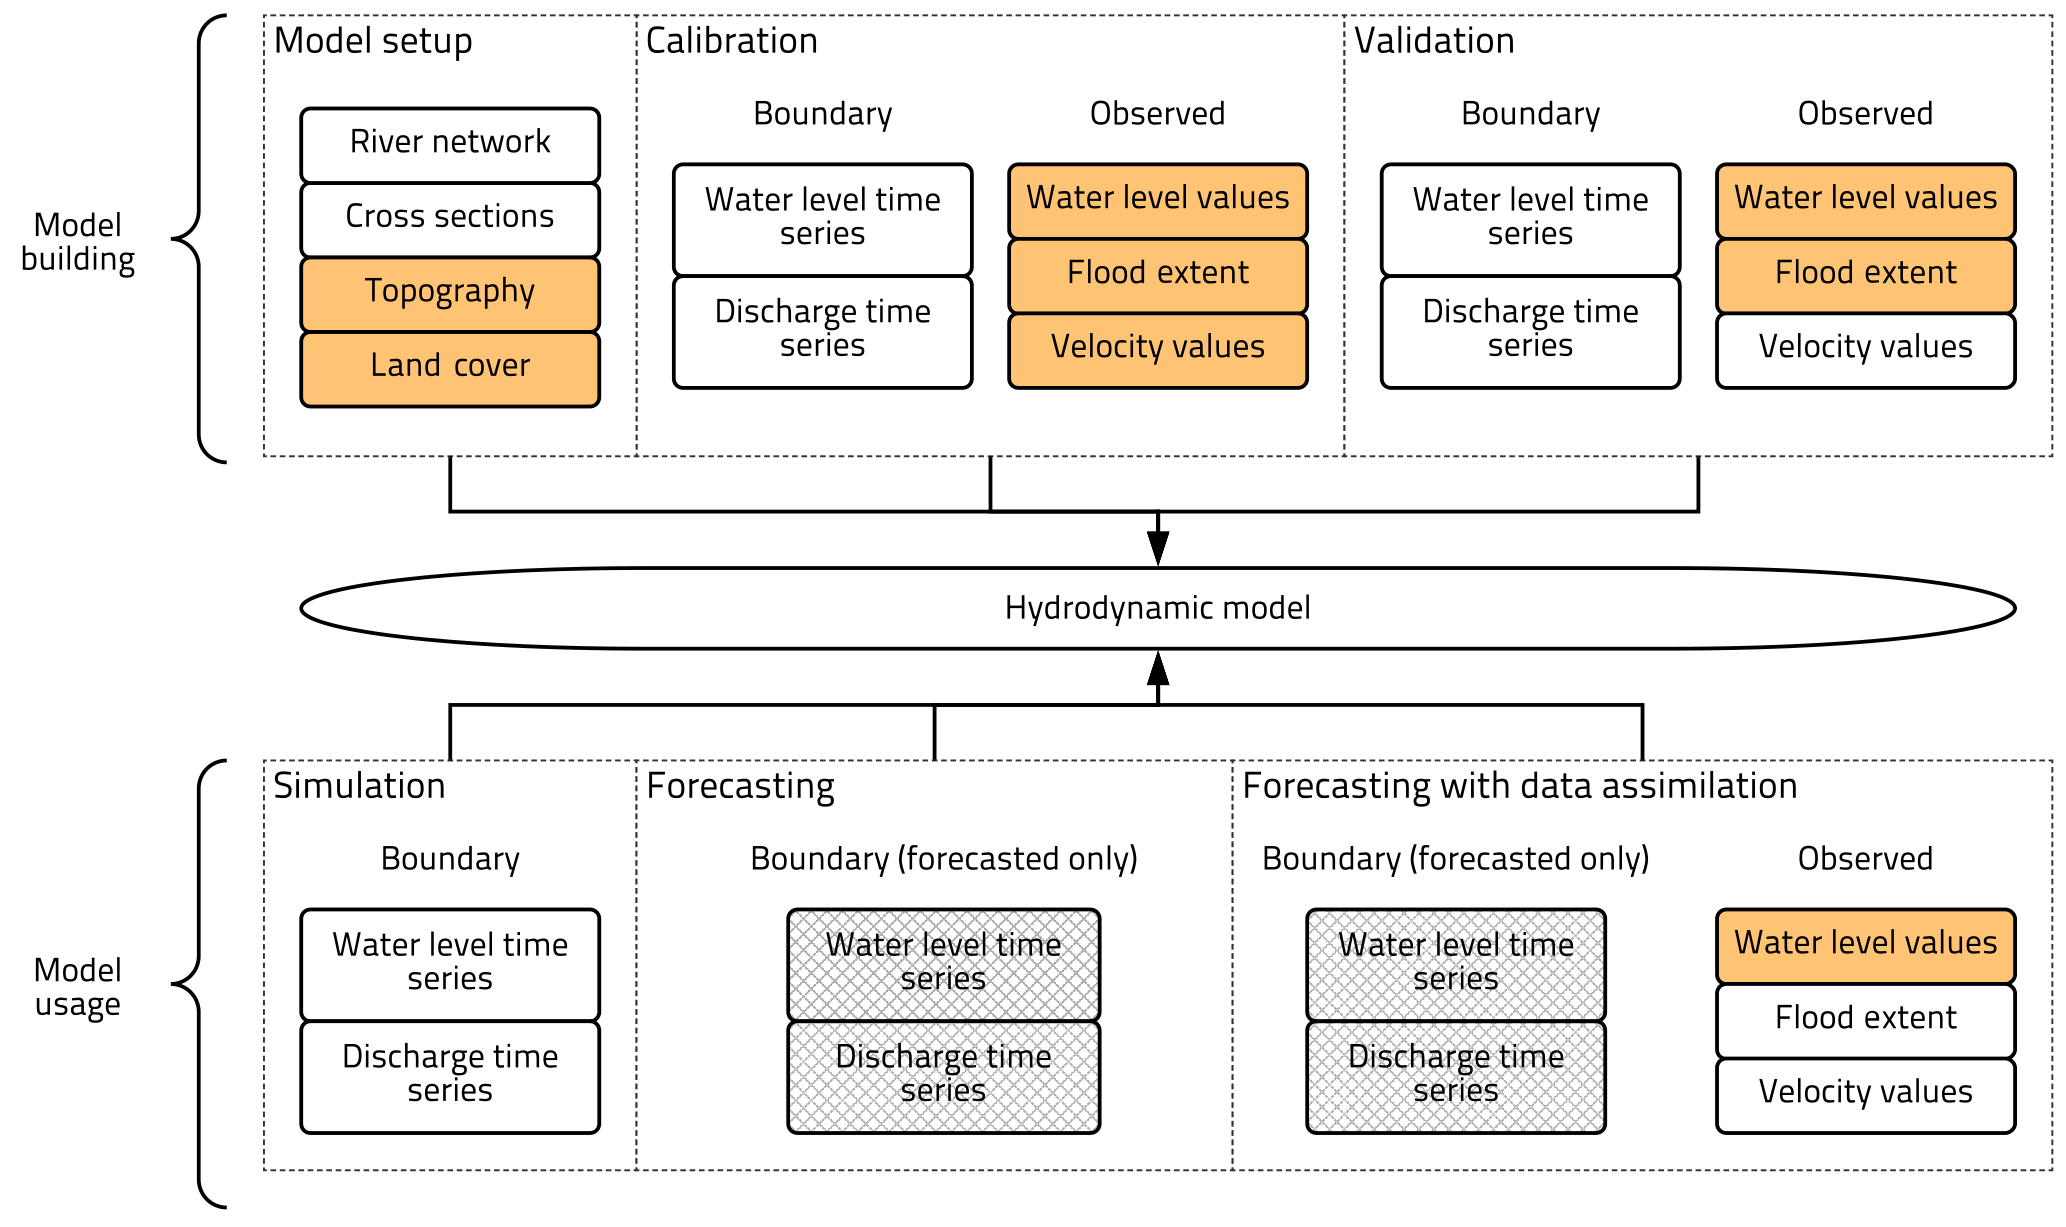
Figure 7Flood models data requirements. Orange-coloured tiles correspond to data that citizens have contributed to in a flood modelling context and gridded tiles correspond to data citizens cannot contribute to (forecasted water levels and discharges).
The flood modelling process typically has two parts: model building and model usage (Fig. 7). Model building starts by defining the model setup (boundary conditions, parameters, schematisation, input data), followed by calibration and validation of the water level and velocity fields (dependent variables) with observed values. Calibration and validation can be performed for both simulation and forecasting models. Once the model is ready, simulations can be run by using different boundary conditions or introducing measures designed for better flood management; also, forecasts can be made by using forecasted water levels or discharges as boundaries. In a simulation setting, model parameters are assumed to be constant in time, while in a forecasting setting the parameters, inputs or states (water levels) can be updated while the model is in use, using data assimilation.
In the studies analysed (Table 5), three consider 1-D channels and the others worked in a 2-D setting. Most of them analyse only one variable, except Smith et al. (2015), who evaluate water level and velocity. Moreover, most of them model urban floods, some in a pluvial or fluvial context.
Considering model building, specifically the model setup, citizens contributed to improving/updating land cover (and consequently roughness) and topography information. Dorn et al. (2014) used the land cover information contained in OpenStreetMap for modelling a fluvial flood. They do not analyse how many observations were made by the citizens, and data processing is restricted to attributing land cover classes to the features displayed in the maps. In the study of Shaad et al. (2016), which addresses topography, there is only one citizen contribution (low-cost alternative) in one selected location that is merged with an existing DEM and then used in the model. In both cases, the objective was to compare the performance of this low-cost alternative against the performance of consolidated technologies when used for hydrodynamic simulations.
Crowdsourced data have also been used to calibrate and validate flood models in four studies. One study gathered such data through social media and public image repositories mining and the others through data uploaded by citizens on specific platforms. Smith et al. (2015) identified storm events through social media, triggering shock-capturing hydrodynamic model runs with various rainfall intensities. The results were compared with social media data on water level/velocity. The comparison consisted of defining a buffer zone around the crowdsourced observation location, built a histogram of simulated cell values within it and evaluating the overlap of crowdsourced value/range and the histogram 70th–95th percentile range. As most citizen contributions did not have a water level/velocity value, they received a minimum water level value. Because of that, the selected simulation was the one with more “overlaps” and would not perform better than a simulation with slightly higher rainfall. Yu et al. (2016) collected flooded data through a Chinese website and divided it into calibration and validation data sets for pluvial flood model verification. There is no mentioning on how these data are provided (e.g. text or image). Le Coz et al. (2016) obtained a discharge value for calibration of a hydraulic model based on the surface velocity data obtained by a video uploaded to a specific website. Kutija et al. (2014) collected pictures uploaded by citizens and extracted water levels from them by comparison with reference objects, such as cars (no further detailing on the method of extraction is made). Water level data are then used to validate a pluvial flood model.
The described approaches so far consider citizen data for model building and their possible extension for recalibration and revalidation. Four studies went one step further, integrating crowdsourced data in model usage. Mazzoleni et al. (2015, 2017) used synthetically generated data to represent citizen observations, which were incorporated in the model through data assimilation algorithms, adapted to deal with the intermittent nature of crowdsourced data. Aulov et al. (2014) and Fava et al. (2014) also used the data for simulation/data assimilation, but the methods used are not detailed in the studies. However, the studies of Mazzoleni et al. (2015, 2017) and Fava et al. (2014) were made for flood forecasting through hydrological models and not using hydrodynamic models.
Table 6Data properties currently required in the modelling process.
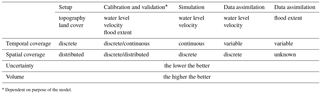
* Dependent on purpose of the model.
3.1 Crowdsourced data information content
If we aim to integrate data into a model, data accuracy, volume and temporal and spatial coverage should be at certain levels. When these data properties are inadequate, data integration will not provide useful results (i.e. the model performance can be low). Although most modelling variables vary in time and space, the data does not need to cover all dimensions in all parts of the modelling process. For instance, in model setup, topographic data are not needed every 15 min, hour or day; they can be provided with discrete time coverage, from months to years. We analyse four data properties: temporal coverage, spatial coverage, volume and uncertainty (Table 6). Although the same for all parts, the last two properties vary significantly when analysing the information content of crowdsourced data, which is why these properties are included (Table 6).
Analysing crowdsourcing studies by their information content, it is possible to draw the following conclusions:
-
Model setup: for integration of topographic and land cover data, it is necessary to have spatially distributed data. While this has been achieved within land cover studies, there is only one study involving topography and the data obtained so far have discrete spatial coverage.
-
Calibration and validation: through mining and crowdsourcing of water level and flood extent estimates, spatially distributed crowdsourced data have already been obtained for calibration/validation of simulation models. The accuracy of the time stamp was considered vital (Kutija et al., 2014), and results in time have a preliminary good level of agreement with citizen observations (Yu et al., 2016). However, even though these studies compare the results with citizen observations in time, this is done qualitatively and there is no focus on reporting and evaluating the temporal coverage.
-
Simulation: traditional modelling efforts require time series of data at specific frequencies, which has only been achieved through crowdsourcing in the realm of community-based approaches, in which water levels are measured at 06:00 and 18:00 in agreement with the community (Walker et al., 2016). However, this type of data has been only monitored and not used in a modelling context so far.
-
Data assimilation: it generally assimilates data provided with a fixed time frequency, but there are a few studies that consider intermittent data to be assimilated (Mazzoleni et al., 2015, 2017). However, similarly to simulation, the temporal coverage of crowdsourced data is insufficient for data assimilation efforts.
Considering uncertainty, this is highly dependent on the collection/analysis method. For example, obtaining water level values from pictures of flooded areas (2-D) is uncertain, as it mostly involves selecting what constitutes a good reference point, decided by the citizen. Flood extent, on the other hand, tends to be less uncertain to measure, due to its binary nature. The collection through data mining (and sometimes crowdsourcing) has, in general, more sources of uncertainty: from geotagging, time stamping and the observed value. To deal with the first two, Aulov et al. (2014) used only data that contained proper geotags and time stamps. Kutija et al. (2014) classified non-time-stamped data as during or after the event, based on picture visual inspection, defining an observation time range. Smith et al. (2015) dealt with uncertainty in location by generating a histogram of simulated values around the observed point. Yu et al. (2016) acknowledged these sources of uncertainty. Regarding uncertainty in value, existent in all sources of crowdsourced data, most studies used the (processed) observations as they were, without indication of uncertainty. Smith et al. (2015) defined ranges, although these are not discussed. Mazzoleni et al. (2015, 2017), used uncertain synthetic crowdsourced data with variable uncertainty.
Regarding volume of data collected, this is an issue for all modelling processes, although data mining has again been able to provide better coverage. Despite this positive aspect, data mining is so far limited to certain variables (water level, flood extent and velocity) and to data generated on public interest, such as extreme conditions. Some of the studies were proof of concepts and integrated up to three crowdsourced observations each (Le Coz et al., 2016; Fava et al.; 2014; Shaad et al., 2016). Others ranged from 12 to 298 observations (Kutija et al., 2014; Smith et al., 2015; Yu et al., 2016), and in some cases it was not possible to define the exact number of observations (Aulov et al., 2014; Dorn et al., 2014).
In recent years, the interest in citizen science and the number of citizen science studies in the water resources context has risen considerably. The main factors affecting its use in flood modelling are the degree of how difficult it is to acquire and evaluate these data and their integration into the models. Our analysis of the existing literature allows for pointing out a number of positive experiences from which we can derive opportunities to
-
explore and improve the existing methods to obtain water velocity and topography from videos;
-
explore calibration and validation employing data collected through social media in urban environments;
-
explore the possibilities of setting up the models with the use of land cover maps validated with citizen science;
-
make use of apps/websites already developed for citizen science.
The first one is based on small-scale but successful studies related to using well-developed techniques in citizen science scenarios. The relevant experience in data gathering and analysis can be updated to fit the needs of flood modelling. Also, the mining of social media and public image repositories has proved to be successful in calibration and validation in modelling studies, proving the concept and allowing for investigation into how large this contribution is. As mentioned previously, in the field of land cover map generation, citizen data have been used to validate maps and this successful example could be used to obtain new roughness maps in a modelling context. Lastly, technological development of apps, websites and techniques could be shared and put to public use, to be tested further and to avoid duplicated work.
There are aspects of the integration of crowdsourced data into flood modelling that are still challenging. These are as follows:
-
exploring the use of citizens as data interpreters;
-
improving methods to estimate water level from pictures;
-
harmonising the time frequency and spatial distribution of models with the ones of crowdsourced data;
-
quantifying uncertainty;
-
increasing the volume of data gathered, mainly in non-urban environments.
Most of the studies analysed treat the citizen as a sensor, with the exception of studies about land-cover-related data, in which the citizen also acts as an interpreter. For other variables, some studies have already started evaluating the ability of citizens to provide interpreted information (Degrossi et al., 2014), but these are few. Regarding water levels, readings from rulers and extraction from pictures are described differently in the literature, with varying degrees of thoroughness, indicating a need for development and testing of water level measurement methodologies in the context of citizen contributions. The third point brings up a challenge that concerns not only citizen science but also modelling: what is the necessary temporal and spatial distribution? Is the traditional modelling approach definitive in terms of data requirements and should citizen science approaches adapt to it, or can the modelling process be adapted to receive citizen science data? The fourth challenge relates to the quality of data and, again, in the area of global land cover maps some articles have already discussed the subject (Foody et al., 2013); however, when modelling is concerned, the crowdsourced data are treated as traditional data and the issue of quality is recognised as an issue but is hardly addressed. To what extent does this assumption hold? What is the uncertainty in citizen science data? Lastly, there is a challenge mentioned by many studies but not really addressed directly: the volume of data. Although the volume of data necessary depends on the objective of the modelling effort, the volume of crowdsourced data tends to be low, lacking temporal/spatial coverage for integration into models. This leads to the question of how to increase the volume of data. Considering this limitation, it is also natural to move towards the question of how much data are needed to improve the model significantly.
Application of citizen science in modelling brings the extra challenge of being interdisciplinary. Among similar technical fields (e.g. geosciences and hydrodynamic modelling) there is the issue of technology transfer to be addressed, and there are discussions on underlying assumptions and uncertainties that need to be considered. Additionally, hard and soft sciences are very linked, as the quality and value of the citizen observations and their temporal/spatial coverage are intrinsically related to social drivers such as why citizens engage, for how long, with which frequency and what is the role of various stakeholders.
Citizen science has successfully made its way into many scientific domains, and it is only fair that the contribution of citizens to modelling floods is also investigated, due to related intensive data needs. Analysis of literature clearly shows an increasing number of scientific studies in this area. Successful examples of using existing measurement and analysis methods (e.g. velocity and land cover) and of modelling floods with citizen science data (e.g. social media mining) have been published and are seen as a good basis for further exploration. There is a clear need to standardise and consolidate methodologies and there are challenges involving temporal and spatial distribution of data, uncertainty and volume.
It can be observed that the role of citizen contributions is not only to provide information about the current state of the environment, in monitoring and mapping studies; it is also to provide data that can be used in modelling and forecasting. Studies reviewed in this article show that crowdsourced data can be integrated: in model building to improve their overall performance, and directly into models (by data assimilation) to improve immediate forecasts. These are promising studies, though still too few, and they highlight the need for further work in this direction. The integration of crowdsourced data into flood models is a viable way to help solve issues of data scarcity, with greater potential in ungauged catchments and systems subject to change (e.g. climate change).
One of the challenges worth mentioning is the integration of citizen data with other more traditional data sources like gauging and remote sensing. It is also necessary to analyse cases in which citizens are involved at higher levels of engagement (e.g. participating in the problem definition, analysis of results and even in the decision-making process) and to evaluate the trade-off between model data needs and levels of engagement. The active involvement of citizens may lead to more data collected, which in turn may lead to more involvement and subsequently, to improved modelling of floods.
Finally, there is the challenge of making citizen contributions valuable at a time when automation is gaining increasing space. One may say that citizens are not needed because of automated sensors. At the same time, there are situations where crowdsourced data are very valuable. One of the non-technical challenges that we see here is to demonstrate such situations and increase acceptance of crowdsourced data by water managers.
This work was carried out with partial funding from the Horizon 2020
European Union project SCENT (Smart Toolbox for Engaging Citizens into
a People-Centric Observation Web), under grant no. 688930.
Edited by: Anas Ghadouani
Reviewed by: three
anonymous referees
Albrecht, F., Zussner, M., Perger, C., Durauer, M., See, L., McCallum, I., Fritz, S., and Kainz, W.: Using student volunteers to crowdsource land cover information, in: GI_Forum 2014. Geospatial Innovation for Society – Conference Proceedings, edited by: Vogler, R., Car, A., Strobl, J., and Griesebner, G., Austrian Academy of Sciences Press, Vienna, Austria, 314–317, 2014.
Alfonso, L., Lobbrecht, A., and Price, R.: Using mobile phones to validate models of extreme events, in: 9th International Conference on Hydroinformatics, Tianjin, China, 1447–1454, 2010.
Alfonso, L., Chacón, J. C., and Peña-Castellanos, G.: Allowing citizens to effortlessly become rainfall sensors, in: E-proceedings of the 36th IAHR World Congress, The Hague, the Netherlands, 28 June–3 July, 2015.
Aspuru, I., García, I., Herranz, K., and Santander, A.: CITI-SENSE: methods and tools for empowering citizens to observe acoustic comfort in outdoor public spaces, Noise Mappin, 3, 37–48, https://doi.org/10.1515/noise-2016-0003, 2016.
Aulov, O., Price, A., and Halem, M.: AsonMaps: a platform for aggregation visualization and analysis of disaster related human sensor network observations, in: ISCRAM 2014 Proceedings – 11th International Conference on Information Systems for Crisis Response and Management, Pennsylvania, USA, 2014.
Buytaert, W., Zulkafli, Z., Grainger, S., Acosta, L., Alemie, T. C., Bastiaensen, J., De Bièvre, B., Bhusal, J., Clark, J., Dewulf, A., Foggin, M., Hannah, D. M., Hergarten, C., Isaeva, A., Karpouzoglou, T., Pandeya, B., Paudel, D., Sharma, K., Steenhuis, T., Tilahun, S., Van Hecken, G., and Zhumanova, M.: Citizen science in hydrology and water resources: opportunities for knowledge generation, ecosystem service management, and sustainable development, Front. Earth Sci., 2, 26, https://doi.org/10.3389/feart.2014.00026, 2014.
Cervone, G., Sava, E., Huang, Q., Schnebele, E., Harrison, J., and Waters, N.: Using Twitter for tasking remote-sensing data collection and damage assessment: 2013 Boulder flood case study, Int. J. Remote Sens., 37, 100–124, https://doi.org/10.1080/01431161.2015.1117684, 2016.
Conrad, C. C. and Hilchey, K. G.: A review of citizen science and community-based environmental monitoring: issues and opportunities, Environ. Monit. Assess., 176, 273–291, https://doi.org/10.1007/s10661-010-1582-5, 2011.
Craglia, M., Ostermann, F., and Spinsanti, L.: Digital Earth from vision to practice: making sense of citizen-generated content, Int. J. Digit. Earth, 5, 398–416, https://doi.org/10.1080/17538947.2012.712273, 2012.
Dashti, S., Palen, L., Heris, M. P., Anderson, K. M., Anderson, T. J., and Anderson, S.: Supporting disaster reconnaissance with social media data?: a design-oriented case study of the 2013 Colorado floods, in: Proceedings of the 11th International ISCRAM Conference, Pennsylvania, USA, May 2014, 632–641, 2014.
de Vos, L., Leijnse, H., Overeem, A., and Uijlenhoet, R.: The potential of urban rainfall monitoring with crowdsourced automatic weather stations in Amsterdam, Hydrol. Earth Syst. Sci., 21, 765–777, https://doi.org/10.5194/hess-21-765-2017, 2017.
Degrossi, L. C., Porto De Albuquerque, J., Fava, M. C., and Mendiondo, E. M.: Flood Citizen Observatory?: a crowdsourcing-based approach for flood risk management in Brazil, in: Proceedings of the International Conference on Software Engineering and Knowledge Engineering, SEKE, 570–575, 2014.
Di Baldassarre, G., Schumann, G., Brandimarte, L., and Bates, P.: Timely low resolution SAR imagery to support floodplain modelling: a case study review, Surv. Geophys., 32, 255–269, https://doi.org/10.1007/s10712-011-9111-9, 2011.
Dong, J., Xiao, X., Sheldon, S., Biradar, C., Duong, N. D., and Hazarika, M.: A comparison of forest cover maps in mainland Southeast Asia from multiple sources: PALSAR, MERIS, MODIS and FRA, Remote Sens. Environ., 127, 60–73, https://doi.org/10.1016/j.rse.2012.08.022, 2012.
Dorn, H., Vetter, M., and Höfle, B.: GIS-based roughness derivation for flood simulations: a comparison of orthophotos, LiDAR and crowdsourced geodata, Remote Sens.-Basel, 6, 1739–1759, https://doi.org/10.3390/rs6021739, 2014.
Evers, M., Jonoski, A., Almoradie, A., and Lange, L.: Environmental science and policy collaborative decision making in sustainable flood risk management?: a socio-technical approach and tools for participatory governance, Environ. Sci. Policy, 55, 335–344, https://doi.org/10.1016/j.envsci.2015.09.009, 2016.
Fava, M. C., Santana, G., Bressiani, D. A., Rosa, A., Horita, F. E. A., and Mendiondo, E. M.: Integration of information technology systems for flood forecasting with hybrid data sources, in: 6th International Conference on Flood Management, 1–11, São Paulo, Brazil, 16–18 September 2014, 2014.
Fohringer, J., Dransch, D., Kreibich, H., and Schröter, K.: Social media as an information source for rapid flood inundation mapping, Nat. Hazards Earth Syst. Sci., 15, 2725–2738, https://doi.org/10.5194/nhess-15-2725-2015, 2015.
Foody, G. M., See, L., Fritz, S., Van der Velde, M., Perger, C., Schill, C., and Boyd, D. S.: Assessing the accuracy of Volunteered Geographic Information arising from multiple contributors to an internet based collaborative project, T. GIS, 17, 847–860, https://doi.org/10.1111/tgis.12033, 2013.
Friedrichs, A., Busch, J. A., Henkel, R., Heuermann, R., John, C., and Zielinski, O.: Measuring fluorescence by means of smartphones with the new Citclops-Application, in: Ocean Optics XXII, Portland, USA, 26–31 October 2014, 2014.
Fritz, S., McCallum, I., Schill, C., Perger, C., Grillmayer, R., Achard, F., Kraxner, F., and Obersteiner, M.: Geo-Wiki.Org: the use of crowdsourcing to improve global land cover, Remote Sens.-Basel, 1, 345–354, https://doi.org/10.3390/rs1030345, 2009.
Fritz, S., McCallum, I., Schill, C., Perger, C., See, L., Schepaschenko, D., van der Velde, M., Kraxner, F., and Obersteiner, M.: Geo-Wiki: an online platform for improving global land cover, Environ. Modell. Softw., 31, 110–123, https://doi.org/10.1016/j.envsoft.2011.11.015, 2012.
Gallart, F., Llorens, P., Latron, J., Cid, N., Rieradevall, M., and Prat, N.: Validating alternative methodologies to estimate the regime of temporary rivers when flow data are unavailable, Sci. Total Environ., 565, 1001–1010, https://doi.org/10.1016/j.scitotenv.2016.05.116, 2016.
Gharesifard, M. and Wehn, U.: To share or not to share: drivers and barriers for sharing data via online amateur weather networks, J. Hydrol., 535, 181–190, https://doi.org/10.1016/j.jhydrol.2016.01.036, 2016.
Grimaldi, S., Li, Y., Pauwels, V. R. N., and Walker, J. P.: Remote sensing-derived water extent and level to constrain hydraulic flood forecasting models: opportunities and challenges, Surv. Geophys., 37, 977–1034, https://doi.org/10.1007/s10712-016-9378-y, 2016.
Haklay, M.: Citizen Science and Volunteered Geographic Information: overview and typology of participation, in: Crowdsourcing Geographic Knowledge: Volunteered Geographic Information (VGI) in Theory and Practice, edited by: Sui, D., Elwood, S., and Goodchild, M., 105–122, Springer Netherlands, 2013.
Hamshaw, S. D., Bryce, T., Rizzo, D. M., O'Neil-Dunne, J., Frolik, J., and Dewoolkar, M. M.: Quantifying streambank movement and topography using unmanned aircraft system photogrammetry with comparison to terrestrial laser scanning, River Res. Appl., 33, 1354–1367, https://doi.org/10.1002/rra.3183, 2017.
Heipke, C.: Crowdsourcing geospatial data, ISPRS J. Photogramm., 65, 550–557, https://doi.org/10.1016/j.isprsjprs.2010.06.005, 2010.
Higgins, C. I., Williams, J., Leibovici, D. G., Simonis, I., Davis, M. J., Muldoon, C., Van Genuchten, P., and O'Hare, G.: Citizen OBservatory WEB (COBWEB): a generic infrastructure platform to facilitate the collection of citizen science data for environmental monitoring, Int. J. Spat. Data Infrastructures Res., 11, 20–48, https://doi.org/10.2902/1725-0463.2016.11.art3, 2016.
Hochmair, H. H. and Zielstra, D.: Analysing user contribution patterns of drone pictures to the dronestagram photo sharing portal, J. Spat. Sci., 60, 79–98, https://doi.org/10.1080/14498596.2015.969340, 2015.
Horita, F. E. A., Degrossi, L. C., Assis, L. F. F. G., Zipf, A., and Porto De Albuquerque, J.: The use of Volunteered Geographic Information and crowdsourcing in disaster management: a systematic literature review, in: Proceedings of the Nineteenth Americas Conference on Information Systems, Chicago, USA, 15–17 August 2013, 2013.
IDEM: Volunteer Stream Monitoring Training Manual, Hoosier Riverwatch Indiana Department of Environmental Management, Indianapolis, USA, 2015.
Iwao, K., Nishida, K., Kinoshita, T., and Yamagata, Y.: Validating land cover maps with Degree Confluence Project information, Geophys. Res. Lett., 33, L23404, https://doi.org/10.1029/2006GL027768, 2006.
Jiang, H., Feng, M., Zhu, Y., Lu, N., Huang, J., and Xiao, T.: An automated method for extracting rivers and lakes from Landsat imagery , Remote Sens.-Basel, 6, 5067–5089, https://doi.org/10.3390/rs6065067, 2014.
Johnson, P., Ricker, B., and Harrison, S.: Volunteered Drone Imagery: challenges and constraints to the development of an open shared image repository, in: HICSS '17 Proc. 50th Hawaii Int. Conf. Syst. Sci., 4–7 January 2017, 1995–2004, 2017.
Kim, S., Robson, C., Zimmerman, T., Pierce, J., and Haber, E. M.: Creek watch: pairing usefulness and usability for successful citizen science, in: Proceedings of the 2011 Annual Conference on Human Factors in Computing Systems – CHI '11, p. 2125, ACM Press, New York, USA, 7–12 May 2011, 2011.
Klonner, C., Marx, S., Usón, T., Porto de Albuquerque, J., and Höfle, B.: Volunteered geographic information in natural hazard analysis: a systematic literature review of current approaches with a focus on preparedness and mitigation, ISPRS Int. J. Geo-Inf., 5, 103, https://doi.org/10.3390/ijgi5070103, 2016.
Kotovirta, V., Toivanen, T., Järvinen, M., Lindholm, M., and Kallio, K.: Participatory surface algal bloom monitoring in Finland in 2011–2013, Environ. Syst. Res., 3, 24, https://doi.org/10.1186/s40068-014-0024-8, 2014.
Kutija, V., Bertsch, R., Glenis, V., Alderson, D., Parkin, G., Walsh, C. L., Robinson, J., and Kilsby, C.: Model validation using crowd-sourced data from a large pluvial flood, in: 11th International Conference on Hydroinformatics, New York, USA, 17–21 August 2014, 2014.
Le Boursicaud, R., Pénard, L., Hauet, A., Thollet, F., and Le Coz, J.: Gauging extreme floods on YouTube: application of LSPIV to home movies for the post-event determination of stream discharges, Hydrol. Process., 30, 90–105, https://doi.org/10.1002/hyp.10532, 2016.
Le Coz, J., Patalano, A., Collins, D., Guillén, N. F., García, C. M., Smart, G. M., Bind, J., Chiaverini, A., Le Boursicaud, R., Dramais, G., and Braud, I.: Crowdsourced data for flood hydrology: feedback from recent citizen science projects in Argentina, France and New Zealand, J. Hydrol., 541, 766–777, https://doi.org/10.1016/j.jhydrol.2016.07.036, 2016.
Leibovici, D. G., Evans, B., Hodges, C., Wiemann, S., Meek, S., Rosser, J., and Jackson, M.: On data quality assurance and conflation entanglement in crowdsourcing for environmental studies, ISPRS Ann. Photogramm. Remote Sens. Spat. Inf. Sci., II-3/W5, 195–202, https://doi.org/10.5194/isprsannals-II-3-W5-195-2015, 2015.
Lesiv, M., Moltchanova, E., Schepaschenko, D., See, L., Shvidenko, A., Comber, A., and Fritz, S.: Comparison of data fusion methods using crowdsourced data in creating a hybrid forest cover map, Remote Sens.-Basel, 8, 261, https://doi.org/10.3390/rs8030261, 2016.
Li, Z., Wang, C., Emrich, C. T., and Guo, D.: A novel approach to leveraging social media for rapid flood mapping: a case study of the 2015 South Carolina floods, Cartogr. Geogr. Inf. Sc., 45, 97–110, https://doi.org/10.1080/15230406.2016.1271356, 2017.
Lintott, C. J., Schawinski, K., Slosar, A., Land, K., Bamford, S., Thomas, D., Raddick, M. J., Nichol, R. C., Szalay, A., Andreescu, D., Murray, P., and Vandenberg, J.: Galaxy Zoo: morphologies derived from visual inspection of galaxies from the Sloan Digital Sky Survey, Mon. Not. R. Astron. Soc., 389, 1179–1189, https://doi.org/10.1111/j.1365-2966.2008.13689.x, 2008.
Lowry, C. S. and Fienen, M. N.: CrowdHydrology: crowdsourcing hydrologic data and engaging citizen scientists, Ground Water, 51, 151–156, https://doi.org/10.1111/j.1745-6584.2012.00956.x, 2013.
Mazzoleni, M., Alfonso, L., Chacon-Hurtado, J., and Solomatine, D.: Assimilating uncertain, dynamic and intermittent streamflow observations in hydrological models, Adv. Water Resour., 83, 323–339, https://doi.org/10.1016/j.advwatres.2015.07.004, 2015.
Mazzoleni, M., Verlaan, M., Alfonso, L., Monego, M., Norbiato, D., Ferri, M., and Solomatine, D. P.: Can assimilation of crowdsourced data in hydrological modelling improve flood prediction?, Hydrol. Earth Syst. Sci., 21, 839–861, https://doi.org/10.5194/hess-21-839-2017, 2017.
McDougall, K.: Using volunteered information to map the Queensland floods, in: Surveying and Spatial Science Biennial Conference, Wellington, New Zealand, 21–25 November 2011, 13–23, 2011.
McDougall, K. and Temple-Watts, P.: The use of LidAR and Volunteered Geographic Information to map flood extents and inundation, in: ISPRS Annals of Photogrammetry, Remote Sensing and Spatial Information Sciences, Melbourne, Australia, 25 August–1 September 2012, 251–256, 2012.
Merkuryeva, G., Merkuryev, Y., Sokolov, B. V., Potryasaev, S., Zelentsov, V. A., and Lektauers, A.: Advanced river flood monitoring, modelling and forecasting, J. Comput. Sci.-Neth., 10, 77–85, https://doi.org/10.1016/j.jocs.2014.10.004, 2015.
Michelsen, N., Dirks, H., Schulz, S., Kempe, S., Al-Saud, M., and Schüth, C.: YouTube as a crowd-generated water level archive, Sci. Total Environ., 568, 189–195, https://doi.org/10.1016/j.scitotenv.2016.05.211, 2016.
Miller-Rushing, A., Primack, R., and Bonney, R.: The history of public participation in ecological research, Front. Ecol. Environ., 10, 285–290, https://doi.org/10.1890/110278, 2012.
Montargil, F. and Santos, V.: Citizen observatories: concept, opportunities and communication with citizens in the first EU experiences, in: Beyond Bureaucracy: Towards Sustainable Governance Informatisation, edited by: Paulin, A. A., Anthopoulos, L. G., and Reddick, C. G., 167–184, Springer International Publishing, Cham., 2017.
Muller, C. L., Chapman, L., Johnston, S., Kidd, C., Illingworth, S., Foody, G., Overeem, A., and Leigh, R. R.: Crowdsourcing for climate and atmospheric sciences: current status and future potential, Int. J. Climatol., 35, 3185–3203, https://doi.org/10.1002/joc.4210, 2015.
Oxendine, C. E., Schnebele, E., Cervone, G., and Waters, N.: Fusing non-authoritative data to improve situational awareness in emergencies, in: Proceedings of the 11th International ISCRAM Conference, Pennsylvania, USA, May 2014 762–766, 762–766, 2014.
Padawangi, R., Turpin, E., Herlily, Prescott, M. F., Lee, I., and Shepherd, A.: Mapping an alternative community river: the case of the Ciliwung, Sustain. Cities Soc., 20, 147–157, https://doi.org/10.1016/j.scs.2015.09.001, 2016.
Poser, K. and Dransch, D.: Volunteered Geographic Information for disaster management with application to rapid flood damage estimation, Geomatica, 64, 89–98, 2010.
Rosser, J. F., Leibovici, D. G., and Jackson, M. J.: Rapid flood inundation mapping using social media, remote sensing and topographic data, Nat. Hazards, 87, 103–120, https://doi.org/10.1007/s11069-017-2755-0, 2017.
Salk, C. F., Sturn, T., See, L., Fritz, S., and Perger, C.: Assessing quality of volunteer crowdsourcing contributions: lessons from the Cropland Capture game, Int. J. Digit. Earth, 9, 410–426, https://doi.org/10.1080/17538947.2015.1039609, 2016.
Schnebele, E. and Cervone, G.: Improving remote sensing flood assessment using volunteered geographical data, Nat. Hazards Earth Syst. Sci., 13, 669–677, https://doi.org/10.5194/nhess-13-669-2013, 2013.
Schnebele, E., Cervone, G., Kumar, S., and Waters, N.: Real time estimation of the Calgary floods using limited remote sensing data, Water, 6, 381–398, https://doi.org/10.3390/w6020381, 2014.
See, L., Schepaschenko, D., Lesiv, M., McCallum, I., Fritz, S., Comber, A., Perger, C., Schill, C., Zhao, Y., Maus, V., Siraj, M. A., Albrecht, F., Cipriani, A., Vakolyuk, M., Garcia, A., Rabia, A. H., Singha, K., Marcarini, A. A., Kattenborn, T., Hazarika, R., Schepaschenko, M., van der Velde, M., Kraxner, F., and Obersteiner, M.: Building a hybrid land cover map with crowdsourcing and geographically weighted regression, ISPRS J. Photogramm., 103, 48–56, https://doi.org/10.1016/j.isprsjprs.2014.06.016, 2015a.
See, L., Fritz, S., Perger, C., Schill, C., McCallum, I., Schepaschenko, D., Duerauer, M., Sturn, T., Karner, M., Kraxner, F., and Obersteiner, M.: Harnessing the power of volunteers, the internet and Google Earth to collect and validate global spatial information using Geo-Wiki, Technol. Forecast. Soc., 98, 324–335, https://doi.org/10.1016/j.techfore.2015.03.002, 2015b.
See, L., Mooney, P., Foody, G., Bastin, L., Comber, A., Estima, J., Fritz, S., Kerle, N., Jiang, B., Laakso, M., Liu, H., Milčinski, G., Nikšič, M., Painho, M., Pódör, A., Olteanu-Raimond, A.-M., and Rutzinger, M.: Crowdsourcing, Citizen Science or Volunteered Geographic Information? The Current State of Crowdsourced Geographic Information, SPRS Int. J. Geo-Inf., 5, 55, https://doi.org/10.3390/ijgi5050055, 2016.
Shaad, K., Ninsalam, Y., Padawangi, R., and Burlando, P.: Towards high resolution and cost-effective terrain mapping for urban hydrodynamic modelling in densely settled river-corridors, Sustain. Cities Soc. 20, 168–179, https://doi.org/10.1016/j.scs.2015.09.005, 2016.
Smith, L., Liang, Q., James, P., and Lin, W.: Assessing the utility of social media as a data source for flood risk management using a real-time modelling framework, J. Flood Risk Manag., 10, 370–380, https://doi.org/10.1111/jfr3.12154, 2015.
Starkey, E., Parkin, G., Birkinshaw, S., Large, A., Quinn, P., and Gibson, C.: Demonstrating the value of community-based (“citizen science”) observations for catchment modelling and characterisation, J. Hydrol., 548, 801–817, https://doi.org/10.1016/j.jhydrol.2017.03.019, 2017.
Teng, J., Jakeman, A. J., Vaze, J., Croke, B. F. W., Dutta, D., and Kim, S.: Flood inundation modelling: a review of methods, recent advances and uncertainty analysis, Environ. Modell. Softw., 90, 201–216, https://doi.org/10.1016/j.envsoft.2017.01.006, 2017.
Uhrner, U., Grosso, G., Romain, A. C., Hutsemekers, V., Delva, J., Kunz, W., De Groof, A., Arnaud, Y., Valoggia, P., Johannsen, L., Stevenot, B., and Ledent, P.: Development of an environmental information system for odour using citizen and technology innovative sensors and advanced modeling, in: CEUR Workshop Proceedings, vol. 1322, Aachen, Germany, 2013.
Walker, D., Forsythe, N., Parkin, G., and Gowing, J.: Filling the observational void: scientific value and quantitative validation of hydrometeorological data from a community-based monitoring programme, J. Hydrol., 538, 713–725, https://doi.org/10.1016/j.jhydrol.2016.04.062, 2016.
Yang, Y. Y. and Kang, S. C.: Crowd-based velocimetry for surface flows, Adv. Eng. Inform., 32, 275–286, https://doi.org/10.1016/j.aei.2017.03.007, 2017.
Yu, D., Yin, J., and Liu, M.: Validating city-scale surface water flood modelling using crowd-sourced data, Environ. Res. Lett., 11, 124011, https://doi.org/10.1088/1748-9326/11/12/124011, 2016.
CAPTCHA stands for “Completely Automated Public Turing test to tell Computers and Humans Apart”. It is a test to evaluate whether the subject is human, which is used in websites to provide security. After the test is done the user can be asked to perform extra tasks, for example, tag images.
OpenStreetMap (OSM) is an online platform that provides street maps and other information. The maps provided can be edited by the users (including citizens) at any time.