the Creative Commons Attribution 4.0 License.
the Creative Commons Attribution 4.0 License.
 | 24 Apr 2018
Preferential flow systems amended with biogeochemical components: imaging of a two-dimensional study
Ashley R. Pales
Biting Li
Heather M. Clifford
Shyla Kupis
Nimisha Edayilam
Dawn Montgomery
Wei-zhen Liang
Mine Dogan
Nishanth Tharayil
Nicole Martinez
Stephen Moysey
Brian Powell
Christophe J. G. Darnault
The vadose zone is a highly interactive heterogeneous system through which water enters the subsurface system by infiltration. This paper details the effects of simulated plant exudate and soil component solutions upon unstable flow patterns in a porous medium (ASTM silica sand; US Silica, Ottawa, IL, USA) through the use of two-dimensional tank light transmission method (LTM). The contact angle (θ) and surface tension (γ) of two simulated plant exudate solutions (i.e., oxalate and citrate) and two soil component solutions (i.e., tannic acid and Suwannee River natural organic matter, SRNOM) were analyzed to determine the liquid–gas and liquid–solid interface characteristics of each. To determine if the unstable flow formations were dependent on the type and concentration of the simulated plant exudates and soil components, the analysis of the effects of the simulated plant exudate and soil component solutions were compared to a control solution (Hoagland nutrient solution with 0.01 M NaCl). Fingering flow patterns, vertical and horizontal water saturation profiles, water saturation at the fingertips, finger dimensions and velocity, and number of fingers were obtained using the light transmission method. Significant differences in the interface properties indicated a decrease between the control and the plant exudate and soil component solutions tested; specifically, the control (θ= 64.5∘ and γ= 75.75 mN m−1) samples exhibited a higher contact angle and surface tension than the low concentration of citrate (θ= 52.6∘ and γ= 70.8 mN m−1). Wetting front instability and fingering flow phenomena were reported in all infiltration experiments. The results showed that the plant exudates and soil components influenced the soil infiltration as differences in finger geometries, velocities, and water saturation profiles were detected when compared to the control. Among the tested solutions and concentrations of soil components, the largest finger width (10.19 cm) was generated by the lowest tannic acid solution concentration (0.1 mg L−1), and the lowest finger width (6.00 cm) was induced by the highest SRNOM concentration (10 mg L−1). Similarly, for the plant exudate solutions, the largest finger width (8.36 cm) was generated by the lowest oxalate solution concentration (0.1 mg L−1), and the lowest finger width (6.63 cm) was induced by the lowest citrate concentration (0.1 mg L−1). The control solution produced fingers with average width of 8.30 cm. Additionally, the wettability of the medium for the citrate, oxalate, and SRNOM solutions increased with an increase in concentration. Our research demonstrates that the plant exudates and soil components which are biochemical compounds produced and released in soil are capable of influencing the process of infiltration in soils. The results of this research also indicate that soil wettability, expressed as (cos θ)1∕2, should be included in the scaling of the finger dimension, i.e., finger width, when using the Miller and Miller (1956) scaling theory for the scaling of flow in porous media.


Infiltration of water in soil is a fundamental element of the hydrologic cycle (Horton, 1933). The infiltration process controls the existence of water and life at the soil–atmosphere interface, by controlling soil moisture (Rodriguez-Iturbe et al., 1999) and supporting vegetation (Liang et al., 1994). In addition to controlling soil moisture and plant life, soil controls deep drainage of infiltrated water, its rate, and its quality. The infiltration process is impacted by the physicochemical properties and biological activities that occur in the unsaturated zone of the soil (vadose zone), as well as human activities and the climate (Glass et al., 1991). Consequently, understanding the movement of water in soils is particularly valuable in terms of groundwater recharge and contaminant loading.
In general, water flow and contaminant transport in soil are heterogeneous (Bien et al., 2013; Wang et al., 2006). Preferential flow, which concentrates flow to a small fraction of a porous media (Hendrickx and Flury, 2001), has been the subject of numerous studies (e.g., Andreini and Steenhuis, 1990; Flury et al., 1994; Gerke et al., 2010; Glass et al., 1989a, b, c, d; Kung, 1990a; Ritsema et al., 1993; Simunek et al., 2003). There are several mechanisms that have been identified as contributors to preferential flow processes, such as macropore flow (e.g., connected and disconnected macropores, cracks, earthworm burrow, root channels) (Beven and Germann, 2013; Bouma and Dekker, 1978), fingered flow (i.e., wetting front/gravity-driven instability or “fingers”) (Glass et al., 1989c, d; Wang et al., 2003a), and funnel flow (e.g., layering or textural interfaces) (Kung, 1990a, b). Bypassing of the soil matrix during preferential flow produces the rapid transport of solutes and particles, thereby increasing risks to groundwater by reducing opportunities for natural attenuation of contaminants such as pesticides, nutrients, metals, pathogens, radionuclides, antimicrobials, and nonaqueous phase liquids (NAPLs) (Darnault et al., 2003, 2004; DiCarlo et al., 2000; Engelhardt et al., 2015; Jarvis et al., 2016; Kay et al., 2004; Kim et al., 2005; Nimmo, 2012; Uyusur et al., 2010, 2015). Therefore, understanding environmental factors that might increase the occurrence of preferential flow is of key importance. In this work we are specifically concerned about whether the presence of natural biologic (i.e., root) exudates contributes to the onset of unstable fingered flow.
The process of infiltration in soils is the particular interaction of the dynamics of fluid interfaces and flow in porous media, where infiltration is an overall downward movement of water into dry unsaturated soils, causing the formation of a gas–water interface, known as the “wetting front.” The nonlinear behavior of the relationship between the soil hydraulic properties and the soil moisture content sets the conditions for the development of the wetting front, but the classification of the wetting front propagation as stable or unstable is determined by the interplay between the two forces, capillarity and gravity (Cueto-Felgueroso and Juanes, 2008; Wallach et al., 2013). During a stable infiltration process leading into a homogeneous porous medium under a steady state flux condition at the surface, a stable wetting front moves downward as it is driven by gravity and stabilized by the surface tension resulting from capillary forces present in the porous medium. While in an unstable infiltration process leading into a homogeneous porous medium under steady state flow, it is when the gravity and capillary forces are nearly equal but opposite in magnitude that small irregularities, such as small heterogeneities (which are inevitable, even in a practically homogeneous medium), will lead to the condition where gravity dominates. At that point the unstable wetting front will occur and “fingers” are generated (Glass et al., 1989a, b, c; Hill and Parlange, 1972; Kapoor, 1996; Peck, 1965; Selker et al., 1992a, b). Once these fingered flow phenomena are generated, the flow area is decreased compared to that of the wetting front, and the flux velocities of the fingers increase tremendously (Wallach et al., 2013). Peck (1965) was the first to describe the formation of “tongues” of infiltrating water in sand columns and the entrapment of air below the wetting front. Hill and Parlange (1972) conducted the first systematic experiment to investigate the phenomenon of wetting front instability. The role and importance of fingered flow in contaminant transport has been demonstrated with several cases of groundwater contamination (e.g., Hillel, 1987; Steenhuis et al., 1990).
The nonlinearity of the governing equations for unsaturated flow through porous media makes a theoretical analysis of water movement in soils and wetting front instability in soils most challenging (Buckingham, 1907; Richards, 1931). Infiltration theories and the development of mathematical solutions to solve the problem of flow in porous media have been the subject of much research, most particularly the seminal works of John Philip (Philip, 1969, 1975) and Jean-Yves Parlange (e.g., Parlange, 1971a, b, c, 1972a, b). Further, Saffman and Taylor (1958) and Chouke et al. (1959) concluded that the development of wetting front instability resulted from unsaturated flow. Wetting front instability and resultant fingering flow phenomena can occur due to an increase in hydraulic conductivity with depth (Hill and Parlange, 1972; van Ommen et al., 1989), a decrease in soil wettability with depth (Hill and Parlange, 1972; Hillel, 1987; Philip, 1975; Raats, 1973), water repellency (Dekker and Ritsema, 1994; Ritsema et al., 1993; Ritsema and Dekker, 1994), a redistribution of infiltration after the end of rainfall or irrigation (Philip, 1975), air entrapment (Peck, 1965; Philip, 1975; Raats, 1973; Wang et al., 1998), and nonponding rainfall (Pendexter and Furbish, 1991; Raats, 1973; J. S. Selker et al., 1992).
In addition to these theoretical analyses, numerous experimental studies have been undertaken to elucidate the process of infiltration in soils and the instability of wetting front propagation. The process of infiltration in soils and the instability of wetting fronts has been studied primarily in two-dimensional tanks where it is possible to image the generation of a two-dimensional fingered flow (e.g., Bauters et al., 2000a; DiCarlo, 2004; Glass et al., 1989a, c, d, Selker et al., 1992a, b; J. S. Selker et al., 1992), and more recently using geo-electrical imaging (Ganz et al., 2014; Liu and Moysey, 2012) and ground-penetrating radar (Mangel et al., 2012, 2015). Laboratory experiments designed to examine the infiltration process in homogeneous porous media have confirmed the ubiquitous formation of fingered flow (Bauters et al., 2000b; Glass et al., 1989d; Selker et al., 1992a; Wang et al., 2003b, 2004). Experimental observations have also demonstrated that the fingers that develop the most rapidly will convey most of the flow, while the other initial fingers will be quenched (Glass et al., 1989d; Selker et al., 1992b). The fully formed fingers generated by gravity-driven flow behave like traveling waves (i.e., they have constant shape and velocity), and the water saturation profile of the fully formed fingers exhibit a region of high water saturation (i.e., overshoot) directly behind the wetting front, followed by another region of drainage where the water content in the finger decreases to a lower and uniform water saturation, known as the finger tail (DiCarlo, 2004; Glass et al., 1989a; Liu et al., 1994; Selker et al., 1992b). This increase in water saturation at the fingertip, “saturation overshoot,” causes a rise in pressure and creates a positive matric potential gradient on top of the fingertip (DiCarlo et al., 1999; Geiger and Durnford, 2000). This rise in pressure also increases the delineation between the wet and dry porous media at the edge of the wetting front and facilitates the propagation of the wetting front. The length of the saturation overshoot (i.e., the fingertip length) has been deemed a function of the wetting front velocities (DiCarlo, 2004; Wallach et al., 2013). Further details on theoretical and experimental research on wetting front instability can be found in extensive reviews (Assouline, 2013; Glass and Nicholl, 1996; De Rooij, 2000; Xiong, 2014).
The rhizosphere is an important component of the vadose zone and is specifically defined as the narrow region of soil that is directly influenced by plant roots themselves and by the root secretions (Hinsinger et al., 2009; McCully, 1999; Passioura, 1988; Read et al., 2003). It has been estimated that about 40 % of the precipitation on earth transitions through the rhizosphere (Bengough, 2012). The rhizosphere has a deep effect on hydrologic processes (Benard et al., 2016), and its interactions in the soil system not only involve the physical effects stemming from soil and root dynamics but also include biochemical effects from the compounds that the roots of a plant can exude from their root tips (Benard et al., 2016; Gregory, 2006; Hinsinger et al., 2009).
There are two main biochemical compounds produced by the plant roots: mucilage and exudates. Mucilage is a viscous substance composed mainly of polysaccharides and some phospholipids (Guinel and McCully, 1986; McCully and Boyer, 1997; Read et al., 2003) the purpose of which is to keep the soil around the roots moist by swelling and adsorbing water (Guinel and McCully, 1986) as well as to control the water repellency of the rhizosphere (Carminati, 2012; Carminati et al., 2010; Moradi et al., 2012). Root exudates comprise mostly sugar, amino acids, and organic acids and are exuded primarily from the root tips (Carvalhais et al., 2011; McCully, 1999; Passioura, 1988; Read et al., 2003). These exudates play a key role in keeping the contact between the roots and soil particles (Walker et al., 2003), the modulation and mobilization of the nutrients (Cakmak et al., 1998; Carvalhais et al., 2011; Wang et al., 2008), and the maintenance of the rhizosphere hydraulic properties (Ahmed et al., 2014) by providing a large water-holding capacity (McCully and Boyer, 1997), enhancing the movement of water in dry soil, and enabling the roots to get water from dry soils (Ahmed et al., 2014; Zarebanadkouki et al., 2016). Individual exudates have specific nutrients (i.e., phosphate, nitrate, potassium) that they are designed to extract from the soil. This unique chemistry thus increases the solubility of the sought-after nutrients to ease the uptake by the plant. In this regard, the exudates act as surfactants within the subsurface by lowering the surface tension and contact angles of the soil pore water, enhancing the wettability and reducing the suction and energy needed for the plant to extract what is needed (McCully, 1999; Passioura, 1988; Read et al., 2003).
The plant root growth in soil is constrained, however, as water, air, and nutrient resources are scarce and spatially and temporally heterogeneously available in soil (Hinsinger et al., 2009). Plants have evolved various adaptive strategies to adapt advantageously to the environment they encounter, including to access these resources. Hydromechanic analyses of soil and water interactions in the rhizosphere have demonstrated that rhizodeposits (i.e., mucilages and exudates) induce water potential gradients near the roots and therefore increase nearby soil moisture (Carminati et al., 2010; Gardner, 1960; Ghezzehei and Albalasmeh, 2015; Moradi et al., 2011; Young, 1995). As the water potential decreases near the root to produce a concurrent decrease in soil water content, water moves from the bulk soil to the root surfaces. Although the effect of root exudates on soil structure and aggregation has been well established (e.g., Alami et al., 2000; Czarnes et al., 2000; Ghezzehei and Albalasmeh, 2015; Kaci et al., 2005; McCully, 1999; Watt et al., 1994), research on the effect of the rhizodeposits (i.e., mucilages and exudates) on the soil–water relationship and water dynamics in the rhizosphere is very limited. This is a crucial knowledge gap in terms of the biogeochemical influences on the hydrologic processes occurring in the rhizosphere, as stated by Bengough (2012), particularly the effect that root exudates have on the nonequilibrium dynamics of interfaces and flow in porous media. Carminati et al. (2016) recently analyzed the rhizosphere processes to more thoroughly elucidate the system, with a particular focus on determining the role of mucilage in root water uptake. They found that wet mucilage enhances fluid transport, but when dry, the mucilage causes hydrophobic tendencies in the rhizosphere (Carminati et al., 2016). From this analysis they determined a need for new technology and sensor applications to gain a full and detailed understanding of the rhizosphere, regardless of the new methodologies in development for imaging these systems and understanding the plants themselves.
The objective of this study was to investigate the influence of various plant exudates (citrate and oxalate) and soil constituents (tannic acid and Suwanee River natural organic matter) on soil infiltration, particularly wetting front instability and fingered flow in unsaturated porous media. A Hoagland nutrient solution (HNS) with 0.01 M NaCl (NaCl + HNS) solution was used as a control, as these solution compounds are used to simulate the nutrients a plant needs to survive, and these simulated compounds are also present in the rhizosphere. By utilizing plant exudate and soil constituent solutions, the physical effects of plant root interaction with soil infiltration processes and porous media spatial characteristics, such as heterogeneity and structure, were removed. Only the interactions between the physicochemical properties of the infiltrating water, the porous media properties, and the flow dynamics were analyzed for an independent determination of the individual constituent solution effects on the soil infiltration processes that were in the form of wetting front instability and fingering flow phenomena. The fluid properties were quantified by measuring contact angle and surface tension. The dynamics of interfaces in porous media – gas–liquid and solid–liquid interfaces – under the impact of various biochemical compounds were monitored via visualization. Utilizing the imaging technique of the light transmission method (LTM) that allows the visualization of fluid content and flow in porous media with high spatial and temporal resolution (Darnault et al., 1998, 2001; Niemet and Selker, 2001; Weisbrod et al., 2003), we studied the effects of several isolated organic compounds typically found in the rhizosphere that were dispersed as artificial rainfall and infiltrated under unsaturated conditions a homogenous sand porous medium on the wetting front stability and fingered flow phenomena in a two-dimensional tank. Ultimately, our understanding of the influence of these isolated plant exudates and soil constituents upon these infiltration processes and water saturation distribution within the porous medium is a significant step toward fully elucidating the range of interactions controlling flow within the rhizosphere.
2.1 Simulated constituent solution preparation
In order to reduce the number of active variables present in this work, solutions of simulated plant exudates and soil components were used rather than living plants and soil. A Hoagland nutrient solution with 0.01 M NaCl (NaCl + HNS) was used as a control to simulate the nutrients required by a plant to survive in a sandy porous medium. The HNS was created by combining the components listed in Table 1 with 970 mL of ultrapure deionized (DI) water (18.2 MΩ⋅ cm, Millipore Corporation, Billerica, MA) with NaCl (lot number: 2954C512, VWR Analytical BDH®, Radnor, PA) subsequently added to bring the solution to 0.01 M NaCl. These steps are based on the method developed by Arnon and Hoagland in 1940. Two plant exudates – sodium citrate (S1804-500G, Sigma-Aldrich, Lake Cormorant, MS), and sodium oxalate (lot number: P17A014, Alfa Aesar, Ward Hill, MA) – and two soil components – Suwanee River natural organic matter (SRNOM, RO isolate, 2R101N, International Humic Substances Society, St. Paul, MN) and tannic acid (lot number: MKBV0516V, Sigma-Aldrich, Lake Cormorant, MS) – were used to create the solutions tested in this work. Using NaCl + HNS as a base solution, different concentrations of the constituents were created to simulate a range of potential concentrations, a list of which is provided in Table 2. These concentrations were categorized based on amounts naturally found in the environment (Jones, 1998; Strobel, 2001; Wagoner et al., 1997).
Table 1Composition of Hoagland nutrient solution; recipe followed from Arnon and Hoagland (1940).
2.2 Solution characterization
A Kruss Easy Drop (FM40Mk2, Kruss GmbH, Germany) was used to obtain the contact angle and surface tension with 5 µL of the various experimental solutions deposited on a 24 × 60 mm micro cover glass (CAT No. 4404-454, VWR, Radnor, PA) for the contact angle analysis. The drop shape analysis software (Kruss GmbH, Germany) was used with the following settings: contact angle profile defined with circle fitting, drop type set as sessile drop, and sub-type set as normal. Images and data were collected every 30 s for 3 min for both the contact angle and surface tension data. The Kruss Easy Drop DSA1 internally computes the contact angle of a drop using the Young equation (Young, 1805):
where σs is the solid surface tension, σl is the liquid surface tension, γsl is the interfacial tension between the phases, and θ is the contact angle. It also calculates the surface tension of pendent drops using the Young–Laplace equation (Laplace, 1806; Young, 1805):
where ΔP is the difference in pressure of the inside and outside of the droplet, r1 and r2 are the principle radii of the droplet, and σ is the surface tension. By using the characteristic shape and size of the droplets, the equipment can determine the surface tension of the droplet. These variables on a stable solution droplet collected at 90 s are illustrated in Fig. 1. Contact angle and surface tension measurements for all solutions were tested in triplicate with the averages and associated standard deviations presented in this work (Table 3). The surface tension measurements were obtained by suspending the solution as a drop in an open-air environment from a 2 mm diameter needle point. The software was configured with the following settings: drop information with a needle diameter of 2 mm, a tip level (pixels) of 80, an assumed liquid drop density of 0.9975 g cm−3, an embedding phase of 0.0012, a magnification factor (pixels mm−1) of 79.827, and an aspect ratio of 1. A statistical analysis was done for the contact angle and surface tension measurements utilizing a t test using JMP Pro 12 from SAS.
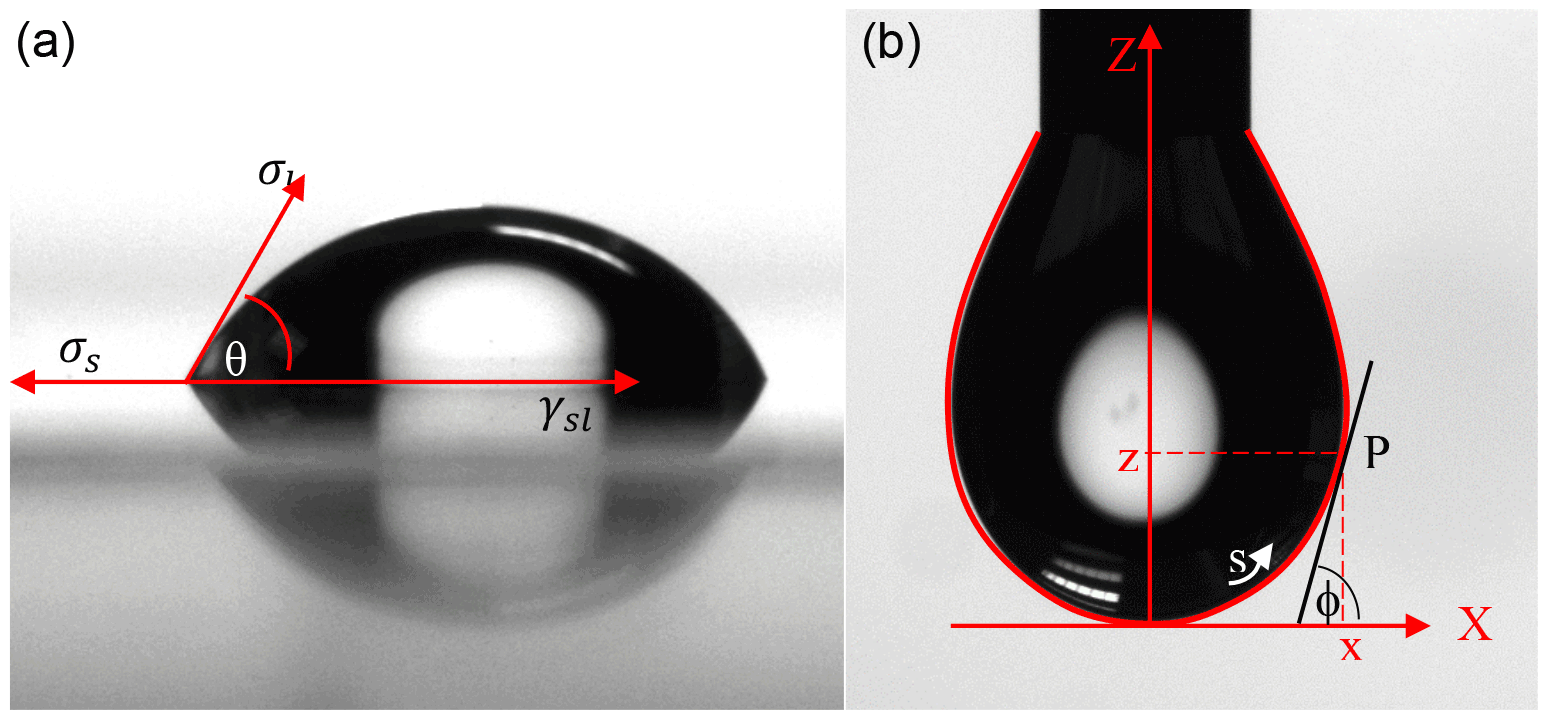
Figure 1Visual of the drop shape analysis of (a) a contact angle and (b) the surface tension pendant drop using the Kruss Easy Drop. The images are of the control solution (HNS + HNS) taken at 90 s. Figure is based off of figures appearing in the Kruss User's Manual (Kruss, 2004).
Table 2Concentration variations of plant exudates (citrate and oxalate) and soil components (tannic acid and organics: Suwanee River natural organic matter, SRNOM) used to create the solutions tested in this work. The middle row shows high concentrations of the constituent, the bottom row shows a moderately high amount, and the top row shows a typical natural concentration.
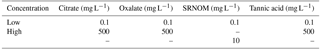
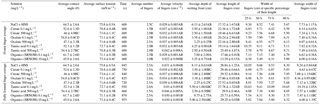
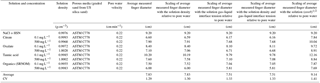
Table 3Average experimental data from the triplicate fundamental interfacial characterization and the duplicate flow experiments resulting from control (NaCl + HNS), plant exudates (citrate and oxalate), and soil components (tannic acid and organics: Suwanee River natural organic matter, SRNOM), and statistical analysis for t-test significant differentiations. Note: values not connected by same letter are significantly different.
2.3 Light transmission method
Developed by N. T. Hoa, the LTM was first used as a rapid, inexpensive method for the visualization of flow in 2-D systems (Hoa, 1981), and has since been expanded for use in water–air, oil–water, and water–oil–air systems. The methods used in this work adhere to the methods developed by Darnault et al. (2001, 1998). The LTM works through the illumination of a thin section of porous media (i.e., a 1 cm thick section of silica sand) from behind with a light source. A standard camera is then used to capture the amount of light that transmits through the 2-D area for any given condition (unsaturated to fully saturated). These images are recorded in standard RGB (red–green–blue) format, and converted into HSI (hue–saturation–intensity) format. An image or photograph can be broken down into three distinct layers of the image itself – the hue, saturation, and intensity. The hue is the wavelength of the light energy, the saturation is the bandwidth of the wavelength, and the intensity is the total energy value or the amplitude. Upon conversion into this format, information on the water content is discernable. Specific combinations of the HSI format can be used to determine the water content depending on the nature of the 2-D system and fluids. Similarly, the porous medium is calibrated via water saturation to a known percentage and a discrete value is obtained via the HSI format. The experimental design reduced the efficacy of hue and saturation as opposed to intensity; here intensity was used to create the calibration equation for the experiments.
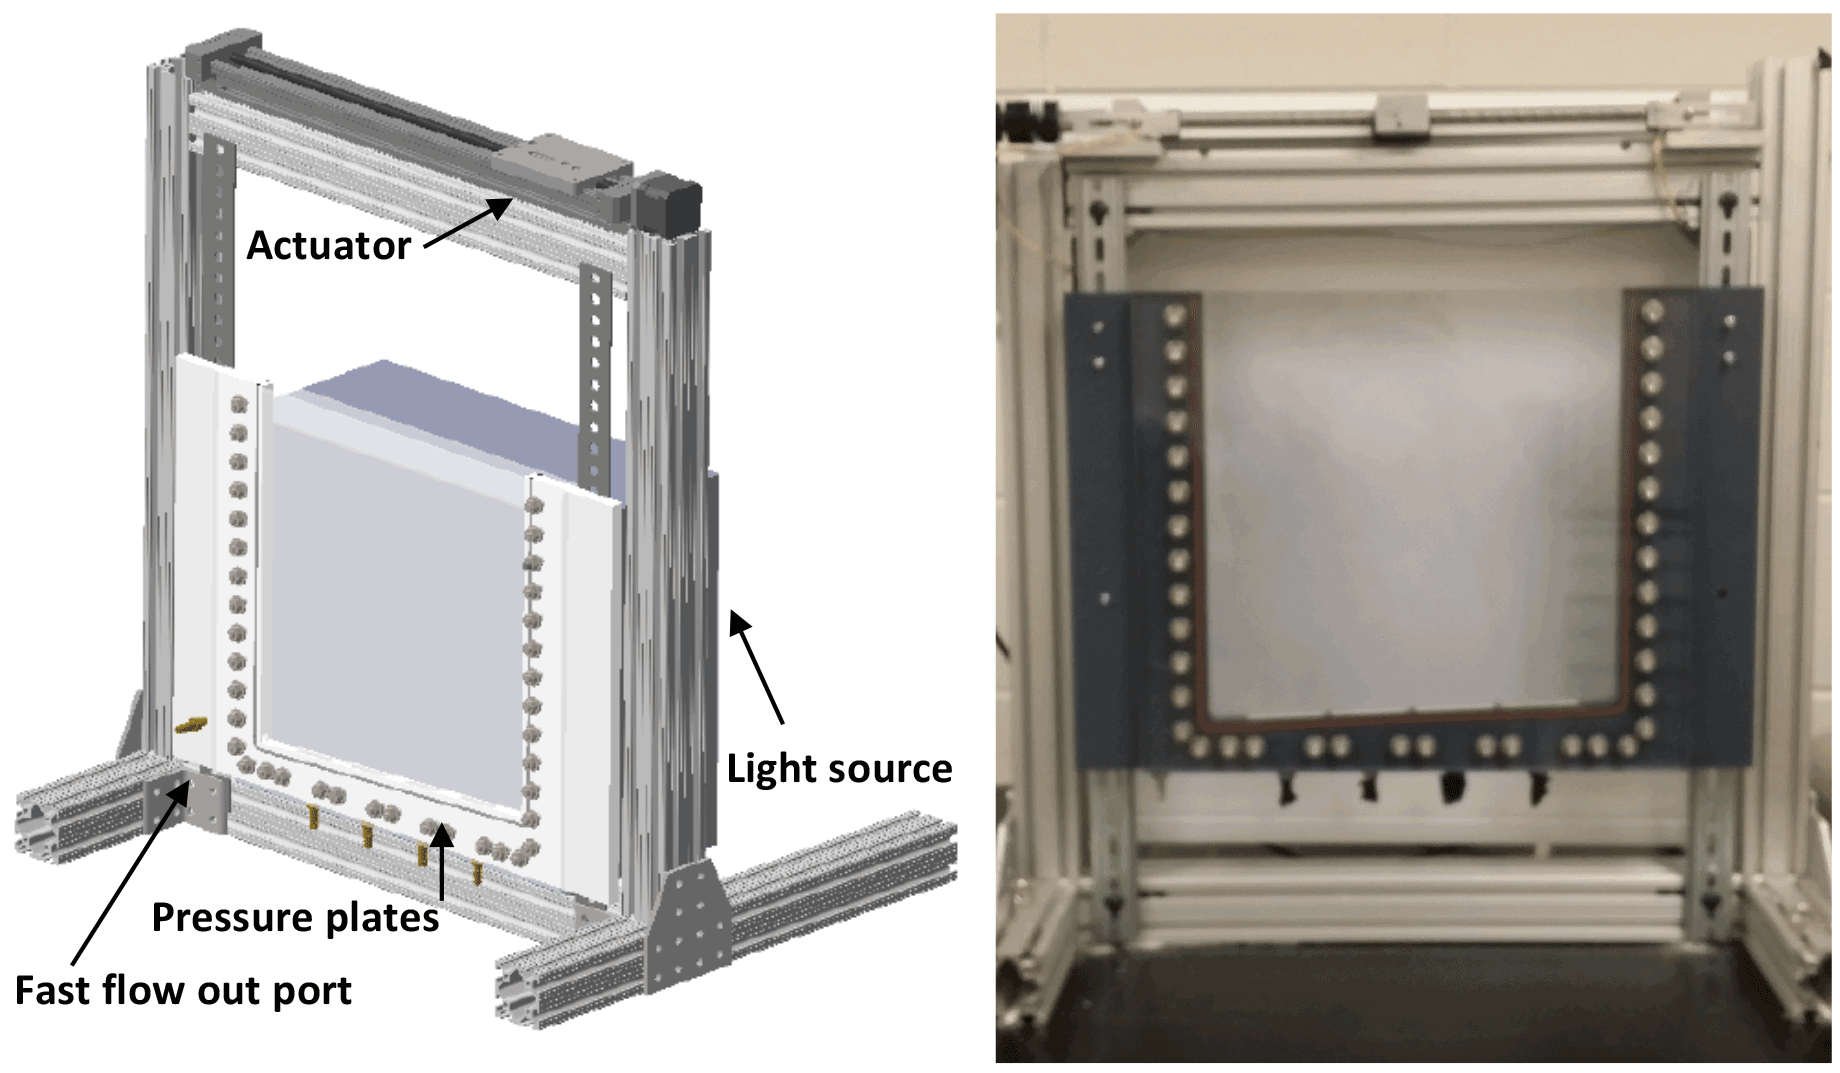
The 2-D tank was constructed using clear 1.3 cm thick polycarbonate plates (8707K153, McMaster-Car, Douglasville, GA) for purposes of visualizing the flow process (Fig. 2). The 30.5 × 1.3 × 30.5 cm tank contains four porous plates (0660X01-B01M3, Soilmoisture Equipment Corp., Goleta, CA) along the sloped bottom of the tank, and an effluent port at the base of the slope. For experiments, the tank is fitted to an aluminum stand with an LED light source mounted on the back (36 W dimmable, natural white 61 × 61 cm, LPWD-NW6060-36, superbrightleds.com, St. Louis, MO), and a rainfall simulator (screw actuator) is mounted on top. To prevent reflective and refractive light from affecting the images collected, the excess light from the LED light was blocked to ensure the transmission of only visible light through the tank.
An empirical calibration curve was created using small calibration tanks (7.6 × 1.5 × 8.9 cm) filled with the silica sand to multiple preset water saturation percentage points (i.e., 0, 5, 10, 20, 40, 60, 80, and 100 %). The calibration was completed in triplicate to account for potential variations in packing and ambient light pollution. A linear calibration relationship was seen between the increasing water saturation percentage points and the increasing transmitted intensity (Fig. 3); this trend was also observed in the work of Uyusur et al. (2016). This linear relationship and slope equation were used to convert the intensity values into water saturation values with MATLAB (R2016a, The Mathworks Inc., Natick, MA, USA). Additionally, for each 2-D tank flow experiment, the intensity values corresponding to locations where 0 and 100 % water saturation occurred were found, and the slope from each experiment was compared to the calibration curve to ensure that the calibrations between experiments were similar.
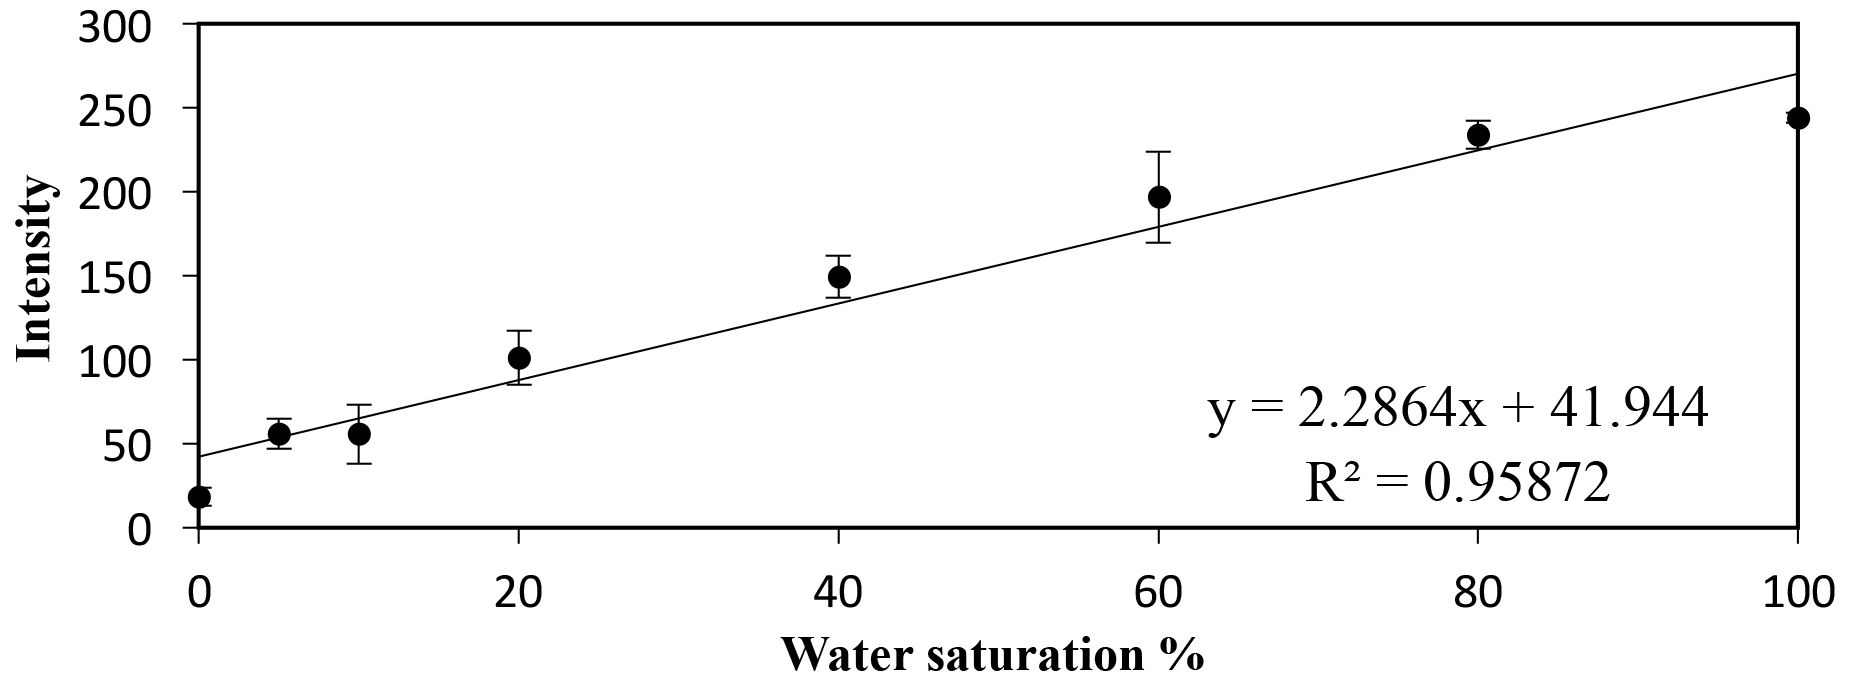
Figure 3Empirical calibration curve of the transmitted intensity vs. the water saturation, with its linear trend line and slope equation.
2.4 2-D tank flow experimental design
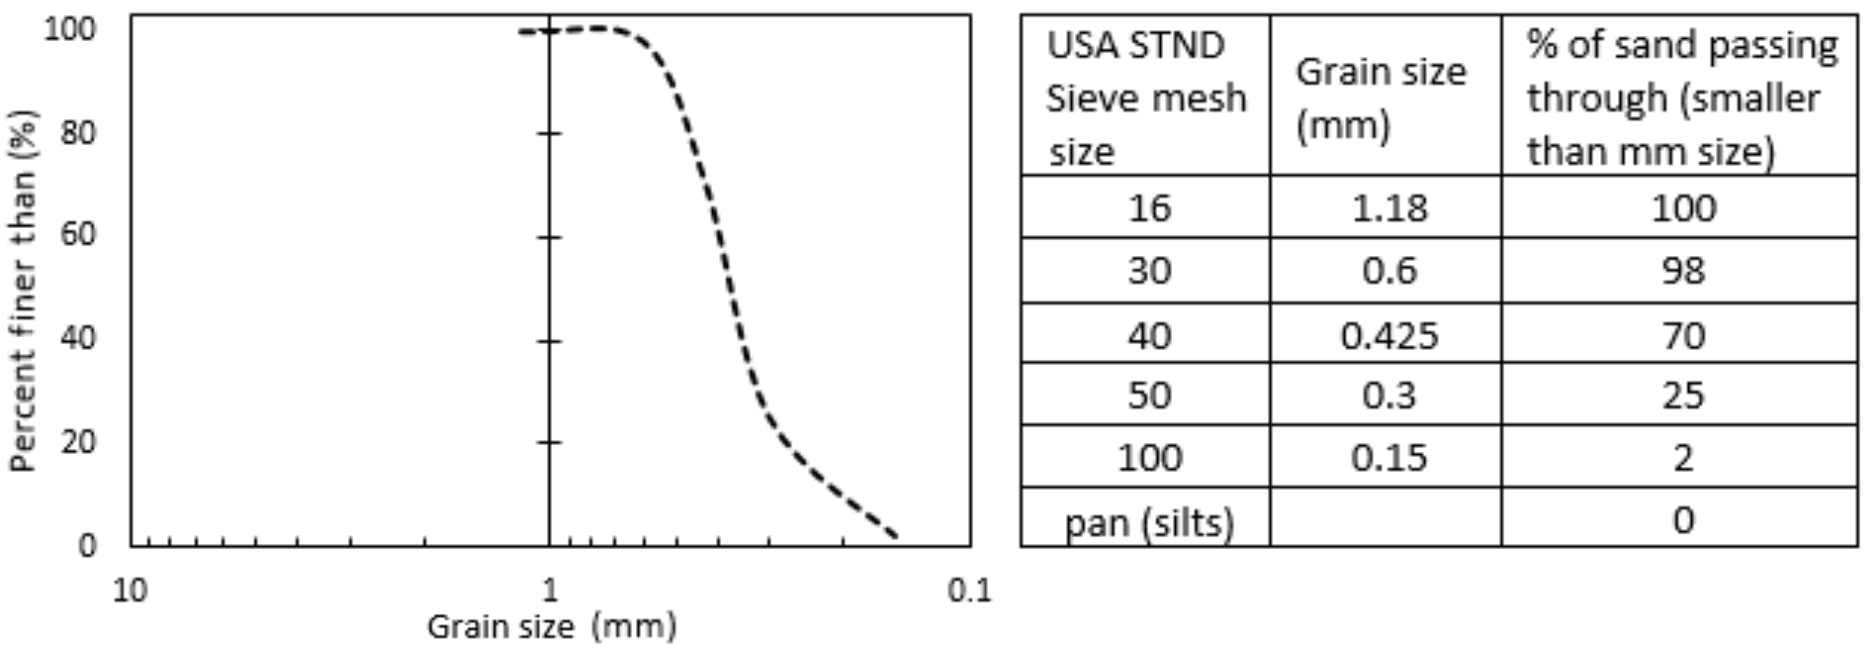
The 2-D tank was secured to the stand prior to packing to minimize jostling and to reduce sand movement, thus decreasing the likelihood of heterogeneity. A packing device, a Y-shaped sand loader containing a piece of cloth, was then affixed to the top of the tank and was used to pour the sand into the tank. It was filled with two tank volumes of graded sand that conform to ASTM (American Society for Testing and Materials) C778 standards (US Silica, Ottawa, IL). The cloth was then removed to create a uniform loading of sand within the tank. The second tank volume of sand allows for the homogeneous packing of the tank to a uniform bulk density of 1.50 g cm−3. The US Silica product data sheet described the size of the ATSM graded sand using standard USA sieve mesh sizes from 16 – Pan (US Silica, 1997) (Fig. 4). The packing device and extra sand were removed from the top of the tank, which was then gently tapped to create an even sand surface. A cover was secured around the apparatus to block refractive and reflective light from the LED source and to ensure that only transmitted light was seen in the images. Specifically, 1 cm of the top portion of the tank and sand was covered; this dimension is assumed as part of the uniform wetting front for the data presented here.
All tank flow experiments were done in replicate, with data presented in this work derived from the averages of the replica, and the images presented from a single experiment representing the system's characteristics. The secondary experimental images are available for viewing in the Appendix. The experimental exudate and soil component solutions were individually pumped into the 2-D tank for each experiment. A Cole Parmer peristaltic pump was used for this process (pump head; Masterflex easy loader II L/S model 77200-60, Masterflex peroxide-cured silicone tubing L/S 16, Cole Parmer Instruments Co., Vernon Hills, IL) with the solutions distributed across the top of the 2-D tank by artificial rainfall (rotating screw actuator) over a 45.72 cm2 area, at a constant pump rate of 10 mL min−1 (flow velocity, i.e., the surface area averaged input flux rate, of 13.12 cm h−1).
A Nikon CMOS D5500 DSLR camera with AF-S DX NIKKOR 18–55 mm f/3.5-5.6G VR II Lens (model: 1546) was used to image the flow every 30 s in large, fine, JPEG format, with 6000 × 4000 pixels per image. The camera was operated manually to ensure that the highest intensity within the images was less than the maximum of 255. This was also done for the calibration curve images. Upon capture, the images were imported into MATLAB for quantitative analysis. The raw RGB formatted images were converted to a HSI format. The intensity values were then used to determine the dynamic finger geometry and the vertical and horizontal water saturation profiles via MATLAB. A statistical analysis was done for the parameters of the flow experiments, utilizing a t test using JMP Pro 12 from SAS.
3.1 Surface and interface characterizations
The time-dependent contact angles of each constituent solution at their various concentrations are displayed in Fig. 5, with the stable contact angle measurements listed in Table 3 (stable measurements taken at 90 s). For most concentrations of the exudate solutions the contact angles are significantly lower than those of the NaCl + HNS control solution (θ= 64.5∘ at 90 s), the exception being the low concentration of SRNOM. Statistical analysis of the contact angle and surface tension was done via t test, and the differences are compiled in Table 3. Each constituent group displays a significant percent reduction in the contact angles of the experimental solutions against the control at time 90 s. This significant difference is illustrated through the t-test groupings displayed in Fig. 6. The SRNOM percent reduction in the contact angle values were 4 % for 0.1 mg L−1, and 30 % for 10 mg L−1. The citrate percent reductions in the contact angle values were 18 % for 0.1 mg L−1 and 29 % for 500 mg L−1. The oxalate percent reductions in the contact angle values were 15 % for 0.1 mg L−1 and 26 % for 500 mg L−1. For the tannic acid, however, the variability in the reduction in contact angle occurred regardless of the increase in concentration and averaged a 17 % reduction. Significant differences can be seen in all experimental solutions, except for the low concentration of SRNOM. For the remainder of the experimental solutions, two main groups were not dependent on concentration. The first group comprised the tannic acids, citrate, and oxalate at low concentrations that were similar to each other. The second group comprised citrate, oxalate, and SRNOM at their high concentrations that also were similar to one another. However, the low concentration of tannic acid and the high concentration of oxalate, were not significantly different from each other.
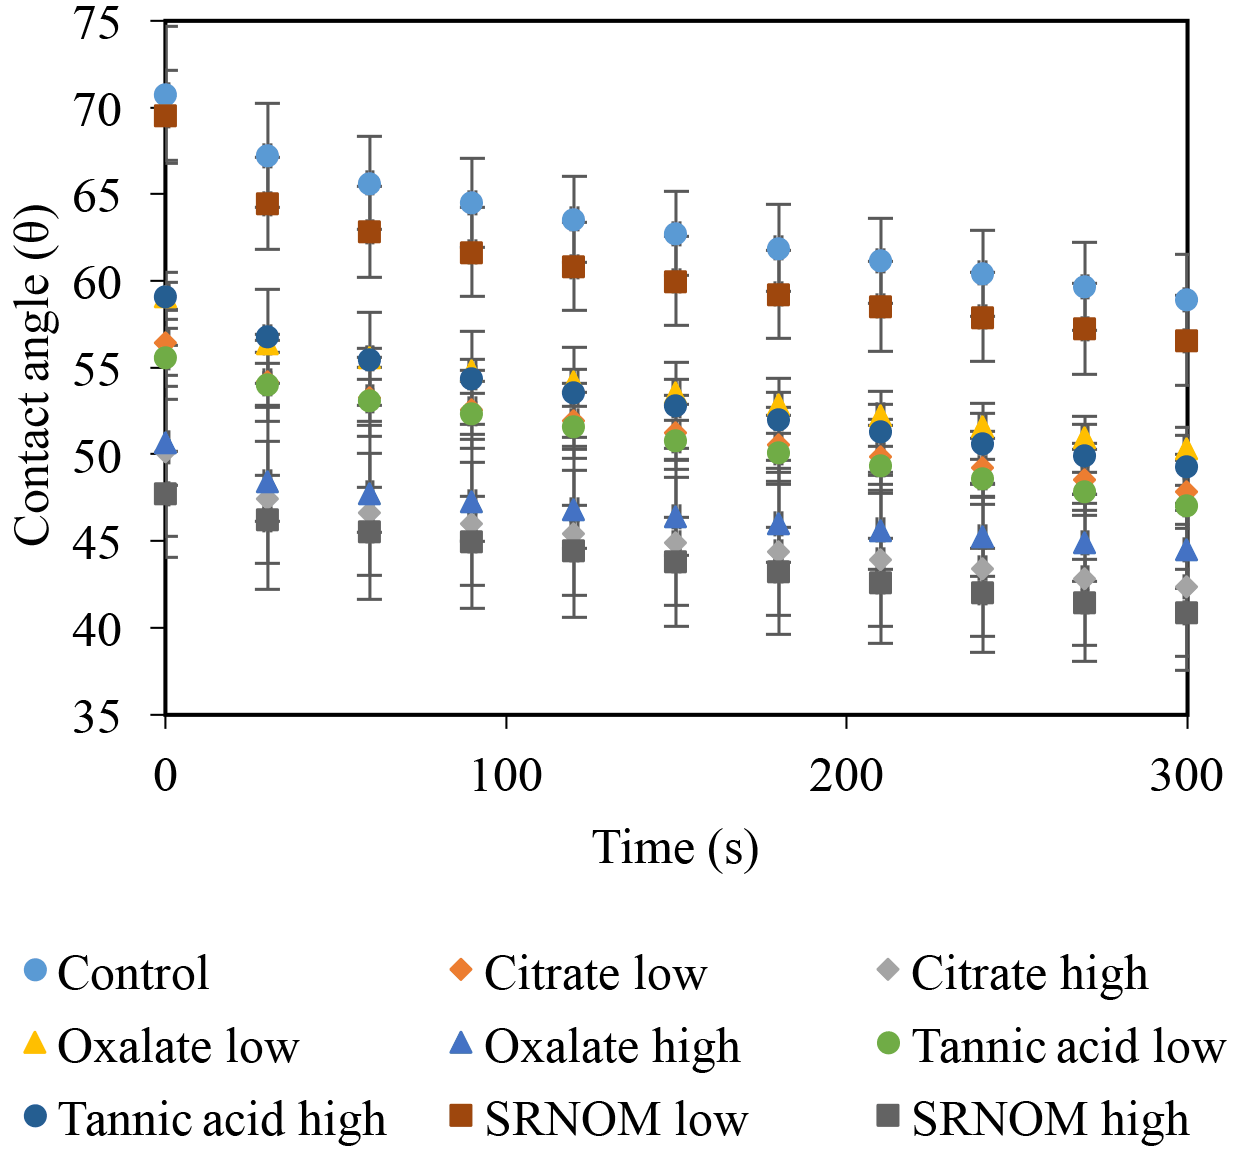
Figure 5Dynamic contact angles of experimental solutions for control (NaCl + HNS), plant exudates (citrate and oxalate), and soil components (tannic acid and organics: Suwanee River natural organic matter, SRNOM). Averages are graphed, and associated error bars represent 1 standard deviation.
Time-dependent surface tension measurements were taken at 30 s intervals for all experimental solutions and are displayed in Fig. 7. Additionally, the stable surface tension measurements (at time 90 s) are listed in Table 3. They were used to determine the percent reduction in surface tension over time (Fig. 8). All solutions exhibited a significantly lower surface tension than the NaCl + HNS control solution (75.7 mN m−1 at 90 s). As with the contact angle data, the differences in surface tension were not coupled directly with differences in concentration. For example, in Figs. 5 and 7, the 500 mg L−1 citrate solution exhibited the lowest contact angle (θ= 46∘) and the highest surface tension (73.6 mN m−1), at a stable time of 90 s. The percent reduction in surface tension t-test groupings illustrates more specifically that the effect of the concentration variations on the surface tension is not consistent. The statistical analysis revealed two distinct groups of surface tension values – one consisting of the low concentration of oxalate and tannic acid and the high concentration of citrate and SRNOM, and the other consisting of the remainder, seen in Fig. 8. It is important to note that the percent reduction in surface tension for the experimental solutions compared to the control was small, less than 10 %. The densities of the experimental solutions were also calculated and found to range minimally, from 995.5–1002.8 kg m−3 (Table 4).
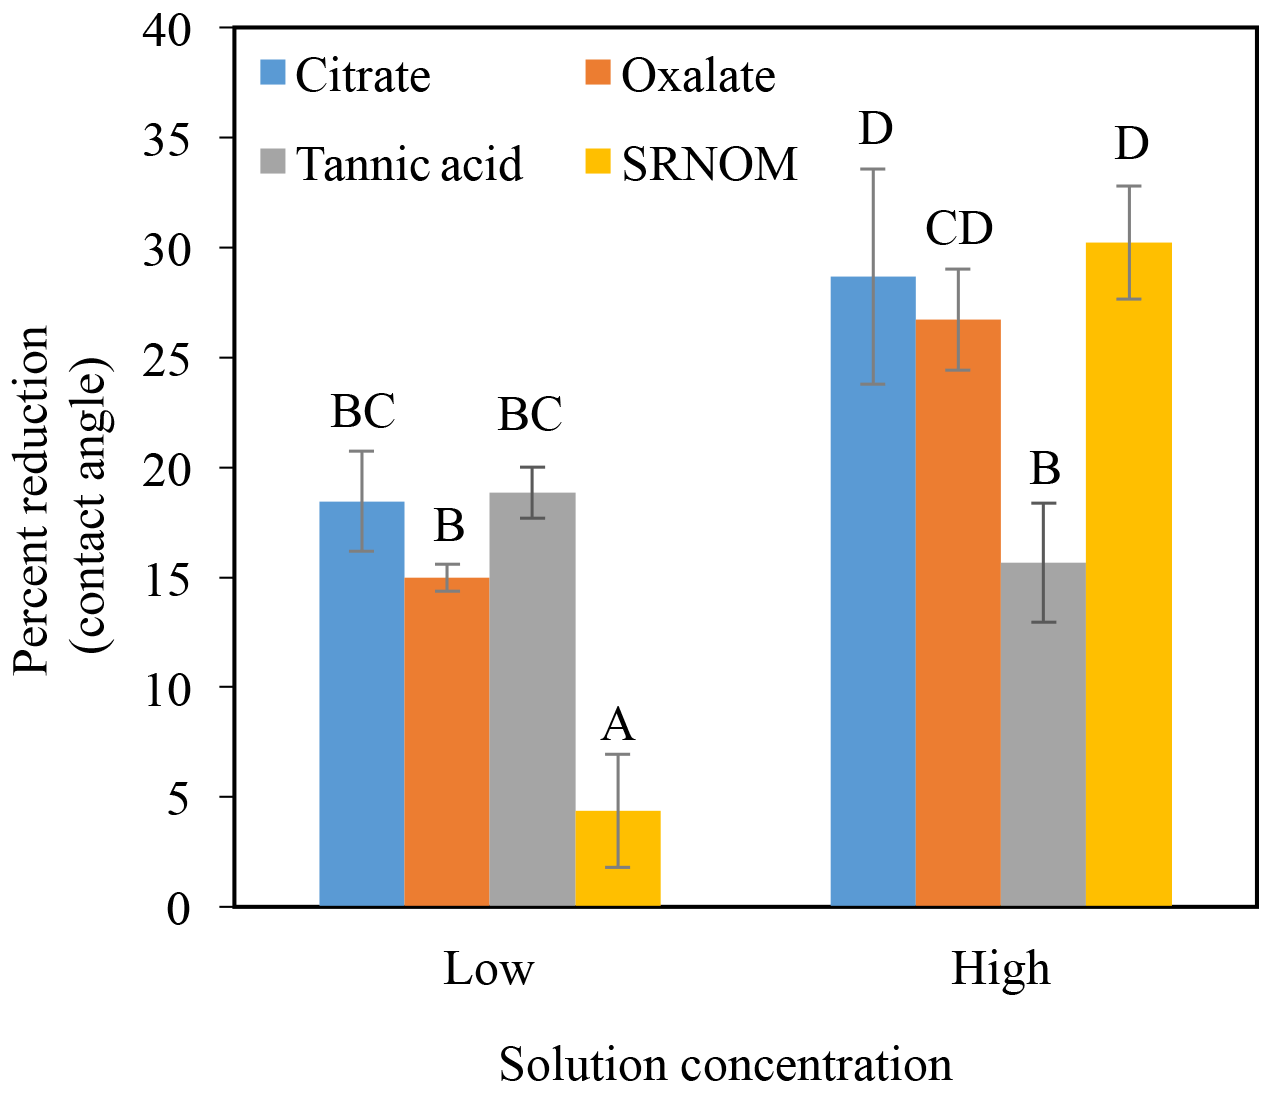
Figure 6Percent reduction in contact angle from the control (NaCl + HNS) (group A), changes at stable time (90 s), for plant exudates (citrate and oxalate), and soil components (tannic acid and organics: Suwanee River natural organic matter, SRNOM), and statistical analysis for t-test significant differentiations. Note: averages graphed and associated error bars represent 1 standard deviation, and values not connected by same letter are significantly different.
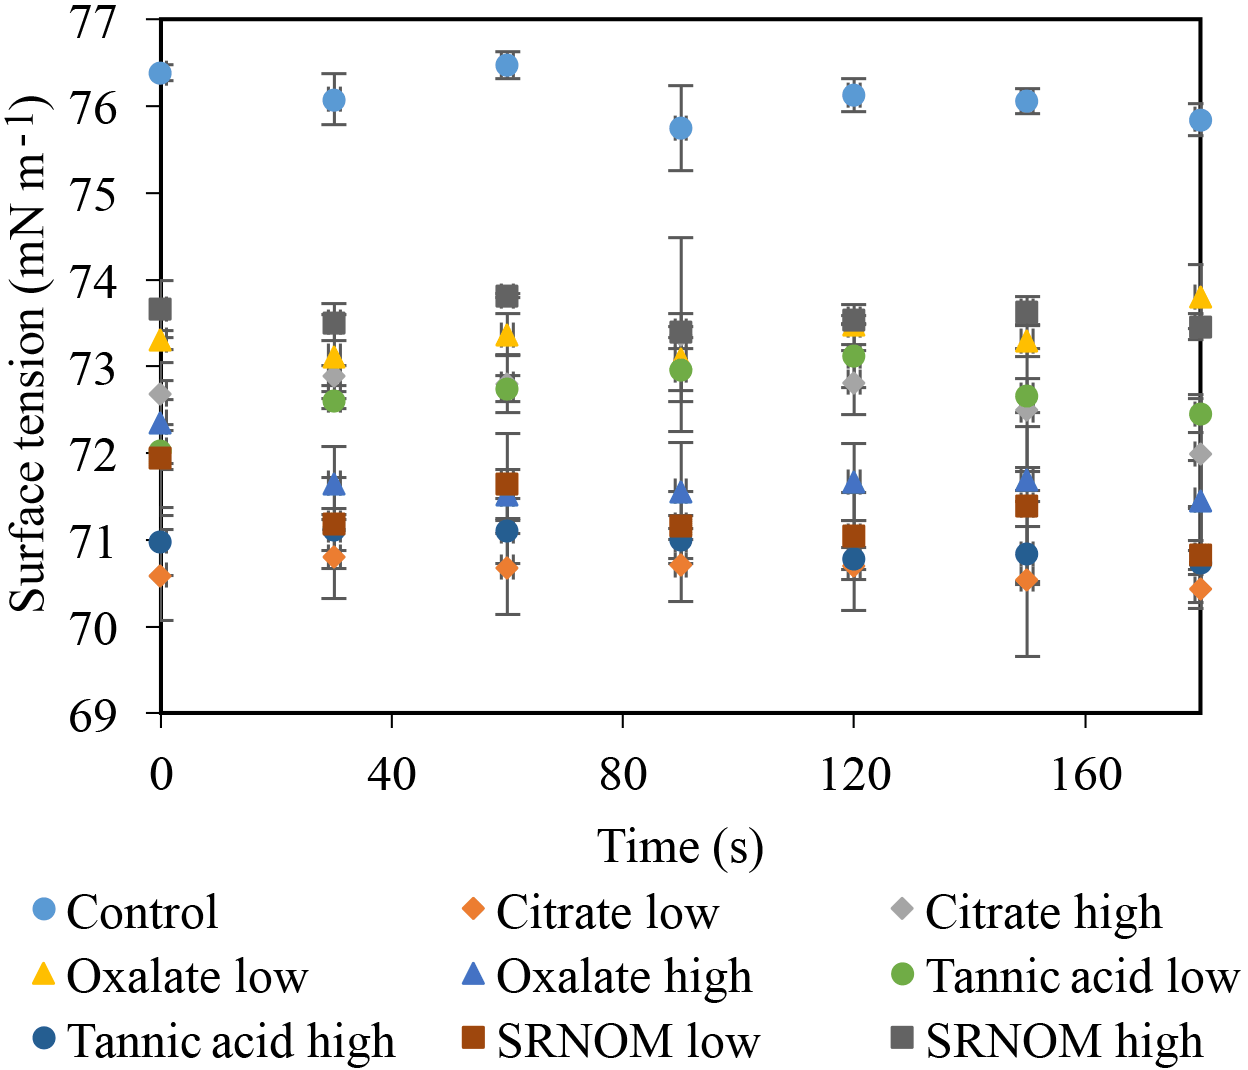
Figure 7Dynamic surface tension of experimental solutions for control (NaCl + HNS), plant exudates (citrate and oxalate), and soil components (tannic acid and organics: Suwanee River natural organic matter, SRNOM). Averages graphed, and associated error bars represent 1 standard deviation.
Table 4Hydrodynamic scaling of finger width measurements resulting from control (NaCl + HNS), plant exudates (citrate and oxalate), and soil components (tannic acid and organics: Suwanee River natural organic matter, SRNOM) infiltration in ASTM graded sand C778. Finger width is scaled to density, gas–liquid interface tension, density and gas–liquid interface tension of pore water, and (cos θ)1∕2. CV: coefficient of variation.
3.2 Time-dependent unstable fingering flow
The unsaturated gravity-driven flow experiments were analyzed based on (i) the number of fingers formed, ii) the velocity of finger propagation, and (iii) the vertical and horizontal water saturation profiles. The two extreme concentrations for the plant constituents (citrate and oxalate), which were 0.1 mg L−1 for the lowest and 500 mg L−1 for the highest, were compared with the concentrations of the soil constituents, which were 0.1 to 10 mg L−1 for SNROM and 0.1 to 500 mg L−1 for tannic acid.
In this comparison, the number of fingers formed in each experimental test solution varied slightly (1.5 to 2.5 on average) with no discernable pattern between the various constituents and concentrations (Table 3). Although a variation was observed in the wetting front depth (i.e., the nonpreferential zone of infiltration) of each solution, a relationship to the finger propagation velocity was observed in the citrate, oxalate, and tannic acid solutions. The relationship showed that the slower propagation of the fingers indicated a greater wetting front depth (Table 3), but this finding did not hold for the soil constituent SRNOM solutions. The finger length and the wetting depth of the citrate solutions at 10 min are 22.4 and 3.5 cm for the low concentration and 19.5 and 2.5 cm for the high concentration. The finger length and wetting depth of the SRNOM solutions at 10 min are 17.7 and 7.0 cm for the low concentration and 13.3 and 3.3 cm for the high concentration. The finger length and wetting depth of the oxalate solutions at 10 min are 20.2 and 3.4 cm for the low concentration and 22.2 and 2.3 cm for the high concentration. The finger length and wetting depth of the tannic acid solutions at 10 min are 19.1 and 4.3 cm for the low concentration and 25.5 and 2.5 cm for the high concentration.
3.2.1 Finger analysis
MATLAB was next used to process and analyze the vertical water saturation profiles of the main finger for each solution (Figs. 9 and 10). The NaCl + HNS control solution exhibited a substantial wetting front and a uniform water saturation distribution through the vertical finger profile (∼ 50 %) behind the fingertip (∼ 90 %). The citrate solutions were similar in that both the 0.1 and 500 mg L−1 formed two fingers. However, the 0.1 mg L−1 citrate solution formed two long and narrow fingers, with width of 6.6 cm, with the majority of the water content located directly behind the wetting front (∼ 100 %). In juxtaposition, the 500 mg L−1 citrate solution formed two well-dispersed fingers that were 7.9 cm in width with relatively uniform water saturation profiles (∼ 80 %). These well-dispersed water saturation profiles characterized the oxalate solutions, with an average saturation of ∼ 85 % for the low and high concentrations. The 0.1 mg L−1 had a greater finger length, most likely because the two fingers formed in the 0.1 mg L−1 sample had a width of 8.4 cm, unlike the three fingers with a width of 7.1 cm in the 500 mg L−1 analysis. Both long and narrow fingers with widths of 7.6 cm were observed forming from the tannic acid 500 mg L−1 test, with the majority of the water saturation occurring behind the tip of the wetting front (∼ 100 %). Further, the tannic acid at 0.1 mg L−1 had a slightly more uniform water saturation distribution across the finger, with a width of 10.2 cm, although the majority of the saturation still occurred within the fingertip (∼ 75 %). Finally, SRNOM exhibited a deep wetting front and a uniform water distribution across the finger profiles for both concentrations with only a minimal variation (∼ 85–88 %), although the low-to-high concentrations of the finger widths did vary from 6 and 7.5 cm respectively.
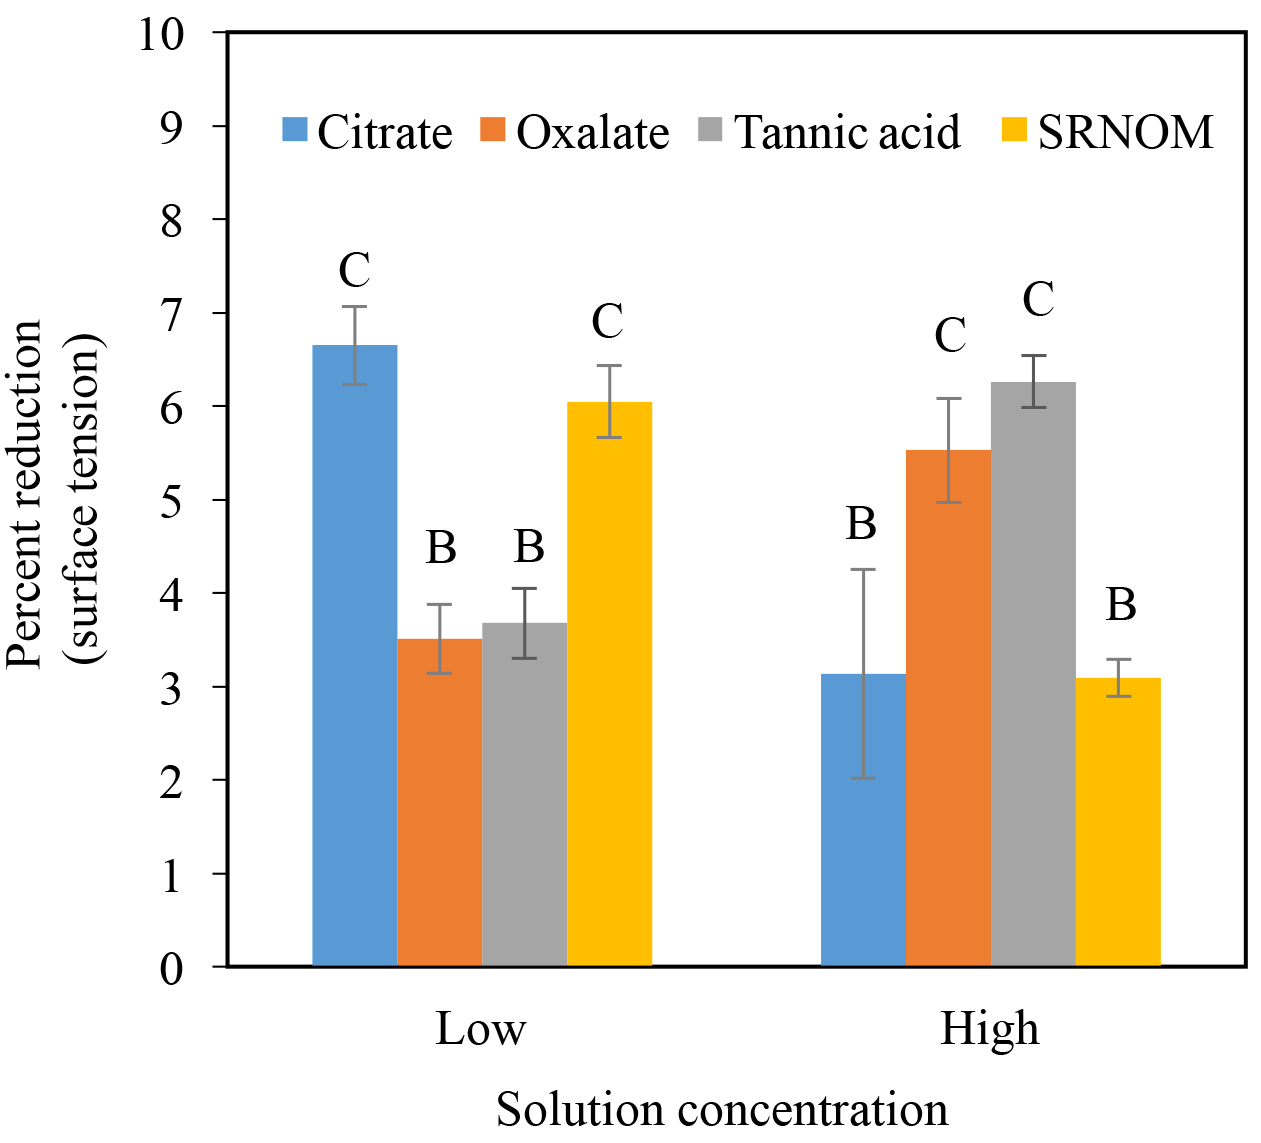
Figure 8Percent reduction in surface tension from the control (NaCl + HNS) (group A), changes at stable time (90 s), for plant exudates (citrate and oxalate), and soil components (tannic acid and organics: Suwanee River natural organic matter, SRNOM), and statistical analysis for t-test significant differentiations. Note: averages graphed and associated error bars represent 1 standard deviation, and values not connected by same letter are significantly different.
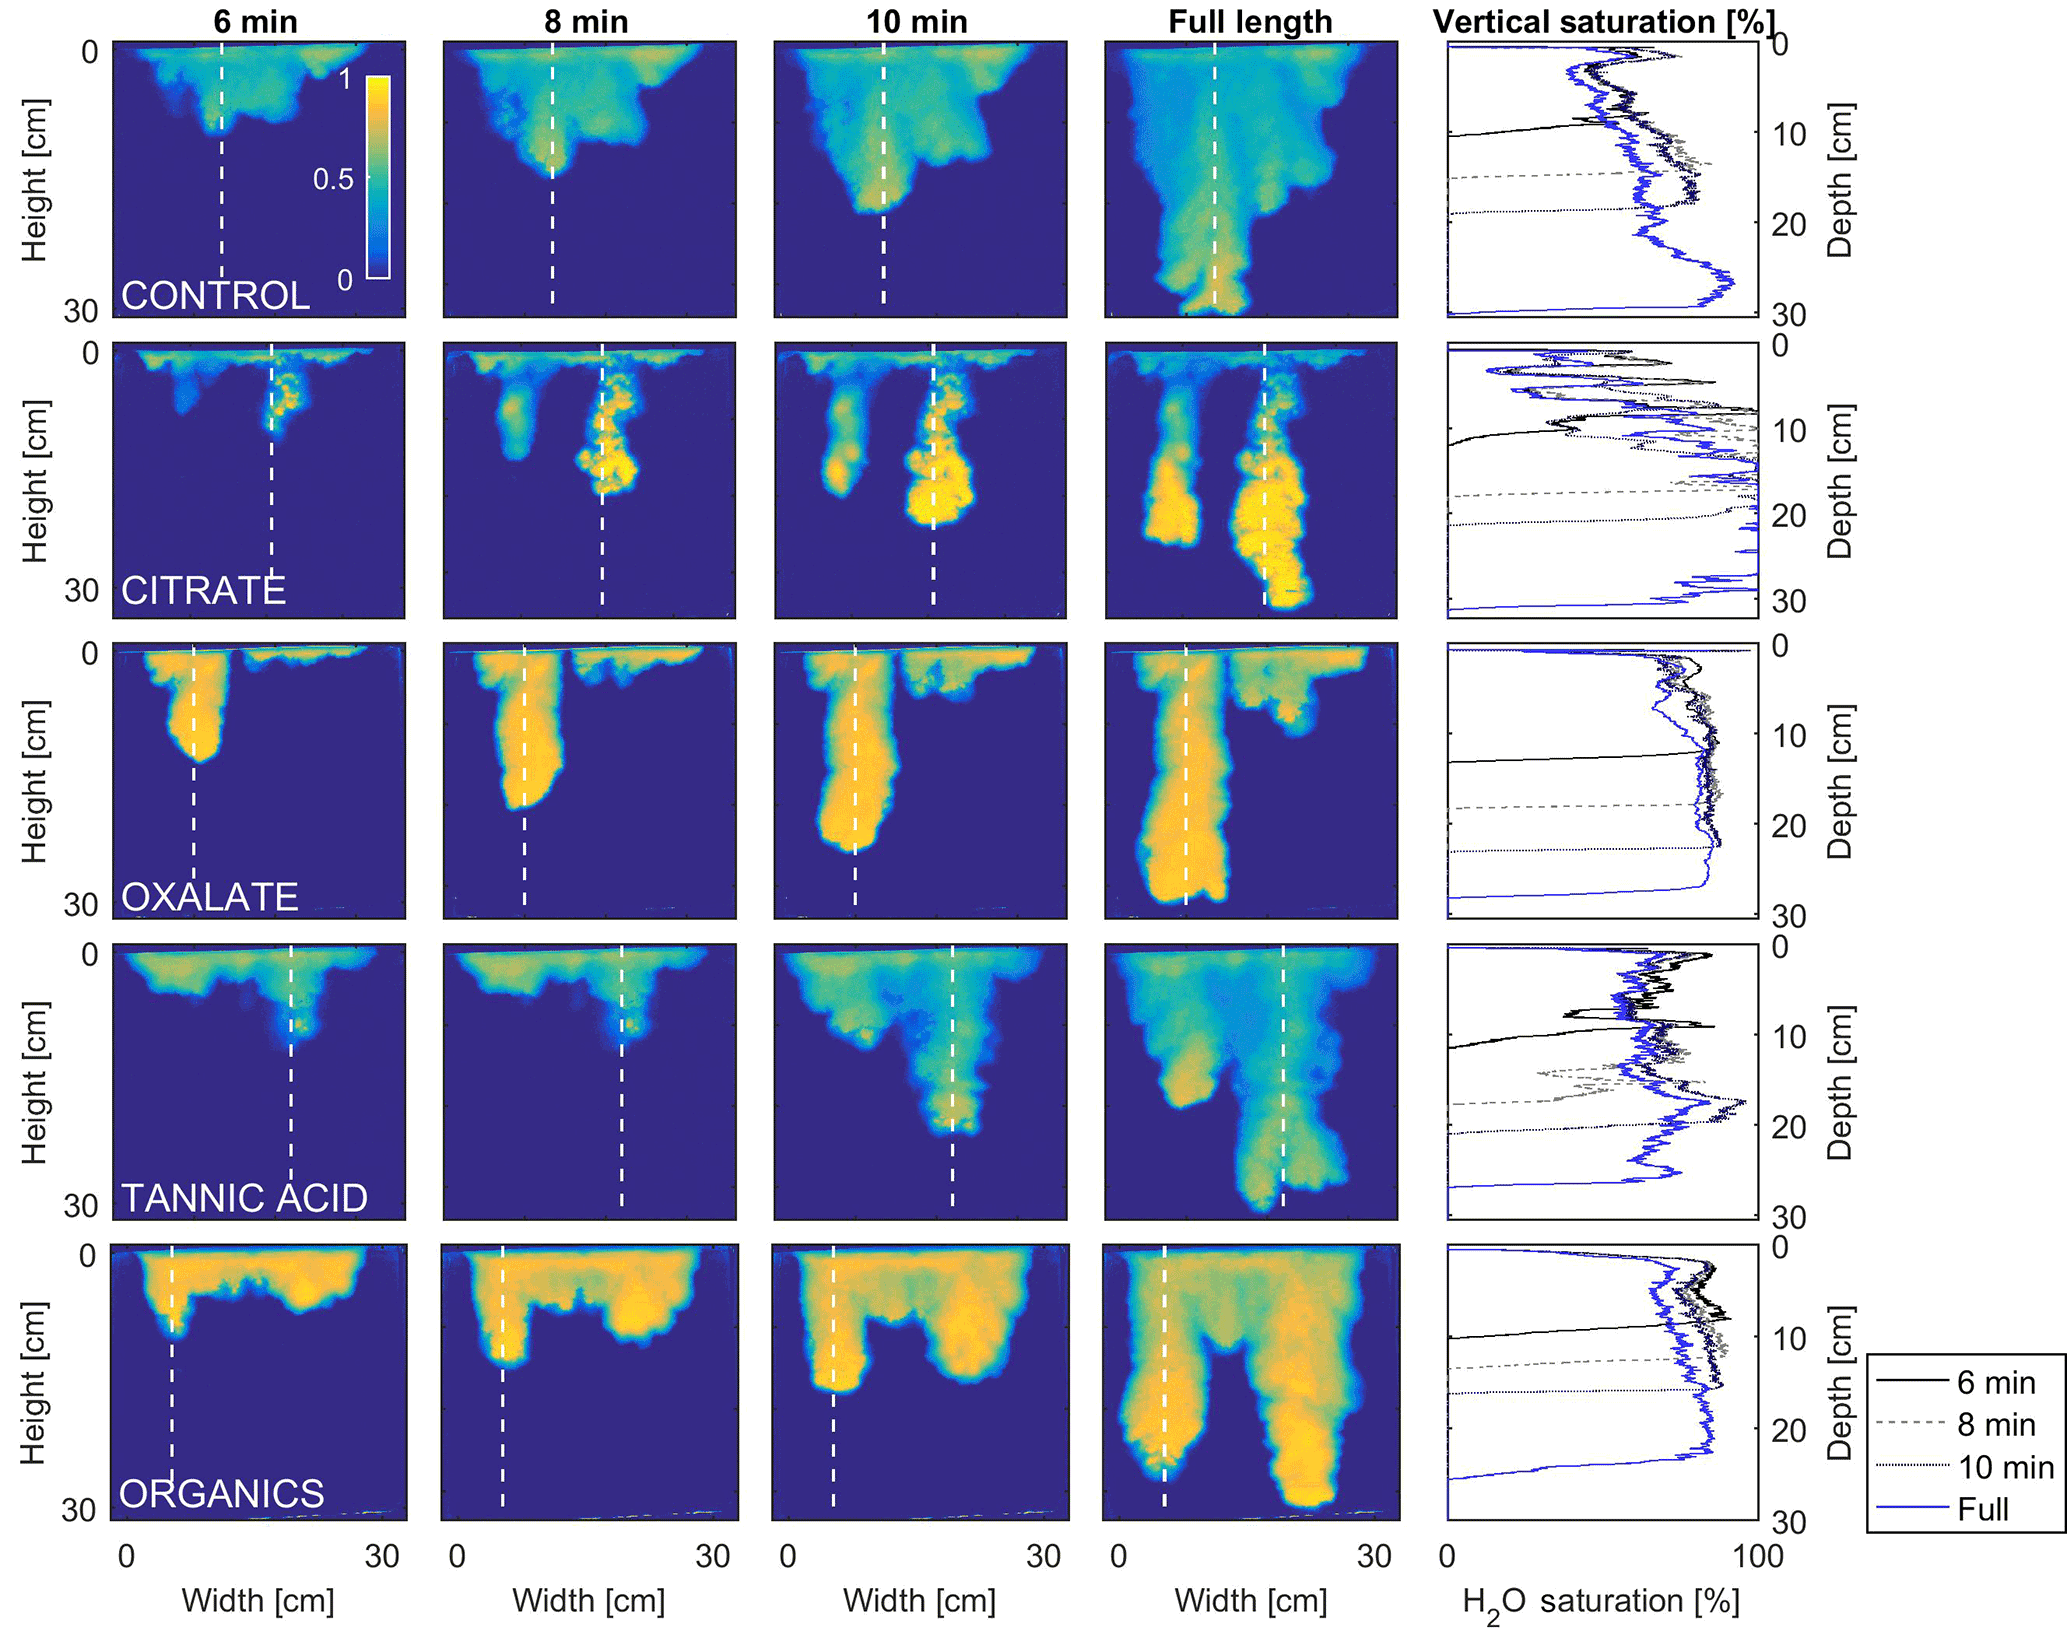
Figure 9Multigraph comparison of the dynamic vertical profiles of infiltration of water in US Silica C778 ASTM graded sand for control (NaCl + HNS), and low concentrations of plant exudates (citrate and oxalate) and soil components (tannic acid and organics: Suwanee River natural organic matter, SRNOM). The images are of the main finger and the vertical water saturation profile analysis over time.
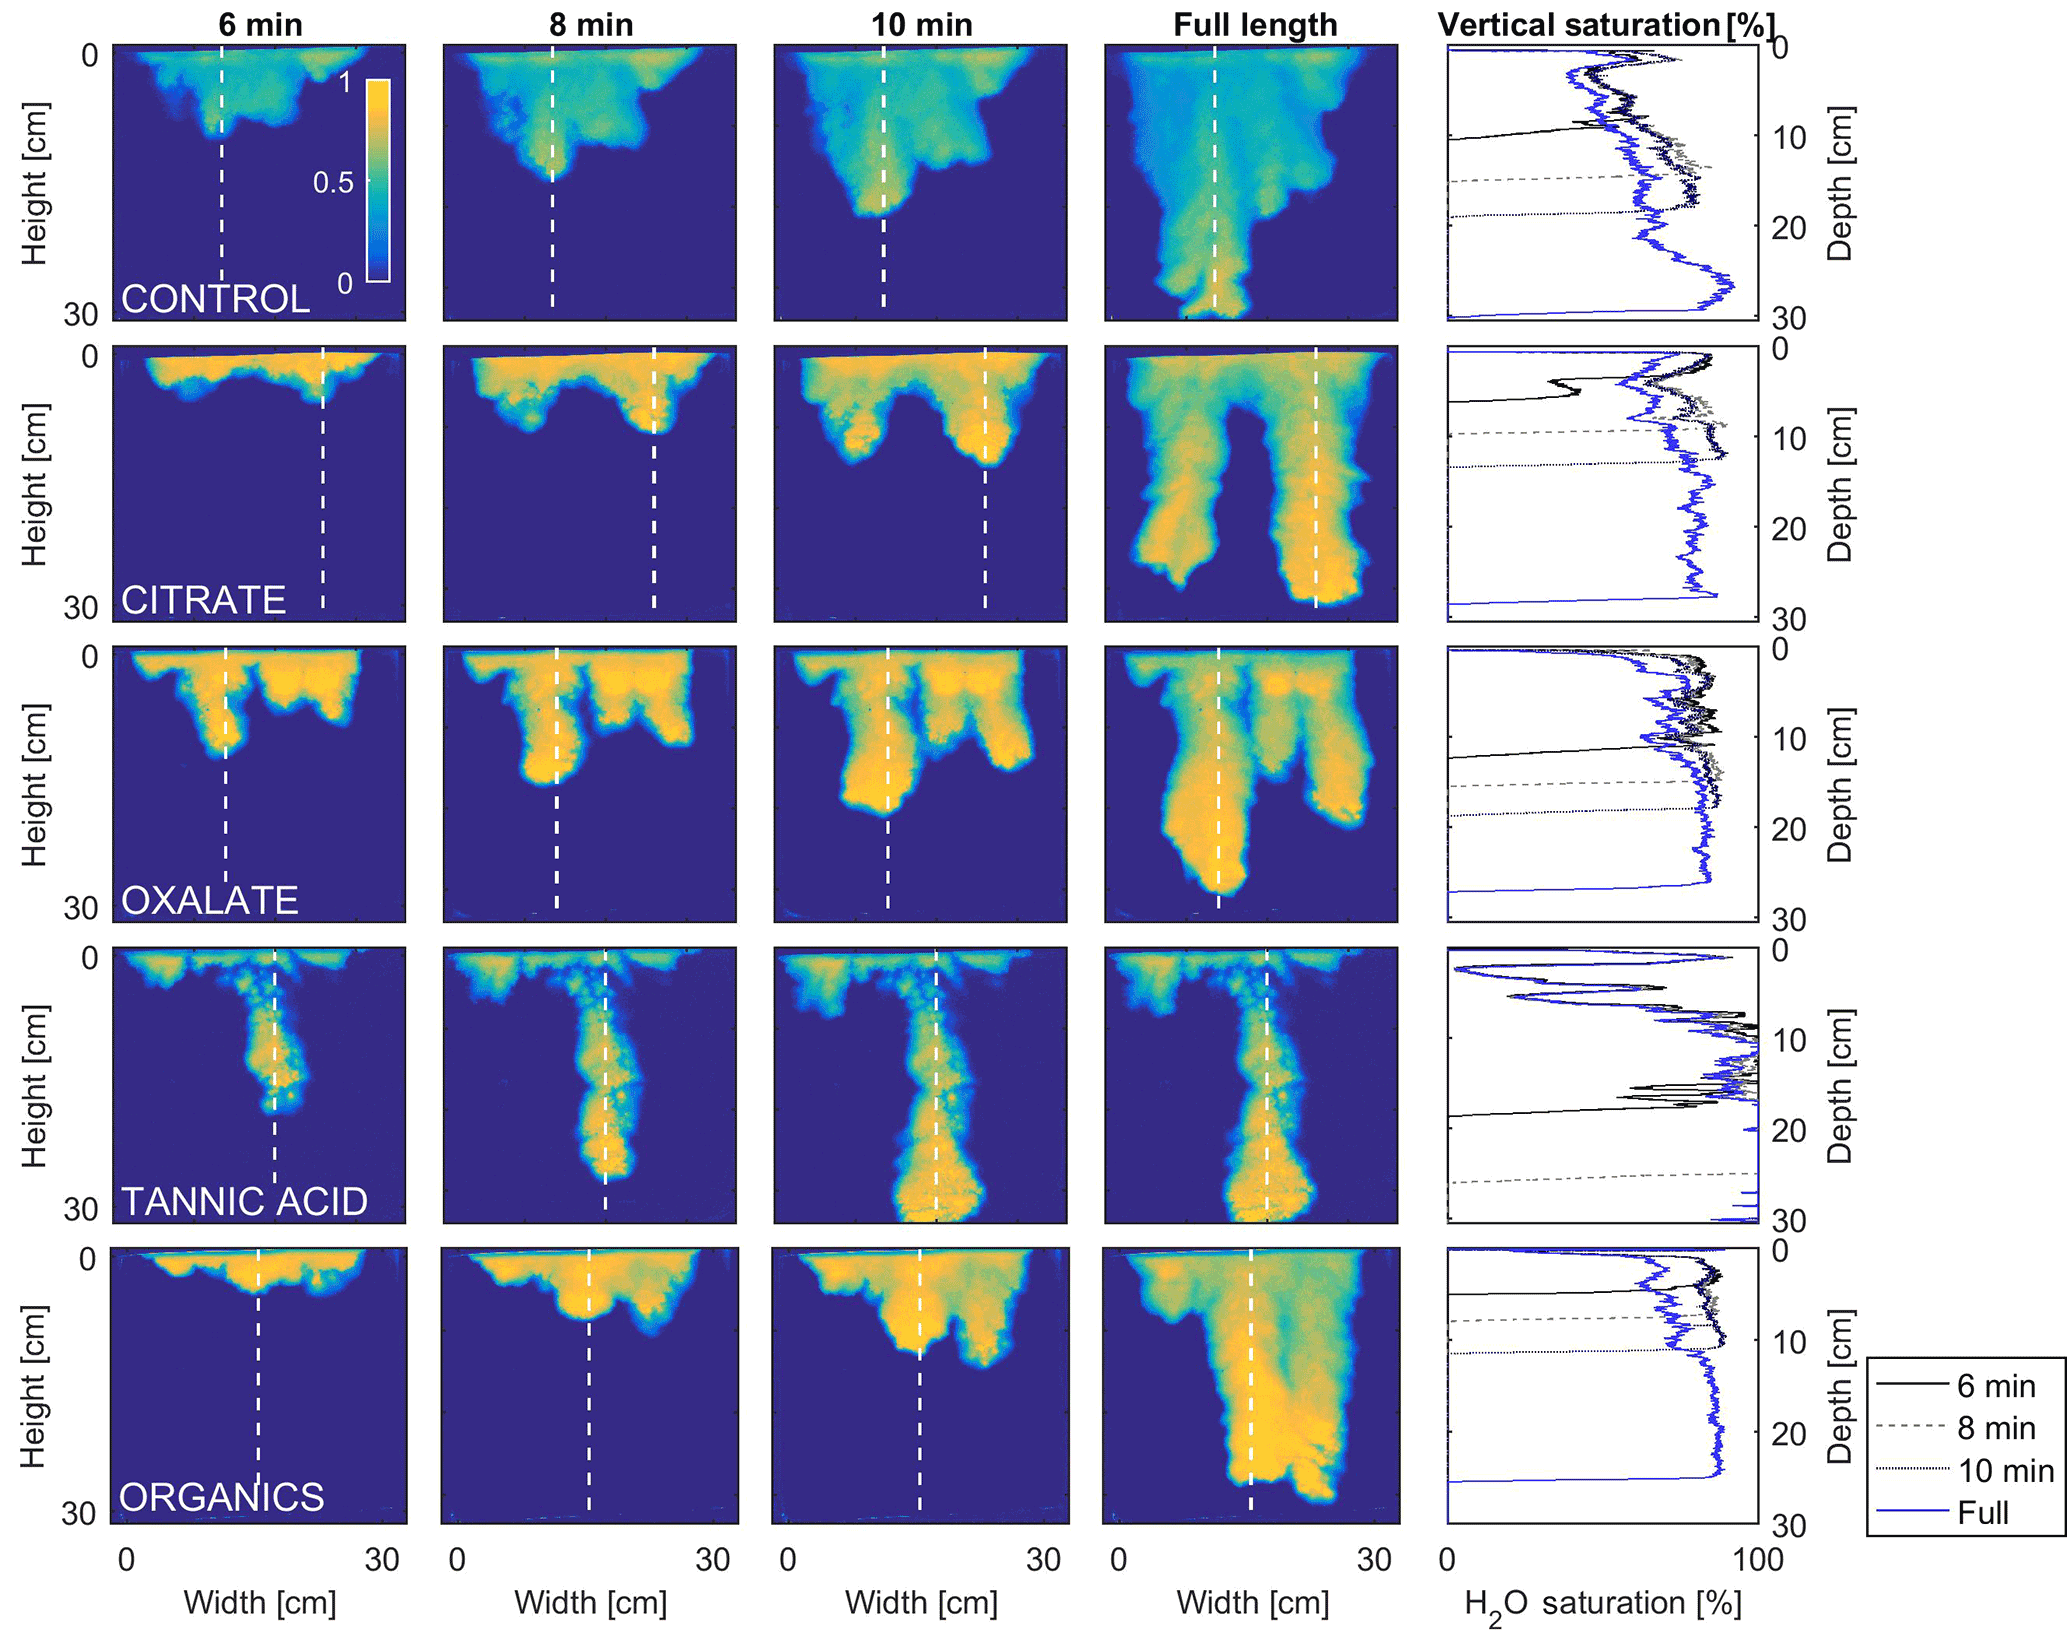
Figure 10Multigraph comparison of the dynamic vertical profiles of infiltration of water in US Silica C778 ASTM graded sand for control (NaCl + HNS), and high concentrations of plant exudates (citrate and oxalate) and soil components (tannic acid and organics: Suwanee River natural organic matter, SRNOM). The images are of the main finger and the vertical water saturation profile analysis over time.
The horizontal finger saturation profiles were taken at 25, 50, 75, and 90 % of the main finger's length at 10 min (Figs. 11 and 12). The greatest water saturation occurred within the middle finger of the NaCl + HNS control water saturation profile (∼ 85 %), which gradually dispersed toward the finger edges (∼ 25–38 %). Although both oxalate concentrations exhibited similar saturations in the center of the fingers (∼ 87 %), the higher concentration had a greater dispersion zone (∼ 40 %) than the lower (∼ 60 %). A high level of saturation was observed in the substantial portion of the center of the main finger in the 0.1 mg L−1 citrate sample (∼ 100 %), with a small sharp zone of dispersion (∼ 60 %) along the edges of the finger. However, although less saturation (∼ 85 %) was observed in the middle of the finger of the 500 mg L−1 citrate sample, a greater dispersion zone (∼ 40–50 %) did manifest along the finger's edge. SRNOM at both concentrations exhibited a similarly high saturation (∼ 88 %) in the center of the finger, although the 10 mg L−1 sample had a smaller zone of dispersion saturation (∼ 50 %). Overall, unlike the lower exudate concentrations that exhibited smaller water saturation dispersion zones toward the finger edges, at the higher concentrations, an increase in water saturation was observed through the center of the finger, and larger water saturation dispersion zones were observed moving toward the finger edges. Tannic acid responded differently than any of the other constituents, exhibiting lower saturation (∼ 85 %) in the middle of the finger and a greater dispersion zone (∼ 60 %) at 0.1 mg L−1. At 500 mg L−1, a higher saturation (∼ 100 %) in the middle of the finger and a smaller dispersion zone (∼ 75 %) were observed.
4.1 Infiltration processes
The abrupt difference in the vertical and horizontal water saturation distribution profiles of the fingers that displayed high water saturation behind the wetting front and dry porous media ahead of the wetting front (Figs. 9–12) is related to the soil water sorptivity (Philip, 1955; Parlange, 1971a) as it induced the flow of water in porous media under various contact angles (Wallach et al., 2013). The interplay between the resistance to wetting resulting from the contact angle at the wetting front together with saturation overshoot and wetting front propagation is visualized by the vertical and horizontal water saturation distribution profiles that demonstrated in most cases the fingered flow with saturation overshoot (Figs. 9 and 10) and decrease in contact angle (Figs. 5 and 6) of all the systems tested compared to the control infiltration experiment.
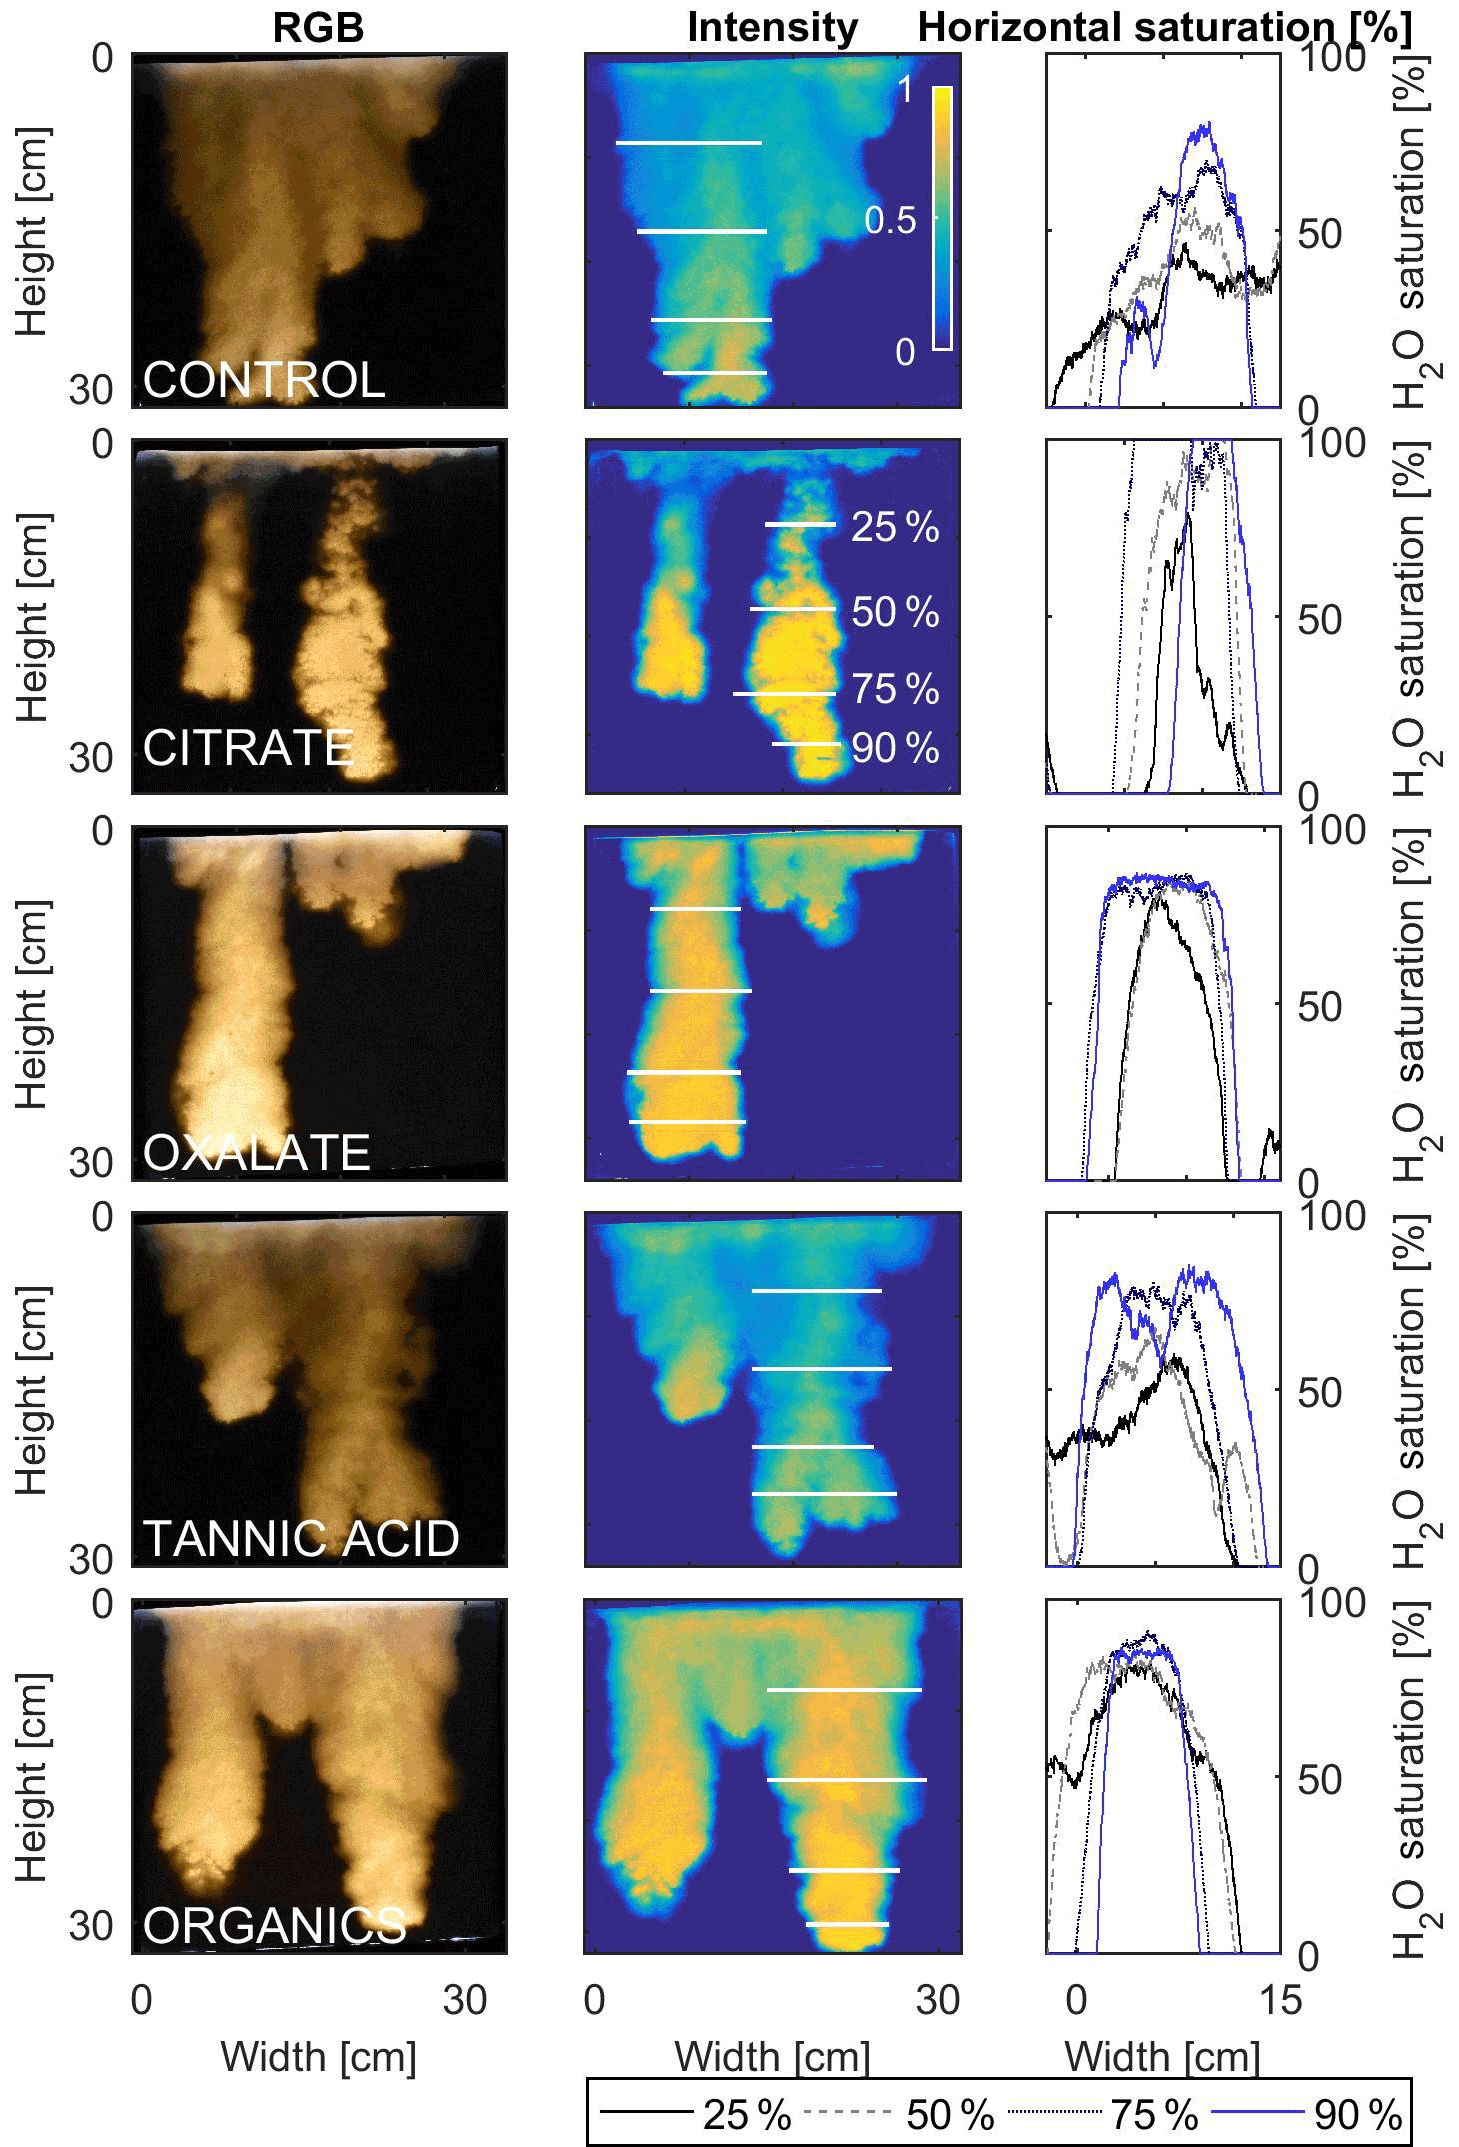
Figure 11Multigraph comparison of the finger width profiles of infiltration of water in US Silica C778 ASTM graded sand for control (NaCl + HNS), and low concentrations of plant exudates (citrate and oxalate) and soil components (tannic acid and organics: Suwanee River natural organic matter, SRNOM). The images are of the main finger at its full length. The location of the horizontal water saturation profile analyses and widths are measured at 25, 50, 75, and 90 % of the total fingers length.
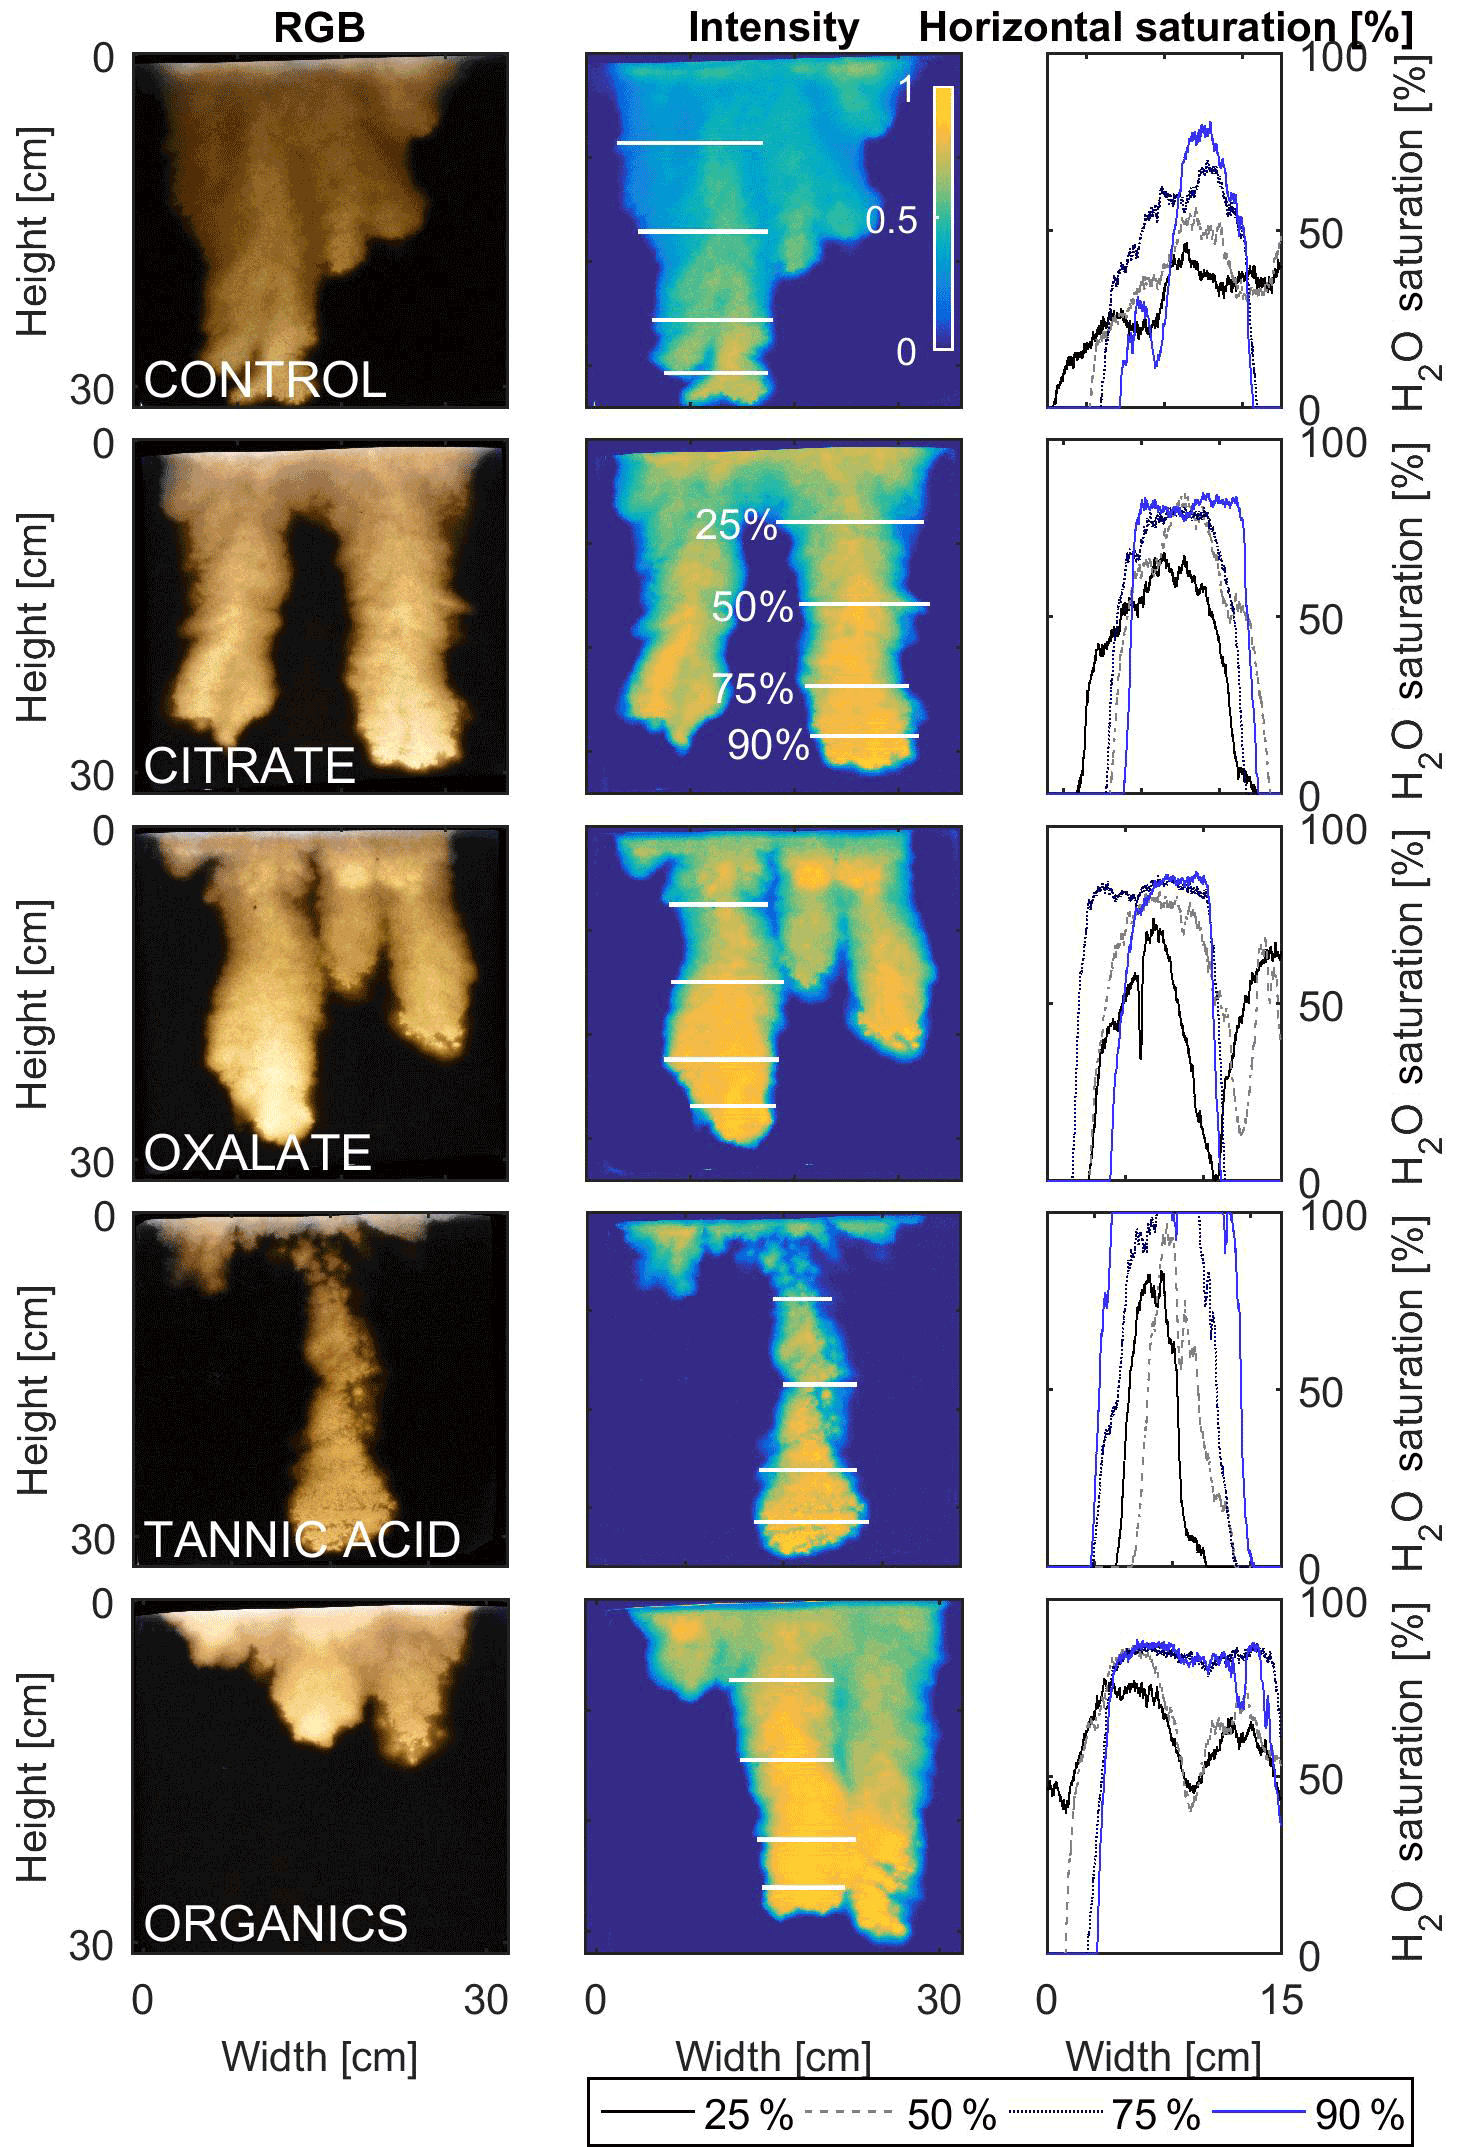
Figure 12Multigraph comparison of the finger width profiles of infiltration of water in US Silica C778 ASTM graded sand for control (NaCl + HNS), and high concentrations of plant exudates (citrate and oxalate) and soil components (tannic acid and organics: Suwanee River natural organic matter, SRNOM). The images are of the main finger at its full length. The location of the horizontal water saturation profile analyses and widths are measured at 25, 50, 75, and 90 % of the total fingers length.
In the initial phase of the infiltration process in dry porous media, the wetting front diffuses through the porous medium as the capillary forces dominate the gravity forces. The wetting front is wetting the sandy porous media, making it quite wet or moist, resulting then in a contact angle close to zero. Afterwards, as the capillary forces and the gravity forces assume an equal status, the wetting front propagates downward as a traveling wave. An abrupt wetting front is then generated with a high level of water saturation, which causes the development of an unstable wetting front that in turn causes the formation of fingered flow when small heterogeneities are encountered (which is inevitable, even in a practically homogeneous medium). A higher (advancing) contact angle is located at the wetting front that propagates in the porous medium and a lower (receding) contact angle is present in the now-wetted porous medium (Morrow, 1976). The disproportion between the inward and outward fluxes at the fingertip increases, which results in the development of the overshoot saturation. Our experimental results, which include the vertical water distribution profiles, the visualization of the overshoot saturation, and the wetting front velocity measurements, support these findings (Figs. 9 and 10; Table 3).
4.2 Redistribution processes
After the initial infiltration process the redistribution within the fingering flow differs depending upon the solution chemistry and concentration. A noticeable effect of the constituents and concentrations upon the water distribution was observed and can be attributed to the different matric potentials within the fingers (DiCarlo, 2004; Glass et al., 1989c, d; Wallach et al., 2013). Although this increase in the matric potentials causes “saturation overshoot” (i.e., resulting in saturated fingertips), a reduced matric potential enhances the fluid movement in the porous media which results in a more uniform water saturation distribution in the fingers (Figs. 9–12) (DiCarlo, 2004; Glass et al., 1989c, d; Wallach et al., 2013). The occurrence of “saturation overshoot” at the fingertips occurs as the result of the fingering flow failing to overcome the pressure potential to ensure the downward flow (as seen in Figs. 9–12), most notably in the citrate and tannic acid flow systems. It is possible, however, to use data from the fundamental contact angle and surface tension analysis of the solutions in conjunction with the “saturation overshoot” observations to further illustrate how the wettability changes the flow patterns and the water content distribution of the finger saturation profiles. An increase in wettability causes an increase in solution sorptivity due to the reduction in the matric potential required for the solution to enter the pore spaces. These pressure changes result in variations in the water saturation distributions determined elsewhere. Specifically, Wallach et al. (2013) found that for systems with higher contact angles, the air-entry pressure was greater, and thus the fingering flow was most likely to develop a more highly saturated fingertip (DiCarlo, 2004; Glass et al., 1989c, d; Wallach et al., 2013). Similar results were determined in this present analysis in which the higher concentration solutions exhibited lower contact angles (except for tannic acid) with more uniform saturation distributions. A comparison between the low and high concentrations for citrate and tannic acid clearly indicated the presence of “saturation overshoot” at lower concentrations when the contact angle was greater. At higher concentrations, however, the solution saturation exhibited a greater uniformity with a more substantially reduced contact angle. However, these conclusions cannot be applied to oxalate and SRNOM, which at both concentrations exhibited uniform saturations, illustrating that factors such as flow velocity (Wallach et al., 2013) clearly affect the finger geometries and development. Additionally, with limited comparable plant exudate studies, comparisons can be drawn to existing studies upon the effects of surfactants in soil systems since plant exudates act as organic surfactants in the rhizosphere. It was determined that the simulated plant exudates and the soil constituent solutions exhibited behaviors similar to those delineated in the studies of Bashir et al. (2011) and Henry et al. (2002), which demonstrated that the solute concentration, ionic strength, and pH affected not only the surface tension but also the contact angle.
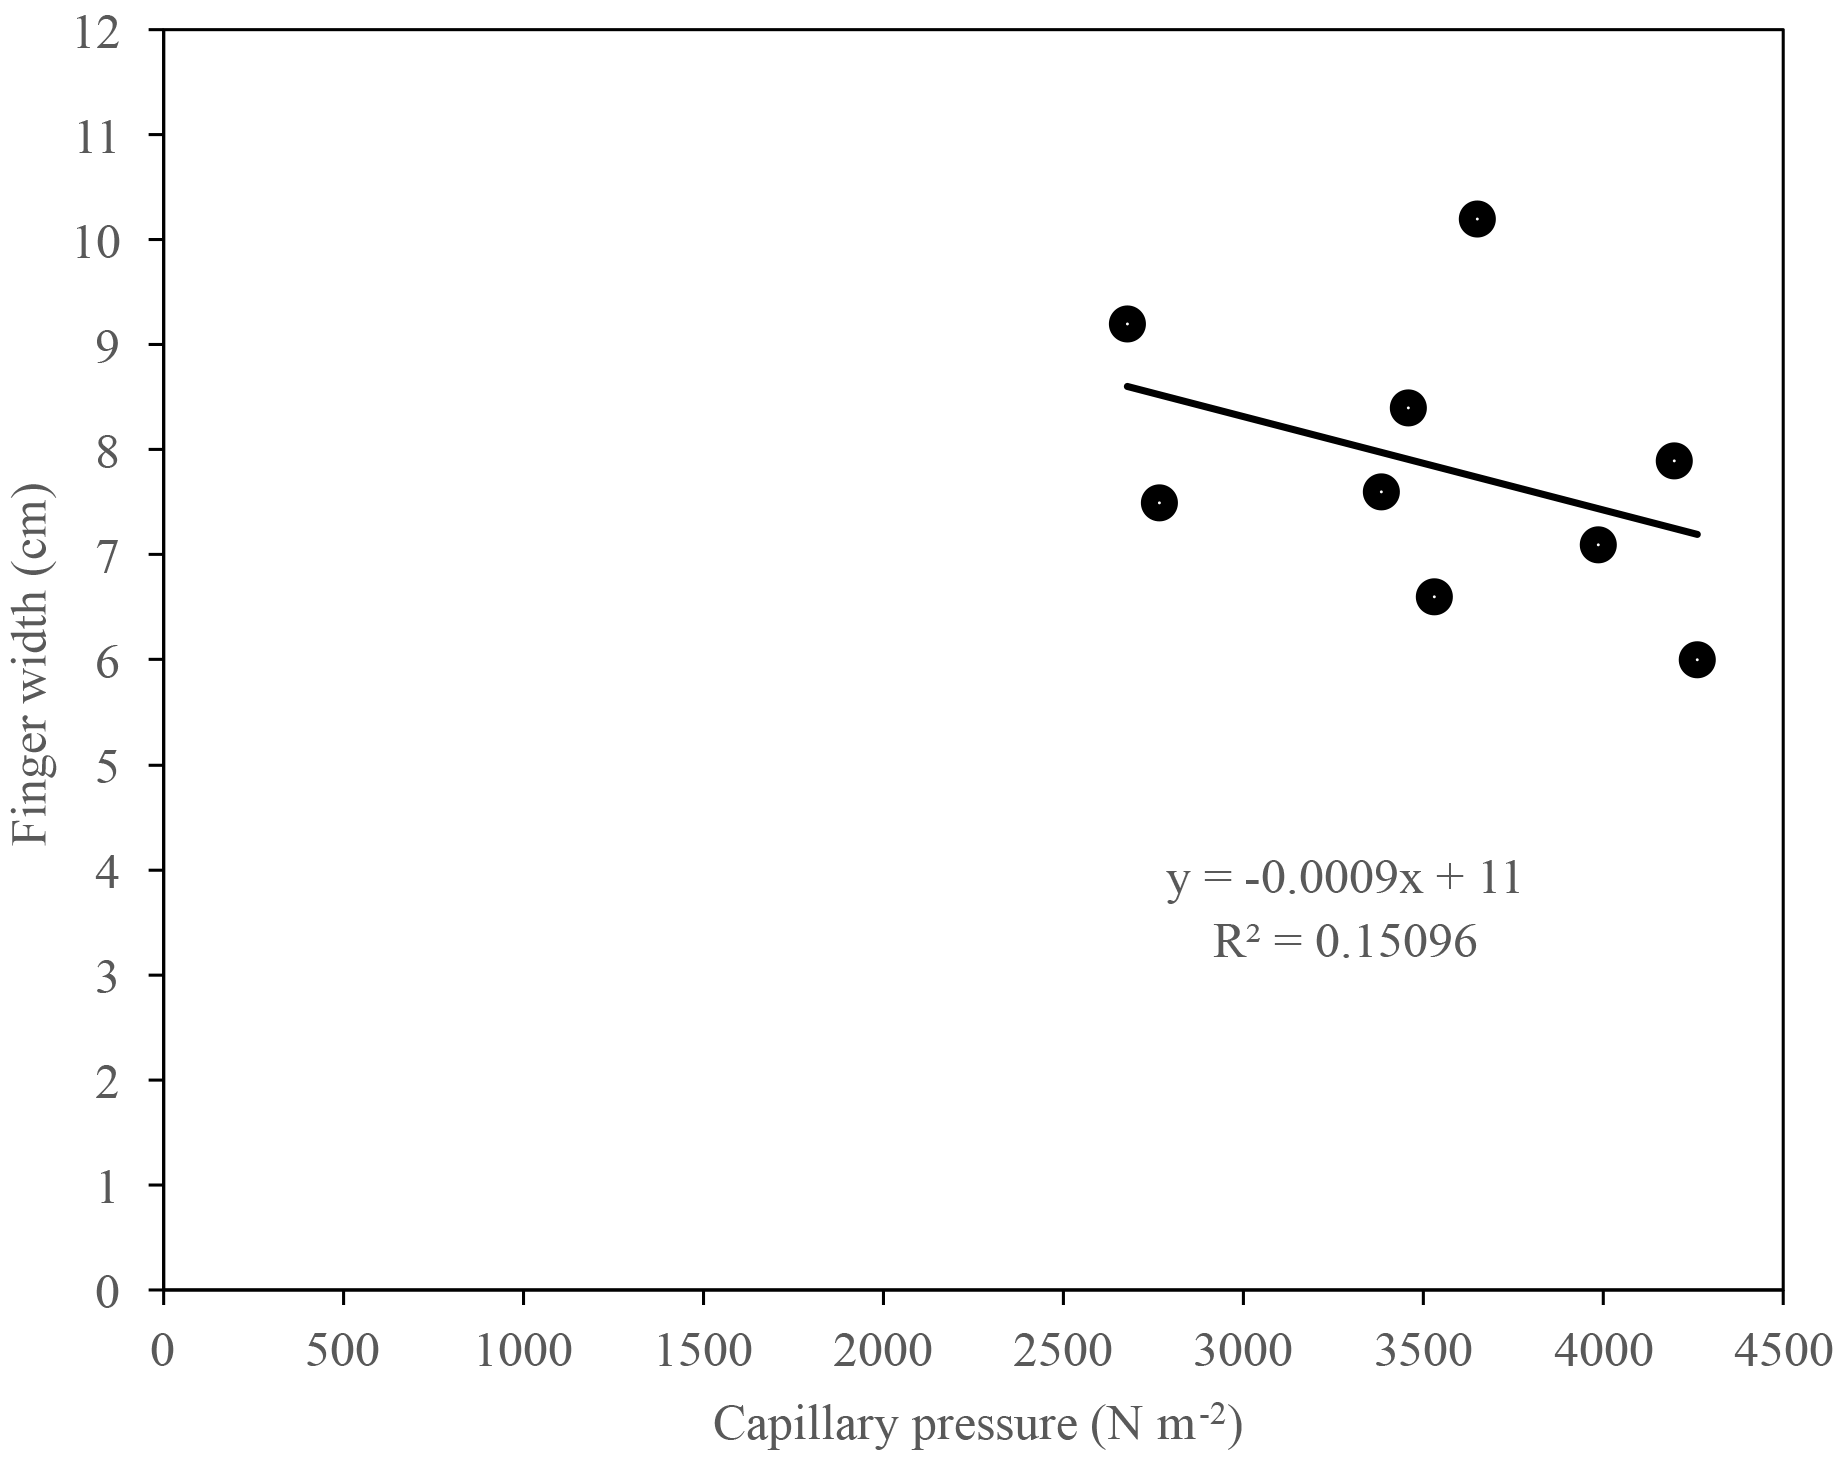
Figure 13Finger width vs. capillary pressure of fully formed fingers resulting from infiltration of water in US Silica C778 ASTM graded sand for control (NaCl + HNS), plant exudates (citrate and oxalate), and soil components (tannic acid and organics: Suwanee River natural organic matter, SRNOM).
4.3 Finger geometry and capillary potential
Comparisons should be made between finger geometry and capillary potential by using the Young–Laplace equation, and not individually with contact angle. The reason is that tannic acid did not show a difference in contact angle between low and high concentrations, but it did show a large difference in surface tension and in finger geometry. The capillary pressure calculation would capture that difference. The Young–Laplace equation can be used to express capillary pressure at the pore scale as a function of surface tension and contact angle. This equation is expressed as follows:
where PC is for the capillary pressure, γ and θ are the surface tension and contact angle of a solution, respectively, and r is the radius of the pore size of the medium (Lord et al., 1997).
Modeling approaches have been developed to assess the relationships between particle sizes and pore size distributions in porous media constituted by multicomponent particles (Assouline and Rouault, 1997). By taking a multicomponent pack of an infinity of particles described by a particle size distribution (PSD), f(r), which satisfy the dense random packing condition (Wise, 1952), four particles of radii r1, r2, r3, and r4 that are in contact form an empty void space in a porous medium. The volume of this void is approximated by the volume of the osculatory sphere of radius rV (Soddy, 1936), which can be used as an estimated value of r, the radius of the pore size of the medium, and expressed as follows:
The examination of the relationship between the finger width and the capillary pressure of fully formed fingers resulting from infiltration of water in US Silica C778 ASTM graded sand for the tested solutions showed that the finger width tended to increase as the capillary pressure decreased (Fig. 13). The observed weak correlation in the finger width and capillary pressure relationship indicates that the capillary pressure difference across the water–air interfaces may to a certain degree influence the propagation of the wetting front and development and growth of fingers, as well as the sorptivity. As previously stated by Wallach et al. (2013), “this effect can be mainly related to the soil water sorptivity (Philip, 1955; Parlange, 1971[a]) and its role on the spontaneous and forced water flow in the pores at different contact angles”.
4.4 Hydrodynamic scaling in porous media of finger dimensions
Unstable fingering flow geometries have been analyzed under various settings, especially that of Parlange and Hill (1976), who developed equations to calculate the width of a finger in an air–water system by including the sorptivity, and Glass and Nicholl (1996), who modified the equation to conform in air–water systems. This equation is expressed as follows:
where dc is the minimum finger width, S is the sorptivity, θs is the saturated water content, θi is the initial water content, qs is the flux, Ks is the saturated hydraulic conductivity, and π is a constant for a 2-D system (Glass et al., 1991; Wallach et al., 2013). Scaling of fluid flow in porous media was established by Miller and Miller (1956). Hydrodynamic scaling in porous media directed to unstable wetting front and fingered flow may be utilized to measure the finger width. Scaling of the equation advanced by Parlange and Hill (1976) to calculate the finger width can be performed by using the Miller and Miller scaling theory (1956). The resulting scaling equation can be applied to the width of fingers and is expressed as follows:
where ρ is liquid density, g is the gravitational constant, λ is the characteristic media length scale, σgl is the gas–liquid interfacial tension, d is the finger width, and d* is the scaled finger width (Glass and Nicholl, 1996). This scaling equation has been utilized to estimate the finger widths based on the fluid properties and porous media characteristics (Selker and Schroth, 1998). Then, we evaluated the finger widths measured in our experiment by executing a scaling based on the density of the plant exudate and soil component solutions compared with the control (NaCl + HNS) solution, the gas–liquid interfacial tension of the plant exudate and soil component solutions compared with the control (NaCl + HNS) solution, and the coupling of both the density and gas–liquid interfacial tension of the plant exudate and soil component solutions compared with the control (NaCl + HNS) solution (Table 4). Scaling results demonstrated that the fluid density, the gas–liquid interfacial tension, and the coupling of fluid density and gas–liquid interfacial tension did not have a significant effect on the scaling discrepancies of the finger widths. Scaling discrepancies of the finger widths remained similar between the experiments rather that explicating the mechanisms responsible for the differences in finger width (Table 4). The reason for these unchanged discrepancies in the scaling of the finger width can be related to the consistency of the contact angle among the experiments to be scaled when utilizing the Miller and Miller scaling theory (Selker and Schroth, 1998). Culligan et al. (2005) also revealed that soil sorptivity is governed by (cos θ)1∕2 while other studies showed the opposite (Philip, 1971). Recently, an expansion of the Miller and Miller scaling theory to scale sorptivity by contact angle was introduced by Wallach and Wang (2013). Their findings showed that the Miller and Miller scaling theory can be used to scale sorptivity by the contact angle, i.e., (cos θ)1∕2 in the case of uniform pore media. This is the case here, as our experiments are performed in homogeneous and uniform sandy porous media in which the fingering flow phenomenon develops. Based on these conclusions, the finger width was scaled with (cos θ)1∕2 to include the influence of contact angle and pore dimension (Table 4) and expressed as follows:
Scaling results demonstrated that the use of (cos θ)1∕2 does not decrease the scaling discrepancies of the finger width but increases the scaling discrepancies of the finger width (Table 4), thus proving some influence of the contact angle, through the expression of (cos θ)1∕2, on the formation and growth of fingers in porous media and the width of fingers, as well as providing evidence of the pore scale factor in fingering flow phenomena (Steenhuis et al., 2013).
4.5 Exudate effects
The rhizosphere is extremely complex, and interactions between the components are typically compounding, as comparisons of the study of Zarebanadkouki et al. (2016) to those of Walker et al. (2003) and Nardi et al. (2000) indicate. Root exudates have been shown to change soil physicochemical properties (Nardi et al., 2000; Walker et al., 2003) and “mucilage, a polymeric gel that is exuded by most plant roots, is believed to be one of the main factors influencing the rhizosphere hydraulic properties” (Zarebanadkouki et al., 2016). Specifically, in the broad approach used to elucidate the entire root system, Walker et al. (2003) found that the root exudates compounded with mucilage under certain circumstances exhibited a stabilizing effect on the rhizosphere (i.e., the stabilization of the soil structure near the roots). Naveed et al. (2017) demonstrated that exudates from barley roots may disperse soil while exudates from maize roots and chia seed exudates may increase soil stability around roots or seeds. While the exudates lowered the surface tension of the soil pore water, similar to what the authors determined in this research (Figs. 7 and 8), the mucilage acted as a glue, bonding soil aggregates to the root sheaths and creating a water holding space around the roots as the surrounding soil continued to dry (Walker et al., 2003). Exudates, apart from the mucilage component, ultimately exert the opposite impact on flow through the porous media. Exudates increased the mobility of the fluid through porous media as illustrated in Figs. 9–12. Specifically, in their study of the effects of plant mucilage and phospholipids on the physical and chemical properties of soil, Read et al. (2003) observed a decrease in the surface tension of the soil water brought about by very small concentrations of phospholipid surfactants and exudate organic acids (Read et al., 2003). The simplicity of analyzing solely the effects of exudates, as shown in Figs. 5–8, is beneficial in understanding the separate components of the rhizosphere as they exist (i.e., uncompounded by the rest of the multiple components). The increased soil wettability and thus mobility of the soil solution due to the presence of biogeochemical compounds need to be further studied in order to elucidate the hydrological processes and the transport of contaminants in the rhizosphere and the vadose zone.
4.6 Imaging capabilities
The recent surge in the development of visualization and modeling capabilities, specifically related to 2-D tanks, has been instrumental in studies attempting to elucidate rhizosphere systems and root zone development and characterization in situ (Carminati et al., 2016). These new capabilities, paired with current biological understandings, have yielded a novel understanding of the entire plant–root–soil–water system. However, even with such an acceleration of research, the specific distribution and paths that the fluid takes from the soil matrix into and through the plant itself remain unknown (Carminati et al., 2016). As stated by Carminati et al. (2016), “Coupling these measurements with imaging techniques that allow visualization of the root architecture and the structure and moisture of the rhizosphere could be the ultimate experiment to measure the rhizosphere properties.” The analysis presented here clearly indicates the effectiveness of combining 2-D tank systems with imaging techniques such as LTM to furthering understanding of high spatial and temporal fluid distribution and moisture gradients in the rhizosphere directly under the influence of plant roots. The increase in sensor sensitivity, particularly of matric potential sensors or pressure transducers, will be of great value in acquiring additional insight into the mechanisms occurring in the rhizosphere. As new imaging technology of soil and rhizosphere systems are developed, these technologies may be coupled with the light transmission method to study flow and transport in porous media regulated by plants and microbes. The light transmission method may also be used to support research on biological behavior and influences on flow and transport in natural porous media, as this research endeavor “will require the development of more realistic models, and additional data associated with the physical, chemical, and microbial characteristics of microenvironments in real porous media” (Baveye and Darnault, 2017).
This paper presents research on the influence of plant exudates and soil components on the infiltration process and preferential flow phenomena in soil, particularly on wetting front instability and fingered flow in unsaturated and homogeneous sandy porous media. Dynamic 2-D tank flow experiments were coupled with the unique light transmission method in order to provide a novel analysis of the influence of biogeochemical compounds on the infiltration process and wettability in a porous medium. This unique approach makes it possible for the rapid and high-resolution quantification of flow patterns and dimensions and fluid saturation profiles in porous media. Overall, solution chemistry and concentration of plant exudates and soil components were observed to exert a significant effect on the interactions between fluids and solid surfaces, and on the resulting infiltration process, finger water saturation profile, and finger width. Our findings also establish the need to consider the contact angle expressed as (cos θ)1∕2 when using the Miller and Miller (1956) scaling theory for the scaling of flow in porous media. The visualization and quantitative method and data produced here provides the basis for future analysis of the rhizosphere processes and to further our understanding of their impacts on soil hydrological processes, such as the effects of rhizosphere biophysics and biochemical compounds on soil moisture, infiltration, and drainage. Novel technological and methodological approaches in hydrology are essential to advancing our understanding of soil–water–plant systems. The results of our research will also be of use in increasing the effectiveness of agricultural practices related to irrigation application and engineering systems for soil water management.
Research data used in this study can be requested by contacting the corresponding author.
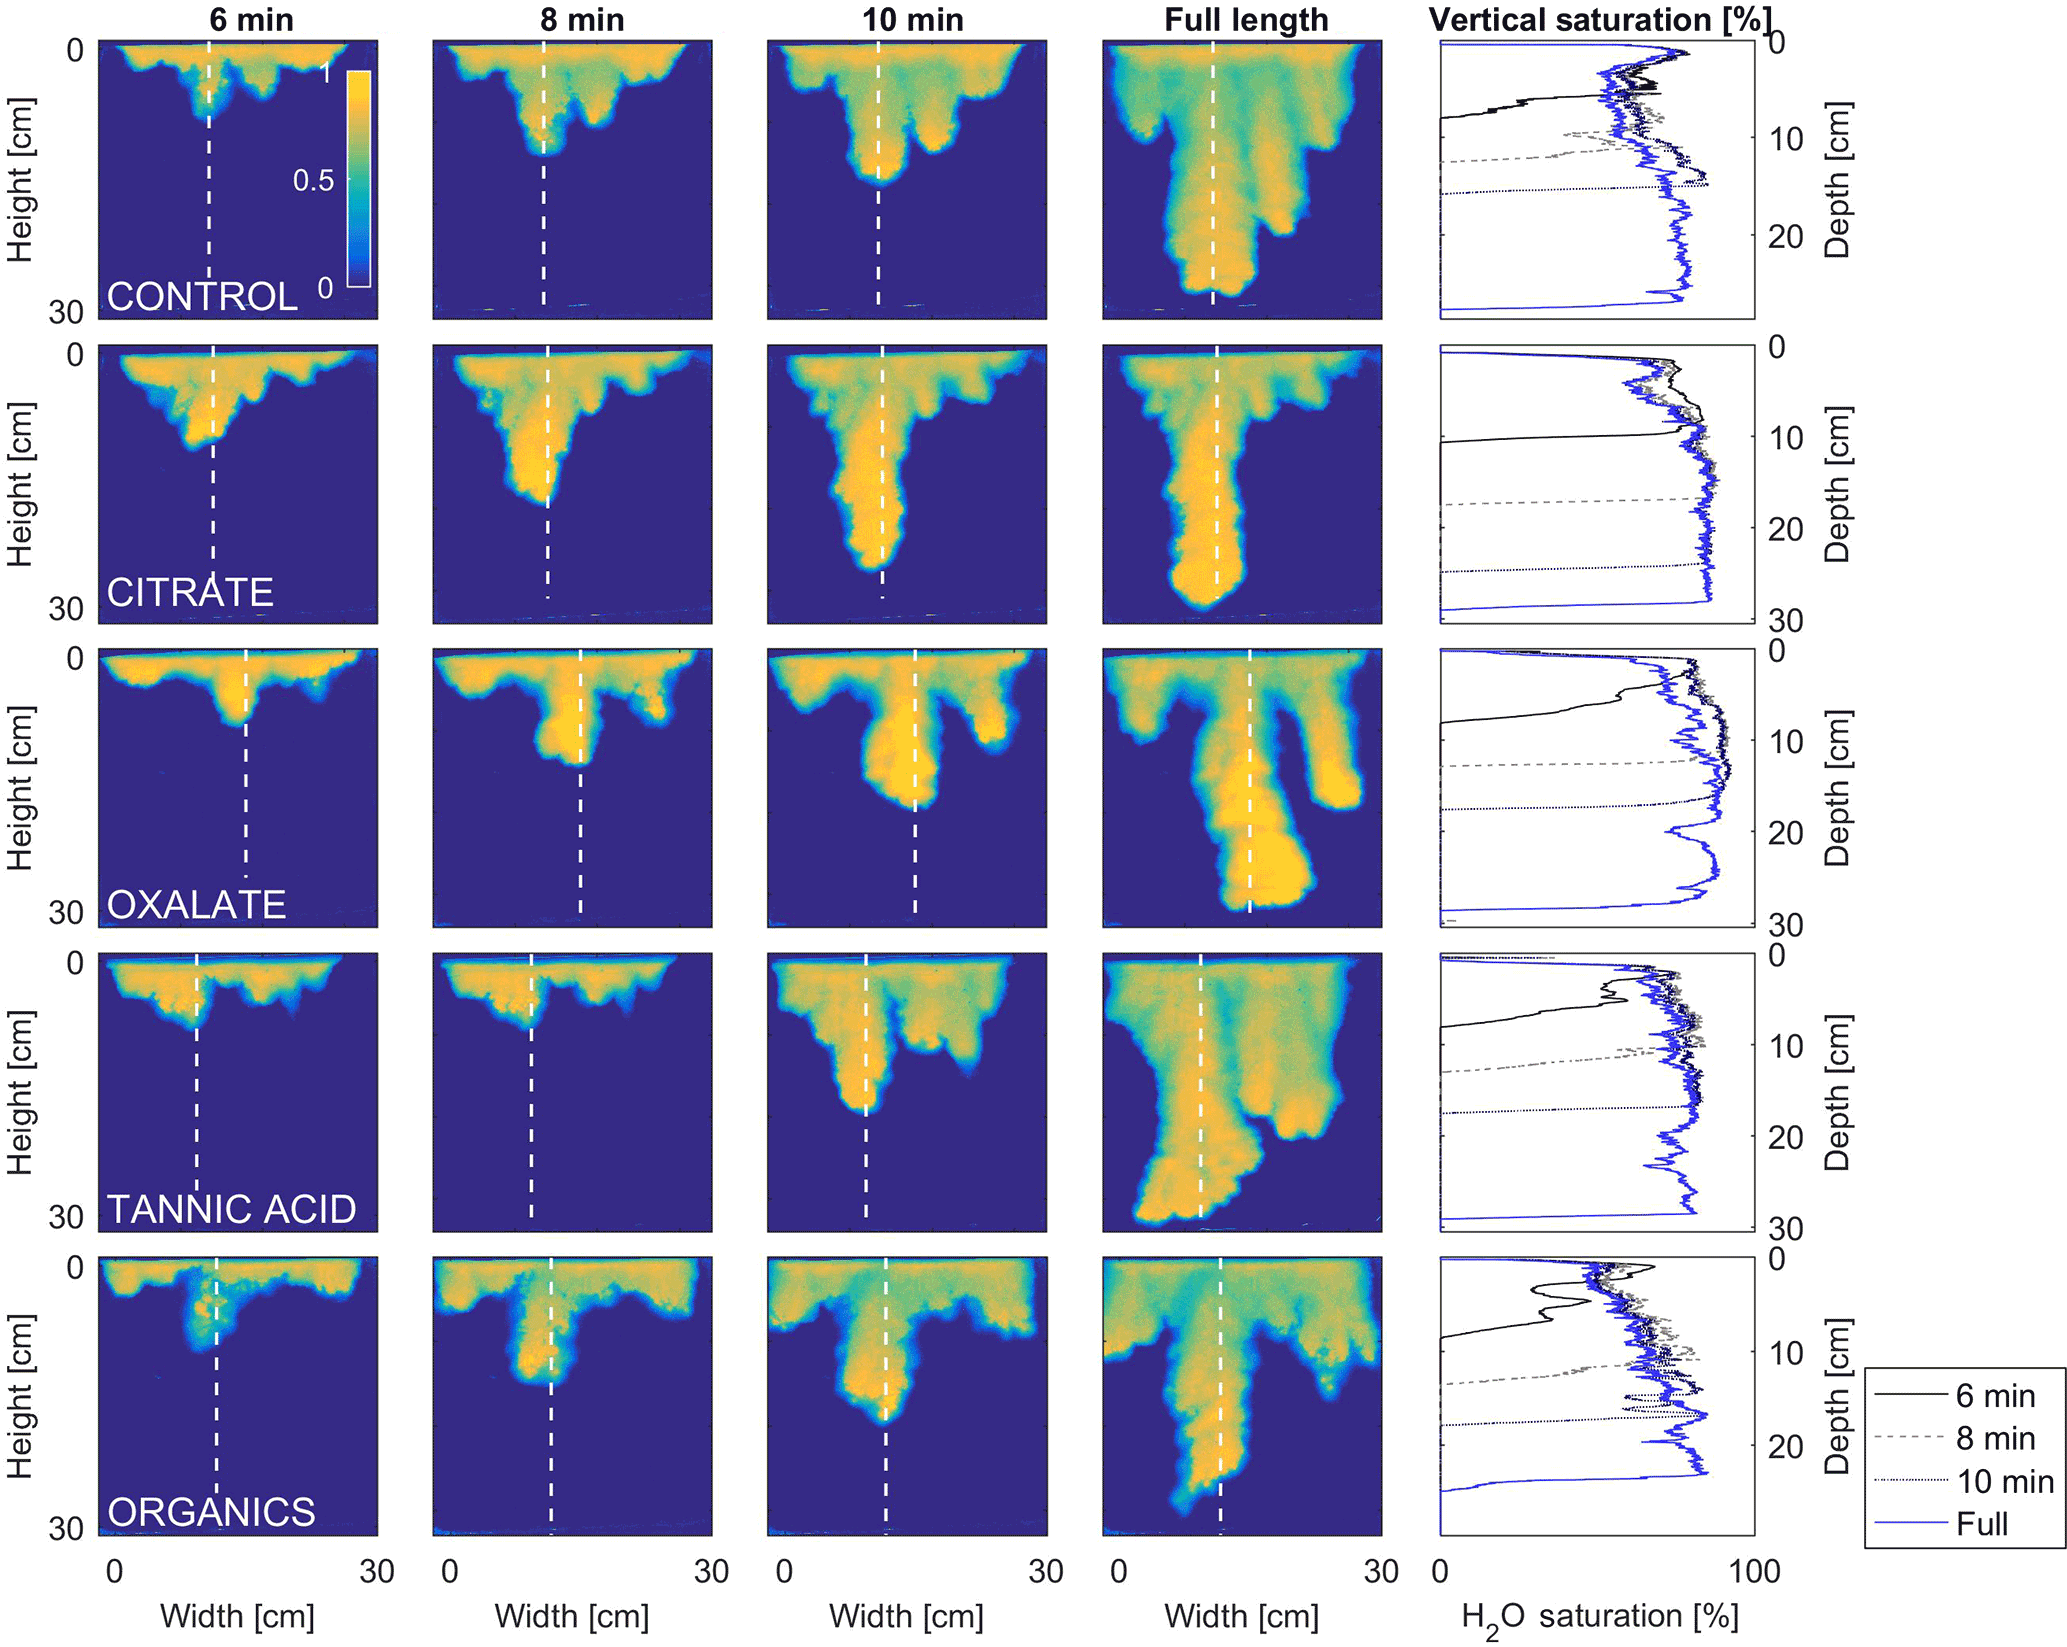
Figure A1Second tank experiment data set. Multigraph comparison of the dynamic vertical profiles of infiltration of water in US Silica C778 ASTM graded sand for control (NaCl + HNS), and low concentrations of plant exudates (citrate and oxalate) and soil components (tannic acid and organics: Suwanee River natural organic matter, SRNOM). The images are of the main finger and the vertical water saturation profile analysis over time.
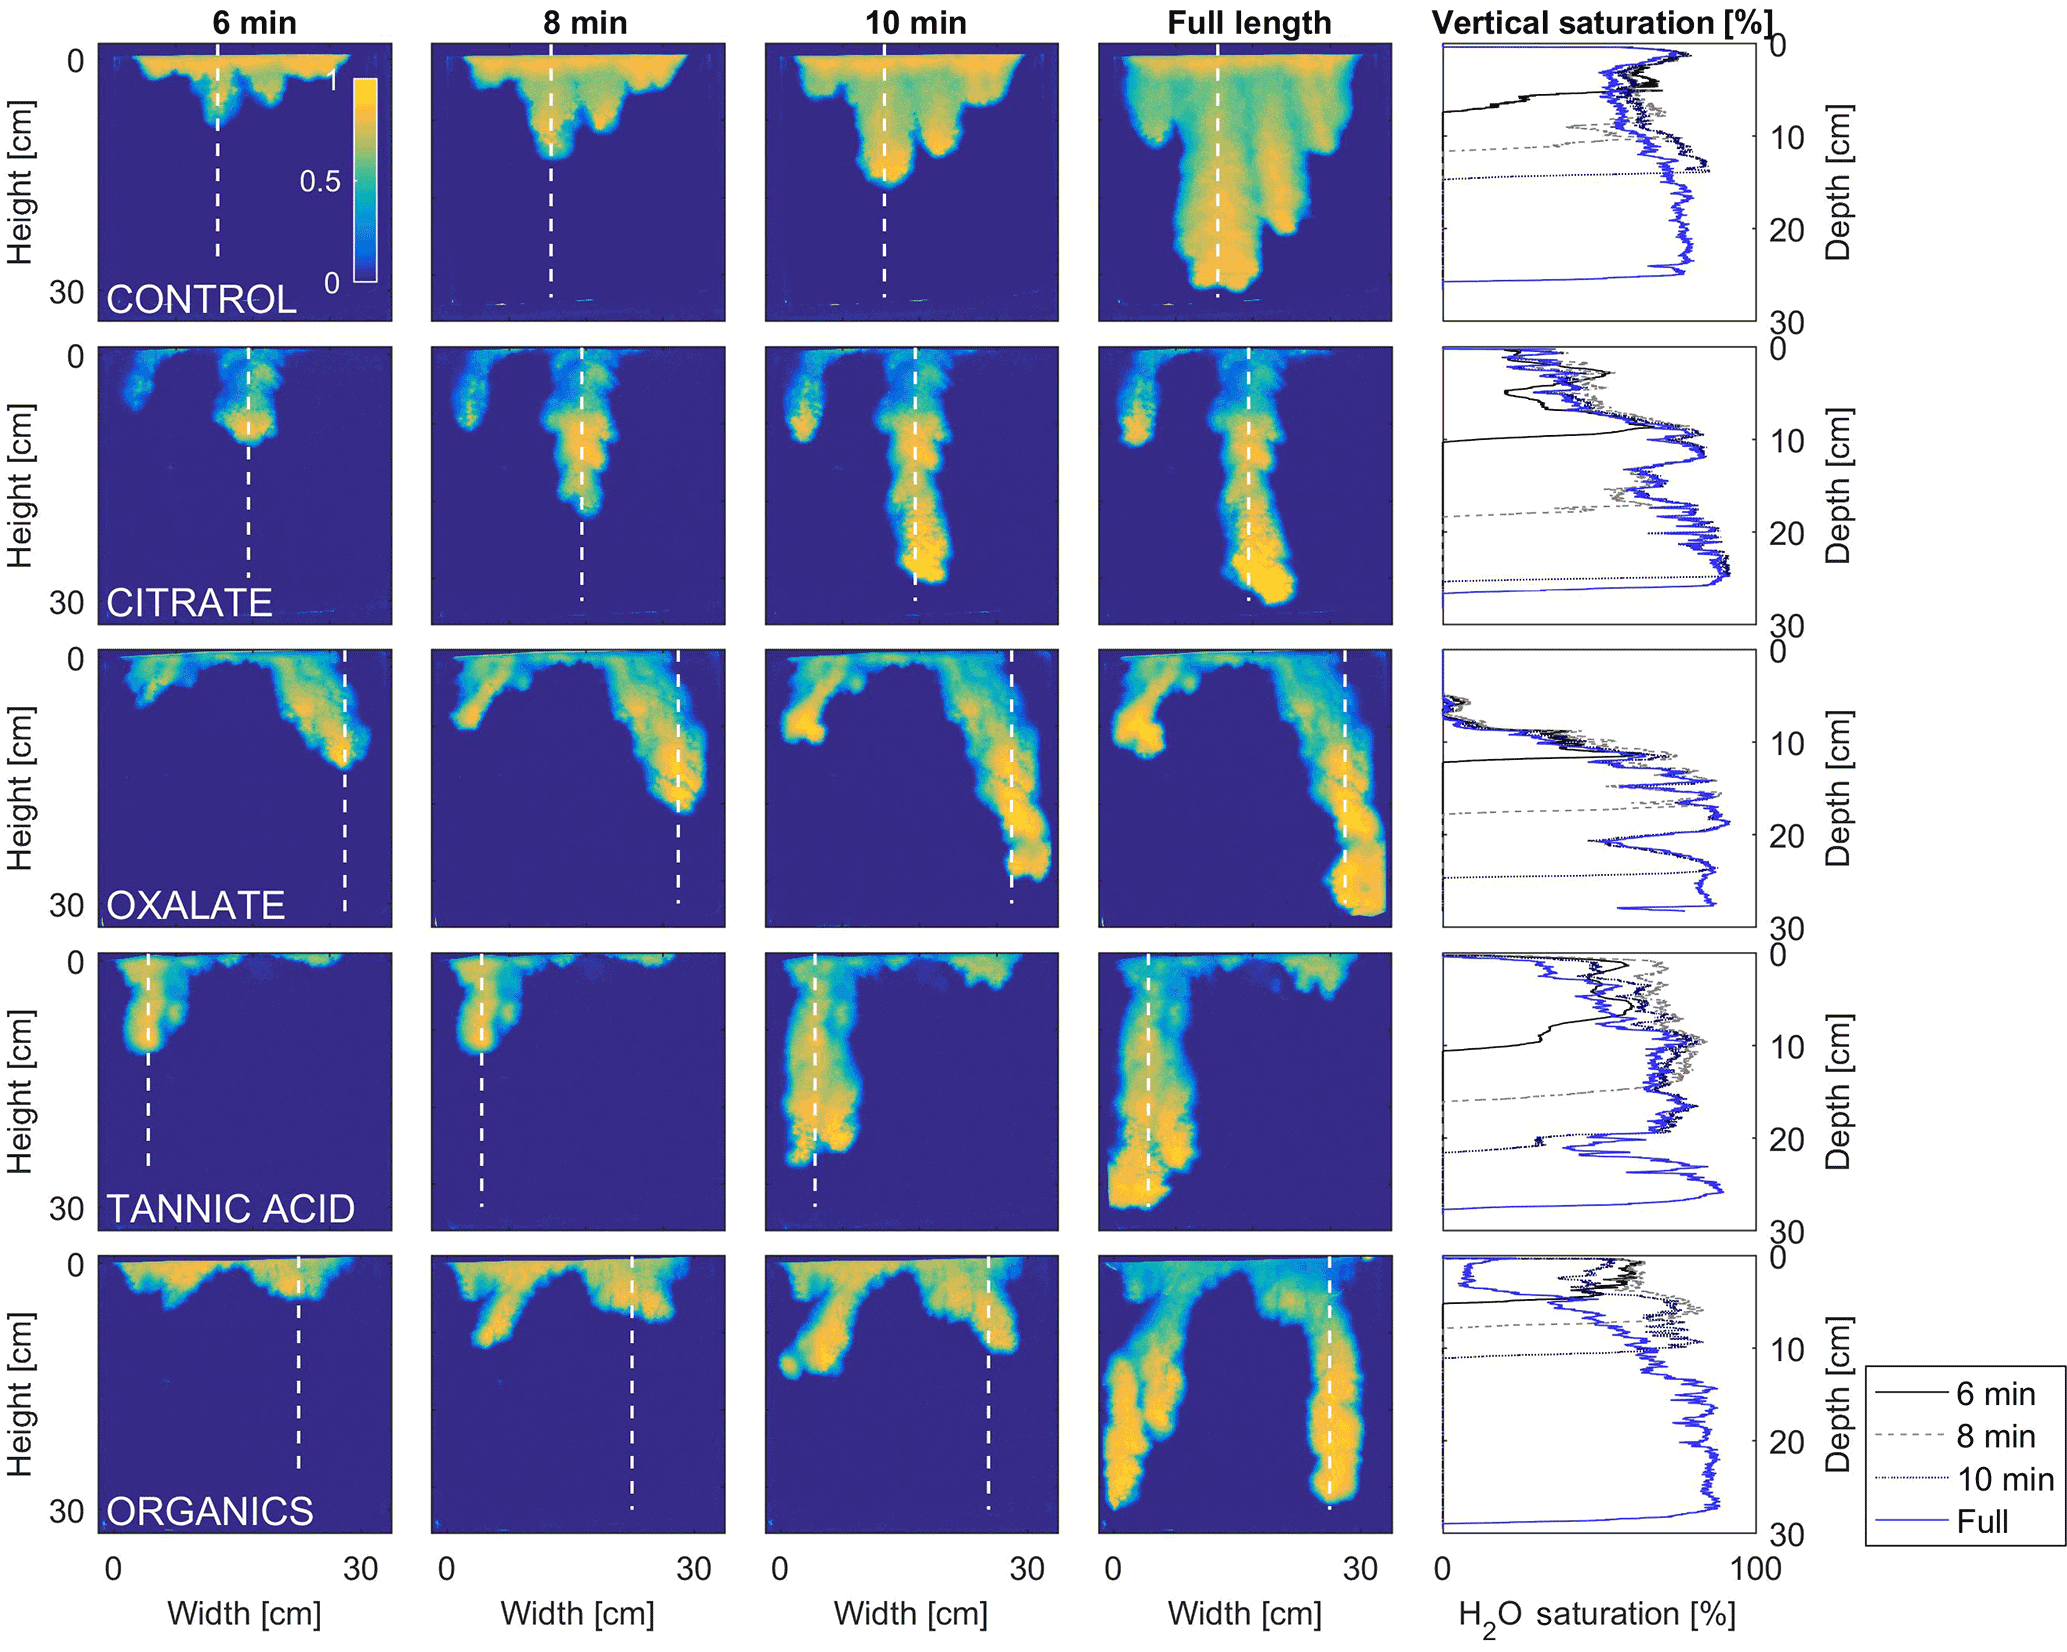
Figure A2Second tank experiment data set. Multigraph comparison of the dynamic vertical profiles of infiltration of water in US Silica C778 ASTM graded sand for control (NaCl + HNS), and high concentrations of plant exudates (citrate and oxalate) and soil components (tannic acid and organics: Suwanee River natural organic matter, SRNOM). The images are of the main finger and the vertical water saturation profile analysis over time.
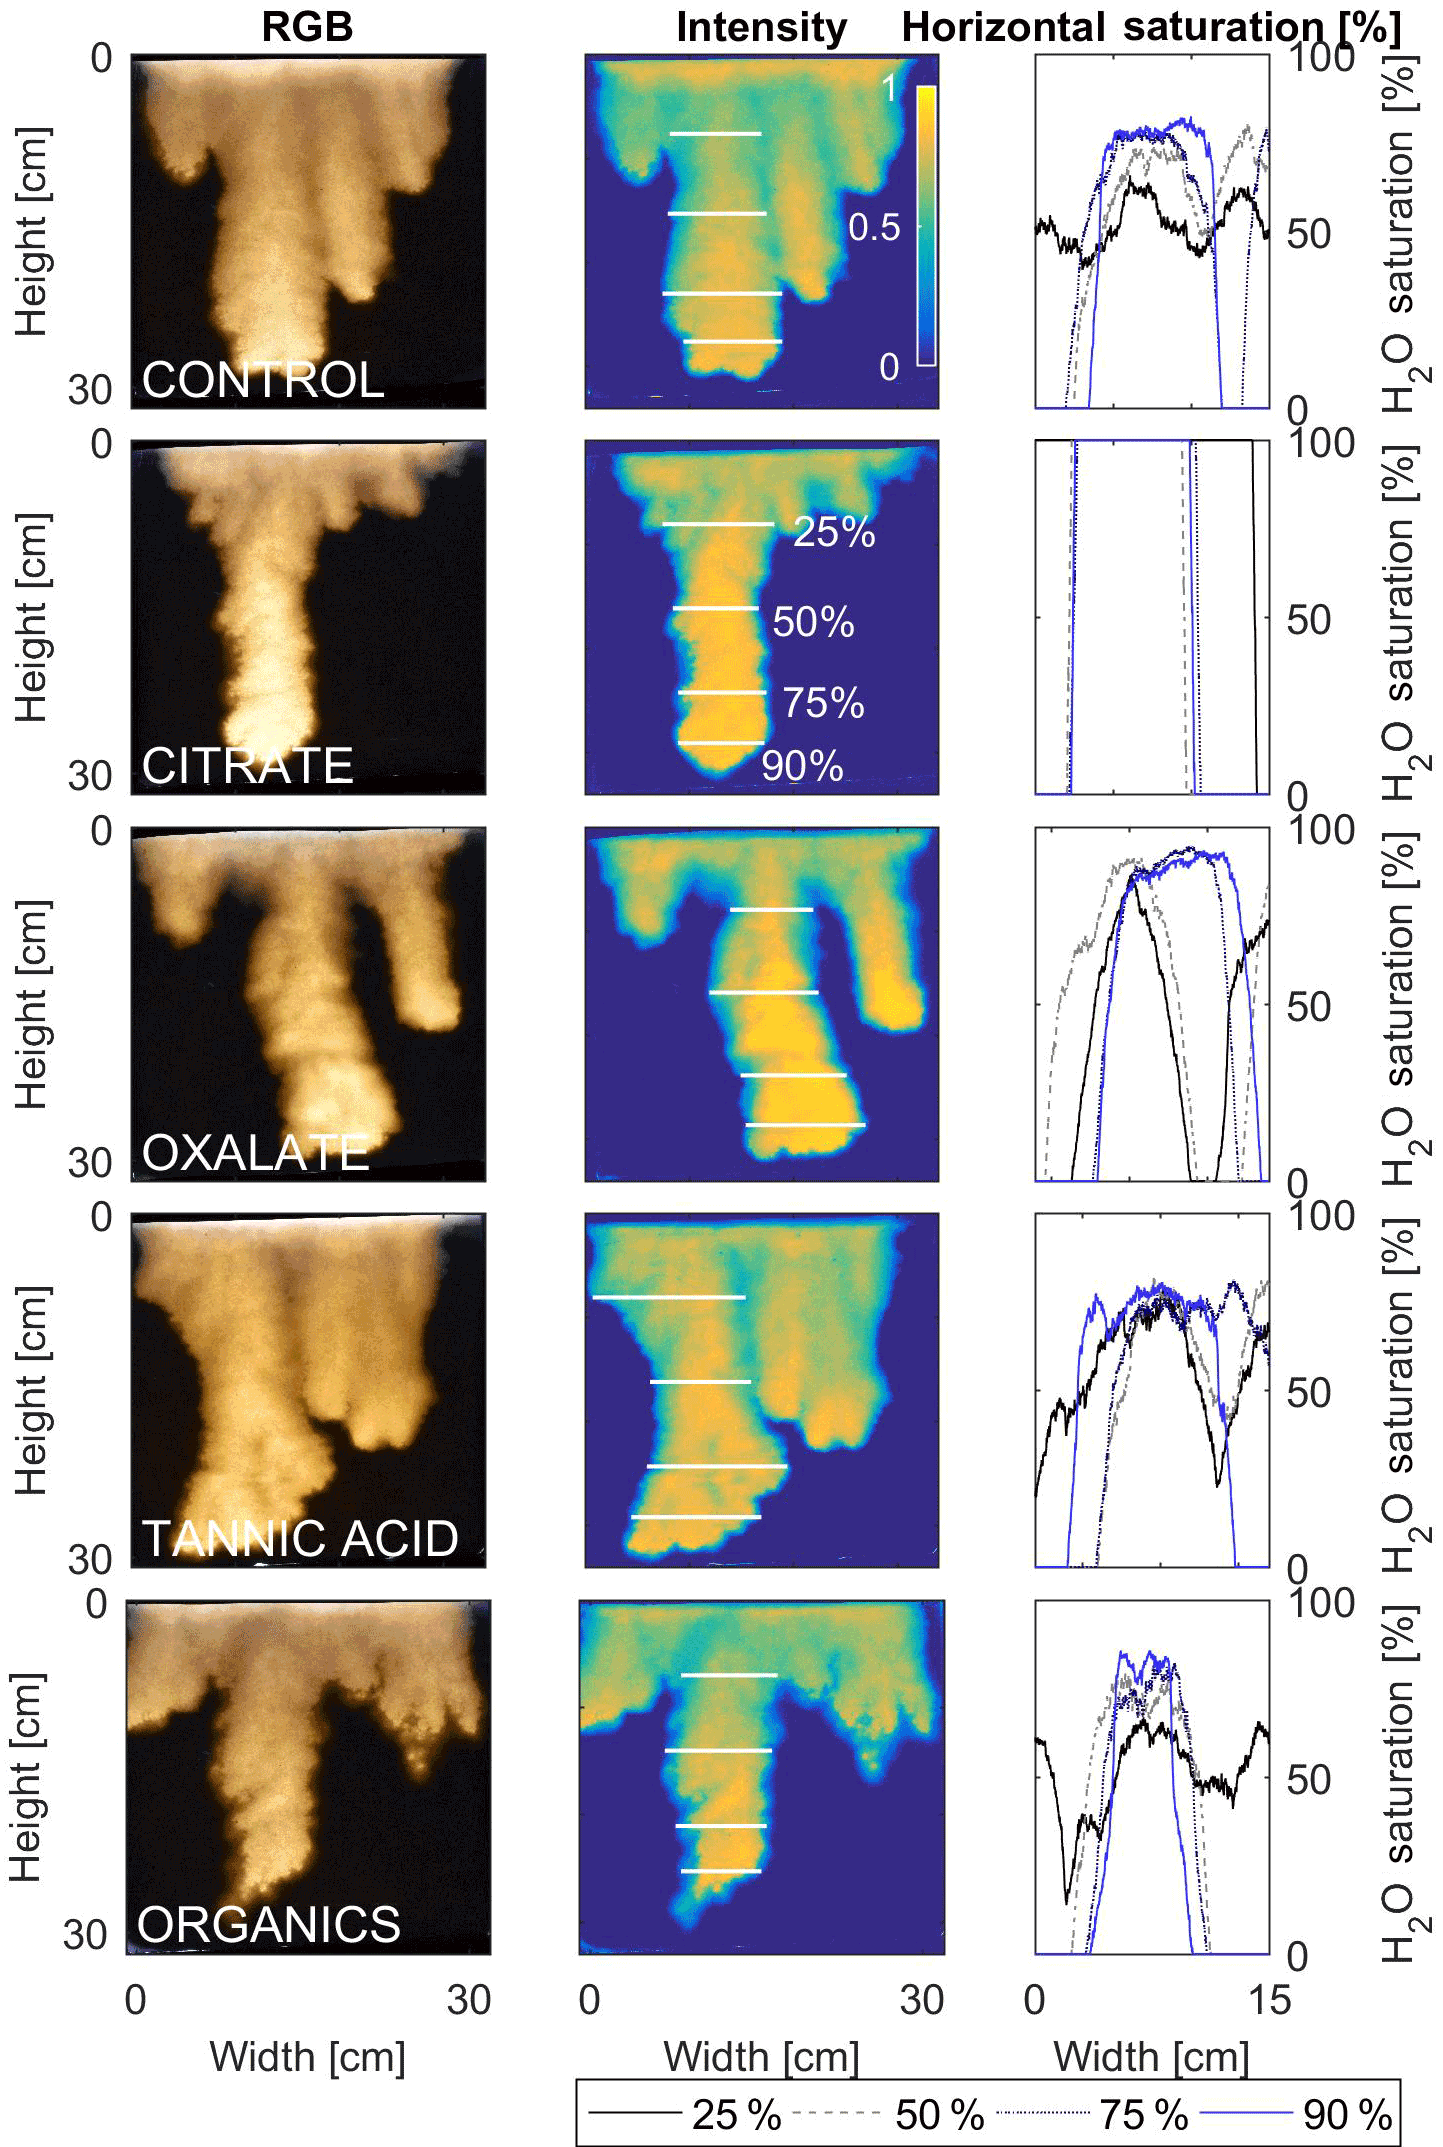
Figure A3Second tank experiment data set. Multigraph comparison of the finger width profiles of infiltration of water in US Silica C778 ASTM graded sand for control (NaCl + HNS), and low concentrations of plant exudates (citrate and oxalate) and soil components (tannic acid and organics: Suwanee River natural organic matter, SRNOM). The images are of the main finger at its full length. The location of the horizontal water saturation profile analyses and widths are measured at 25, 50, 75, and 90 % of the total fingers length.
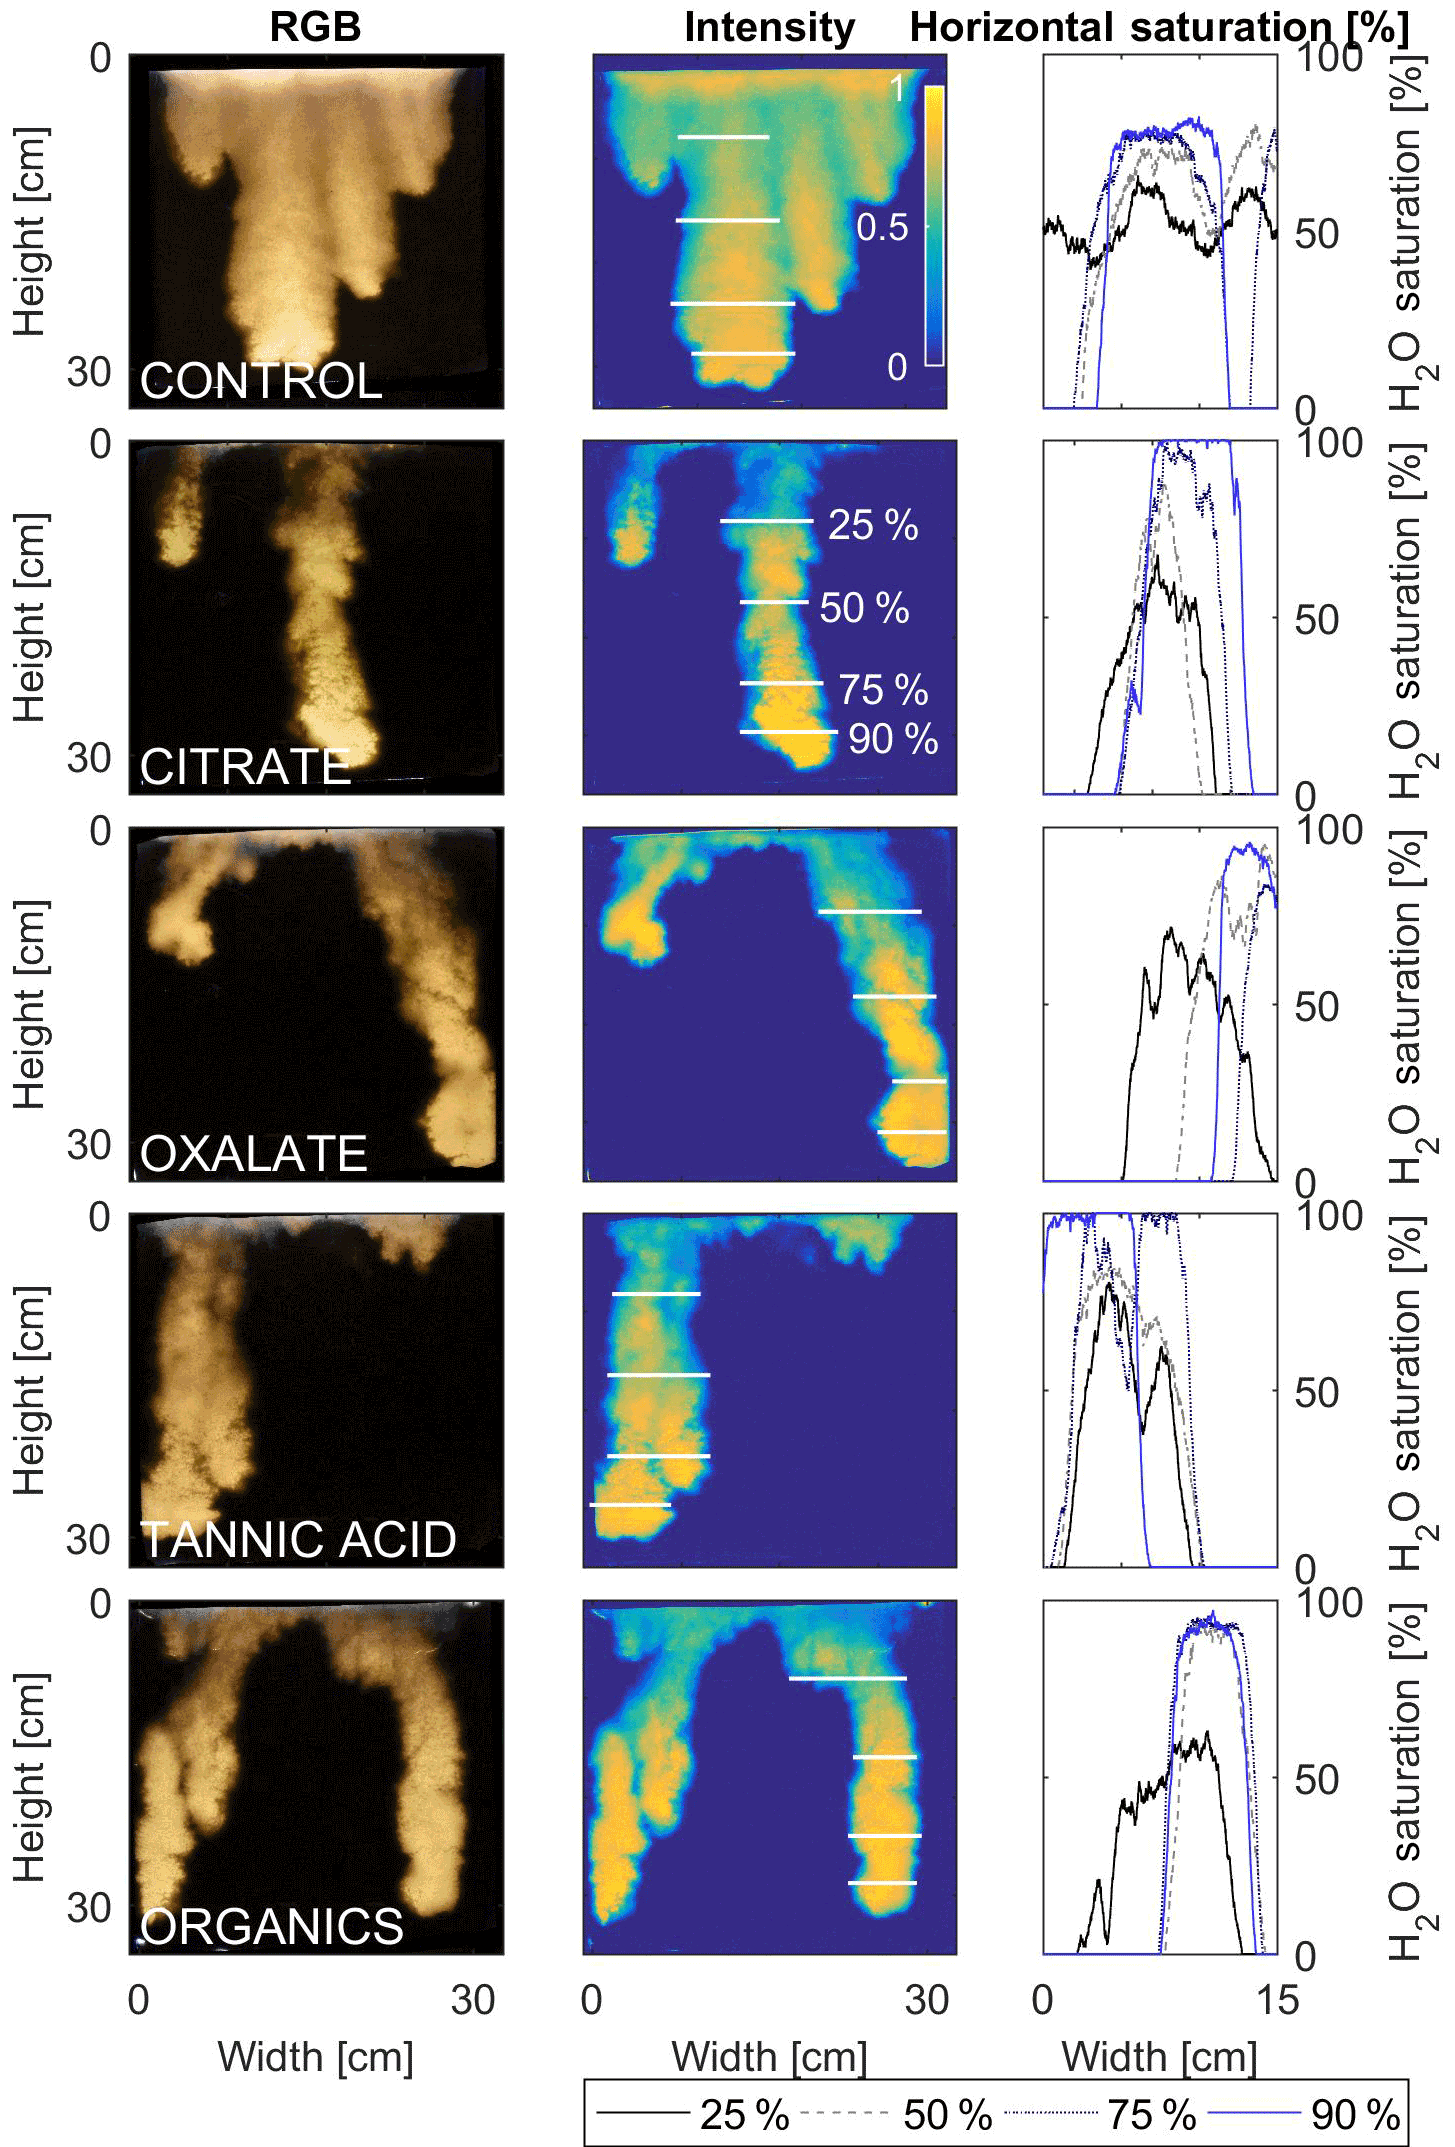
Figure A4Second tank experiment data set. Multigraph comparison of the finger width profiles of infiltration of water in US Silica C778 ASTM graded sand for control (NaCl + HNS), and high concentrations of plant exudates (citrate and oxalate) and soil components (tannic acid and organics: Suwanee River natural organic matter, SRNOM). The images are of the main finger at its full length. The location of the horizontal water saturation profile analyses and widths are measured at 25, 50, 75, and 90 % of the total fingers length.
The authors declare that they have no conflict of interest.
This material is based on work supported by the US Department of Energy
Office of Science, Office of Basic Energy Sciences and Office of Biological
and Environmental Research, under award number DE-SC-00012530. The authors
thank, Brian Berkowitz, editor of Hydrology and Earth System Sciences; Maria
Dragila, short comment reviewer; and the two referee comment reviewers, for
their useful comments. The authors are especially grateful to Tammo Steenhuis
for his very valuable insights.
Edited by:
Brian Berkowitz
Reviewed by: two anonymous referees
Ahmed, M. A., Kroener, E., Holz, M., Zarebanadkouki, M., and Carminati, A.: Mucilage exudation facilitates root water uptake in dry soils, Funct. Plant Biol., 41, 1129–1137, https://doi.org/10.1071/fp13330, 2014.
Alami, Y., Achouak, W., Marol, C., and Heulin, T.: Rhizosphere soil aggregation and plant growth promotion of sunflowers by an exopolysaccharide-producing Rhizobium sp. strain isolated from sunflower roots, Appl. Environ. Microb., 66, 3393–3398, https://doi.org/10.1128/aem.66.8.3393-3398.2000, 2000.
Andreini, M. S. and Steenhuis, T. S.: Preferential paths of flow under conventional and conservation tillage, Geoderma, 46, 85–102, https://doi.org/10.1016/0016-7061(90)90009-X, 1990.
Arnon, D. I. and Hoagland, D. R.: Crop production in artificial culture solutions and in soils with special reference to factors influencing yields and absorption of inorganic nutrients, Soil Sci., 50, 463–485, 1940.
Assouline, S.: Infiltration into soils: Conceptual approaches and solutions, Water Resour. Res., 49, 1755–1772, https://doi.org/10.1002/wrcr.20155, 2013.
Assouline, S. and Rouault, Y.: Modeling the relationships between particle and pore size distributions in multicomponent sphere packs: Application to the water retention curve, Colloids Surfaces A Physicochem. Eng. Asp., 127, 201–210, https://doi.org/10.1016/S0927-7757(97)00144-1, 1997.
Bashir, R., Smith, J. E., and Stolle, D. E.: The effect of ionic strength on surfactant-induced unsaturated flow, Can. Geotech. J., 48, 644–654, https://doi.org/10.1139/T10-096, 2011.
Bauters, T. W. J., Steenhuis, T. S., DiCarlo, D. A., Nieber, J. L., Dekker, L. W., Ritsema, C. J., Parlange, J.-Y., and Haverkamp, R.: Physics of water repellent soils, J. Hydrol., 231, 233–243, https://doi.org/10.1016/S0022-1694(00)00197-9, 2000a.
Bauters, T. W. J., DiCarlo, D. A., Steenhuis, T. S., and Parlange, J.-Y.: Soil water content dependent wetting front characteristics in sands, J. Hydrol., 231, 244–254, 2000b.
Baveye, P. C. and Darnault, C.: Microbial competition and evolution in natural porous environments: Not that simple, P. Natl. Acad. Sci. USA, 114, E2802–E2803, https://doi.org/10.1073/pnas.1700992114, 2017.
Benard, P., Kroener, E., Vontobel, P., Kaestner, A., and Carminati, A.: Water percolation through the root-soil interface, Adv. Water Resour., 95, 190–198, https://doi.org/10.1016/j.advwatres.2015.09.014, 2016.
Bengough, A. G.: Water dynamics of the root zone: Rhizosphere biophysics and its control on soil hydrology, Vadose Zone J., 11, 6 p., https://doi.org/10.2136/vzj2011.0111, 2012.
Beven, K. and Germann, P.: Macropores and water flow in soils revisited, Water Resour. Res., 49, 3071–3092, https://doi.org/10.1002/wrcr.20156, 2013.
Bien, L. B., Angulo-Jaramillo, R., Predelus, D., Lassabatere, L., and Winiarski, T.: Preferential flow and mass transport modeling in a heterogeneous unsaturated soil, Adv. Unsaturated Soils, 211–216, 2013.
Bouma, J. and Dekker, L. W.: Case-study on infiltration into dry clay soil. 1. Morphological observations, Geoderma, 20, 27–40, https://doi.org/10.1016/0016-7061(78)90047-2, 1978.
Buckingham, E.: Studies on the movement of soil moisture, Bur. Soils – Bull., 38, 61 p., 1907.
Cakmak, I., Erenoglu, B., Gulut, K. Y., Derici, R., and Romheld, V.: Light-mediated release of phytosiderophores in wheat and barley under iron or zinc deficiency, Plant Soil, 202, 309–315, https://doi.org/10.1023/a:1004384712817, 1998.
Carminati, A.: A model of root water uptake coupled with rhizosphere dynamics, Vadose Zone J., 11, 9 p., https://doi.org/10.2136/vzj2011.0106, 2012.
Carminati, A., Moradi, A. B., Vetterlein, D., Vontobel, P., Lehmann, E., Weller, U., Vogel, H. J., and Oswald, S. E.: Dynamics of soil water content in the rhizosphere, Plant Soil, 332, 163–176, https://doi.org/10.1007/s11104-010-0283-8, 2010.
Carminati, A., Zarebanadkouki, M., Kroener, E., Ahmed, M. A., and Holz, M.: Biophysical rhizosphere processes affecting root water uptake, Ann. Bot., 118, mcw113, https://doi.org/10.1093/aob/mcw113, 2016.
Carvalhais, L. C., Dennis, P. G., Fedoseyenko, D., Hajirezaei, M. R., Borriss, R., and von Wiren, N.: Root exudation of sugars, amino acids, and organic acids by maize as affected by nitrogen, phosphorus, potassium, and iron deficiency, J. Plant Nutr. Soil Sc., 174, 3–11, https://doi.org/10.1002/jpln.201000085, 2011.
Chouke, R. L., van Meurs, P., and van der Poel, C.: The instability of slow immiscible, viscous liquid-liquid displacements in porous media, Trans. Am. Inst. Min. Eng., 216, 188–194, 1959.
Cueto-Felgueroso, L. and Juanes, R.: Nonlocal interface dynamics and pattern formation in gravity-driven unsaturated flow through porous media, Phys. Rev. Lett., 101, 244504, https://doi.org/10.1103/PhysRevLett.101.244504, 2008.
Culligan, P. J., Ivanov, V., and Germaine, J. T.: Sorptivity and liquid infiltration into dry soil, Adv. Water Resour., 28, 1010–1020, https://doi.org/10.1016/j.advwatres.2005.04.003, 2005.
Czarnes, S., Hallett, P. D., Bengough, A. G., and Young, I. M.: Root- and microbial-derived mucilages affect soil structure and water transport, Eur. J. Soil Sci., 51, 435–443 https://doi.org/10.1046/j.1365-2389.2000.00327.x, 2000.
Darnault, C. J. G., Throop, J. A., Dicarlo, D. A., Rimmer, A., Steenhuis, T. S., and Parlange, J.-Y.: Visualization by light transmission of oil and water contents in transient two-phase flow fields, J. Contam. Hydrol., 31, 337–348, 1998.
Darnault, C. J. G., DiCarlo, D. A., Bauters, T. W. J., Jacobson, A. R., Throop, J. A., Montemagno, C. D., Parlange, J. Y., and Steenhuis, T. S.: Measurement of fluid contents by light transmission in transient three-phase oil-water-air systems in sand, Water Resour. Res., 37, 1859–1868, https://doi.org/10.1029/2000WR900380, 2001.
Darnault, C. J. G., Garnier, P., Kim, Y. J., Oveson, K. L., Steenhuis, T. S., Parlange, J. Y., Jenkins, M., Ghiorse, W. C., and Baveye, P.: Preferential transport of Cryptosporidium parvum oocysts in variably saturated subsurface environments, Water Environ. Res., 75, 113–120, https://doi.org/10.2175/106143003X140890, 2003.
Darnault, C. J. G., Steenhuis, T. S., Garnier, P., Kim, Y. J., Jenkins, M. B., Ghiorse, W. C., Baveye, P. C., and Parlange, J. Y.: Preferential flow and transport of Cryptosporidium parvum oocysts through the vadose zone: Experiments and modeling, Vadose Zone J., 3, 262–270, 2004.
Dekker, L. W. and Ritsema, C. J.: How water moves in a water repellent sandy soil. 1. Potential and actual water repellency, Water Resour. Res., 30, 2507–2517, https://doi.org/10.1029/94wr00749, 1994.
De Rooij, G. H.: Modeling fingered flow of water in soils owing to wetting front instability: A review, J. Hydrol., 231–232, 277–294, https://doi.org/10.1016/S0022-1694(00)00201-8, 2000.
DiCarlo, D. A.: Experimental measurements of saturation overshoot on infiltration, Water Resour. Res., 40, W04215, https://doi.org/10.1029/2003wr002670, 2004.
DiCarlo, D. A., Bauters, T. W. J., Darnault, C. J. G., Steenhuis, T. S., and Parlange, J. Y.: Lateral expansion of preferential flow paths in sands, Water Resour. Res., 35, 427–434, https://doi.org/10.1029/1998wr900061, 1999.
DiCarlo, D. A., Bauters, T. W. J., Darnault, C. J. G., Wong, E., Bierck, B. R., Steenhuis, T. S., and Parlange, J. Y.: Surfactant-induced changes in gravity fingering of water through a light oil, J. Contam. Hydrol., 41, 317–334, https://doi.org/10.1016/S0169-7722(99)00078-9, 2000.
Engelhardt, I., Sittig, S., Simunek, J., Groeneweg, J., Putz, T., and Vereecken, H.: Fate of the antibiotic sulfadiazine in natural soils: Experimental and numerical investigations, J. Contam. Hydrol., 177, 30–42, https://doi.org/10.1016/j.jconhyd.2015.02.006, 2015.
Flury, M., Fluhler, H., Jury, W. A., and Leuenberger, J.: Susceptibility of soils to preferential flow of water – A field-study, Water Resour. Res., 30, 1945–1954, https://doi.org/10.1029/94wr00871, 1994.
Ganz, C., Bachmann, J., Noell, U., Duijnisveld, W. H. M., and Lamparter, A.: Hydraulic modeling and in situ electrical resistivity tomography to analyze ponded infiltration into a water repellent sand, Vadose Zone J., 13, 14 p., https://doi.org/10.2136/vzj2013.04.0074, 2014.
Gardner, W. R.: Dynamic aspects of water availability to plants, Soil Sci., 89, 63–73, 1960.
Geiger, S. L. and Durnford, D. S.: Infiltration in homogeneous sands and a mechanistic model of unstable flow, Soil Sci. Soc. Am. J., 64, 460–469, 2000.
Gerke, H. H., Germann, P., and Nieber, J.: Preferential and unstable flow: From the pore to the catchment scale, Vadose Zone J., 9, 207–212, https://doi.org/10.2136/vzj2010.0059, 2010.
Ghezzehei, T. A. and Albalasmeh, A. A.: Spatial distribution of rhizodeposits provides built-in water potential gradient in the rhizosphere, Ecol. Model., 298, 53–63, https://doi.org/10.1016/j.ecolmodel.2014.10.028, 2015.
Glass, R. J. and Nicholl, M. J.: Physics of gravity fingering of immiscible fluids within porous media: An overview of current understanding and selected complicating factors, Geoderma, 70, 133–163, 1996.
Glass, R. J., Steenhuis, T. S., and Parlange, J.-Y.: Mechanism for finger persistence in homogeneous unsaturated porous media: Theory and verification, Soil Sci., 148, 60–70, 1989a.
Glass, R. J., Oosting, G. H., and Steenhuis, T. S.: Preferential solute transport in layered homogeneous sands as a consequence of wetting front instability, J. Hydrol., 110, 87–102, 1989b.
Glass, R. J., Parlange, J.-Y., and Steenhuis, T. S.: Wetting front instability. 1. Theoretical discussion and dimensional analysis, Water Resour. Res., 25, 1187–1194, 1989c.
Glass, R. J., Steenhuis, T. S., and Parlange, J.-Y.: Wetting front instability. 2. Experimental determination of relationships between system parameters and two-dimensional unstable flow field behavior in initially dry porous media, Water Resour. Res., 25, 1195–1207, 1989d.
Glass, R. J., Parlange, J.-Y., and Steenhuis, T. S.: Immiscible displacement in porous media: Stability analysis of three-dimensional, axisymmetric disturbances with application to gravity-driven wetting front instability, Water Resour. Res., 27, 1947–1956, https://doi.org/10.1029/91WR00836, 1991.
Gregory, P. J.: Roots, rhizosphere and soil: The route to a better understanding of soil science?, Eur. J. Soil Sci., 57, 2–12, https://doi.org/10.1111/j.1365-2389.2005.00778.x, 2006.
Guinel, F. C. and McCully, M. E.: Some water related physical properties of maize root-cap mucilage, Plant Cell Environ., 9, 657–666, https://doi.org/10.1111/j.1365-3040.1986.tb01624.x, 1986.
Hendrickx, J. M. H. and Flury, M.: Uniform and preferential flow mechanisms in the vadose zone, Concept. Model. Flow Transp. Fract. Vadose Zo., Washington, DC, 149–187, 2001.
Henry, E. J., Smith, J. E., and Warrick, A. W.: Two-dimensional modeling of flow and transport in the vadose zone with surfactant-induced flow, Water Resour. Res., 38, 33-1–33-16, https://doi.org/10.1029/2001WR000674, 2002.
Hill, D. E. and Parlange, J.-Y.: Wetting front instability in layered soils, Soil Sci. Soc. Am. J., 36, 697–702, 1972.
Hillel, D.: Unstable flow in layered soils – A review, Hydrol. Process., 1, 143–147, https://doi.org/10.1002/hyp.3360010203, 1987.
Hinsinger, P., Bengough, A. G., Vetterlein, D., and Young, I. M.: Rhizosphere: biophysics, biogeochemistry and ecological relevance, Plant Soil, 321, 117–152, https://doi.org/10.1007/s11104-008-9885-9, 2009.
Hoa, N. T.: A new method allowing the measurement of rapid variations of the water content in sandy porous media, Water Resour. Res., 17, 41–48, https://doi.org/10.1029/WR017i001p00041, 1981.
Horton, R. E.: The role of infiltration in the hydrologic cycle, EOS T. Am. Geophys. Un., 14, 446–460, 1933.
Jarvis, N., Koestel, J., and Larsbo, M.: Understanding preferential flow in the vadose zone: Recent advances and future prospects, Vadose Zone J., 15, 11 p., https://doi.org/10.2136/vzj2016.09.0075, 2016.
Jones, D.: Organic acids in the rhizosphere: A critical review, Plant Soil, 205, 25–44, https://doi.org/10.1023/A:1004356007312, 1998.
Kaci, Y., Heyraud, A., Barakat, M., and Heulin, T.: Isolation and identification of an EPS-producing Rhizobium strain from and soil (Algeria): Characterization of its EPS and the effect of inoculation on wheat rhizosphere soil structure, Res. Microbiol., 156, 522–531, https://doi.org/10.1016/j.resmic.2005.01.012, 2005.
Kapoor, V.: Criterion for instability of steady-state unsaturated flows, Transport. Porous Med., 25, 313–334, https://doi.org/10.1007/bf00140986, 1996.
Kay, P., Blackwell, P. A., and Boxall, A. B. A.: Fate of veterinary antibiotics in a macroporous tile drained clay soil, Environ. Toxicol. Chem., 23, 1136–1144, https://doi.org/10.1897/03-374, 2004.
Kim, Y.-J., Darnault, C. J. G., Bailey, N. O., Parlange, J., and Steenhuis, T. S.: Equation for describing solute transport in field soils with preferential flow paths, Soil Sci. Soc. Am. J., 69, 291–300, https://doi.org/10.1084/jem.20070109, 2005.
Kruss GmbH: Drop shape analysis users manual, 2004.
Kung, K. J. S.: Preferential flow in a sandy vadose zone. 1. Field observation, Geoderma, 46, 51–58, https://doi.org/10.1016/0016-7061(90)90006-u, 1990a.
Kung, K. J. S.: Preferential flow in a sandy vadose zone. 2. Mechanism and implications, Geoderma, 46, 59–71, https://doi.org/10.1016/0016-7061(90)90007-v, 1990b.
Laplace, P. S.: Traité Méchanique Céleste, Imprimerie de Crapelet, Paris NV – 5, 1806.
Liang, X., Lettenmaier, D. P., Wood, E. F., and Burges, S. J.: A simple hydrologically based model of land-surface water and energy fluxes for general circulation models, J. Geophys. Res., 99, 14415–14428, https://doi.org/10.1029/94jd00483, 1994.
Liu, Y. P., Steenhuis, T. S., and Parlange, J. Y.: Formation and persistence of fingered flow-fields in coarse-grained soils under different moisture contents, J. Hydrol., 159, 187–195, https://doi.org/10.1016/0022-1694(94)90255-0, 1994.
Liu, Z. and Moysey, S. M.: The dependence of electrical resistivity-saturation relationships on multiphase flow instability, ISRN Geophysics, 270750, https://doi.org/10.5402/2012/270750, 2012.
Lord, D. L., Demond, A. H., Salehzadeh, A., and Hayes, K. I. M. F.: Influence of organic acid solution chemistry on subsurface transport. 2. Capillary pressure-saturation, Environ. Sci. Technol., 31, 2052–2058, 1997.
Mangel, A. R., Moysey, S. M. J., Ryan, J. C., and Tarbutton, J. A.: Multi-offset ground-penetrating radar imaging of a lab-scale infiltration test, Hydrol. Earth Syst. Sci., 16, 4009–4022, https://doi.org/10.5194/hess-16-4009-2012, 2012.
Mangel, A. R., Moysey, S. M. J., and van der Kruk, J.: Resolving precipitation induced water content profiles by inversion of dispersive GPR data: A numerical study, J. Hydrol., 525, 496–505, https://doi.org/10.1016/j.jhydrol.2015.04.011, 2015.
McCully, M. E.: Roots in soil: Unearthing the complexities of roots and their rhizospheres, Annu. Rev. Plant Phys., 50, 695–718, https://doi.org/10.1146/annurev.arplant.50.1.695, 1999.
McCully, M. E. and Boyer, J. S.: The expansion of maize root-cap mucilage during hydration. 3. Changes in water potential and water content, Physiol. Plant., 99, 169–177, https://doi.org/10.1034/j.1399-3054.1997.990123.x, 1997.
Miller, E. E. and Miller, R. D.: Physical theory for capillary flow phenomena, J. Appl. Phys., 27, 324–332, https://doi.org/10.1063/1.1722370, 1956.
Moradi, A. B., Carminati, A., Vetterlein, D., Vontobel, P., Lehmann, E., Weller, U., Hopmans, J. W., Vogel, H.-J., and Oswald, S. E.: Three-dimensional visualization and quantification of water content in the rhizosphere, New Phytol., 192, 653–663, https://doi.org/10.1111/j.1469-8137.2011.03826.x, 2011.
Moradi, A. B., Carminati, A., Lamparter, A., Woche, S. K., Bachmann, J., Vetterlein, D., Vogel, H.-J., and Oswald, S. E.: Is the rhizosphere temporarily water repellent?, Vadose Zone J., 11, 8 p., https://doi.org/10.2136/vzj2011.0120, 2012.
Morrow, N. R.: Capillary-pressure correlations for uniformly wetted porous-media, J. Can. Petrol. Technol., 15, 49–69, 1976.
Nardi, S., Concheri, G., Pizzeghello, D., Sturaro, A., Rella, R., and Parvoli, G.: Soil organic matter mobilization by root exudates, Chemosphere, 41, 653–658, https://doi.org/10.1016/s0045-6535(99)00488-9, 2000.
Naveed, M., Brown, L. K., Raffan, A. C., George, T. S., Bengough, A. G., Roose, T., Sinclair, I., Koebernick, N., Cooper, L., Hackett, C. A., and Hallett, P. D.: Plant exudates may stabilize or weaken soil depending on species, origin and time, Eur. J. Soil Sci., 68, 806–816, https://doi.org/10.1111/ejss.12487, 2017.
Niemet, M. R. and Selker, J. S.: A new method for quantification of liquid saturation in 2D translucent porous media systems using light transmission, Adv. Water Resour., 24, 651–666, 2001.
Nimmo, J. R.: Preferential flow occurs in unsaturated conditions, Hydrol. Process., 26, 786–789, https://doi.org/10.1002/hyp.8380, 2012.
Parlange, J. Y.: Theory of water movement in soils. 1. One-dimensional absorption, Soil Sci., 111, 134–137, https://doi.org/10.1097/00010694-197102000-00010, 1971a.
Parlange, J. Y.: Theory of water movement in soils. 2. One-dimensional infiltration, Soil Sci., 111, 170–174, https://doi.org/10.1097/00010694-197103000-00004, 1971b.
Parlange, J. Y.: Theory of water movement in soils. 3. Two and three-dimensional absorption, Soil Sci., 112, 313–317, https://doi.org/10.1097/00010694-197111000-00003, 1971c.
Parlange, J. Y.: Theory of water movement in soils. 4. Two and three-dimensional steady infiltration, Soil Sci., 113, 96–101, https://doi.org/10.1097/00010694-197202000-00004, 1972a.
Parlange, J. Y.: Theory of water movement in soils. 5. Unsteady infiltration from spherical cavities, Soil Sci., 113, 156–161, https://doi.org/10.1097/00010694-197203000-00002, 1972b.
Parlange, J. Y. and Hill, D. R.: Theoretical analysis of wetting front instability in soil, Soil Sci., 122, 236–239, 1976.
Passioura, J. B.: Water transport in and to roots, Annu. Rev. Plant Physiol. Plant Mol. Biol., 39, 245–265, https://doi.org/10.1146/annurev.pp.39.060188.001333, 1988.
Peck, A. J.: Moisture profile development and air compression during water uptake by bounded porous bodies. 3. Vertical columns, Soil Sci., 100, 44–51, 1965.
Pendexter, W. S. and Furbish, D. J.: Development of a heterogeneous moisture distribution and its influence on the evolution of preferred pathways of flow in an unsaturated sandy soil, edited by: Gish, T. J. and Shirmohammadi, A., Preferential Flow, Proc. Natl. Symp. Am. Soc. Agric. Eng., Chicago, IL, 104–112, 1991.
Philip, J. R.: Numerical solution of equations of the diffusion type with diffusivity concentration-dependent, T. Faraday Soc., 51, 885–892, https://doi.org/10.1039/tf9555100885, 1955.
Philip, J. R.: Theory of infiltration, Adv. Hydrosci., 5, 215–296, 1969.
Philip, J. R.: Limitations on scaling by contact angle, Soil Sci. Soc. Am. Pro., 35, 507–509, 1971.
Philip, J. R.: Stability analysis of infiltration, Soil Sci. Soc. Am. J., 39, 1042–1049, 1975.
Raats, P. A. C.: Unstable wetting fronts in uniform and nonuniform soils, Soil Sci. Soc. Am. J., 37, 681–685, 1973.
Read, D. B., Bengough, A. G., Gregory, P. J., Crawford, J. W., Robinson, D., Scrimgeour, C. M., Young, I. M., Zhang, K., and Zhang, X.: Plant roots release phospholipid surfactants that modify the physical and chemical properties of soil, New Phytol., 157, 315–326, https://doi.org/10.1046/j.1469-8137.2003.00665.x, 2003.
Richards, L. A.: Capillary conduction of liquids through porous mediums, Physics-J. Gen. Appl. P., 1, 318–333, https://doi.org/10.1063/1.1745010, 1931.
Ritsema, C. J. and Dekker, L. W.: How water moves in a water repellent sandy soil. 2. Dynamics of fingered flow, Water Resour. Res., 30, 2519–2531, https://doi.org/10.1029/94wr00750, 1994.
Ritsema, C. J., Dekker, L. W., Hendrickx, J. M. H., and Hamminga, W.: Preferential flow mechanism in a water repellent sandy soil, Water Resour. Res., 29, 2183–2193, https://doi.org/10.1029/93wr00394, 1993.
Rodriguez-Iturbe, I., D'Odorico, P., Porporato, A., and Ridolfi, L.: On the spatial and temporal links between vegetation, climate, and soil moisture, Water Resour. Res., 35, 3709–3722, https://doi.org/10.1029/1999wr900255, 1999.
Saffman, P. G. and Taylor, G.: The penetration of a fluid into a porous medium or Hele-Shaw cell containing a more viscous liquid, Philos. T. R. Soc. A, 245, 312–329, https://doi.org/10.1098/rspa.1958.0085, 1958.
Selker, J., Leclerq, P., Parlange, J. Y., and Steenhuis, T.: Fingered flow in two dimensions. 1. Measurement of matric potential, Water Resour. Res., 28, 2513–2521, https://doi.org/10.1029/92wr00963, 1992a.
Selker, J., Parlange, J. Y., and Steenhuis, T.: Fingered flow in two dimensions. 2. Predicting finger moisture profile, Water Resour. Res., 28, 2523–2528, https://doi.org/10.1029/92wr00962, 1992b.
Selker, J. S. and Schroth, M. H.: Evaluation of hydrodynamic scaling in porous media using finger dimensions, Water Resour. Res., 34, 1935–1940, https://doi.org/10.1029/98wr00625, 1998.
Selker, J. S., Steenhuis, T. S., and Parlange: Wetting front instability in homogeneous sandy soils under continuous infiltration, Soil Sci. Soc. Am. J., 56, 1346–1350, 1992.
Simunek, J., Jarvis, N. J., van Genuchten, M. T., and Gardenas, A.: Review and comparison of models for describing non-equilibrium and preferential flow and transport in the vadose zone, J. Hydrol., 272, 14–35, 2003.
Soddy, F.: The Hexlet, Nature, 138, 958, https://doi.org/10.1038/138958a0, 1936.
Steenhuis, T. S., Staubitz, W., Andreini, M. S., Surface, J., Richard, T. L., Paulsen, R., Pickering, N. B., Hagerman, J. R., and Geohring, L. D.: Preferential movement of pesticides and tracers in agricultural soils, J. Irrig. Drain. Eng., 116, 50–66, https://doi.org/10.1061/(asce)0733-9437(1990)116:1(50), 1990.
Steenhuis, T. S., Baver, C. E., Hasanpour, B., Stoof, C. R., DiCarlo, D. A., and Selker, J. S.: Pore scale consideration in unstable gravity driven finger flow, Water Resour. Res., 49, 7815–7819, https://doi.org/10.1002/2013wr013928, 2013.
Strobel, B. W.: Influence of vegetation on low-molecular-weight carboxylic acids in soil solution – a review, Geoderma, 99, 169–198, https://doi.org/10.1016/S0016-7061(00)00102-6, 2001.
US Silica: Product data: ASTM graded sand, 1, 1997.
Uyusur, B., Darnault, C. J. G., Snee, P. T., Koken, E., Jacobson, A. R., and Wells, R. R.: Coupled effects of solution chemistry and hydrodynamics on the mobility and transport of quantum dot nanomaterials in the vadose zone, J. Contam. Hydrol., 118, 184–198, https://doi.org/10.1016/j.jconhyd.2010.09.013, 2010.
Uyusur, B., Li, C. Y., Baveye, P. C., and Darnault, C. J. G.: pH-dependent reactive transport of uranium(VI) in unsaturated sand, J. Soil. Sediment., 15, 634–647, https://doi.org/10.1007/s11368-014-1018-x, 2015.
Uyusur, B., Snee, P. T., Li, C., and Darnault, C. J. G.: Quantitative imaging and in situ concentration measurements of quantum dot nanomaterials in variably saturated porous Media, J. Nanomater., 2016, 1–10, https://doi.org/10.1155/2016/8237029, 2016.
van Ommen, H. C., Dijksma, R., Hendrickx, J. M. H., Dekker, L. W., Hulshof, J., and van den Heuvel, M.: Experimental assessment of preferential flow paths in a field soil, J. Hydrol., 105, 253–262, https://doi.org/10.1016/0022-1694(89)90107-8, 1989.
Wagoner, D. B., Christman, R. F., Cauchon, G., and Paulson, R.: Molar mass and size of Suwannee River natural organic matter using multi-angle laser light scattering, Environ. Sci. Technol., 31, 937–941, https://doi.org/10.1021/es960594z, 1997.
Walker, T. S., Bais, H. P., Grotewold, E., and Vivanco, J. M.: Root exudation and rhizosphere biology, Plant Physiol., 132, 44–51, https://doi.org/10.1104/pp.102.019661, 2003.
Wallach, R. and Wang, Q. L.: An extension of Miller scaling to scale sorptivity by contact angle, Water Resour. Res., 49, 6927–6932, https://doi.org/10.1002/wrcr.20505, 2013.
Wallach, R., Margolis, M., and Graber, E. R.: The role of contact angle on unstable flow formation during infiltration and drainage in wettable porous media, Water Resour. Res., 49, 6508–6521, https://doi.org/10.1002/wrcr.20522, 2013.
Wang, K., Zhang, R. D., and Yasuda, H.: Characterizing heterogeneity of soil water flow by dye infiltration experiments, J. Hydrol., 328, 559–571, https://doi.org/10.1016/j.jhydrol.2006.01.001, 2006.
Wang, X., Tang, C., Guppy, C. N., and Sale, P. W. G.: Phosphorus acquisition characteristics of cotton (Gossypium hirsutum L.), wheat (Triticum aestivum L.) and white lupin (Lupinus albus L.) under P deficient conditions, Plant Soil, 312, 117–128, https://doi.org/10.1007/s11104-008-9589-1, 2008.
Wang, Z., Feyen, J., van Genuchten, M. T., and Nielsen, D. R.: Air entrapment effects on infiltration rate and flow instability, Water Resour. Res., 34, 213–222, https://doi.org/10.1029/97wr02804, 1998.
Wang, Z., Wu, L. S., Harter, T., Lu, J. H., and Jury, W. A.: A field study of unstable preferential flow during soil water redistribution, Water Resour. Res., 39, 1075, https://doi.org/10.1029/2001wr000903, 2003a.
Wang, Z., Tuli, A., and Jury, W. A.: Unstable flow during redistribution in homogeneous soil, Vadose Zone J., 2, 52–60, 2003b.
Wang, Z., Jury, W. A., Tuli, A., and Kim, D. J.: Unstable flow during redistribution: Controlling factors and practical implications, Vadose Zone J., 3, 549–559, 2004.
Watt, M., McCully, M. E., and Canny, M. J.: Formation and stabilization of rhizosheaths of Zea-Mays L. – Effect of soil water content, Plant Physiol., 106, 179–186, 1994.
Weisbrod, N., Niemet, M. R., and Selker, J. S.: Light transmission technique for the evaluation of colloidal transport and dynamics in porous media, Environ. Sci. Technol., 37, 3694–3700, https://doi.org/10.1021/es034010m, 2003.
Wise, M. E.: Dense random packing of unequal spheres, Philips Res. Rep., 7, 321–343, 1952.
Xiong, Y. W.: Flow of water in porous media with saturation overshoot: A review, J. Hydrol., 510, 353–362, https://doi.org/10.1016/j.jhydrol.2013.12.043, 2014.
Young, I. M.: Variation in moisture contents between bulk soil and the rhizosheath of wheat (Triticum aestivum L. cv. Wembley), New Phytol., 130, 135–139, https://doi.org/10.1111/j.1469-8137.1995.tb01823.x, 1995.
Young, T.: An essay on the cohesion of fluids, Philos. T. R. Soc. Lond., 95, 65–87, 1805.
Zarebanadkouki, M., Ahmed, M. A., and Carminati, A.: Hydraulic conductivity of the root-soil interface of lupin in sandy soil after drying and rewetting, Plant Soil, 398, 267–280, https://doi.org/10.1007/s11104-015-2668-1, 2016.