the Creative Commons Attribution 3.0 License.
the Creative Commons Attribution 3.0 License.
Estimating epikarst water storage by time-lapse surface-to-depth gravity measurements
Cédric Champollion
Sabrina Deville
Jean Chéry
Erik Doerflinger
Nicolas Le Moigne
Roger Bayer
Philippe Vernant
Naomi Mazzilli
The magnitude of epikarstic water storage variation is evaluated in various karst settings using a relative spring gravimeter. Gravity measurements are performed over a 1.5-year period at the surface and inside caves at different depths on three karst hydro-systems in southern France: two limestone karst systems and one dolomite karst system. We find that significant water storage variations occur in the first 10 m of karst unsaturated zone. The subsurface water storage is also evidenced by complementary magnetic resonance sounding. The comparison between sites of the depth gravity measurements with respect to net water inflow suggests that seasonal water storage depends on the lithology. The transmissive function of the epikarst on the seasonal scale has been deduced from the water storage change estimation. Long (> 6 months) and short (< 6 months) transfer times are revealed in the dolomite and in the limestone respectively.


Despite the large areas of carbonate karst systems in the Mediterranean area, their associated water resources and vulnerability remain poorly known. In the context of climate change and population increase, the karstic areas are becoming key water resources. A better knowledge of the properties of the karst reservoir is therefore needed to manage and protect the resources (Bakalowicz, 2005). Increasing the knowledge of karst hydrogeological properties and functioning is not a simple task. Indeed, a karstified area is complex and spatially heterogeneous with a non-linear response to rainfall. Numerous in situ field observations lead to the identification of three karst horizons: epikarst, infiltration zone and saturated zone. The epikarst has been first defined by Mangin (1975) as the part of the underground in interaction with the soil and the atmosphere. It is often described as a highly altered zone with a high porosity. In many cases, the epikarst is thought to be a significant water reservoir (Lastennet and Mudry, 1997; Perrin et al., 2003; Klimchouk, 2004; Williams, 2008). Chemically based modelling studies suggest that the epikarst or the infiltration zone could contribute from 30 to 50 % to the total flow discharge at the spring (Batiot et al., 2003; Emblanch et al., 2003). This view drastically differs from other studies that attribute most of the discharge to a deeper storage (Mangin, 1975; Fleury et al., 2007). As the epikarst is also vulnerable to potential surface pollution, a better understanding of its hydrological behaviour is welcome for the optimal management and protection of water resource and biological activity.
The studies about the karst water transfer and storage are generally based on chemical analysis, borehole measurements and spring hydrography, which are often used to constrain numerical models (Pinault et al., 2001; Hu et al., 2008; Zhang et al., 2011). Spring chemistry or flow approaches provide useful information on the basin scale but limited knowledge about the spatial distribution of hydrogeological properties. In contrast, borehole measurements provide useful quantitative information but are relevant only for the near-field scale because of the strong medium heterogeneity. On the intermediate scale (∼ 100 m), the determination of the hydrogeological karst properties can be studied by geophysical experiments. Therefore, a collection of geophysical observations on an intermediate scale can be valuable to constrain numerical models and improve our understanding of epikarst processes. Various geophysical tools are used to monitor, on an intermediate scale, transfer and storage properties such as magnetic resonance sounding (MRS) (Legchenko et al., 2002), 4-D seismic (Wu et al., 2006; Valois, 2011), electrical resistivity tomography (ERT) (Valois, 2011) and gravity measurements (Van Camp et al., 2006a, 2017; Jacob et al., 2010), among others. Both distributed geophysical measurements (ERT, 4-D seismic) and integrative methods (MRS, gravity) revealed spatial variations associated with mid-scale heterogeneities.
Gravity methods are nowadays pertinent tools for hydrogeological studies in various contexts (Van Camp et al., 2006a; Davis et al., 2008). The value of the gravity at Earth's surface is indeed directly influenced by underground rock density. A variation in density due to water saturation at depth can be directly measured from the surface through the temporal variation in the gravity (Harnisch and Harnisch, 2006; Van Camp et al., 2006b). Modern and accurate ground-based gravimeters provide a direct measurement of the temporal water storage changes in the underground without the need for any complementary petrophysical relationship (Davis et al., 2008; Jacob et al., 2008, 2010; Deville et al., 2012; Fores et al., 2017). Time-lapse gravity measurements stand as an efficient hydrological tool for the estimation of water storage variations in both saturated and unsaturated zone. Moreover, the sampling volume of the gravity is increasing with depth: at 10 m depth, the gravity integrates over a surface of a circular area with a radius of about 100 m. Small-scale heterogeneities are averaged in gravity observations. Process identification and modelling of heterogeneous hydro-systems require non-local observations. As surface gravity measurement integrates all density changes below the gravimeter, observed temporal variations can be related to both saturated and unsaturated zones. However, time-lapse surface gravity measurements alone provide poor information on the vertical water distribution. To remedy the absence of vertical resolution, gravity measurements can be done at different depths in caves or tunnels (Jacob et al., 2009; Tanaka et al., 2011). Time-lapse surface-to-depth (S2D) gravity measurements allow water storage variations in the unsaturated zone of the karst to be estimated. Furthermore, S2D gravity experiments also allow more precise measurements by common mode rejection. Previous studies of gravity S2D measurements made in natural caves suggest that water storage variations in the epikarst can be a major part of total water storage changes across the aquifer (Jacob et al., 2009; Fores et al., 2017). In the present study, we use gravity data to quantify the influence of the epikarst in terms of seasonal water storage in two karst systems in the south of France (SEOU and BESS in Fig. 1). We first present the hydrogeological situation of the sites and the experimental set-up. Then the gravity data processing is detailed and results are presented. Results from another close-by site (Jacob et al., 2009) are summed up and discussed in comparison with the results from our additional site surveys (BEAU in Fig. 1). Subsequently, time-lapse S2D gravity variations are analysed in the light of these depth distributions and of a complementary MRS sounding. Finally, the seasonal water storage for all sites is discussed in terms of processes during the recharge of the karst and its link with lithology and geomorphology.
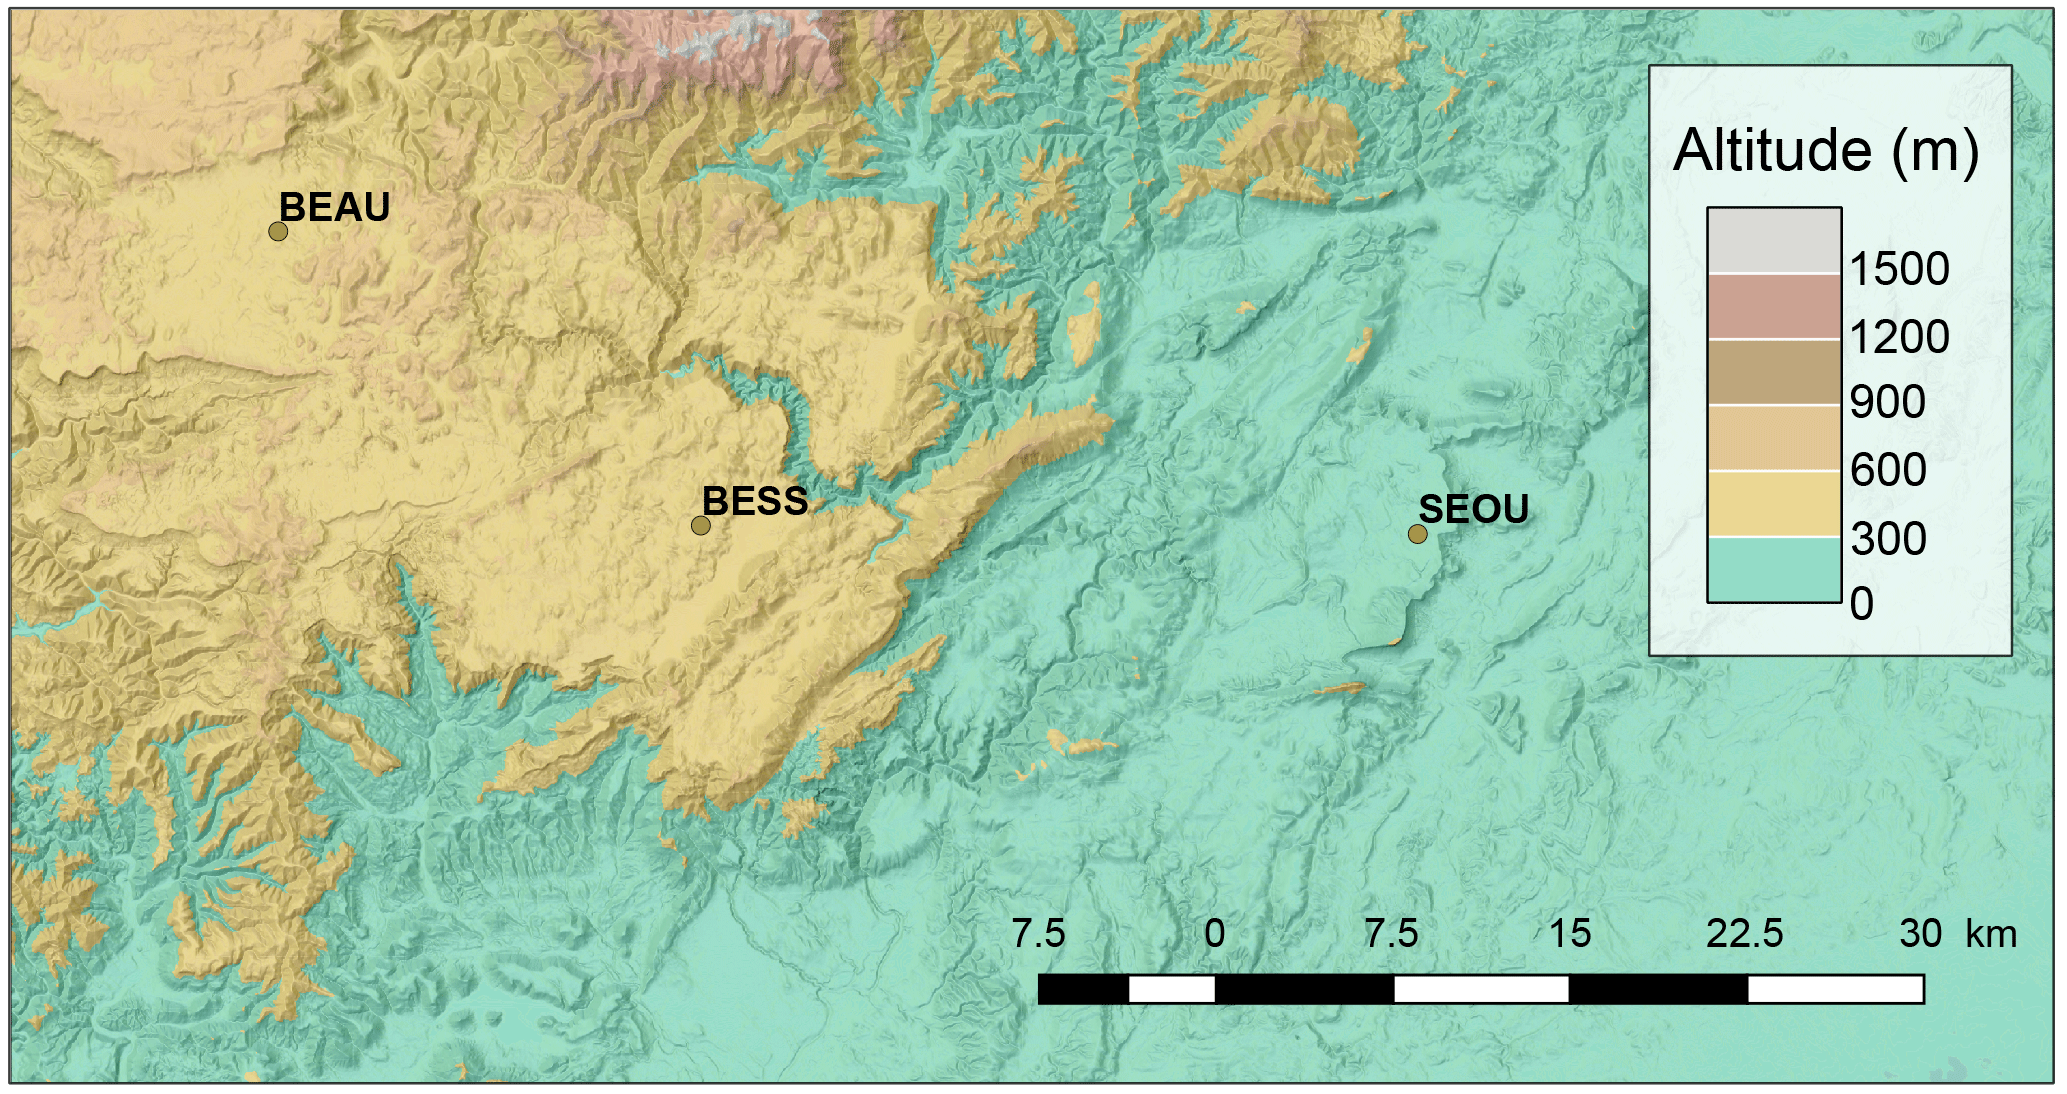
In this study, measurements are reported for 3 sites in southern France. The topographical situation of the study sites is shown in Fig. 1.
2.1 Lamalou karst system (SEOU site)
The Lamalou karst system is located on the Hortus plateau (the south of France). The aquifer is set in the 100 m thick formation of lower Cretaceous compact limestone (Fig. 2) deposited on Berriasian marls. These marls act as an impermeable barrier and define the lower limits of the saturated zone. Tertiary deposits overhang Cretaceous formations at the south-west and limit the aquifer. The karstified limestone formation is weakly folded as a north-east–south-west synclinal structure linked to the Pyrenean compression. The main recharge of the Lamalou karst system comes from rainfall which annually reaches 900 mm. Snow occurs less than once a year and is negligible in the seasonal water cycle. Surface runoff is extremely rare except during high precipitation events when most of the system is saturated (Boinet, 1999). Discharge of the Lamalou karst system only occurs in the perennial Lamalou-Crès springs system composed of two perennial springs connected during high flow period (Durand, 1992). Daily discharge is 5 and 1.5 L s−1 respectively for Lamalou spring and Crès spring (Chevalier, 1988). From combination of geomorphological observations, tracing experiments and mass balance modelling, the Lamalou recharge area is estimated to be ∼ 30 km2 (Bonnet et al., 1980; Chevalier, 1988). The vadose zone has a maximum thickness of ∼ 45 m. The epikarst thickness is estimated to have 10–12 m depth in the spring vicinity (Al-fares et al., 2002) and corresponds to an altered limestone with a strong secondary porosity such as opened fractures. Low matrix porosity has been estimated from core samples between 0.5 and 1.3 %.
The Lamalou experimental site is a cave called Seoubio (SEOU) located in the north-east part of the system in Valanginian limestone (Fig. 2). The surface topography is nearly flat around the cave entrance, which corresponds to a vertical pothole of 5 m diameter and 30 m depth, allowing a straight descent through the epikarst (Fig. 4a). The depth of the saturated zone is around 40 m below the surface as attested by two siphons. The neighbouring landscape is made of a “lapiaz” structure with opened fractures and a thin soil. The land use around the site is a natural typical Mediterranean scrubland.

Figure 2Hydrogeological setting of Lamalou karst system on the Hortus plateau. Seoubio cave (SEOU) is indicated by a red dot; MTPL shows the location of Montpellier city as a landmark.
2.2 Gourneyras karst system (BESS site)
The Gourneyras karst system is located in the southern part of the Grands Causses area (the south of France). The aquifer is set in Middle to Upper Jurassic limestone and dolomite topping a Liassic marl formation. The latter formation defines the lower limit of the saturated zone of the karst system. The main recharge of the system comes from rainfall which reaches ∼ 1100 mm annually. The rare snowfalls are included in the precipitation measurements. Discharge occurs only at the Gourneyras Vauclusian-type perennial spring. Discharge is not continuously monitored but punctual measurements suggest a discharge of ∼ 20 m3 s−1 during flood events. Recharge area of Gourneyras spring is estimated to be ∼ 41 km2 (SIE Rhône-Méditerranée, 2011). The vadose zone has a maximum thickness of 450 m. Calcite-filled fractures can be seen in the cave.
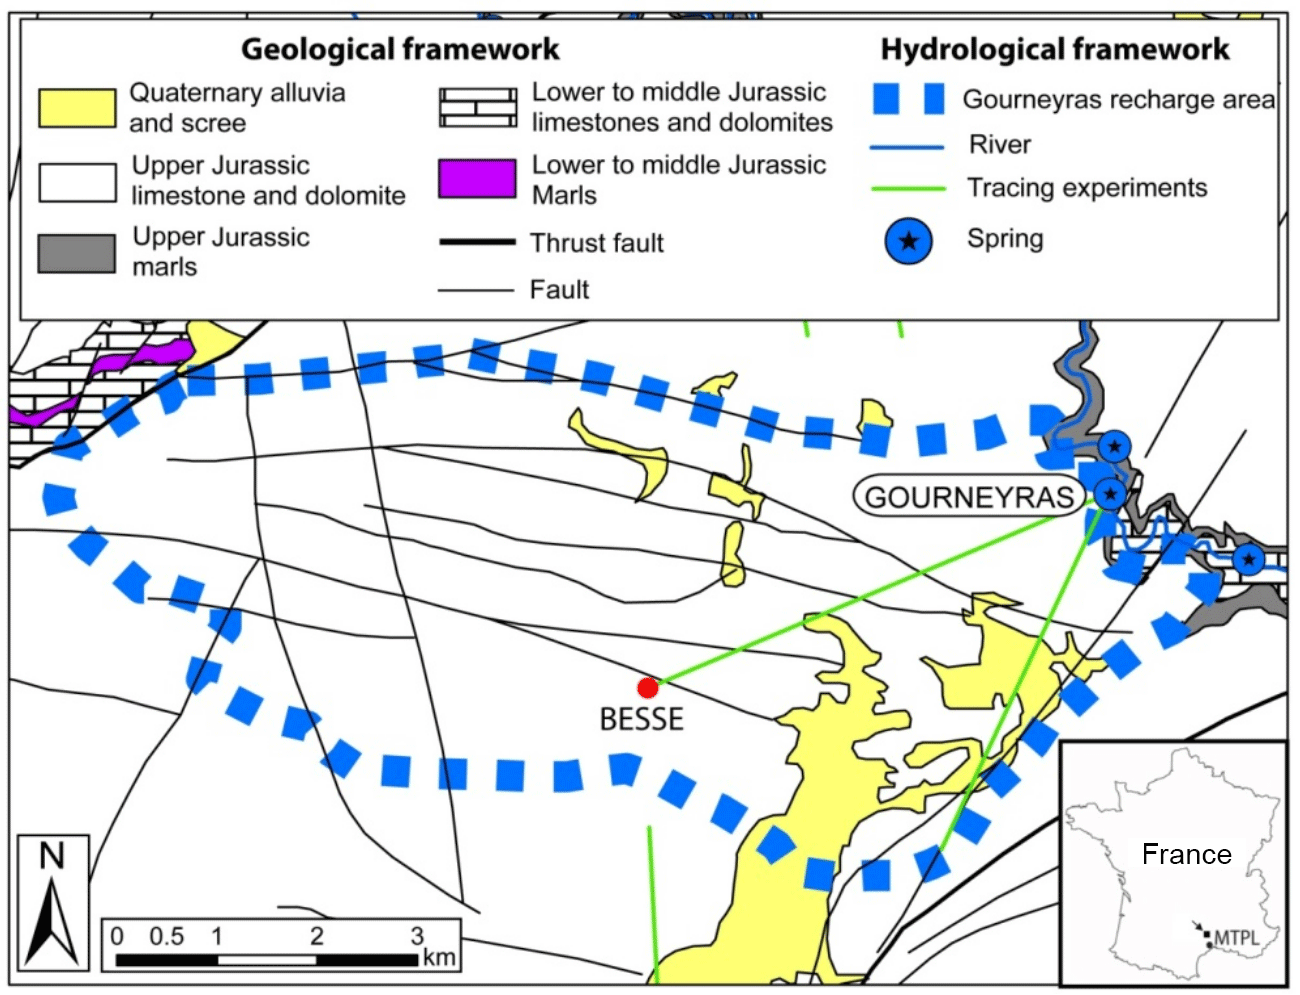
Figure 3Hydrogeological location map of Gourneyras karst system. Besses cave is indicated by a red dot (BESS).
The Gourneyras experimental site is a cave called “Les Besses” (BESS) (Fig. 3). The surface topography around the cave entrance is a gentle slope to the south-east. The cave is located in Kimmeridgian limestone formations. At the cave location, limestones are covered by a thin dolomite formation. Typical porosity of the matrix from core samples ranges between 1.6 and 7 % depending on the depth. Shallow alteration deposits such as clay are present at the surface. Above the cave, the land use is a natural typical Mediterranean scrubland. The cave morphology allows an easy descent by foot except between 670 and 690 m elevation where abseiling rope is necessary. The cave topography allowed gravity measurements to be performed at five different depths (Fig. 4b). Saturated zone is probably at 450 m depth below the surface, a few tenths of metres above spring elevation.
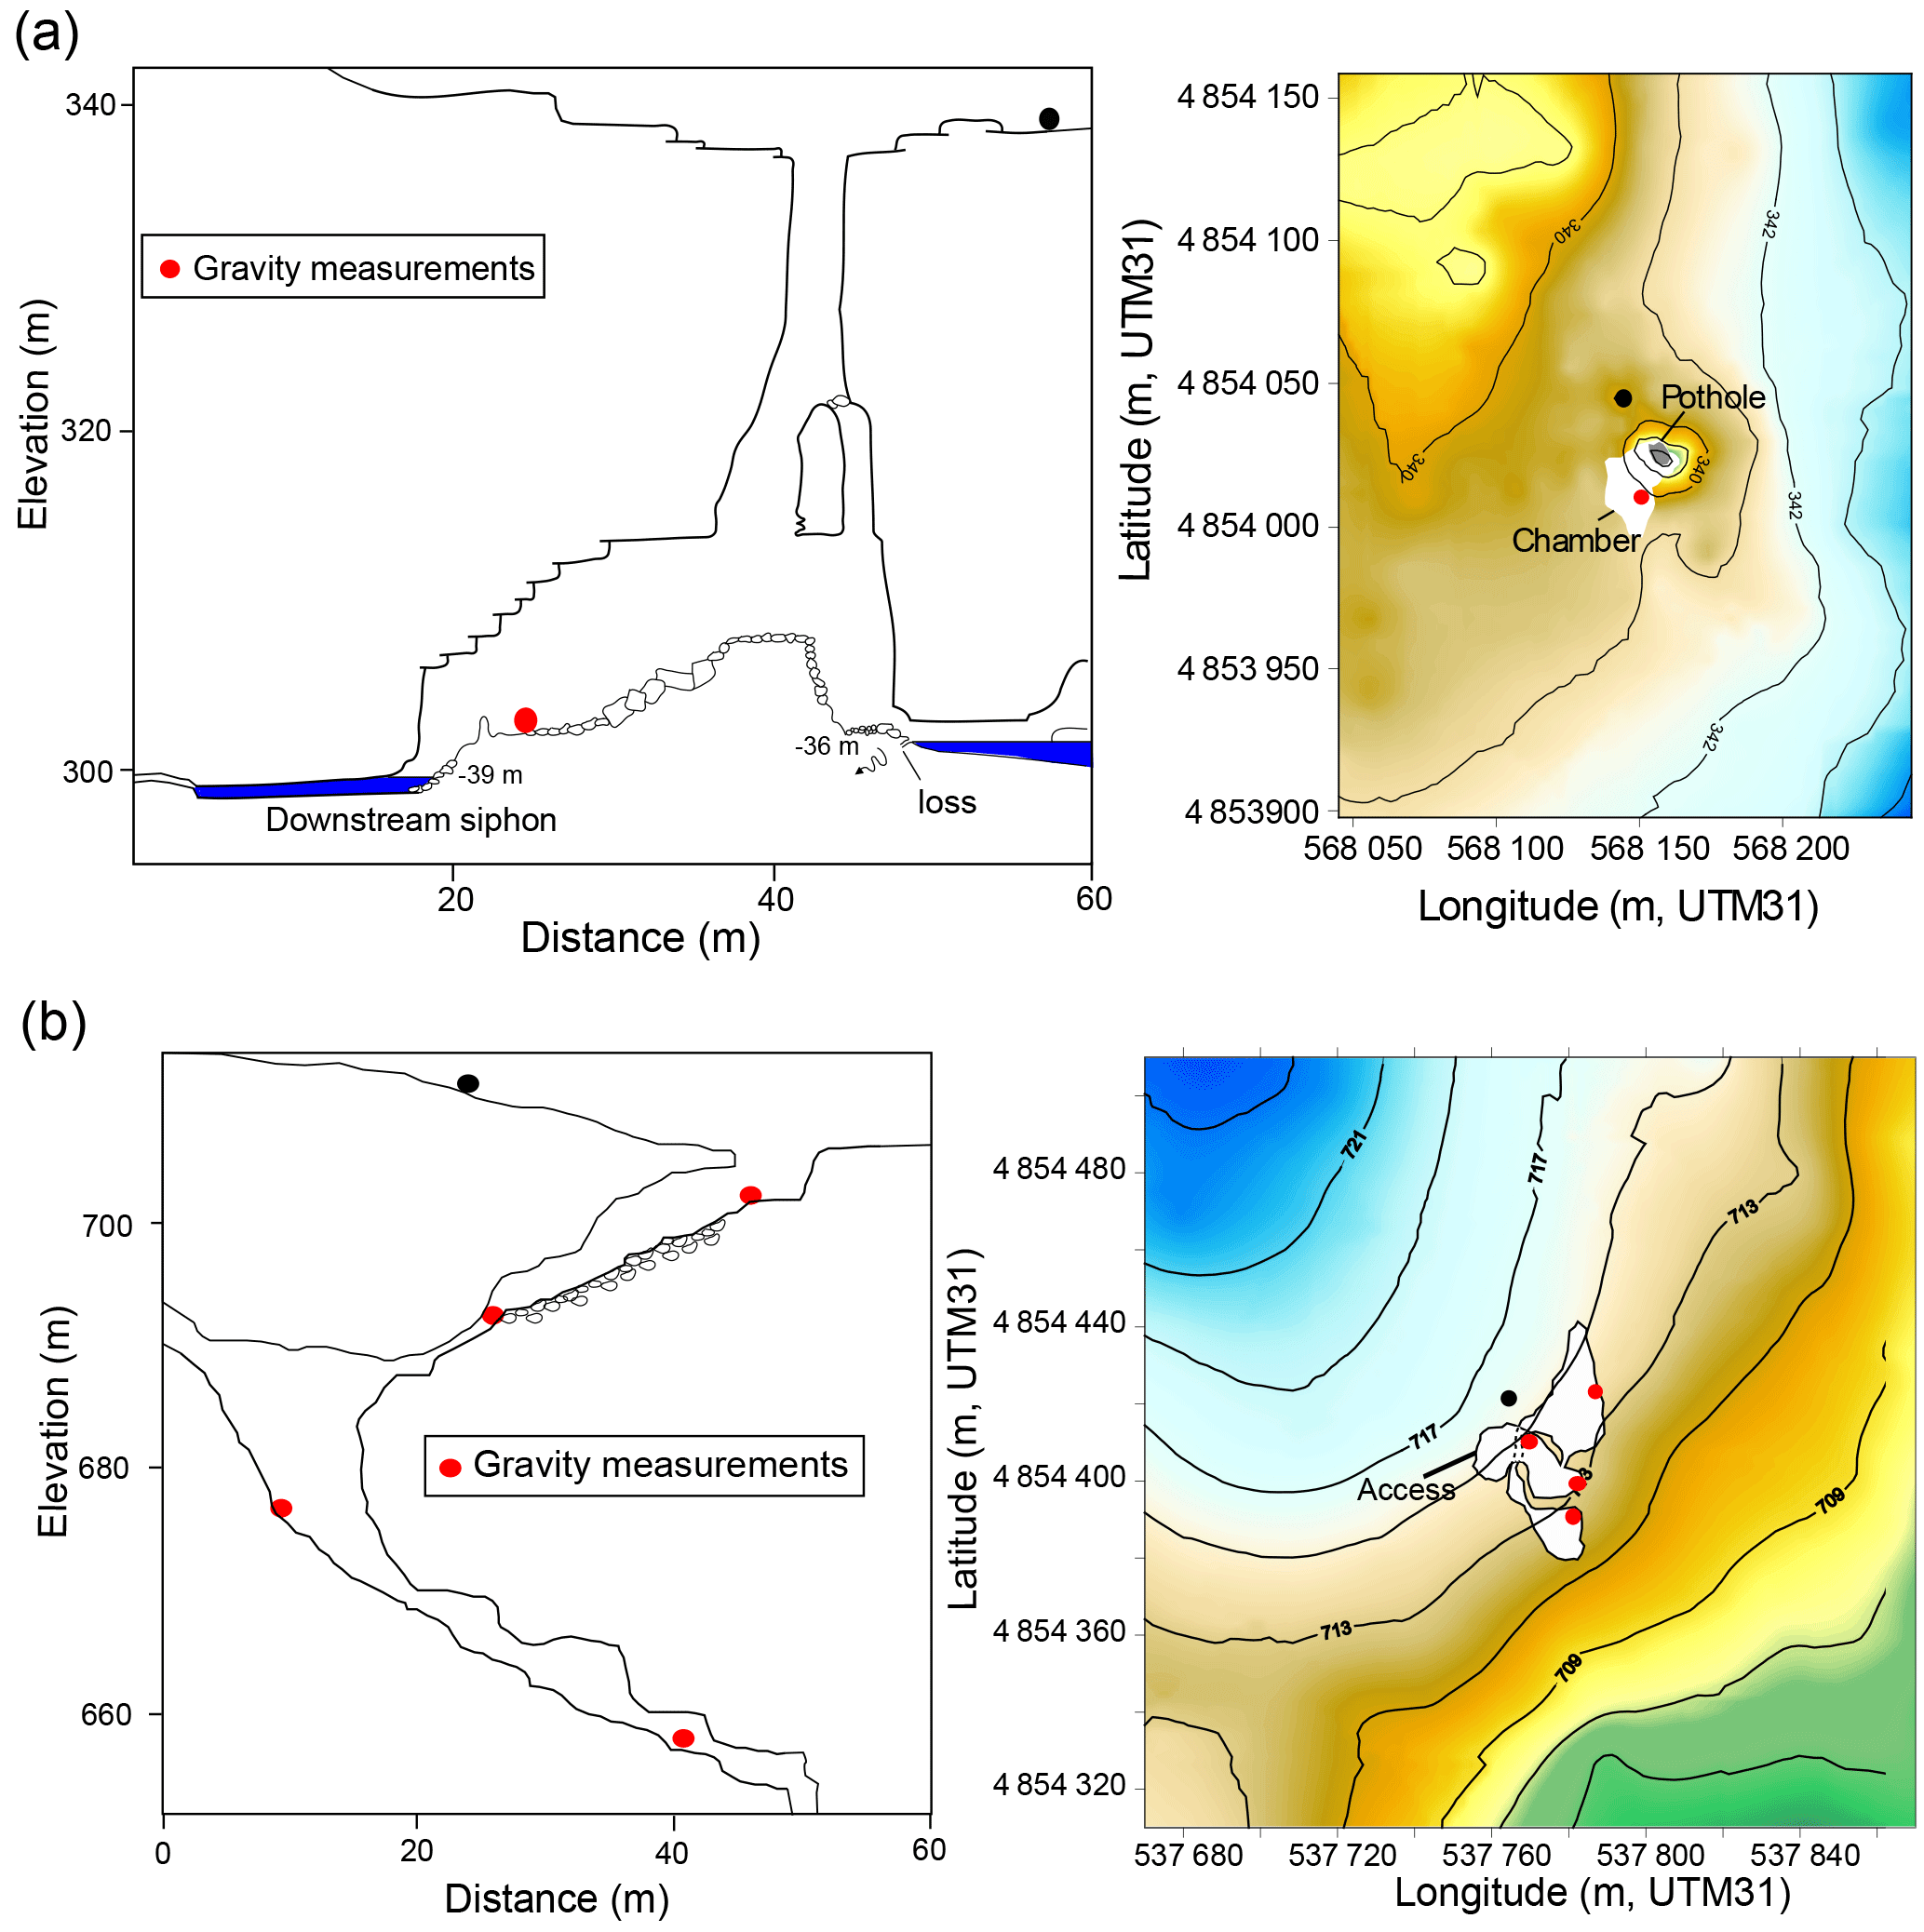
Figure 4Developed cross section and topography surrounding (a) Seoubio caves, after Boinet (2002), and (b) Besses caves. Black and red circles indicate the location of gravity measurements. Elevations are in metres. The projections of the cave in surface are represented in grey on topography.
The two karst systems of SEOU and BESS sites have been presented above but the results from a previous study (Jacob et al., 2009) are extensively used in the discussion (BEAU site). A detailed description of the site BEAU is available in Jacob et al. (2009). BEAU and BESS sites are located 25 km away at the same elevation with a similar geological and climatic setting. However, the BEAU site is embedded in a highly altered dolomite (typical porosity from core sample between 5 and 11 %) capped with a shallow soil of the Durzon karst hydro-system.
3.1 Cave topography
Positions of cave gravity stations at each site were measured using standard speleology tools. Azimuth, inclination and distance measurements were performed along two topographic surveys between surface and depth stations. The closing misfit between these surveys indicates an elevation accuracy of about 0.2 m.
3.2 Meteorological data
Precipitation and potential evapotranspiration are provided by the French national meteorological agency (Météo-France). The nearest meteorological station of each site was selected. Precipitation is monitored daily at 4 km to the south-east of SEOU site and 5 km to the south of the BESS site. Rain gauges are automatic tipping-bucket with a resolution of 0.2 mm. The accuracy of rain gauges is equal to 4 % during weak precipitation, but the errors increase when precipitation exceeds 150 mm h−1 (10 % accuracy) (Civiate and Mandel, 2008), which is rare in the area. The rainfalls are spatially homogeneous on the seasonal scale but not on the event scale (Fores et al., 2017). Both sites (BESS and SEOU) are mainly influenced by Mediterranean climate even if in BESS a clearer influence of the oceanic climate can be observed. Daily potential evapotranspiration (PETd) is calculated by Météo-France using Penman–Monteith's formula. PETd is measured at 7 km to the south-west of SEOU site and 5 km to the south of BESS site. The actual evapotranspiration (AET) was calculated from the PETd and a crop coefficient (k). The crop coefficient is time-variable (i.e. during a season) (Allen et al., 1998) and includes effects of water availability and physiological properties of plants. The seasonal variation in the crop coefficient has been evaluated from 2 years of direct monitoring of actual evapotranspiration by a flux tower (Fores et al., 2017) and daily potential evapotranspiration (PETd). The crop coefficient varies seasonally between 0.55 in summer (as low soil moisture is available) and 1.20 in winter. The same crop coefficient has been used on the three sites as the climate and the land use are similar. On an annual baseline, the average crop coefficient ranges between 0.5 and 0.7 in the same area (Jacob et al., 2009).
Due to the lack of realistic error estimation, the accuracy of AET is fixed to 15 % based on recent estimation of AET from flux tower measurements (Fores et al., 2017). As the ratio of AET to precipitation amount is much smaller during winter than during summer, the impact of the AET uncertainty is higher during the discharge period (summer) and allows more confident interpretation during the recharge period (winter).
3.3 MRS survey
At the site BESS, two MRS surveys have conducted in May 2011 and August 2011. A NUMIS-LITE equipment from IRIS Instruments has been used with a 40 × 40 m square loop. A notch filter is used for cutting the harmonics of 50 Hz. The data were processed and inverted with SAMOVAR-11.3 software (Legchenko et al., 2002) using the procedure detailed in Mazzilli et al. (2016).
3.4 Surface-to-depth gravity experiment
Experimental set-up
The surface-to-depth (S2D) gravity experiment consists of measuring the time-lapse gravity difference between surface and depth at a given site. The morphology of the caves allows measurements inside the karst and at different depths in the unsaturated zone. For each karst system we choose one cave where the surface and the underground access can be managed with a relative gravimeter. S2D gravity measurements are done at the surface and ∼ −35 m depth at the SEOU cave. For BESS cave, gravity stations are located throughout the cave at different depths: the surface, −12, −23, −41 and −53 m.
The gravity measurements encompass a time span of 1.5 years from February 2010 to September 2011. Gravity was measured in late summer and early spring in order to evidence the seasonal water cycle. When more than two measurements per year have been done, all the results are averaged at a bi-annual frequency.
A relative gravimeter (Scintrex CG5) was used to measure the relative difference in gravity between two locations or stations. Scintrex relative gravimeters CG5 were used for a precise micro-gravity survey (Bonvalot et al., 2008; Merlet et al., 2008; Jacob et al., 2010; Pfeffer et al., 2013). The gravity sensor is based on a capacitive transducer electrostatic feedback system to counteract displacements of a proof mass attached to a fused quartz spring. The CG5 instrument has a reading resolution of 1 µGal and a repeatability smaller than 10 µGal (Scintrex limited, 2006). The compactness and the precision of the gravimeter match the requirements of micro-gravity in natural caves. As gravity signals of hydrological processes display relatively small variations in 10–30 µGal, a careful survey strategy and processing must be applied to gravity data. To limit temporal bias linked to gravimeter position, the height and orientation of the CG5 gravity sensor are fixed for all stations using a brass ring positioned on drilled holes in the bedrock. We used only the CG5 SN 167 (SN: serial number) for the measurements because of its known low drift and to limit instrumental biases.
Gravity data processing and error estimation
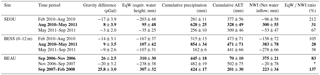
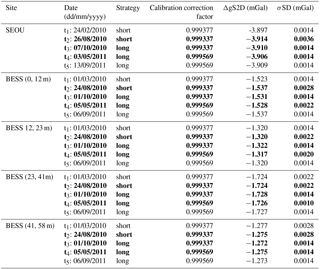
As demonstrated by Budetta and Carbonne (1997), Scintrex relative gravimeters need to be regularly calibrated when used to detect small gravity variations over extended periods of time. The calibration factor was measured before each gravity period at the Montpellier–Aigoual calibration line (Jacob, 2009). The accuracy of the calibration is 10−4. Calibration factor of CG5 SN 167 had not significant variations during the studied period (Appendix Table A1).
The gravity data are corrected for Earth tides using ETGTAB software (Wenzel, 1996) with the Tamura tidal potential development (Tamura, 1987). Considering the distance from the Atlantic Ocean, the ocean loading effects are weak (6 µGal) and have been removed using Schwiderski tide model (Schwiderski, 1980). Atmospheric pressure loading is corrected using a classical empirical admittance value of −0.3 µGal hPa−1 (pressure measurements have an accuracy of about 1 hPa with a field barometer). Polar motion effects are not corrected because they are nearly constant over the time span of one gravity survey (∼ 8 h).
The drift of the CG5 sensor is linked to a creep of the quartz spring and must be corrected to obtain reliable values of gravity variations. To estimate the drift, gravity surveys are set up in loops: starting and ending at the same reference station. The reference station is occupied several times during a survey. The instrumental drift is assumed to be linear during the short time span of the loops (less than 1 day). The drift of the CG5 SN 167 gravimeter is known to be particularly small, around 100 µGal day−1 (Jacob et al., 2010). The gravity differences relative to the reference station and the drift value are obtained using a least-square adjustment scheme with the software MCGRAVI (Belin, 2006) based on the inversion scheme of GRAVNET (Hwang et al., 2002). Parameters to be estimated are the gravity value at each station (surface and depths) and the linear drift of the gravimeter. Measurements of one station (md) relative to the reference station (ms) can be expressed as follows:
where Cf is the calibration correction factor, and are the reference and station gravity reading at times tj and ti respectively, is the residuals of (, Dk is the linear drift of the loop k, and gs and gd are the gravity values at the reference and the station. The variance of one gravity reading is given by the standard deviation of 90 s measurement series and additional errors of 2 µGal for inaccurate gravity corrections and possible set-up errors. The a posteriori variance of unit weight is computed as follows:
where n is the number of gravity readings averaged for each station occupation, s is the number of loops, m is the number of gravity stations, V is an n vector of residuals and P is a weight matrix. Table A1 in the Appendix summarizes the results of the gravity experiments at each site. One can note that the gravity error budget is smaller than the measured gravity variations; this validates the survey set-up and processing.
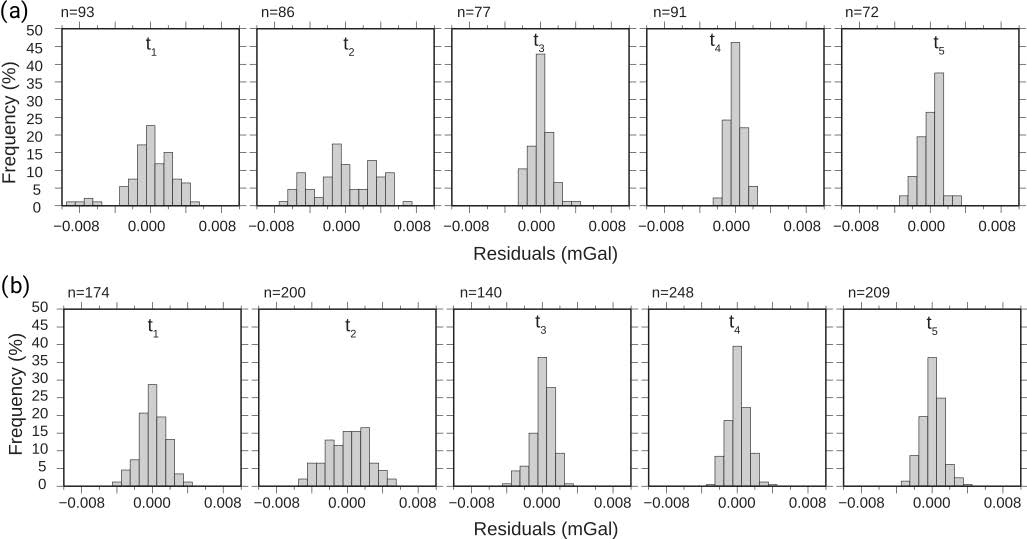
Figure 5Histogram of residuals of the observed gravity differences versus the adjusted gravity differences at the (a) SEOU site and (b) BESS site for each measurements periods. During t1 and t2, the short-term strategy was used and the long-term strategy was used during t3, t4 and t5.
Measurement relaxation and measurement strategy
In addition to the daily drift, the transport of the gravimeter causes a relaxation of the quartz spring that leads to a rapid variation in the gravity value during the first ∼ 40 min of measurements (in our case for the CG5 SN 167). This relaxation has already been described in previous studies such as Flury et al. (2007). The relaxation may sometimes be greater than the drift of the gravimeter and displays variable amplitude, probably depending on the time and the type of transport and meteorological variations. Contrary to the drift, reasons of the relaxation are not clearly understood and cannot be modelled. Without the correction of the relaxation, the relative gravity measurements must be accounted for in the error budget. To resolve this problem, we set up a new measurement strategy which allowed relaxation to be removed, and we compare it with a usual gravity measurement strategy.
Two measurement strategies are used in this study. The usual one, called a “short time strategy” consists of multiplying the occupations at all the stations (4 and 5 loops in our case). For each single occupation, 10 measurements of 90 s at 6 Hz sampling are performed. Only the last 5 or 6 nearly constant measurements are selected. Frequent reference station measurements during a loop allow for constraining the instrumental drift and the number of occupations leads to a statistical decrease in the error. With the short time strategy, one assumes that the relaxation due to the transport always results to the same bias from site to site. The time of transportation between two stations is kept as constant as possible to obtain similar relaxation bias. This strategy was used for the two first gravity surveys (winter and summer 2010).
The new strategy, called a “long time strategy”, aims to overcome the relaxation phenomena and was used for the last three gravity surveys. Only two or three occupations at the reference station and only one at the other stations are done. For each occupation, a minimum of 40 measurements of 90 s at 6 Hz sampling are performed (∼ 1 h). The rather large occupation time is necessary to ensure that the instrument has relaxed. The gravity reading then follows the daily linear drift. A minimum of 20 gravity readings during the linear, stable measurement period are kept. This strategy can be applied only if the non-linear part of the drift is small, which is the case for CG5 SN 167 gravimeter.
The evaluation of the measurement precision can be partially done with the help of the residuals. The residuals are the differences between the measured gravity value and the estimated gravity value. The residuals depend on the precision of the processed data and on the robustness of the measurements strategy. For example, if a histogram of a residual is centred on 0, it suggests that the correction processes have not introduced a bias in the gravity value estimation. The dispersion of the residuals can indicate noisy measurements or non-linear drift. The shape of the histogram shows the global precision of dataset. The residuals were estimated for each dataset (Fig. 5) and can be used to compare the two measurement strategies.
Most of the histograms display a Gaussian shape centred on zero with a small dispersion showing the good quality of the gravity readings and hence the robustness of the surface-to-depth gravity differences (ΔgS2D). However, the residuals of −8 µGal (Fig. 5a) for the period t1 at the SEOU site are due to an unexpected gravity jump during the survey. As no explanation was found for the gravity jump, they are kept for data adjustment even if the dispersion of the gravity residuals increases accordingly. For the two first datasets, 90 % of residuals are comprised of 8 µGal intervals. For the last three datasets, 90 % of residuals are between −2 and +2 µGal. Residuals histograms of the long time strategy are narrower than those of the short time strategy which confirms the improvement of the field experiment strategy (Fig. 5). The relaxation due to transportation or non-linear drift would have induced a non-Gaussian shape of the histograms not centred on zero as seen during the second survey at the SEOU site (Fig. 5a). We have tested in a cave the long time strategy using repeated measurement on a single station interrupted by hand transportation. As for the data shown here, these unpublished results, show a smaller dispersion of the residuals than the one provided by the short time strategy and an unbiased mean.
Gravity data after correction and drift adjustment are presented in Table A1 in the Appendix. For the SEOU site, the ΔgS2D values show significant temporal variations ranging from −3.897 to −3.914 mGal. At the BESS site, between the surface and 12 m depth, ΔgS2D values range from −1.523 to −1.537 mGal. Below 12 m, gravity variations are not significant.
4.1 Surface-to-depth formulation
The ΔgS2D gravity values contain the variations associated with elevation and with the differential attraction of rocks masses. These time-independent effects must be removed for access to water storage variations. In the following we assume that the sedimentary formations between the two measurement sites have no lateral variations in density.
Once surface-to-depth gravity differences are calculated, looking at temporal variations allows for retrieval of the water storage variations. Time-lapse S2D gravity can be interpreted in terms of equivalent water height changes, assuming that the water storage variations are laterally homogeneous at investigated temporal (seasonal) and spatial (∼ 100 m) scales. Such a hypothesis is likely to be untrue in a karstic area because of voids and heterogeneities potentially present on all scales. Looking at a temporal snapshot of the total water storage (porosity times saturation) in the first metres of the karst should probably show a high heterogeneity as seen in boreholes. Nevertheless, we justify our working hypothesis as follows:
-
S2D gravity measures on an intermediate (100 m) scale. The laterally integrative property of the gravity leads to small-scale (up to a few metres) heterogeneities being ignored, which is one of the main advantage of the gravity method. The large-scale heterogeneities (> 100 m) are negligible as they have an equivalent impact on the gravity measurements in surface and in depth (common mode rejection in the S2D method).
-
Time-lapse S2D gravity measures underground water variations associated with a seasonal water cycle. On the seasonal timescale, the storage function of the karst is probably largely dominant and the fast transfer (on the flood scale) is not measured.
-
Time-lapse S2D gravity measures the average water storage variations (i.e. porosity times saturation variations). As in our case the epikarst is never completely saturated during the measurements, the heterogeneity of the water storage variations is likely to be associated with saturation variation (due to climate) and not to porosity (due to heterogeneities).
For the duration of investigation, the effects of erosion on topography, caves and potential tectonic activity can be considered to be negligible for all sites. Additionally, temporal variations in the terrain correction are not significant (Jacob et al., 2009). Hence, the evolution of surface-to-depth gravity with time can be reduced to the following:
where Δtρapp is the apparent density change over time t. Surface-to-depth gravity variations during time period correspond to twice the Bouguer attraction of a plate with Δtρapp density of height h and doubles the signal-to-noise ratio. Finally, the apparent density variations depend only on water saturation variations. Time-lapse water saturation variation can be approximated to an equivalent water height (EqW) variation , and then Eq. (3) becomes the following:
where ρw is water density. Therefore, a S2D gravity difference of 2 µGal is associated with an effective water slab of 23.86 mm.
Table 1Time-lapse S2D gravity difference, equivalent water height, cumulative precipitation, cumulative actual evapotranspiration and total water inflow with the associated errors at SEOU, BESS and BEAU sites for different recharge and discharge periods. Recharge periods are indicated by bold font. For the BEAU site, only measurements with CG5 SN 167 are kept.
The measurements must be done during the minimum and maximum of the seasonal water cycle: the seasonal cycle is measured with a minimum uncertainty and the potential aliasing is reduced. In the Mediterranean climate, high precipitation events (HPEs) have a large impact in the yearly accumulated precipitation. HPEs occur mainly in autumn, especially in September. In 2011 an exceptional HPE occurs in March: an additional gravity survey (t4) was done in early May 2011 to reach the complete recharge. The low temporal sampling of the gravity survey could produce aliasing. To limit the impact of the aliasing, gravity surveys (except at the SEOU site in February 2010) were not planned just after significant rainfall events. The absolute gravity monitoring done in Larzac near the BESS site (Deville et al., 2012) monitored the recharge, to adapt the S2D gravity surveys dates and to reduce the potential aliasing.
During all discharge periods, gravity differences are negative in the three sites, indicating a decrease in EqW. For all recharge periods, gravity differences are always positive, indicating an increase in EqW. At the SEOU site, the two dry seasons lead to a loss of about 203 mm and 35 mm EqW respectively for the first and second discharge periods. During the recharge period, increases in EqW is equal to 95 mm, in accordance with high precipitation value during this period. At the BESS site between 0 and 12 m, the two discharge periods show a similar loss around 167 and 107 mm. The recharge period has a positive EqW equal to 107 mm with respect to high precipitation value. At the BEAU site, only one discharge period was monitored and the loss is equal to 238 mm. For the two recharge periods EqW have the same value around 300 mm, larger than SEOU and BESS sites. Except for the first recharge period at the SEOU site, the EqW values during recharge and during discharge are equivalent.
4.2 Seasonal water storage
As the precipitation and the evapotranspiration can vary geographically from site to site, EqW cannot be directly compared. Looking to the ratio between the time-lapse S2D gravity variations (or EqW) and the net water inflow (NWI) allows the inter-comparison between different sites and the interpretation in terms of water storage capacities. The normalization of EqW by the net water inflow also allows comparison of EqW measured in other time periods, for example at the BEAU site in 2007–2008. As no surface runoff has been observed at the three sites, we consider that all rainfall directly infiltrates into the soil. As AET contributes to removing water from the soil, it was taken into account in the mass balance. The effective precipitation or the net water inflow during a time period is the difference between the cumulative precipitation (Pc) and the cumulative actual evapotranspiration (AETc) for the given site:
The net water inflow exhibits, as expected, a seasonal cycle. High values (up to 383 mm) during the recharge and small or negative values during the discharge (down to −278 mm) were estimated (Table 1).
During the discharge period, EqW and NWI are all negative. The EqW is larger (in absolute value) than NWI for the February 2010 to August 2010 discharge period at SEOU and BESS sites. In contrast, for May 2011 to September 2011 discharge period, EqW is lower (in absolute values) than NWI (Table 1). Such an unrelated relationship between EqW variations and NWI seems to be typical of the discharge and prevents simple interpretation. The discharge is also characterized by a high error budget of NWI values as the evaluation of AET is dependent on the relative low accuracy of the crop coefficient. As during the discharge the AET is important compared to the precipitation, the uncertainty of AET prevents further interpretation. The discharge period is therefore not included in the following discussion.
During the recharge, the two sites BESS and SEOU exhibit a similar pattern as the EqW is smaller (about 30 %) than the net water inflow (Fig. 6). For example, at the BESS site EqW is equal to 107 mm when the net water inflow reaches 383 mm. However, during the same season, EqW and NWI are similar at the BEAU site (83 and 137 %). As the EqW ∕ NWI ratio is a climatic normalization, the heterogeneity in the seasonal water storage is therefore clearly shown as expected in a karstic environment. The EqW ∕ NWI ratio confirms the direct S2D measurement reading, with larger S2D gravity variations at BEAU than at SEOU and BESS (Fig. 6).
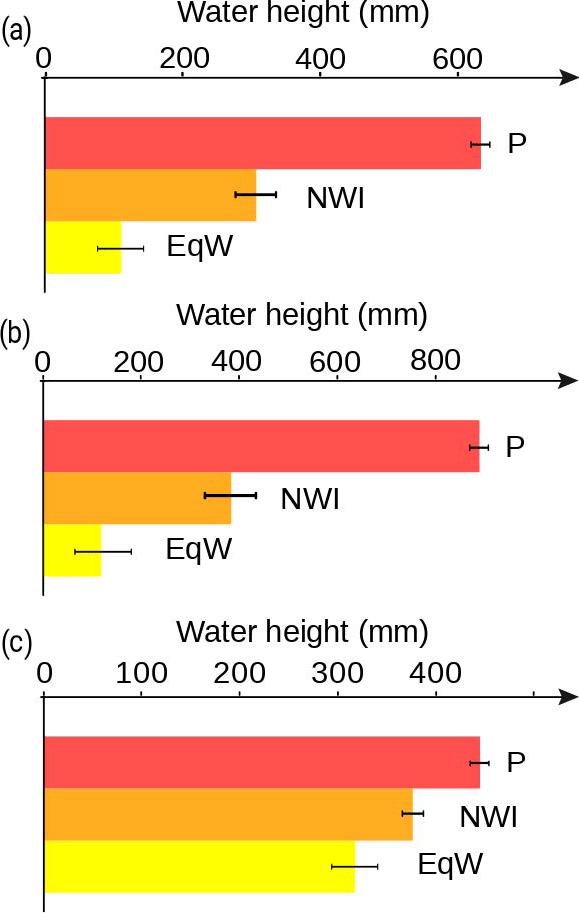
Figure 6Precipitation, net water inflow and EqW during recharge period for the (a) SEOU site, (b) BESS site and (c) BEAU site.
4.3 Depth distribution of seasonal EqW
Results summarized in Table 1 for the BESS site are the EqW between the surface and the 12 m depth station. In the BESS site, EqW values deduced from gravity measurements are available at five different depths. Gravity depth profiles have nearly the opposite shape during recharge and discharge periods (Fig. 7). During recharge periods, gravity variation is equal to 107 mm (9 µGal) between the surface and 12 m depth with a small error budget (3 µGal). Below 12 m depth, gravity variations are not significant (< 3 µGal for the second, the third and the fourth depth stations). For the second discharge period, time-lapse S2D gravity variation also has a value of 107 mm (−9 µGal) for the first depth, with 2.5 µGal of the error budget and without significant gravity variations below.
The vertical gravity profile can be compared to the MRS vertical profiles at the same place (Fig. 7). The MRS profile clearly indicated significant water content near the surface with a maximum around 10 m depth. The correlation between both independent geophysical methods confirms the importance of a superficial reservoir in the first 10 m depth. No significant variations between the two MRS surveys can be evidenced from the inversions. It allows quantification of a maximum MRS water content variations around 1 % (130 mm in EqW) in the first 10 m depth. The 1 % maximum MRS water content variations is coherent with the gravity estimation around 100 mm.
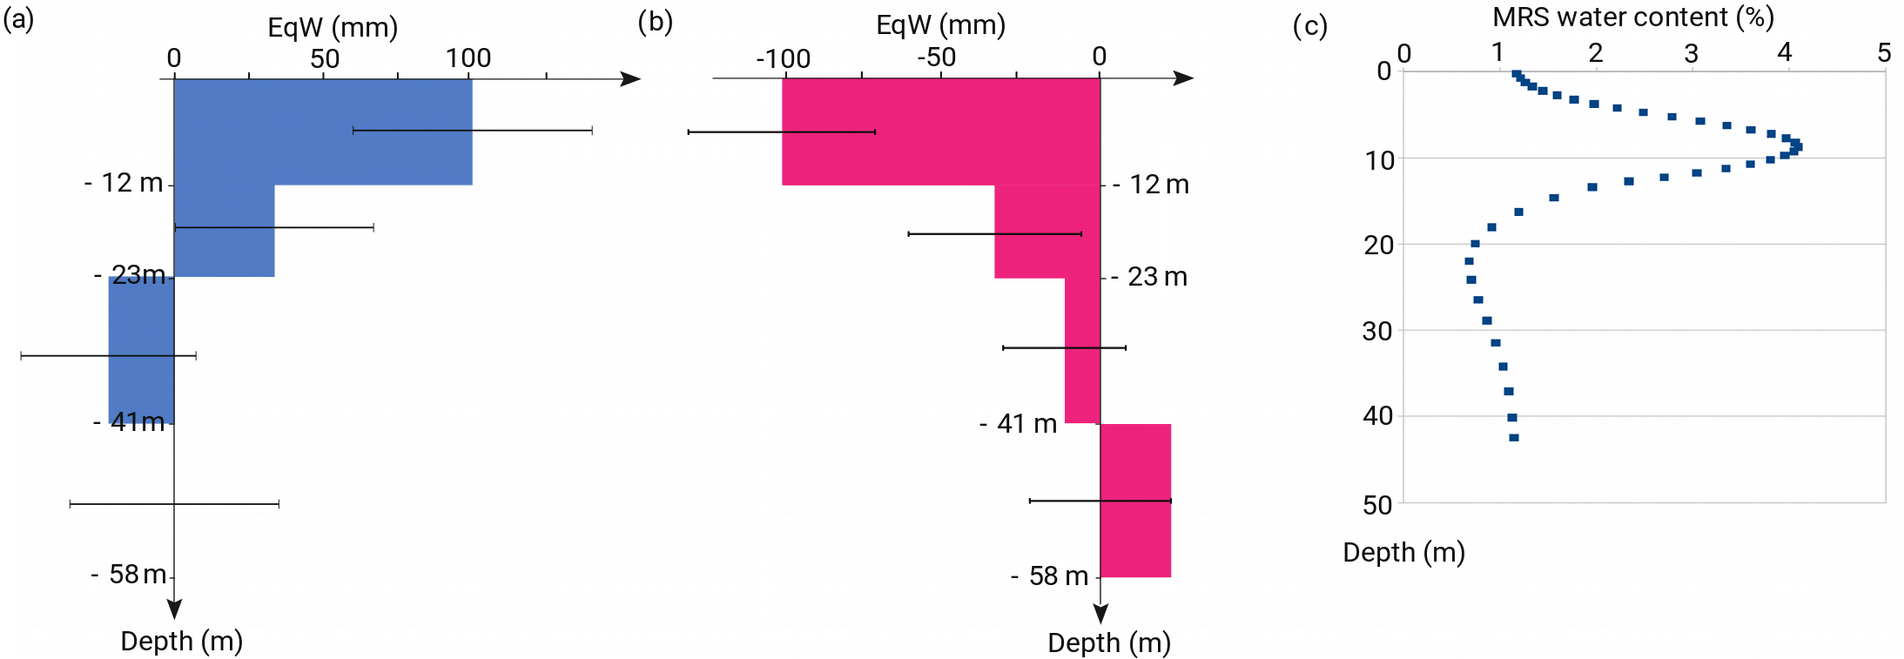
Figure 7S2D gravity difference function of depth at the BESS site for the (a) recharge period (t2–t4) in 2010, (b) and discharge period (t4–t5) in 2011; (c) MRS profile of May 2011 at the BESS site.
5.1 Precision of S2D measurements
We show, using two measurement strategies, that the error budget can be minimized. A long time measurement strategy (45 min per site) displays a better error budget than a short time strategy (10 min per site). However, we perform the long time strategy with a unique measurement on each station (except the base station). This strategy can be performed only if the gravimeter has a quasi-linear drift. For the site BESS, the similarity of the gravity measurements to the MRS profile (Fig. 7) is an indirect confirmation of the quality of the gravity measurement. The coherence of the gravity between the wet and the dry season is another indirect confirmation of a significant signal-to-noise ratio. From the MRS, the water content variations should not vary significantly below 15 m. The S2D gravity below 15 m depth ranges between −3 and 3 µGal, leading to another estimation of the S2 gravity precision around 3 µGal. The measurements are suitable for a quantitative interpretation of differential gravity in terms of water storage.
5.2 Quantification of the epikarst water storage
The gravity survey done at the BESS site allow the depth distribution of the seasonal water storage variations to be evaluated. Both recharge and discharge periods show water storage variations in unsaturated zones located within the first 12 m (Fig. 7), with a seasonal water storage of up to 107 mm (9 µGal). The water content between 12 and 58 m depth is too small to be measured by both the gravity and the MRS. At the BESS site, the subsurface reservoir can be identified as the surface thin dolomite formation and/or as an epikarst, both being characterized by an enhanced porosity. Various studies support the hypothesis of a key role of the epikarst in the seasonal water storage (Mangin, 1975; Perrin et al., 2003; Klimchouk, 2004; Williams, 2008). Weathered structures (and especially in dolomite rocks) allow water reservoirs to form in the first few metres of the unsaturated zone of a karst system. Following Williams (2008), epikarst thickness may vary from 0 to 30 m and epikarst water storage occurs because of a strong porosity in the epikarst associated with a reduced permeability at its base. Surface-to-depth gravity and MRS allow a precise quantification of both thickness and amplitude of subsurface water storage at the BESS site.
The knowledge of the amount and depth of water storage in epikarst provides new and quantitative information for the modelling of groundwater transfer. The epikarst reservoir is a major parameter for pollution vulnerability mapping in karst hydro-system as in the PaPRIKa (Protection of the aquifers from the assessment of four criteria: Protection, Rock type, Infiltration and Karstification degree) model for example (Dörfliger et al., 2010). Pollution can reach the spring in a few days (fast transfer), but another part of the pollution can be stored seasonally in the epikarst. In particular, high water content in the subsurface may facilitate the piston flow effect and accelerate the flood dynamics but not necessarily the transport. The coupling between gravimetric hydrological and MRS measurements may provide significant knowledge on unsaturated aquifer vulnerability to pollution: Mazzilli et al. (2016) highlight the role of water saturation in the infiltration zone from MRS survey mapping in nearby Larzac karst area.
5.3 Variability of epikarst water storage
Comparison of the ratio of EqW to NWI allows a quantification of the transient water storage in the epikarst. Significant seasonal water storage is measured at the three sites but with a different associated ratio. Overall, the results confirm the role of the epikarst as an active reservoir on seasonal timescales but also highlight the heterogeneity of the karst. During the recharge period, EqW increases correspond to 30 % of NWI at SEOU and BESS sites whereas at the BEAU site the EqW increase is as large as 80 % of NWI.
The variability of the ratio EqW versus NWI can be associated with a variety of factors: lithology, thickness of the unsaturated zone or depth of the measurements, thickness of the epikarst, intensity of the fracture and alteration, among others. The thickness of the unsaturated zone could be correlated with its storage capacity if the storage was occurring on the whole thickness. Regarding the three sites, BESS and SEOU sites have a similar EqW-to-NWI ratio in spite of a large difference in unsaturated thickness, which is between 40 and 300 m. Also, BEAU and BESS sites have a similar unsaturated thickness (200–300 m) but have a great difference in the EqW-to-NWI ratio. Our case suggests that the thickness of unsaturated zone is not a critical factor influencing seasonal water storage capacity of the karst.
The EqW to NWI ratio from the gravity measurements is now interpreted in the terms of karst morphology or lithology. Water storage capacity in the three site is largely dependent on the kind of host rock: limestone for BESS (except a few metres in subsurface: dolomite) and SEOU sites and dolomite for BEAU site.
A high ratio of the NWI is stored in subsurface in the dolomite site BEAU, as expected from other studies in the same area (Fores et al., 2017). The amount of gravity variations is typical of the area and significantly larger than BESS and SEOU sites. In the compact limestone sites (BESS and SEOU), only one-third of the NWI is stored. Alteration of the dolomite develops new micro-porosity which in turn increases the reservoir properties (Quinif, 1999). Enlarged fractures associated with secondary porosity are also filled by the residuals of dolomite alteration (sand). By contrast, in BESS and SEOU sites the limestone is rather characterized by a low to medium micro-porosity (characterized by core sample porosity measurements from 0.5 to 5 %) drained by open fractures. Only a small part on the net water inflow can be stored in the primary and secondary porosity. As a consequence, seasonal water storage capabilities of dolomite are more important than those of limestone. Unsaturated zones of dolomite karst (BEAU site) have a large capacitive function (up to 80 % of NWI) and a relatively limited transfer function. In contrast, unsaturated zones of limestone karst systems (SEOU and BESS sites) have a reduced capacitive function (around 30 % of NWI).
Previous studies indicate that epikarst has a large capacitive function and corresponds to a main seasonal stock of water (Klimchouk, 2004; Williams, 2008). The predominant role of epikarst for water storage is confirmed by the S2D gravity survey and the MRS. However, porosity is highly dependent on the type of limestone and our two sites have compact limestone. The impact of the lithology should be further studied by adding different sites in the same hydro-climatic context with complementary measurements such as MRS and core samples (Mazzilli et al., 2016). From a MRS mapping survey conducted by Mazzilli et al. (2016) in the nearby Larzac area, one important result is the high water content not only in the subsurface or epikarst but also in the infiltration zone, independent of the lithology. The BESS site water content profile is not typical but an exception. The main geological particularity of the BESS site is the thin top formation of dolomite above the limestone which could enhance the capacitive function of the epikarst.
5.4 Capacitive and transmissive reservoir properties
When surface-only gravity time series are associated with a simple hydrological model to correct surface effects (topography and building umbrella effect), reservoir transfer properties (hydraulic conductivity or specific yield) can be determined (Deville et al., 2012), but it requires continuous or frequent gravity measurements. Thus is not the case in the present study; however, due to time-lapse S2D measurements, it is possible to partially estimate reservoir transfer properties. As gravity measurements are repeated seasonally, the ratios of EqW to NWI indicate whether the water time transfer is larger than 6 months (or not). During the recharge period, the epikarst reservoir is filled by water fluxes from surface. As large seasonal water storage is observed in BEAU, the transfer time of the epikarst reservoir should exceed 6 months. However, almost no inter-annual cycle has been observed (Deville et al., 2012) for the Durzon karst system from surface absolute gravity measurements, and therefore, the transfer time should be less than 1 year. The range of transfer time is also in accordance with the model result obtained for the Durzon karst system. An intermediate transfer time of the epikarst reservoir to the infiltration zone of about 6–12 months can be proposed for altered dolomite karst with a lack of high transmissive fractures. This characteristic transfer time is in accordance with the models fitted using continuous superconducting gravity data (Fores et al., 2017).
However, only a small part of the NWI is stored in the limestone epikarst (BESS, SEOU) after the recharge period. A short transfer time (< 6 months) in the limestone karst is therefore necessary and can be due to open fractures as observed in surface. The poorly capacitive epikarst at the SEOU site is highlighted by nearby MRS measurements (near the spring 5 km away) measuring water content between 0 and 1.7 % (Vouillamoz et al., 2003). Chevalier (1988) has also shown with the analysis of the spring water during flood events that water transfer is fast between surface and spring (a few days) and the major part of the net water inflow is retrieved a few days after the rain at the spring.
Using a reservoir modelling with a classical Maillet (1906) law, transfer times of 3.5 months for limestone sites (SEOU and BESS) and 13 months for dolomite site (BEAU) can be estimated. One can finally look at the SEOU recharge 2010 survey which has an abnormal high EqW increase (Table 1). The measure was done only 1 day after a heavy rainfall and a significant amount of water from rainfall is probably still present in the unsaturated zone.
The time-lapse S2D methodology uses in situ measurements in karst caves during a seasonal climatic cycle. As large volumes are investigated by gravity, small-scale heterogeneities (∼ 10 m) are averaged. Gravimetry allows investigation of heterogeneities on an intermediate scale or meso-scale (∼ 100 m) and is well suited to further assimilation in numerical models. The three sites display different morphologies and lithologies. In all cases, a significant seasonal water storage is always measured. No relation between seasonal water storage amplitude and morphology of karst systems (i.e. unsaturated zone thickness) has been observed. By contrast, the EqW-to-NWI ratio seems to be dependent on the lithology. Especially, the alteration of the dolomite tends to enhance storage properties of the epikarst. In our study, the dolomitic epikarsts have greater capacitive function than limestone epikarst. We highlighted a different capacitive function between the two sites located in limestone with respect to the one embedded in a dolomite environment.
The thickness of the epikarst was estimated in the BESS site thanks to gravity stations regularly spaced in depth. The seasonal water storage mostly occurs in the upper 12 m in accordance with MRS profile. The 12 m sub-surface reservoir can be identified as the high porosity zone of the epikarst and/or dolomite versus limestone changes. The limestone infiltration zone below 12 m is only transmissive without seasonal water storage.
The transmissive function of the epikarst can be partially estimated from the gravity water storage estimations. In this study, the transfer times of recharge water are longer in dolomites (> 6 months) than in limestones (< 6 months). The study of the karst transfer function cannot be done directly from surface gravity measurements and this is a clear advantage of the S2D set-up. The addition of an absolute (or continuous) gravity monitoring at the surface would allow the estimation of the water storage between the surface and the measurements at shallow depths and also deeper, and could give constrain on the infiltration–saturated zone.
Since this study focuses only on three sites, the results should be compared with other measurements in various karst systems to analyse more rigorously the impact of the fracture, the alteration and the lithology. Moreover, gravity observations should be combined with in situ fluxes such as seepage or geophysical measurements, for example MRS or ERT (Mazzilli et al., 2016) in order to study the relation between groundwater storage (from MRS) and transient seasonal variations in the groundwater storage (from gravity). These collocated measurements should lead to a better knowledge of unsaturated zone properties and processes as demonstrated for the BESS site.
The data used in this paper are available thanks to the French “Service National d'Observation” of the INSU/CNRS at the following URLs: http://hplus.ore.fr/en/ (INSU/CNRS, 2018) and https://data.oreme.org/gek/home (OREME, 2018).
Table A1Results of the least-square inversion for each site and each time period. Results at the BESS site are represented for each thickness. Strategy stands for the number of gravity measurements at the reference gravity points depending on the strategy (long or short). Recharge periods are indicated by the bold font.
CC took part in the gravity and MRS field experiments, the interpretation of the results, and the writing of the paper. SD took part in the gravity and MRS field experiments, the data processing, the interpretation of the results, and the writing of the paper. JC took part in the gravity field experiments, the interpretation of the results and the writing of the paper. ED, NLM, RB and PV took part in the gravity field experiments and the interpretation of the results. NM was in charge of the MRS surveys and participated in the interpretation of the results.
The authors declare that they have no conflict of interest.
The project is part of the HydroKarst G2 project from 2009 to 2013
funded by the French Agence Nationale de la Recherche (ANR). Gravity surveys
were part of the OSU OREME funded by the Institut de Recherche pour le
Développement (IRD) and the Institut National des Sciences de l'Univers
(INSU) and of SNO-SOERE H+ (INSU). The Scintrex CG5 relative gravimeter was
loaned by the Gravity Mobile facility (GMOB) of RESIF-INSU. We would also
like to acknowledge the owner of SEOU and M. Magne, owner of BESS, for letting us access the caves and
Marie Boucher for her help with the MRS survey. The paper benefited from
reviews by two anonymous reviewers.
Edited by: Marnik Vanclooster
Reviewed by:
two anonymous referees
Al-fares, W., Bakalowicz, M., Guérin, R., and Dukhan, M.: Analysis of the karst aquifer structure of the Lamalou area (Hérault, France) with ground penetrating radar, J. Appl. Geophys., 51, 97–106, 2002.
Allen, G. A., Pereira, L. S., Raes, D., and Smith, M.: Crop evapotranspiration – Guidelines for computing crop water requirements, Rome, FAO-Food and Agriculture Organization of the United Nations, 1998.
Bakalowicz, M.: Karst groundwater: a challenge for new resources, Hydrogeol. J., 13, 148–160, 2005.
Batiot, C., Emblanch, C., and Blavoux, B.: Carbone Organique Total (COT) et Magnésium (Mg2+) : deux traceurs complémentaires du temps de séjour dans l'aquifère karstique, C. R. Geosci., 335, 205–214, 2003.
Beilin, J.: Apport de la gravimétrie absolue à la réalisation de la composante gravimétrique du Réseau Géodésique Français, Institut Géographique National, 2006.
Boinet, N.: Exploitation de la fracturation d'un massif par la karstification: exemple de Causse de l'Hortus (Hérault, France), Geodin. Acta, 12, 237–247, 1999.
Boinet, N.: Inventaire spéléologique du Causse de l'Hortus-Tome 4, available at: http://speleoclpa.free.fr/explokarst4/expokarst4.htm (last access: 16 July 2018), 2002 (in French).
Bonnet, M., Lallemand-Barres, A., Thiery, D., Bonin, H., and Paloc, H.: Etude des mécanismes de l'alimentation d'un massif karstique à travers la zone non saturée. Application au massif de l'Hortus, S. g. N.-S. H. Rapport du BRGM, 1980.
Bonvalot, S., Remy, D., Deplus, C., Diament, M., and Gabalda, G.: Insights on the March 1998 eruption at Piton de la Fournaise volcano (La Reunion) from microgravity monitoring, J. Geophys. Res.-Sol. Ea., 113, B05407, https://doi.org/10.1029/2007JB005084, 2008.
Budetta, G. and Carbone, D.: Potential application of the Scintrex CG-3M gravimeter for monitoring volcanic activity; results of field trials on Mt. Etna, Sicily, J. Volcanol. Geoth. Res., 76, 199–214, 1997.
Chevalier, J.: Hydrodynamique de la zone non saturée d'un aquifère karstique: Etude expérimentale. Site du Lamalou-Languedoc, Université Montpellier 2, 195 pp., 1988.
Civiate, M. and Mandel, F.: La mesure de hauteurs de précipitations – Fiche descriptive sur les instruments de mesure météorologique – Version 1.0. Météo-France, 2008.
Davis, K., Li, Y., and Batzle, M.: Time-lapse gravity monitoring: A systematic 4D approach with application to aquifer storage and recovery, Geophysics, 73, WA61–WA69, https://doi.org/10.1190/1.2987376, 2008.
Deville, S., Jacob, T., Chery, J., and Champollion, C.: On the impact of topography and building mask on time varying gravity due to local hydrology, Geophys. J. Int., 192, 82–93, 2012.
Dörfliger, N., Plagnes, V., and Kavouri, K.: PaPRIKa a multicriteria vulnerability method as a tool for sustainable management of karst aquifers Example of application on a test site in SW France, Sustainability of the Karst Environment, 49–56, 2010.
Durand, V.: Structure d'un massif karstique. Relations entre déformations et facteurs hydrométéorologiques, Causse de l'Hortus – sites des sources du Lamalou (Hérault), PhD Thesis, Université Montpellier II, 1992.
Emblanch, C., Zuppi, C., Mudry, J., Blavoux, B., and Batiot, C.: Carbon 13 of TDIC to quantify the role of the unsaturated zone: the example of the Vaucluse karst systems (Southeastern France), J. Hydrol., 279, 262–274, 2003.
Fleury, P., Bakalowicz, M., and Becker, M.: Characterising a karst system with a submarine spring: the example of La Mortola (Italy), C. R. Geosci., 339, 407–417, https://doi.org/10.1016/j.crte.2007.04.004, 2007.
Flury, J., Peters, T., Schmeer, M., Timmen, L., Wilmes, H., and Falk, R.: Precision gravimetry in the new Zugspitze gravity meter calibration system, Proceedings of the 1st International Symposium of the International Gravity Field Service, Istanbul 2006, Harita Dergisi, Special Issue, Nr. 18, 401–406, 2007.
Fores, B., Champollion, C., Le Moigne, N., Bayer, R., and Chéry, J.: Assessing the precision of the iGrav superconducting gravimeter for hydrological models and karstic hydrological process identification. Geophys. J. Int., 208, 269–280, 2017.
Harnisch, G. and Harnisch, M.: Hydrological influences in long gravimetric data series, J. Geodyn., 41, 276–287, 2006.
Hu, C., Hao, Y., Yeh, T. J., Pang, B., and Wu, Z.: Simulation of spring flows from a karst aquifer with an artificial neural network, Hydrol. Process., 22, 596–604, 2008.
Hwang, C., Wang, C. G., and Lee, L.-H.: Adjustment of relative gravity measurements using weighted and datum-free constraints, Comput. Geosci., 28, 1005–1015, 2002.
INSU/CNRS: Service National d'Observation, Network of hydrogeological research sites H+, available at: http://hplus.ore.fr/en/, last access: 16 July 2018.
Jacob, T.: Apport de la gravimétrie et de l'inclinométrie à l'hydrogéologie karstique. Geosciences Montpellier, Montpellier, Université des Sciences et Technologies, 2009.
Jacob, T., Bayer, R., Chery, J., Jourde, H., Le Moigne, N., Boy, J. P., Hinderer, J., Luck, B., and Brunet, P.: Absolute gravity monitoring of water storage variation in a karst aquifer on the Larzac plateau (Southern france), J. Hydrol., 359, 105–117, https://doi.org/10.1016/j.jhydrol.2008.06.020, 2008.
Jacob, T., Chery, J., Bayer, R., Le Moigne, N., Boy, J. P., Vernant, P., and Boudin, F.: Time-lapse surface to depth gravity measurements on a karst system reveal the dominant role of the epikarst as a water storage entity, Geophys. J. Int., 177, 347–360, https://doi.org/10.1111/j.1365-246X.2009.04118.x, 2009.
Jacob, T., Bayer, R., Chery, J., and Le Moigne, N.: Time-lapse microgravity surveys reveal water storage heterogeneity of a karst aquifer, J. Geophys. Res.-Sol. Ea., 115, https://doi.org/10.1029/2009JB006616, 2010.
Klimchouk, A.: Towards defining, delimiting and classifying epikarst: Its origin, processes and variants of geomorphic evolution. Proc. of the symposium held October 1 through 4, 2003 Sheperdstown, West Virginia, USA, Karst Water Institute special publication, Epikarst, 9, 23–25, 2004.
Lastennet, R. and Mudry, J.: Role of karstification and rainfall in the behavior of a heterogeneous karst system, Environ. Geol., 32, 114–123, 1997.
Legchenko, A., Baltassat, J. M., Beauce, A., and Bernard, J.: Nuclear magnetic resonance as a geophysical tool for hydrogeologists, J. Appl. Geophys., 50, 21–46, 2002.
Maillet, E.: La vidange des systèmes de réservoirs, Annales Ponts et Chaussées, Mémoires et Documents, vol. 21, 1906.
Mangin, A.: Contribution à l'étude hydrodynamique des aquifères karstiques, PhD Thesis, Université de Dijon, 124, 1975.
Mazzilli, N., Boucher, M., Chalikakis, K., Legchenko, A., Jourde, H., and Champollion, C.: Contribution of magnetic resonance soundings for characterizing water storage in the unsaturated zone of karst aquifers, Geophysics, 81, WB49–WB61, 2016.
Merlet, S., Kopaev, A., Diament, M., Geneves, G., Landragin, A., and Pereira Dos Santos, F.: Micro-gravity investigations for the LNE watt balance project, Metrologia, 45, 265–274, https://doi.org/10.1088/0026-1394/45/3/002, 2008.
OREME: Observatoire de REcherche Méditerranéen de l'Environnement, available at: https://data.oreme.org/gek/home, last access: 16 July 2018.
Perrin, J., Jeannin, P., and Zwahlen, F.: Epikarst storage in a karst aquifer: a conceptual model based on isotopic data, Milandre test site, Switzerland, J. Hydrol., 279, 106–124, 2003.
Pfeffer, J., Champollion, C., Favreau, G., Cappelaere, B., Hinderer, J., Boucher, M., Nazoumou, Y., Oï, M., Mouyen, M., Henri, C., Le Moigne, N., Deroussi, S., Demarty, J., Boulain, N., Benarrosh, N., and Robert, O.: Evaluating surface and subsurface water storage variations at small time and space scales from relative gravity measurements in semiarid Niger, Water Resour. Res., 49, 3276–3291, https://doi.org/10.1002/wrcr.20235, 2013.
Pinault, J. L., Plagnes, V., Aquilina, L., and Bakalowicz, M.: Inverse modeling of the hydrological and the hydrochemical behavior of hydrosystems; characterization of karst system functioning, Water Resour. Res., 37, 2191–2204, 2001.
Quinif, Y.: Fantômisation, cryptoaltération et altération sur roche nue, le triptyque de la karstification, Actes du colloque européen Karst-99, 159–164, 1999.
Schwiderski, E. W.: Ocean tides, II: A hydrodynamic interpolation model, Mar. Geod., 3, 219–255, 1980.
Scintrex limited: CG5 Scintrex autograv system Operation Manual, Concord, Ontario, Scintrex Limited, 2006.
SIE Rhône-Méditerranée, E.-F.: Fiche de caractérisation des masses d'eau souterraine : Calcaires et marnes Causses et avant-Causses du Larzac sud, Campestre, Blandas, Séranne, available at: http://www.rhone-mediterranee.eaufrance.fr/ (last access: 13 July 2018), 2011.
Tamura, Y.: A harmonic development of the tide generating potential, Bull. d'Inf. Marées Terr., 99, 6813–6855, 1987.
Tanaka, Y., Miyajima, R., Asai, H., Horiuchi, Y., Kumada, K., Asai, Y.,, and Ishii, H.: Hydrological gravity response detection using a gPhone below- And aboveground, Earth Planets Space, 65, 59–66, https://doi.org/10.5047/eps.2012.06.0122011, 2011.
Turc, L.: Evaluation des besoins en eau d'irrigation, évapotranspiration potentielle, Ann. Agron., 12, 13–49, 1961.
Valois, R.: Caractérisation structurale de morphologies karstiques superficielles et suivi temporel de l'infiltration à l'aide des méthodes électriques et sismiques, Sisyphe, Paris, Université Pierre et Marie Curie, 244, 2011.
Van Camp, M., Meus, P., Quinif, Y., Kaufman, O., Van Ruymbeke, M., Vandiepenbeeck, M., and Camelbeek, T.: Karst aquifer investigation using absolute gravity, EOS T., 87, 298, https://doi.org/10.1029/2006EO300005, 2006a.
Van Camp, M., Vanclooster, M., Crommen, O., Petermans, T., Verbeeck, K., Meurers, B., van Dam, T., and Dassargues, A.: Hydrogeological investigations at the Membach station, Belgium, and application to correct long periodic gravity variations, J. Geophys. Res., 111, B10403, https://doi.org/10.1029/2006JB004405, 2006b.
Van Camp, M., Viron, O., Watlet, A., Meurers, B., Francis, O., and Caudron, C.: Geophysics From Terrestrial Time-Variable Gravity Measurements, Rev. Geophys., 55, 938–992, https://doi.org/10.1002/2017RG000566, 2017.
Vouillamoz, J. M., Legchenko, A., Albouy, Y., Bakalowicz, M., Baltassat, J. M., and Al-Fares, W.: Localization of saturated karst aquifer with magnetic resonance sounding and resistivity imagery, Groundwater, 41, 578–586, 2003.
Wenzel, H.-G.: The Nanogal software: earth tide data processing package ETERNA 3.30, Bulletin d'Informations des Marees Terrestres, 124, 9425–9439, 1996.
Williams, P. W.: The role of the epikarst in karst and cave hydrogeology: a review, Int. J. Speleol., 37, 1–10, 2008.
Wu, J., Journel, A. G., and Mukerji, T.: Establishing spatial pattern correlations between water saturation time-lapse and seismic amplitude time-lapse, J. Can. Petrol. Technol., 45, 15–20, 2006.
Zhang, Z., Chen, X., Ghadouani, A., and Peng, S.: Modelling hydrological processes influenced by soil, rock and vegetation is a small karst basin of southwest China, Hydrol. Process., 25, 2456–2470, 2011.