the Creative Commons Attribution 4.0 License.
the Creative Commons Attribution 4.0 License.
 | 20 Jul 2018
Technical note: Saturated hydraulic conductivity and textural heterogeneity of soils
Carlos García-Gutiérrez
Yakov Pachepsky
Miguel Ángel Martín
Saturated hydraulic conductivity (Ksat) is an important soil parameter that highly depends on soil's particle size distribution (PSD). The nature of this dependency is explored in this work in two ways, (1) by using the information entropy as a heterogeneity parameter of the PSD and (2) using descriptions of PSD in forms of textural triplets, different than the usual description in terms of the triplet of sand, silt, and clay contents. The power of this parameter, as a descriptor of lnKsat, was tested on a database larger than 19 000 soils. Bootstrap analysis yielded coefficients of determination of up to 0.977 for lnKsat using a triplet that combines very coarse, coarse, medium, and fine sand as coarse particles; very fine sand, and silt as intermediate particles; and clay as fine particles. The power of the correlation was analysed for different textural classes and different triplets using a bootstrap approach. Also, it is noteworthy that soils with finer textures had worse correlations, as their hydraulic properties are not solely dependent on soil PSD.
This heterogeneity parameter can lead to new descriptions of soil PSD, other than the usual clay, silt, and sand, that can describe better different soil physical properties, that are texture-dependent.


Saturated hydraulic conductivity (Ksat) is the measure of soil's ability to conduct water under saturation conditions (Klute and Dirksen, 1986). It is an essential parameter of soil hydrology. Soil Ksat affects many aspects of soil functioning and soil ecological services, like infiltration, runoff, groundwater recharge, and nutrient transport. Knowing values of soil Ksat appears to be essential in designing management actions and practices, such as irrigation scheduling, drainage, flood protection, and erosion control.
The dependence of Ksat on soil texture has been well documented (Hillel, 1980). Different parametrizations of particle size distributions (PSDs) were suggested to relate Ksat and soil texture. It was proposed that d10, d20, and d50 particle diameters (Chapuis, 2004; Odong, 2007) or slope and intercept of the particle size distribution curve (Alyamani and Sen, 1993; Arya and Paris, 1980) could be used. Also, various functions were fitted to PSDs, and the fitting parameters were related to Ksat. For example, Chapuis et al. (2015) proposed using two lognormal distributions to fit the detailed particle size distribution and to use the lognormal distribution parameters to predict the Ksat.
A common way to parametrize the PSD for Ksat estimation purposes is using the textural triplet that provides the percentage of coarse particles (sand), intermediate particles (silt), and fine particles (clay). Ksat values are estimated using the contents of one or two triplet fractions or just the textural class (Rawls et al., 1998). Representing PSD by textural triplets is the common way to estimate a large number of soil parameters (Pachepsky and Rawls, 2004). The coarse, intermediate, and fine fractions need not be sand, silt, and clay. Martín et al. (2018) showed that different definitions of the triplet (e.g. coarse sand, sand, and medium sand as coarse; fine sand and very fine sand as intermediate; and silt and clay as fine triplet fractions) provide much better inputs for bulk density estimation compared with the standard textural triplet. These different parametrizations of soil texture might put the focus on different soil physical properties, depending on the different particle sizes represented in the triplet.
The heterogeneity of particle size distributions appears to be an important factor affecting hydraulic parameters of soils, including the saturated hydraulic conductivity. Values of Ksat depend on both distribution of sizes of soil particles, i.e. soil texture, and the spatial arrangement of these particles, i.e. soil structure. Soil structure can be to some extent controlled by soil texture, since packing of particles is affected by the particle size distributions (Assouline and Rouault, 1997; Gupta and Larson, 1979; Horn et al., 1994; Jorda et al., 2015). Recent studies proposed using the information entropy as the parameter of the PSD heterogeneity for predicting soil water retention (Martín et al., 2005) and soil bulk density (Martín et al., 2018). Previously, information entropy was used, together with other predictor variables to estimate Ksat, using multivariate analysis (Boadu, 2000).
The objective of this work was to test the hypothesis that combining two recent developments – the description of the PSD by different textural triplets that may represent different soil physical properties dependent on the particle sizes present in the triplet, and the information entropy, as a PSD heterogeneity parameter that depends on the triplet used – may linearly correlate with lnKsat and may be seen as a step forward to study the effect of heterogeneity widely recognized in the majority of works that studied the particle size–hydraulic-conductivity relationships. By describing the PSD in terms of different triplets, the input information would possibly have different physical interpretations. We wanted to link the heterogeneity of this physical information to the hydraulic behaviour of the soil. Therefore, we explored the possible relationships between lnKsat values and an entropy metric of soil texture heterogeneity using different size limits of coarse intermediate and fine fractions, using the large USKSAT database on laboratory-measured Ksat, which contains more than 19 000 samples. The triplets with highest correlations will be understood as the physical sizes that influence the most in the packing of particles yielding the particular hydraulic behaviour. While pedotransfer functions (PTFs) are a useful tool to predict difficult-to-measure soil properties, they sometimes exhibit highly non-linear relationships that are difficult to interpret. While the objective of this paper was the exploration of the physical relation of the new tools and the saturated hydraulic conductivity, the future development of PTFs for prediction purposes is a promising avenue for expanding this research. We note that research in this work is descriptive. It does not include an explanation of what we have observed. However, any explanatory research with mechanisms, models, etc. was historically preceded with the descriptive research.
2.1 Database description and textural triplet selection
For this study we used the USKSAT database, about which detailed information can be found in Pachepsky and Park (2015). This database consists of soils from different locations of the USA and contains soils from 45 different sources. We selected only those sources which (a) had data on both Ksat and on the seven textural fractions and (b) presented measurements of Ksat made in laboratory with the constant head method. From those, we subset those soils whose sum of mass in the seven textural fractions, i.e. (1) very coarse sand, (2) coarse sand, (3) medium sand, (4) fine sand, (5) very fine sand, (6) silt, and (7) clay ranged from 98 to 102 %. The final number of soils considered was 19 121. By USDA textural classes the total number of soils are 12 068 sands, 1780 loamy sands, 2123 sandy loams, 104 loams, 135 silt loams, 36 silts, 2004 sandy clay loams, 78 clay loams, 41 silt clay loams, 345 sandy clays, 0 silty clays, and 407 clays. All the samples in the database used are undisturbed soil samples.
We used all possible triplets formed from seven textural fractions. Triplets consisted of coarse, intermediate, and fine fractions. The symbols for triplet showed how the fractions were grouped. For example the “coarse” fraction for the triplet “3-2-2” included very coarse sand, coarse sand, and medium sand; the “intermediate” fraction included fine sand and very fine sand; and “fine” included silt and clay. The triplet “5-1-1” was the standard one where “coarse” included all five sand fractions, “intermediate” included silt, and “fine” included clay. The amount of possible triplets with 7 textural fractions was 15.
2.2 Heterogeneity metric calculation
The entropy-based parametrization of textures introduced in Martín et al. (2001) is a central concept in the information entropy (IE) (Shannon, 1948). Assuming the texture interval divided into k textural size ranges and that the respective textural fraction contents are , , with , the Shannon IE (Shannon, 1948) is defined by
where pilog2pi=0 if pi=0. The IE is a widely accepted measure of the heterogeneity of distributions (Khinchin, 1957). In the case of three fractions, the minimum value of IE is zero when only one fraction is present, and the maximum value is 1.57 when three fractions are present in equal amounts (see Fig. 1).
For each soil in this study, we grouped the 7 available textural fractions in the 15 possible triplet combinations and calculated the respective triplet's IE using formula (1). Figure 2 shows ternary graphs of IE calculated for all the soils available in this study but using two different triplets as input. It is clear that, by changing the triplet, the calculated IE values vary differently along the same textural triangle. IE is a measure of heterogeneity, but the triplet used is the substrate for this measure: (IE,triplet), i.e. (IE,“5-1-1”).
As we want to compare the linearity (i.e. the proportionality between the heterogeneity of the particular physical sizes chosen and the hydraulic behaviour), we used the coefficient of determination, R2, as a comparison statistic. As this statistic is highly sensitive to the number of points in the regression, we followed the binning method of Martín et al. (2017) to research the relationship between lnKsat and soil heterogeneity. Specifically, the range of values of IE was divided into 10 bins, and the average value of lnKsat was plotted against the average IE for the bin, i.e. the bin midpoint. This way, the number of points in each relationship was always the same. We want to state that this way, the particular value of R2 is irrelevant, but it is only to be used as a comparison tool among these regressions.
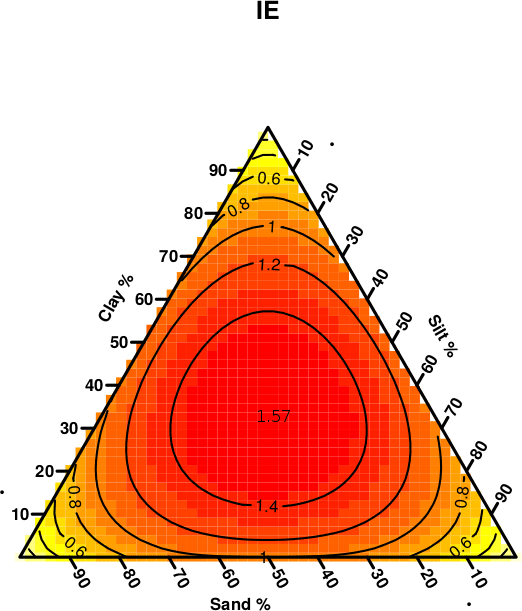
Figure 1IE numerical approximation ternary representation: IE is computed for a sample of 5051 evenly distributed soils in the USDA textural triangle using the clay, silt, and sand fractions as input triplet. This distribution of IE is repeated for any textural triangle, when the fractions used for its calculations are the ones at the axes of the triangle. The lowest values for the IE are near the vertex of the triangle, i.e. where one fraction dominates above the others. Biggest values are located towards the centre of the triangle, where the distribution fractions are more balanced.
Linear regressions “bin midpoint vs. average bin lnKsat” were computed. Besides the coefficient of determination value for comparison purposes, the goodness-of-fit of these regressions was tested using the root-mean-square error, RMSE:
where are the predicted and yt are the measured values of lnKsat, and n is the number of soils.
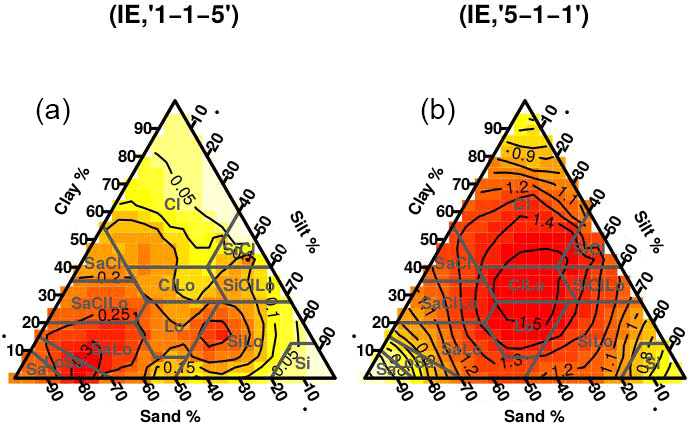
Figure 2Ternary representations for IE calculated for the soils of the study but using different triplets. The usual clay, silt, and sand triplet (“5-1-1”) was used at panel (a) and the grouping seven textural fractions into “1-1-5” was used as input for panel (b).
In order to make some inference on these parameters we employed the bootstrap method, which has been used in a very similar context by Schaap and Leij (2000). The bootstrap method is a tool for assessing statistical accuracy. It assumes that one can obtain multiple samples from a single data set, by randomly drawing data with replacement from the original sample. Thus, one can perform the same statistical analysis multiple times in different data sets, obtaining slightly different regression models, thus resulting in an uncertainty in each of the parameters of the model. All of the samples used have the same size as the original sample they were drawn from, so they are generated by random sampling with replacement. We used 1000 bootstrap data sets, resulting in 1000 linear regression models. In particular we obtained not just one R2 and one RMSE value for each IE vs. triplet regression, but 1000 of them, which were summarized into a mean and a standard deviation values. More information on this method can be found in Efron and Tibshirani (1993) and Hastie et al. (2003).
We took 1000 samples with size equal to the total amount of soils, with repetition, and calculated, for each sample, the coefficient of determination (R2) and the RMSE. Finally, the mean and standard deviation from these two values for the 1000 samples were calculated.
These regressions were obtained for each of 15 triplets and for those of USDA textural classes that were represented in the selected database by more than 50 samples, i.e. all of them except silty clay loams and silts.
2.3 IE variation in the textural triangle
Ternary graphs were used to visually correlate the IE values calculated with the lnKsat values of the soils in the study. Also, a less visual, but more quantifiable approach, to find out how much of lnKsat could be explained through IE variation was to find out what ranges of IE are available for soils in different textural classes and compare them to the range of lnKsat values of soils inside those same textural classes. Also, in order to compare the new tool (IE triplet), we compared these ranges to the ranges computed for (IE,“5-1-1”), i.e. to the values of the IE computed with the usual description of soil texture. We wanted to find out if, by changing the triplet, we would obtain a wider range of variation in IE for a given range of lnKsat. This way we compared if the new descriptions of texture, in the form of different triplets, might be suitable for explaining soil physical properties, in particular lnKsat.
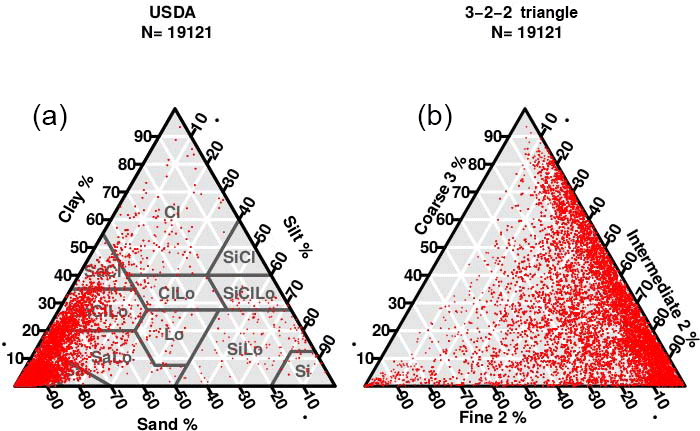
Figure 3Representation in the USDA textural triangle of the 19 193 soils used in this study. (a) Standard sand–silt–clay, i.e. “5-1-1” triplet. (b) The “3-2-2” triplet.
For each textural class, we did a sensitivity analysis by calculating the ratio of the range of lnKsat values inside the textural class versus the range of lnKsat values of all the soils in the study. The same was done for IE for each triplet.
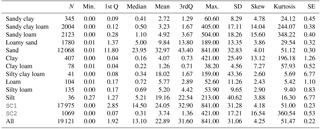
Table 1Statistical description of Ksat (cm h−1) values by
classes. Soils have also been grouped into two super classes, SC1
and SC2, which can be interpreted as the sandy class and not sandy
class, respectively. Legend: N, the number of soils in each class; SD, the
standard deviation; skew, the skewness number; SE, the standard error; and 1st Q, the first quartile.
3.1 The data set overview
Figure 3 presents the 19 121 soils used in this study in the USDA textural triangle and in the modified “3-2-2” triangle. The density of points reflects the dominance of coarse textural soils in the database. When the triplet is changed, the distribution of points across the triangle changes. By setting the textural fractions to be the “3-2-2” triplet, the distribution of soils in the new textural triangle spreads. While there is still a high concentration of soils with more than 85 % of the coarse fraction, where coarse 3 includes very coarse sand, coarse sand a medium sand, now those soils spread fully from 10 to 100 % of the intermediate-2 fraction, where intermediate-2 contains fine and very fine sand. On the USDA textural triangle, most of the soils are clustered in the subtriangle limited by the lines “more than 70 % sand” and “less than 20 % silt”. This new textural triangle allows for a finer look into the sand fraction, revealing the distribution of soils within the USDA sandy textural classes. This finer look might prove itself useful to study physical properties of these soils that are mainly related to the type and amount of sand in them.
Table 1 shows the Ksat statistics for the soils in the study. A total of 19 420 soils were used in this study, from which 299 (1.53 %) had to be rejected due to missing values. The textural class sand comprises the 63.1 % of all the soils, followed by sandy loam (11.1 %) and sandy clay loam (10.48 %). Five textural classes were poorly represented, with percentages less than 1 % of the total soils. The Ksat values varied between 0.0005 and 841 cm h−1, 22.57 being the mean value.
3.2 Regression in binned data: IE as a predictor of Ksat and lnKsat
Linear regressions for lnKsat were done to find out the predictive power of the proposed parameter, (IE,triplet), with the 15 possible different triplets that could be archived by grouping the available textural data. Table 2 shows the computed R2 and RMSE values for the linear regressions using 10 interval bins.
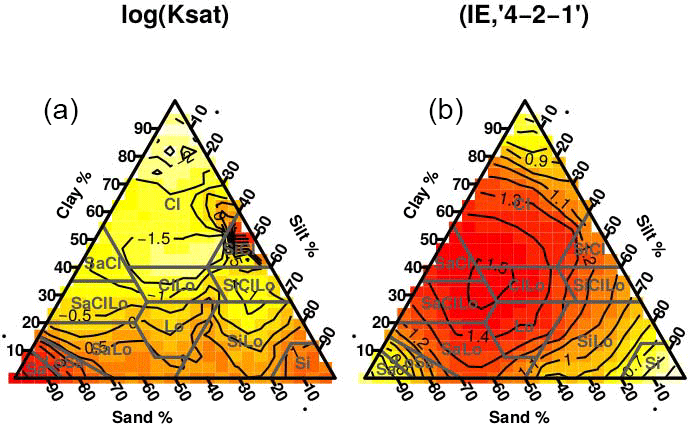
Figure 4Ternary representations for lnKsat and (IE,“4-2-1”) represented in the USDA textural triangle.
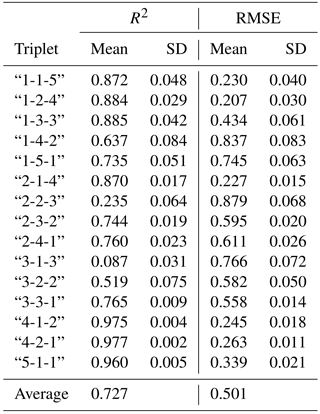
The best triplet in terms of highest mean R2 value was “4-2-1”, with a mean of 0.977 and a standard deviation of 0.002, but the lowest mean RMSE (ln (cm h−1)) value (mean = 0.207, SD = 0.030) was attained with the “1-2-4” triplet. Figure 4 shows a ternary representation of the lnKsat values of the soils of the study on the textural triangle compared to a ternary representation of the IE values of the same soils computed using the “4-2-1” triplet. There is a high visual similarity between these two images, with high lnKsat value zones, near the lower corners (sandy and silty soils) that correspond to low (IE,“4-2-1”) values. The lnKsat values tend to decrease towards the centre of the triangle. However, the (IE,“4-2-1”) values tend to increase around this point.
The standard triplet (“5-1-1”) yielded, for the lnKsat regression, the R2 value with this triplet had a mean of 0.960 and a standard deviation of 0.005; the RMSE mean value was 0.339 with a standard deviation of 0.021. The average of the R2 mean values of the regressions with all possible triplets for lnKsat was 0.727.
Table 2Computed mean and standard deviation (SD) for R2 and RMSE (ln (cm h−1)) values using the bootstrap method for the binned lineal regression of lnKsat against all possible (IE,triplet).
3.3 Predictive power of IE among the USDA textural classes
In this section we show how IE works differently among textural classes: using different triplets we can find that the textural classes are predicted differently; what works for some is for others counterproductive.
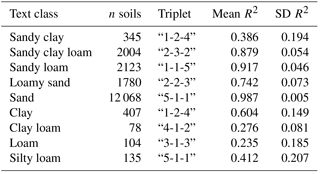
Table 3 shows the best triplet, chosen in terms of the highest mean R2 value of all the possible regressions, for each textural class that had N>50. In the table are shown the mean and standard deviation for R2, of the 1000 bootstrap samples for lnKsat linear regressions. The best R2 values were obtained for the regression of the sand textural class against (IE,“5-1-1”), i.e. the IE computed with the standard “5-1-1” clay–silt–sand USDA triplet. The mean value was equal to R2=0.987 for all the regressions. A possible explanation for this triplet being the best among all the other possible triplets, is that sandy soils are the ones that contain percentages of the sand fraction higher than 70 %, so their distribution is highly heterogeneous. Minor fractions are now silt and clay, and the information about these two fractions could be very important for the hydraulic properties of the soil; thus, the (IE,“5-1-1”) triplet yielded the best regression result. One might think that, with such a high concentration of sand particles, it is now silt and clay fractions that made the difference in the packing properties, and thus in the saturated hydraulic conductivity values. The high value of R2 indicates that the relation is very strong in this case.
Table 3Summary of triplets for lnKsat with highest R2 mean values for regressions using 10 interval binnings. Both the mean value and the standard deviation of R2 are shown.
Almost all sandy textural classes had the highest regression coefficients.
Table 3 suggested grouping the
textural classes into two super-classes: SC1, comprising the textures
sandy, sandy clay loam, sandy loam, and loamy sand, and SC2, with
sandy clay, clay, clay loam, loam, and silty loam. Soils in SC1 are
mostly sandy soils, with the exception of the sandy clay textural class which
is within the SC2 soils which are mostly clayey and loamy soils.
The lowest mean R2 value for the logKsat regressions in the
SC1 superclass was 0.742 and the highest one for the SC2
class was 0.604. Total number of soils in SC1 was 17 975
(94.06 % of total soils in the database). SC2 contained 1069
soils (5.59 % of total). Tables 4 and
5 show the R2 and RMSE values for all
regressions for the soils in SC1 and SC2.
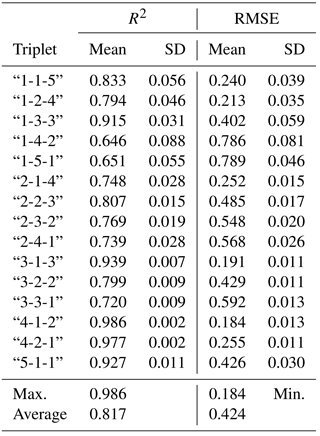
For the SC1 we observed that the best regression (R2=0.986,
RMSE = 0.184) against lnKsat was reached with (IE,“4-1-2”). This
triplet creates a division among the sand fractions, grouping together very
coarse, coarse, medium, and fine, and leaving the very fine sand alone.
Finally, the fine fractions contains only the silt and clays. Comparing this
to the sandy textural class results, where the best triplet was “5-1-1”, we
observed that now more information from the sandy fraction was required to
infer hydraulic properties. The area that the SC1 soils cover in the
textural triangle and the hydraulic property variation of these soils can be
related with a heterogeneity metric associated to triplets that distinguish
well among the predominant fraction in that area of the triangle, i.e. sand.
Table 4R2 and RMSE (ln (cm h−1)) values for linear regressions
of IE vs. lnKsat using the 15 different triplets for the
SC1 selection.
For the SC2, the best triplet was “1-1-5”, with R2=0.623. Regression
results were worse than for SC1, but this might be just provoked by
the nature of SC2 itself: these are soils with less sand and thus
higher content in clays and aggregating particles. The packing – and
consequently the Ksat – of these soils is not just mainly affected by the
PSD, but also by aggregation, which cannot be accounted for in the IE
value, regardless of the triplet used.
Furthermore, the best triplet, “1-1-5”, also pointed in this direction: the fine fraction contains medium sand, fine sand, very fine sand, silt, and sand particles, while the intermediate fraction contains only the coarse sand, leaving the coarse fraction with the very coarse sand, thus giving more importance to the possibly aggregating particles than a triplet, like “1-4-2”, which had R2 values equal to and 0.033.
Table 5R2 and RMSE (ln (cm h−1)) values for linear regressions
of IE vs. lnKsat using the 15 different triplets for the
SC2 class.
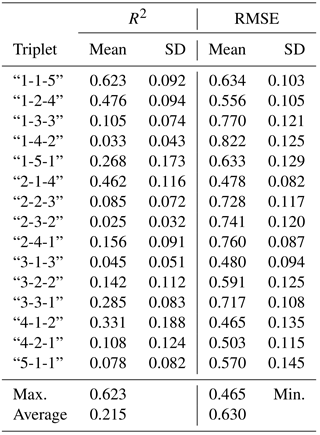
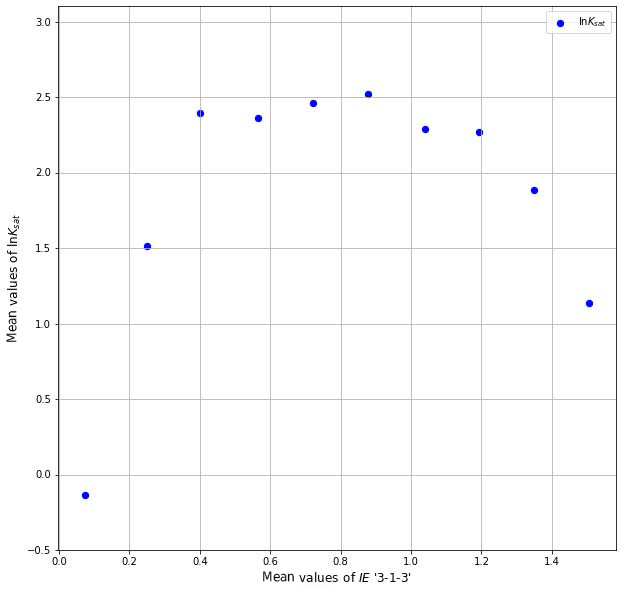
Figure 5lnKsat values against IE calculated with the “3-1-3” triplet in 10 interval binnings.
3.4 Triplets and scaling break
In the regressions made with all the soils, the behaviour of (IE,“3-1-3”) was noteworthy. The average value of all triplets was 0.727, but (IE,“3-1-3”) gave an exceptionally low R2 value of 0.087, the next lowest being (IE,“2-2-3”), with a mean R2 value of 0.235.
The “3-2-3” triplet groups fine sand with silt and clay, and coarse and very coarse sand with medium sand. Kravchenko and Zhang (1998), Wu et al. (1993), and Tyler and Wheatcraft (1992) reported the break in scaling where the power law scaling of soil texture occurred in the size range of fine sand. The particle size distribution scales in a different way in two different regions of the size intervals, and the change of scaling is produced around the fine sands. The triplet “3-1-3” separates these two regions, maybe bringing forth this scaling break effect. Figure 5. shows how the relationship between lnKsat and (IE,“3-1-3”) could be non-linear, maybe due to the absence of global self-similarity showed in the scaling break.
However, it is also noteworthy that regressions against
(IE,“3-1-3”) were actually quite good (R2=0.939) in the SC1,
while in the SC2 they were moderate (R2=0.045).
When all the soils are considered together, then (IE,“3-1-3”) might fail, due to the scaling break, but when we restrict the study to a certain part of the textural triangle, that effect might diminish to a point where this triplet is even useful to predict some texturally derived properties, or maybe the scaling break effect is also restricted to some textural classes and should be further investigated.
As results show, IE is not a powerful lnKsat predictor by itself, but can be when it is combined with an input triplet. By changing the triplet, we may focus on certain physical aspects of the soils, but it is also important to keep in mind that this might not work statistically for random groupings of soils that belong to different textures.
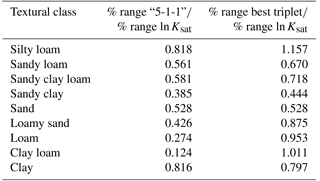
Table 6Comparison of parametrizing power of (IE,“5-1-1”) against IE calculated with other triplets. The ranges of variation of IE calculated with the different triplets are compared to the ranges of variation of Ksat for the textural classes. The triplets are chosen to be the ones that gave the highest R2 values at the linear regressions for Ksat.
3.5 IE variation as a spatial function in the textural triangle
Table 6 shows, for each textural class, the ratio of the percentage of (IE,“5-1-1”) against the percentage of the lnKsat range. The same ratio was also calculated using IE for the triplet that gave the best R2 value in the linear regression against lnKsat. These values can be thought of as how much range of (IE,triplet) can be used to explain a certain variation of lnKsat inside each textural class, i.e. as how much parametrizing power is available to the IE. In all the textural classes the parametrizing power of the alternative triplet was higher than the one using the usual clay–silt–sand triplet. For the sand textural class, the triplet which gave the best R2 regression was “5-1-1”, and thus the results are the same; the average value of the parametrizing power for the usual triplet was 0.50, while when we change the triplet we obtain 0.79. This shows how, by considering different triplets, combined with IE, a better description or parametrization of lnKsat can be reached.
3.6 Final comments
Textural heterogeneity is a crucial factor affecting soil Ksat, but it acts alongside many other ecological factors, such as animal activity, root exudates, soil aggregation, etc. In this work we showed that a proper representation of textural heterogeneity, by IE, allows one to (1) demonstrate its effect on lnKsat by binning samples based on the textural heterogeneity and (2) to statistically parametrize this effect for some textures.
This work has limitations, in particular the limited available texture data of only seven fractions in the database. The boundaries between coarse, intermediate, and fine fractions can be moved with data from continuous measurements of texture in the fine sand–silt–clay range of particle sized. This may bring the improvements in mean bin lnKsat estimates for non-sandy soils that could not be achieved in this work.
Although globally the IE computed from different triplets shows a potential to reflect the effect of soil texture on the lnKsat values, the different relationship between the IE and the lnKsat depending on the triplet used might have different possible explanations. While the IE ∕ lnKsat relationship is found to be satisfactory in some textural classes, results seem to indicate that the IE parameter cannot reflect with the same efficiency the lnKsat values in other classes predominating fine particles, in which other processes such as aggregation or weathering cannot be elucidated by the single textural data input.
Overall, the heterogeneity parameter, IE, combined with the different triplet information, appears to be a strong candidate as an input for the development of new PTFs to predict lnKsat and probably other soil physical parameters that are strongly dependent on soil particle size distribution.
The PSD coarse, intermediate, and fine fractions in soil textural triplets can be redefined from standard “sand–silt–clay” to other fraction size ranges. The textural heterogeneity parameters obtained for some of the new triplets correlate with soil saturated hydraulic conductivity averaged by ranges of the heterogeneity parameters. This approach allows one to quantify the effect of the textural heterogeneity of saturated hydraulic conductivity of soils. Given that size boundaries of sand, silt, and clay fractions have not originally been established for the purposes of prediction of soil hydraulic conductivity, it may be beneficial to look for other size-based subdivisions of particle size distributions that, when used along with other soil properties such as bulk density and organic matter content, may provide better predictions of the saturated hydraulic conductivity.
The data we have used come from the reference Pachepsky and Park (2015). Requests for the data can be directed to the authors of that paper.
The authors declare that they have no conflict of interest.
This research work was funded by Spain's Plan Nacional de Investigación
Científica, Desarrollo e Innovación Tecnológica (I+D+I), under ref.
AGL2015-69697-P.
Edited by: Roberto Greco
Reviewed by: Robson André Armindo and one anonymous referee
Alyamani, M. and Sen, Z.: Determination of Hydraulic Conductivity from Complete Grain-Size Distribution Curves, Groundwater, 31, 551–555, https://doi.org/10.1111/j.1745-6584.1993.tb00587.x, 1993. a
Arya, L. and Paris, J.: A physicoempirical model to predict soil moisture characteristics from particle-size distribution and bulk density data, Soil Sci. Soc. Am. J., 45, 1023–1030, https://doi.org/10.2136/sssaj1981.03615995004500060004x, 1980. a
Assouline, S. and Rouault, Y.: Modeling the relationships between particle and pore size distributions in multicomponent sphere packs: Application to the water retention curve, Colloid. Surface. A, 127, 201–210, https://doi.org/10.1016/S0927-7757(97)00144-1, 1997. a
Boadu, F.: Hydraulic Conductivity of Soils from Grain-Size Distribution: New Models, J. Geotech. Geoenviron., 126, 739-746, https://doi.org/10.1061/(ASCE)1090-0241(2000)126:8(739), 2000. a
Chapuis, R.: Predicting the saturated hydraulic conductivity of sand and gravel using effective diameter and void ratio, Can. Geotech. J., 41, 787–795, https://doi.org/10.1139/t04-022, 2004. a
Chapuis, R., Weber, S., and Duhaime, F.: Permeability test results with packed spheres and non-plastic soils, Geotech. Test. J., 38, 950–964, https://doi.org/10.1520/GTJ20140124, 2015. a
Efron, B. and Tibshirani, R.: Improved prediction of unsaturated hydraulic conductivity with the Mualem-van Genuchten model, Monographs on statistics and applied probability, Champan and Hall, New York, USA, 1993. a
Gupta, S. and Larson, W.: A Model for predicting Packing density of soils using particle-size distribution, Soil Sci. Soc. Am. J., 43, 758–764, https://doi.org/10.2136/sssaj1979.03615995004300040028x, 1979. a
Hastie, T., Tibshirani, R., and Friedman, J.: The Elements of Statistical Learning, Springer, New York, USA, 2003. a
Hillel, D.: Fundamentals of Soil Physics, Academic Press, Inc., New York, USA, 1980. a
Horn, R., Taubner, H., Wuttke, M., and Baumgartl, T.: Soil physical properties related to soil structure, Soil Till. Res., 30, 187–216, 1994. a
Jorda, H., Bechtold, M., Jarvis, N., and Koestel, J.: Using boosted regression trees to explore key factors controlling saturated and near-saturated hydraulic conductivity, Eur. J. Soil Sci., 66, 744–756, https://doi.org/10.1111/ejss.12249, 2015. a
Khinchin, A.: Mathematical Foundation of Information Theory, Dover Publications, Inc., New York, USA, 1957. a
Klute, A. and Dirksen, C.: Hydraulic conductivity and diffusivity: laboratory methods, in: Methods of Soil Analysis. Part 1. Physical and Mineralogical Methods, edited by: Klute, A., 2nd edition, Agron. Monogr., 9, ASA, Madison, WI, USA, 678–734, 1986. a
Kravchenko, A. and Zhang, R.: Estimating the soil water retention from particle-size distributions: a fractal approach, Soil Sci., 163, 171–179, https://doi.org/10.1097/00010694-199803000-00001, 1998. a
Martín, M., Rey, J., and Taguas, F.: An entropy-based parametrization of soil textures via fractal modelling of particle-size soil distribution, P. R. Soc. London, 457, 937–947, https://doi.org/10.1098/rspa.2000.0699, 2001. a
Martín, M., Pachepsky, Y., Rey, J., and Taguas, F.: Balanced entropy index for soil water retention estimation, Soil Sci., 170, 759–766, https://doi.org/10.1097/01.ss.0000190507.10804.47, 2005. a
Martín, M., Reyes, M., and Taguas, F.: Estimating soil bulk density with information metrics of soil texture, Geoderma, 287, 66–70, https://doi.org/10.1016/j.geoderma.2016.09.008, 2017. a
Martín, M. Á., Pachepsky, Y. A., García-Gutiérrez, C., and Reyes, M.: On soil textural classifications and soil-texture-based estimations, Solid Earth, 9, 159–165, https://doi.org/10.5194/se-9-159-2018, 2018. a, b
Odong, J.: Evaluation of empirical formulae for determination of hydraulic conductivity based on grain-size analysis, J. Am. Sci., 3, 54–60, 2007. a
Pachepsky, Y. and Park, Y.: Saturated Hydraulic Conductivity of US Soils Grouped According to Textural Class and Bulk Density, Soil Sci. Soc. Am. J., 79, 1094–1100, https://doi.org/10.2136/sssaj2015.02.0067, 2015. a, b
Pachepsky, Y. and Rawls, W. (Eds.): Development of Pedotransfer Functions in Soil Hydrology, vol. 30, Elsevier Science, Amsterdam, the Netherlands, 2004. a
Rawls, W. J., Gimenez, D., and Grossman, R.: Use of soil texture, bulk density, and slope of the water retention curve to predict saturated hydraulic conductivity, T. ASAE, 41, 983, https://doi.org/10.13031/2013.17270, 1998. a
Schaap, M. and Leij, F.: Improved prediction of unsaturated hydraulic conductivity with the Mualem-van Genuchten model, Soil Sci. Soc. Am. J., 64, 843–851, https://doi.org/10.2136/sssaj2000.643843x, 2000. a
Shannon, C.: A mathematical theory of communication, I. Bell Syst. Technol. J., 27, 379–423, 1948. a, b
Tyler, S. and Wheatcraft, S.: Fractal Scaling of Soil Particle-Size Distributions: Analysis and Limitations, Soil Sci. Soc. Am. J., 56, 362–369, https://doi.org/10.2136/sssaj1992.03615995005600020005x, 1992. a
Wu, Q., Borkovec, M., and Sticher, H.: On particle-size distributions in soils, Soil Sci. Soc. Amer. J., 57, 883–890, https://doi.org/10.2136/sssaj1993.03615995005700040001x, 1993. a