the Creative Commons Attribution 4.0 License.
the Creative Commons Attribution 4.0 License.
 | 23 Aug 2018
Precipitation characteristics and associated weather conditions on the eastern slopes of the Canadian Rockies during March–April 2015
Julie M. Thériault
Ida Hung
Paul Vaquer
Ronald E. Stewart
John W. Pomeroy
Precipitation events that bring rain and snow to the Banff–Calgary area of Alberta are a critical aspect of the region's water cycle and can lead to major flooding events such as the June 2013 event that was the second most costly natural disaster in Canadian history. Because no special atmospheric-oriented observations of these events have been made, a field experiment was conducted in March and April 2015 in Kananaskis, Alberta, to begin to fill this gap. The goal was to characterize and better understand the formation of the precipitation at the surface during spring 2015 at a specific location in the Kananaskis Valley. Within the experiment, detailed measurements of precipitation and weather conditions were obtained, a vertically pointing Doppler radar was deployed and weather balloons were released. Although 17 precipitation events occurred, this period was associated with much less precipitation than normal (−35 %) and above-normal temperatures (2.5 ∘C). Of the 133 h of observed precipitation, solid precipitation occurred 71 % of the time, mixed precipitation occurred 9 % and rain occurred 20 %. An analysis of 17 504 precipitation particles from 1181 images showed that a wide variety of crystals and aggregates occurred and approximately 63 % showed signs of riming. This was largely independent of whether flows aloft were upslope (easterly) or downslope (westerly). In the often sub-saturated surface conditions, hydrometeors containing ice occurred at temperatures as high as 9 ∘C. Radar structures aloft were highly variable with reflectivity sometimes >30 dBZe and Doppler velocity up to −1 m s−1, which indicates upward motion of particles within ascending air masses. Precipitation was formed in this region within cloud fields sometimes having variable structures and within which supercooled water at least sometimes existed to produce accreted particles massive enough to reach the surface through the relatively dry sub-cloud region.


Western Canada is characterized by complex and rugged terrain where precipitation and associated weather conditions are highly variable (Stoelinga et al., 2013). This includes the eastern slopes of the Canadian Rockies, which have a continental climate subject to extremes that fluctuate from severe drought (Hanesiak et al., 2011) to extensive flooding (Pomeroy et al., 2016). Westerly flow from the Pacific Ocean brings heavy precipitation to the west coast of British Columbia while producing drier and warmer conditions on these eastern slopes. During the spring, large-scale weather patterns are favourable for easterly, upslope winds that sometimes lead to extreme precipitation events. An example is the flooding in June 2013, which was one of the most catastrophic events in Canadian history (Kochtubajda et al., 2016; Liu et al., 2016; Pomeroy et al., 2016). Previous floods such as in 2005 (Flesch and Reuter, 2011; Shook, 2016) rivalled the 2013 event in terms of impact.
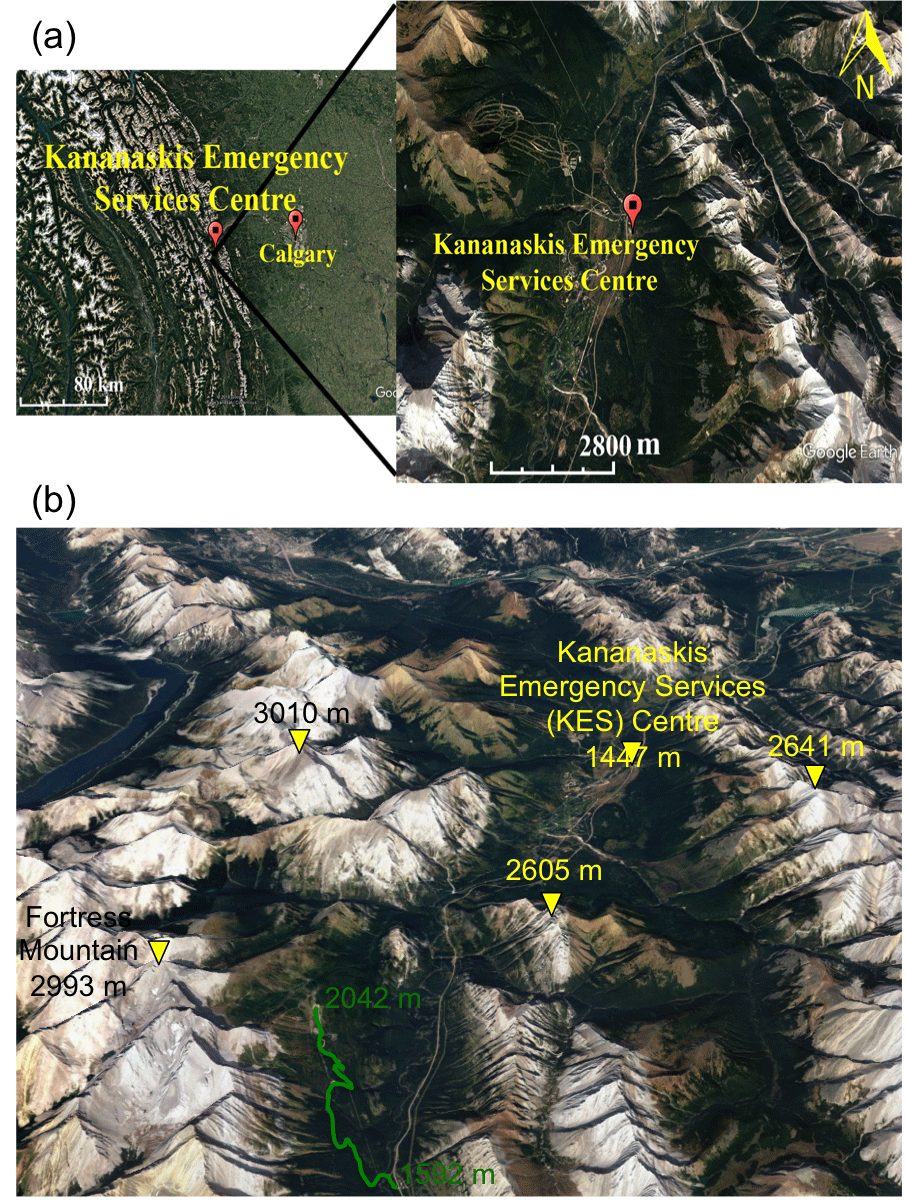
Figure 1(a) The Kananaskis Emergency Services (KES) Centre site located in the lee of the Canadian Rockies at 50.9∘ latitude, −115.1∘ longitude and (b) is surrounded by topography up to 3010 m a.s.l. (Google Earth, retrieved on 16 January 2017). (c) is the local topography where the field experiment was held. Fortress Mountain is located southwest of Kananaskis and the route taken to measure temperature and precipitation using the car-sonde technique (Appendix C) is indicated in green. The elevations at the base and top of the accessible road are indicated (retrieved on 30 May 2018).
The type of precipitation reaching the surface on the eastern slopes of the Canadian Rockies varies greatly throughout the cold seasons (Harder and Pomeroy, 2013). Based on the climatology in Calgary, Alberta (located 100 km east of Kananaskis, Fig. 1), both rain and snow can occur at the surface between September and May but the wettest month is June (Liu et al., 2016). In contrast, even if rain and snow occur in Banff (located ∼60 km northwest of Kananaskis) at a similar time of the year, the maximum amount of precipitation varies from year to year. For example, Calgary receives on average 79.8 mm in June according to the 1960–2013 climatology, whereas Banff receives on average 61.7 mm for the same month. Rain–snow transitions at lower elevations generally occur in March and April. Snow water equivalent (SWE) at higher elevation reaches a maximum in May and lowers rapidly in June and early July (Pomeroy et al., 2016). For example, catastrophic events such as the 2013 Alberta flooding arose in part because most of the precipitation fell as rain on mountainsides and this acted to melt the existing snowpack and accentuate runoff.
The evolution of the snowpack depends strongly on the air temperature as well as the amount and types of precipitation reaching the surface. For the period 1950–2012, winter mean temperatures have increased by 3.9 ∘C (DeBeer et al., 2016) with very little change in precipitation in the eastern slopes of the Canadian Rockies. With the changing climate, it is critical that precipitation be well understood, including its phase, in this area because of its impact in the regional hydrological cycle. From 2001 to 2005, a field experiment focusing on the changes in precipitation amounts and elevation along a transect perpendicular to the foothills was conducted, the Foothills Orographic Precipitation Experiment (Smith, 2008). This experiment defined the precipitation–elevation relationship using surface meteorological stations.
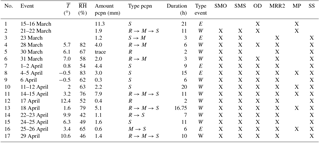
Table 1A summary of the events and instrumentation over the March–April 2015 observing period at the KES site. For each event, the mean temperature (T) and relative humidity (RH) are given. The amount and types of precipitation (amount pcpn) at the surface were rain (R), mixed (M) and/or snow (S). The observed type was at KES and the amounts shown are at Hay Meadow (HM, Marmot Creek). The amount of precipitation was adjusted using Smith (2007). A trace is when accumulated precipitation is <0.2 mm. The direction of the flow field aloft (type event), which was either an easterly flow event (E) or a westerly event (W), is also indicated. An X indicates when each instrument was operating. These are the surface manual observations (SMO), the surface meteorological station (SMS), the optical disdrometer (OD), the Micro Rain Radar (MRR2), the microphotography setup (MP) and the sounding system (SS).
* Data retrieved from Marmot Creek, Hay Meadow station data.
There is a nonetheless a need to improve our understanding of the atmospheric conditions leading to precipitation as well as the characteristics of the precipitation itself in this area. To address this, a field experiment was carried out in March–April 2015 in the Kananaskis Valley (Fig. 1) to obtain critical information such as particle characteristics at the surface as well as atmospheric conditions leading to precipitation events. This time period was chosen because of rain and snow occurrences in the area. By utilizing this information, this study aims to better understand the precipitation characteristics and associated atmospheric driving mechanisms on the eastern slopes of the Canadian Rockies during the spring. Specific scientific issues included placing the observing period into a longer-term context, quantifying the temporal variability of precipitation (and its detailed features) at the surface in relation to conditions aloft, and understanding the roles of accretion and sublimation on the precipitation reaching the surface.
The paper is organized as follows. Section 2 describes the field project and the instrumentation deployed. Section 3 describes the events documented and specific case studies. Section 4 focuses on the characteristics of the precipitation and associated atmospheric conditions, and the precipitation processes are presented in Sect. 5. Section 6 places the results into perspective by comparing its findings with other studies across Canada. Section 7 provides the conclusions.
Precipitation events in the Banff–Calgary area can bring rain, snow or both to the area but no atmospheric-oriented special observations (beyond those made with operational networks) have been carried out until the March–April 2015 experiment. A summary of the precipitation events and operating instruments is provided in Table 1.
Multiple weather instruments were deployed in the Kananaskis Valley to study the precipitation characteristics and associated weather conditions. The exact location of the measurements is the Kananaskis Emergency Services Centre (KES) site (Fig. 1a) at an elevation of 1445 m and it is surrounded by topography up to 3010 m m.s.l. (Fig. 1b).
To characterize the precipitation at the surface, two instruments were deployed as well as a microphotography system. A Geonor weighing precipitation gauge, equipped with three sensors and placed in a single Alter shield, was used to measure the amount of water equivalent precipitation. Precipitation particles, sizes and fall speeds were measured using an OTT Parsivel optical disdrometer (Battaglia et al., 2010). Detailed photographs and observations of solid precipitation were also made. The method closely follows that described in Gibson and Stewart (2007) and used in other studies such as Henson et al. (2011) and Thériault et al. (2014). The microphotography utilized a 10.2 megapixel Nikon D80 digital SLR camera equipped with a 60 mm macro lens set at its shortest focus and a mounted portable flash. The snowflakes were collected on a black velvet-covered pad that was placed outside for periods that ranged from 10 s up to several minutes, based on the precipitation intensity. The pad was then taken into a ventilated tent to be photographed. Approximately nine images of the collection were taken by scanning each collection pad in a systematic manner.
Manual weather observations were also made to complement the microphotography and to compare with other automatic measurements. They were recorded at 10 min intervals and included precipitation type and intensity, cloud cover, temperature, relative humidity, wind speed, wind direction and surface pressure. Furthermore, comments regarding conditions at the site and particles observed on the vehicle or surface prior to melting were also made. Several events contained precipitation particles that began to melt on contact with the velvet pad or the ground surface and microphotography was not feasible in these situations. Manual observations were recorded in these instances to characterize particle sizes and degree of riming.
Two weather stations (41 m apart) were utilized. Environment and Climate Change Canada (ECCC) provided one and the other was the on-site Kananaskis Auto Boundary station (KBA) operated by Alberta Agriculture and Forestry (AAF). The ECCC station recorded 5 min data from 21:40 UTC 17 March 2015 to 17:05 UTC 23 March 2015 and the sampling frequency was increased to 1 min from 20:57 UTC 24 March 2015 to 16:21 UTC 30 April. The KBA station has been operating since 2005 (relative humidity since 2012) and records data at the top of each hour based on the average from the previous 59 min. Precipitation amounts are only available during the summer season. Because the Geonor precipitation gauge was not operational throughout the project, the precipitation accumulation at Hay Meadow located in Marmot Creek was used. This station is located in Marmot Creek Research Basin (Pomeroy et al., 2012), 2.1 km north from our site. The data were adjusted using Smith (2007). However, because the particles reported were rimed (Sect. 3) during low wind speed conditions we assumed that the wind effect is probably low during the documented events (Thériault et al., 2012).
Both stations (KBA and ECCC) measured a standard suite of state variables (temperature, relative humidity, wind speed, wind direction and surface pressure). Wind speed and direction sensors were measured at 3 m a.g.l. (ECCC) and 10 m a.g.l. (KBA) and temperature and humidity were measured at 0.9 m a.g.l. (ECCC) and 2 m a.g.l. (KBA).
The vertical structure of the atmosphere over KES was characterized using a vertically pointing Micro Rain Radar (MRR2). This instrument measures profiles of radar reflectivity and Doppler velocity (Klugmann et al., 1996). The vertical resolution of the MRR2 was 200 m and information up to 6200 m a.g.l. is available.
The vertical temperature and moisture profiles were measured at 3 h intervals during each event by launching radiosondes. A total of 38 Vaisala RS41 radiosondes were launched although only eight were released while microphotography observations were being made. Note that the wind-determining capability did not work properly so no wind information is available.
3.1 Overview of weather events
The March–April 2015 experimental period was anomalous in regards to temperature and precipitation. Temperature data obtained from the KBA station indicated an average of 2.6 ∘C (from March to April 2015), which was 2.5 ∘C warmer than average (0.1 ∘C from March–April 2006 to March–April 2016). The highest temperature recorded during the field campaign was 23.7 ∘C on 20:00 UTC 28 April 2015 and the lowest temperature was −11.8 ∘C on 13:00 UTC 17 March 2015. Precipitation collected at the Hay Meadow station during the study period (68.9 mm from March to April 2015) was 35 % lower than the average (105.8 mm from March–April 2006 to March–April 2016). In contrast, the average relative humidity was 63 % (from March to April 2015), which is only 2 % lower than the average (65 % from March–April 2006 to March–April 2016).
As summarized in Table 1, 17 precipitation events of snow (6 events), rain (2 events) and mixed precipitation (9 events) were documented. Note that no correlation has been found between the timing of precipitation events and the diurnal cycle. Overall, 133 h of precipitation were observed and documented. This corresponds to 47.4 mm at Hay Meadow. Of these times, 71 % were solid precipitation, 9 % were mixed precipitation, and 20 % were rain. The relationships among the precipitation types observed as well as the temperature and relative humidity are shown in Fig. 2. Only precipitation associated with T>0 ∘C is shown to highlight the presence of snow at positive values and low values of relative humidity (>30 %). Those at high temperatures may be water coating when the temperature is >0 ∘C. There is a shift in the boundaries, in particular the one associated with solid, mixed and rain. It could be associated with the presence of denser particles, which would only melt completely at higher temperatures, compared to wet, non-accreted snow likely occurring in Japan.
The duration of each event varied and temperatures were often near or above 0 ∘C. The longest period of continuous precipitation was 21 h on 15–16 March 2015 and the shortest was 2 h on 17 April 2015. Temperatures were >0 ∘C for 68 % of the time when precipitation was observed. The warmest average temperature during an event of 12.4 ∘C occurred on 17 April 2015, and the coldest average event temperature of −0.5 ∘C occurred on 4–5 April 2015 as well as on 6 April 2015.
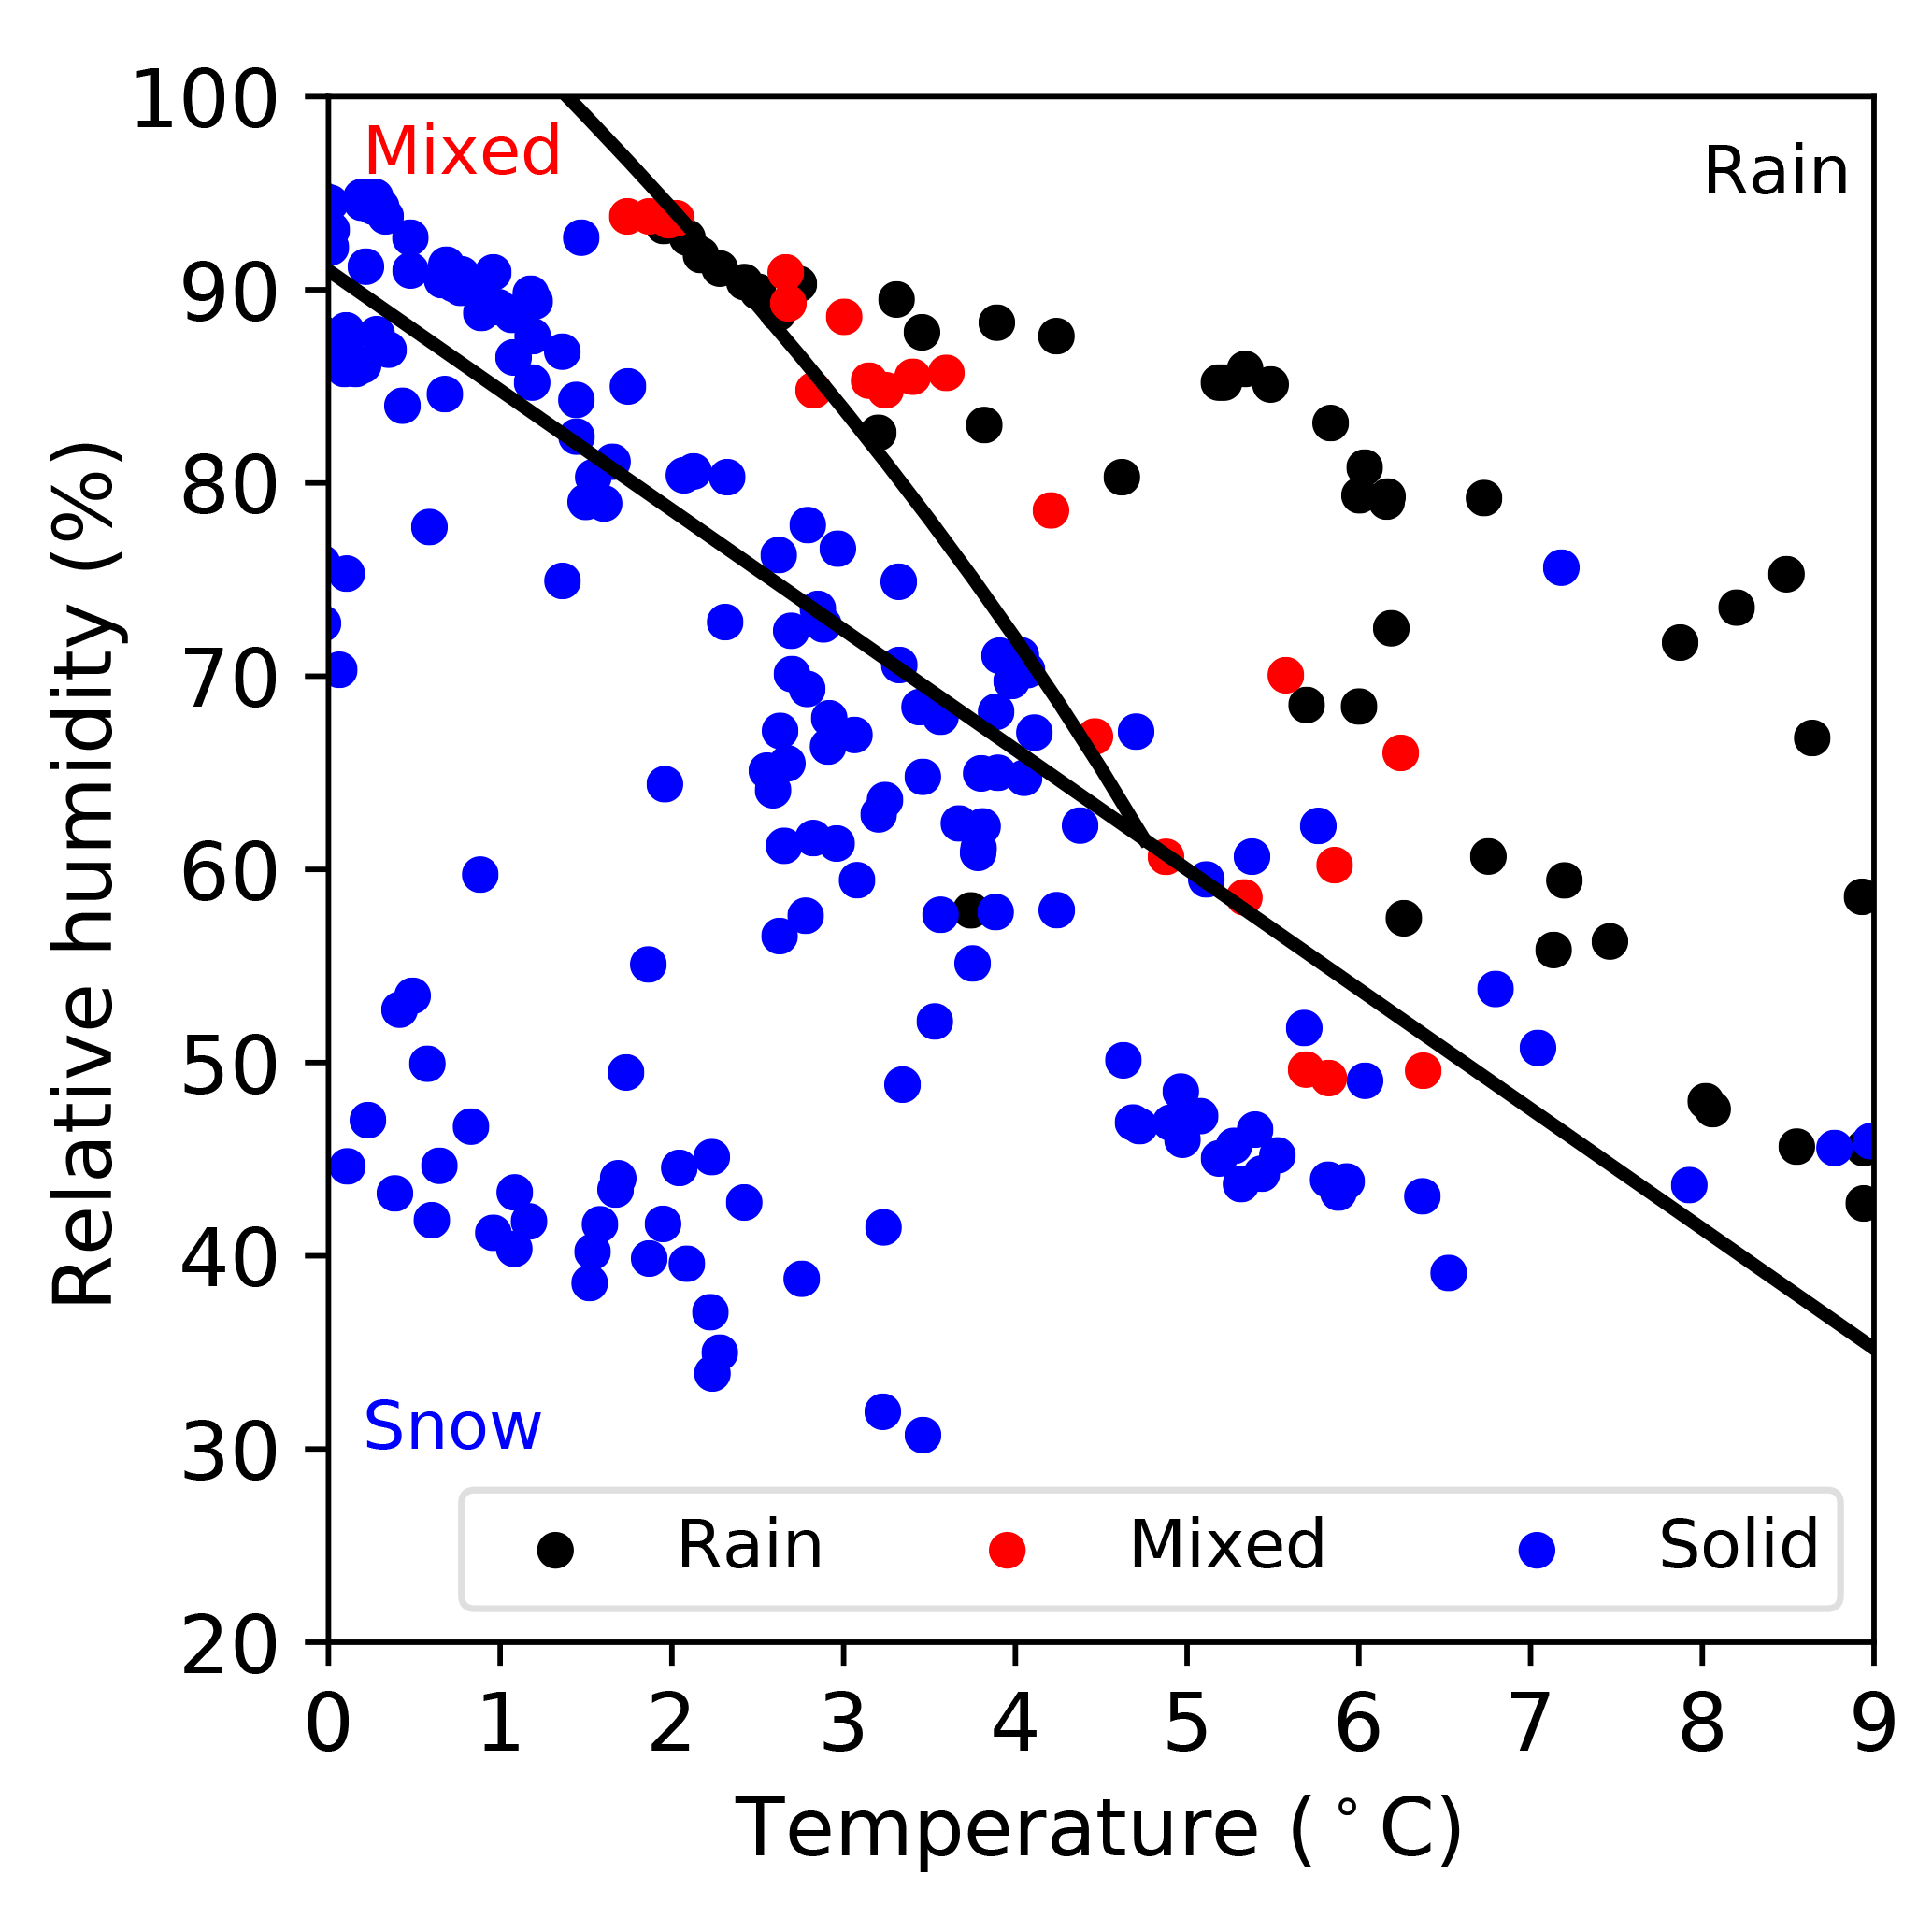
Figure 2The types of precipitation with respect to the temperature and relative humidity for all the events over the March–April 2015 period using the manual observations and the weather station. The background threshold lines are from Matsuo et al. (1981).
Precipitation in this region is generally formed through orographic lifting associated with an easterly flow over the lee side of the Canadian Rockies. This was, however, not always the case during March and April 2015. Most of the precipitation events (11/17) were associated with a westerly flow aloft (3 km a.s.l.) over the KES site. These were determined using the GEM-LAM (Global Environmental Multiscale–Limited Area Model) simulations at 2.5 km resolution (Milbrandt et al., 2016). Details on the methodology are given in Appendix A3 and Vaquer (2017).
3.2 Large-scale weather conditions
This section compares the synoptic-scale weather conditions that produced precipitation in the Kananaskis Valley during March and April 2015 based on flow field aloft. The case studies chosen occurred on 31 March 2015 for the westerly flow event and 4–5 April 2015 for the easterly flow one. An overview is given of the synoptic-scale features as well as the MRR2 and surface observations collected during these events.
The analyses at 250 hPa, 700 hPa and at sea level are shown in Fig. 3. These were chosen to show the large-scale geopotential heights at the top of the troposphere, near the top of the mountain barrier and at sea level. The analyses were used to identify the locations of upper-level trough, wind direction, moisture, and surface weather systems with respect to KES. The westerly flow events were generally associated with an upper-level trough located over British Columbia, which produced large-scale increasing cyclonic vorticity advection with height, favourable for upward motion in the vicinity of KES (Fig. 3a). The 700 hPa surface map (Fig. 3c) suggests westerly flow with localized high relative humidity (>90 %) near KES. The large-scale upper-level geopotential heights were supported by the presence of a surface low-pressure system over eastern Alberta (Fig. 3e). In contrast, the upper-level trough is located farther west for the easterly flow. This led to a relatively weak ridge near the border of northern Alberta (Fig. 3b), which produced subsidence, a high-pressure system and ridge at the surface over western Canada and a weak low-pressure system just south of the Canada–US border (Fig. 3f). Higher amounts of moisture (>90 %) are available along the eastern slopes of the Canadian Rockies near KES (Fig. 3d). These were the typical large-scale setups generally leading to westerly and easterly flow field events, respectively.
To illustrate the atmospheric conditions aloft during both westerly and easterly flow events, illustrative examples of atmospheric soundings during each event are shown in Fig. 4. The westerly flow events were generally associated with drier conditions near the surface (Fig. 4a) because of adiabatic heating associated with downslope flow. In contrast, this easterly flow event produced upslope conditions with adiabatic cooling, which led to near saturation conditions throughout the lower troposphere (<500 hPa, Fig. 4b).
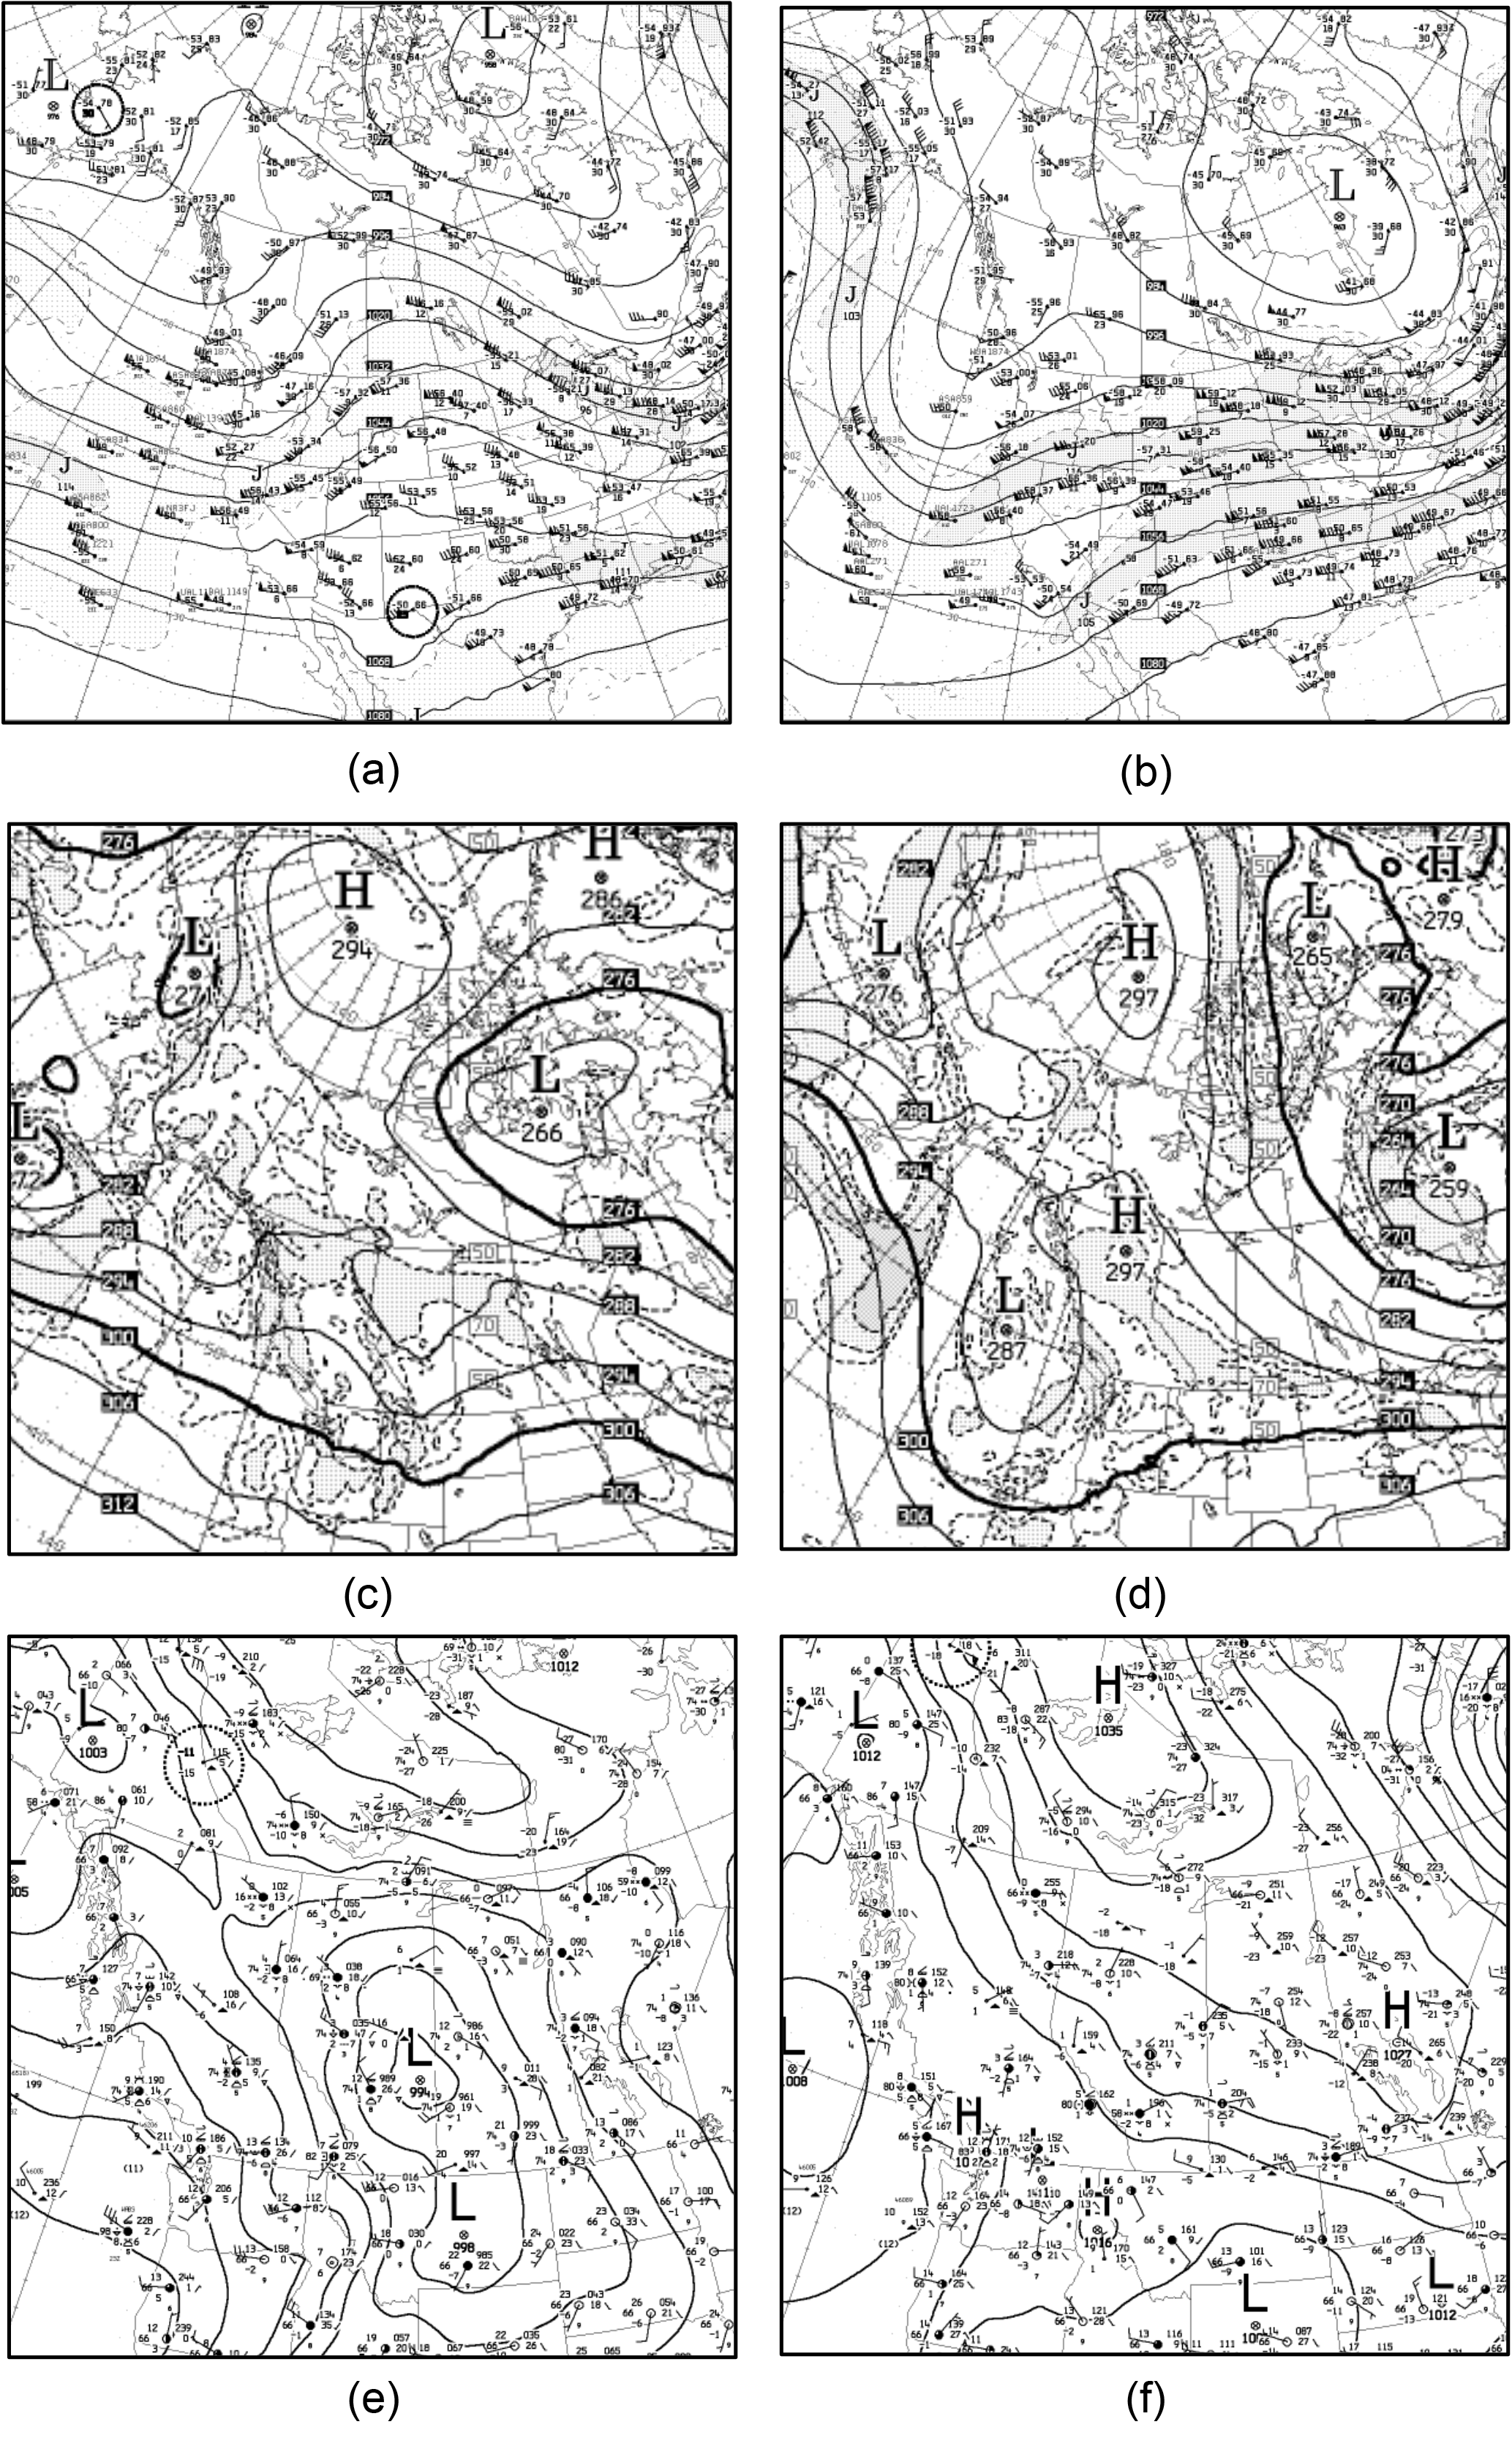
Figure 3(a) and (b) are the 250 hPa analyses of the geopotential heights and wind fields. (c) and (d) are the analysis at 700 hPa that includes relative humidity. The shaded area is relative humidity of >70 % and (e) and (f) are the sea-level pressure indicated by the location of the surface weather systems. (a), (c) and (e) are at 00:00 UTC 1 April 2015, which corresponds to a westerly flow event and (b), (d) and (f) are at 00:00 UTC 5 April 2015, which corresponds to a easterly flow event (sources: Environment and Climate Change Canada).
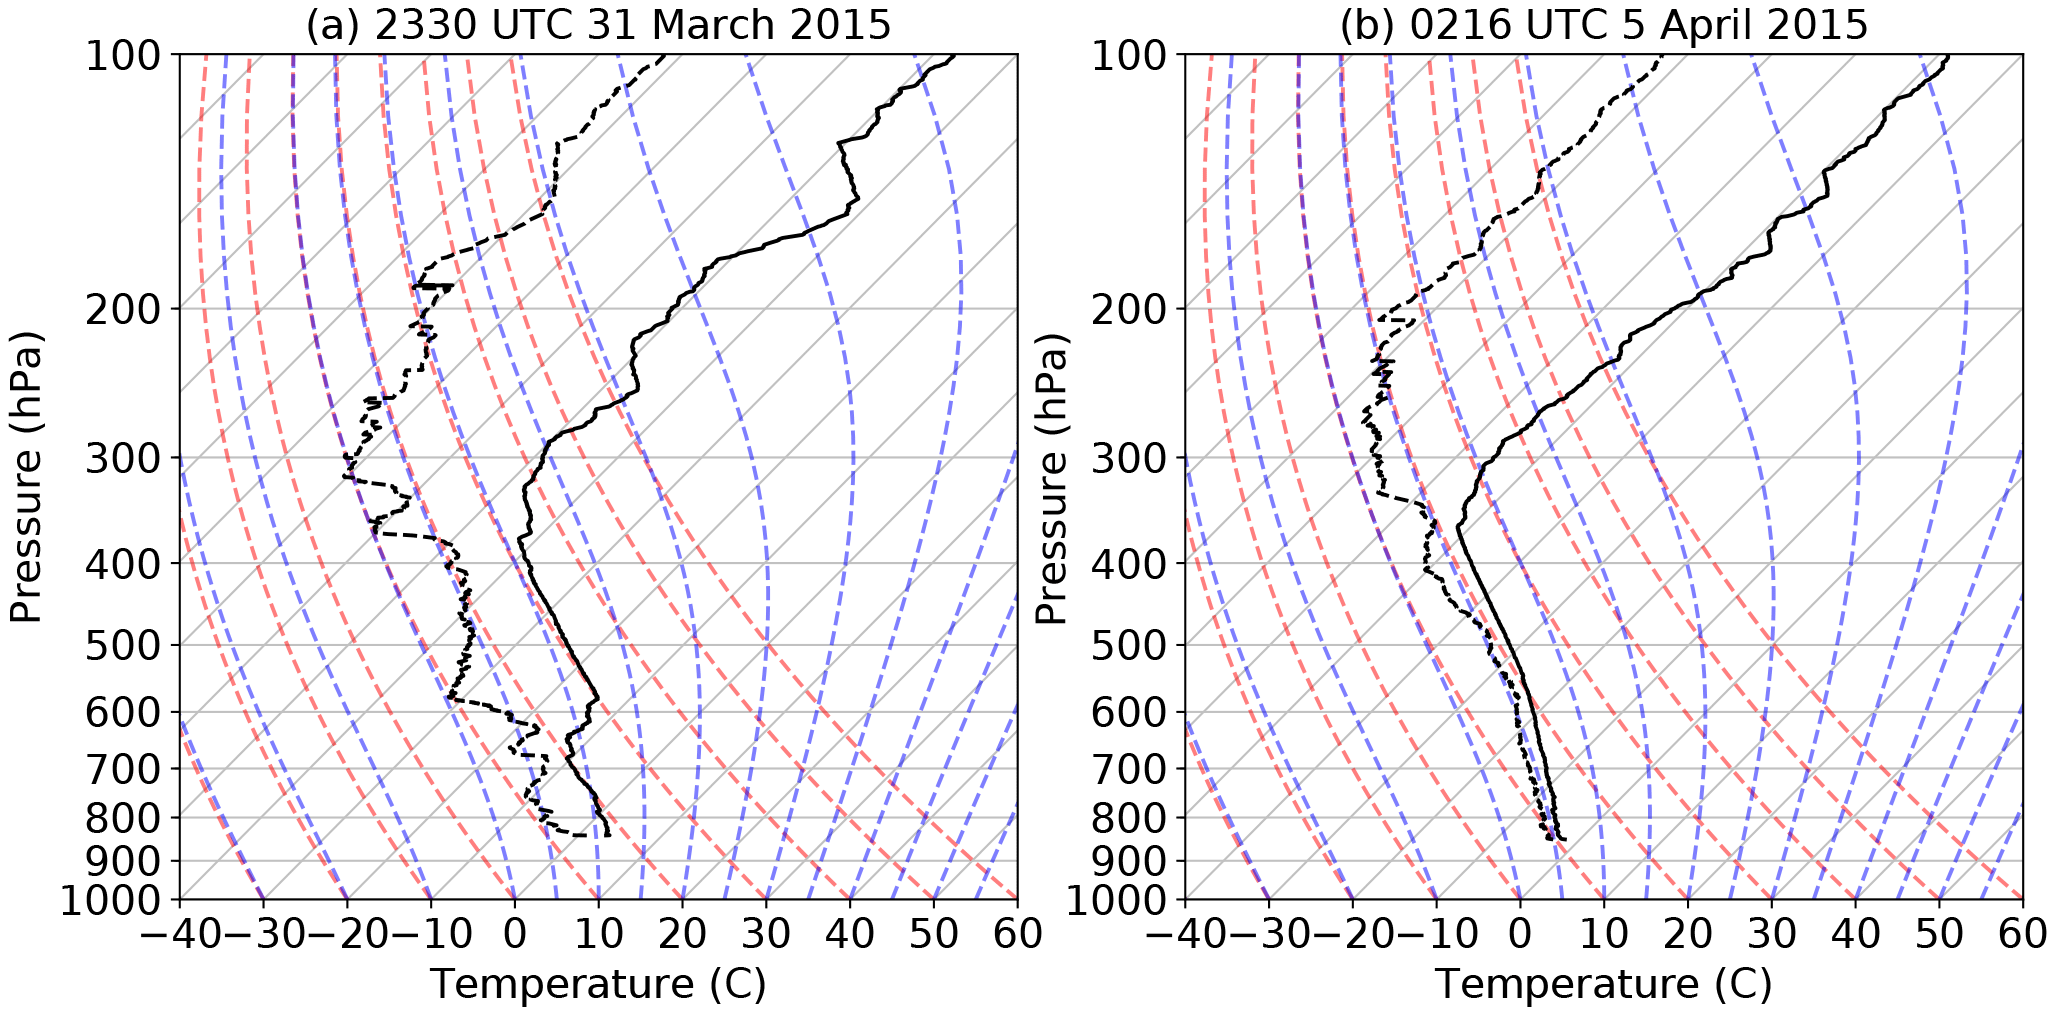
Figure 4The soundings launched at (a) 23:30 UTC 31 March 2015 (westerly flow event) and (b) 02:16 UTC 5 April 2015 (easterly flow event).
As suggested in Table 1, no correlation has been found between the type of flow field regime and the amount of precipitation at the surface. Even if major precipitation events are generally associated with easterly flow field, during this field project, heavier precipitation amounts were not associated with a particular flow field regime. This may be due to a slightly different synoptic-scale setup that would bring less moisture in the area. Further investigation is needed to determine the threshold atmospheric conditions leading to major precipitation events.
3.3 Local features associated with westerly and easterly flow aloft
The evolution of precipitation at the surface varied between the two flow regimes and the atmospheric conditions at KES are described and compared. The same two illustrative events from Sect. 3.2 are utilized. A representative westerly flow event occurred on 31 March to 1 April 2015 (Fig. 5) and a representative easterly flow event occurred on 4–5 April 2015 (Fig. 6). The data analysis is described in Appendix A.
First, the radar signal extended to more than 4 km a.g.l. during the westerly flow event (Fig. 5a and b) compared to only 2–4 km a.g.l. during the easterly flow event (Fig. 6a and b). The vertical particle motion was characterized by higher values during westerly flow event as some particles were moving upward, whereas this was not observed during the easterly event (Figs. 5b and 6b). A bright band was observed near the surface during the westerly flow event (Fig. 5a, just after 22:00 UTC). This is consistent with the >0 ∘C surface temperature (Fig. 5c) leading to rain and mixed-phase precipitation (Fig. 5f). In contrast, the easterly flow event was generally colder (Fig. 6c) with snow and more precipitation accumulated at the surface (up to 2.5 mm in liquid equivalent, Fig. 6d) compared to that in the westerly flow event (1.5 mm, Fig. 5d). Both events were associated with generally calm surface conditions although weak winds (<2.5 m s−1) sometimes occurred during the westerly flow event (Fig. 5e).
On 4–5 April 2015, mainly snow reached the surface (Fig. 6f) and particles were photographed. Most of them (23:00 UTC 4 April 2015 to 05:00 UTC 5 April 2015) were a combination of rimed columns, planes, combinations of column and plane, and aggregates. Rimed irregular particles were also photographed as well as a few occurrences of snow pellets (SP). These rimed particles were sometimes observed simultaneously with unrimed ones suggesting that they were formed in different growth environment.
Unusual particles were identified in images on 5 April 2015 and these were centred 12-branched dendrites (Fig. 7). Only three of these were found among all the particles analyzed during the experiment. As discussed by Kikuchi and Uyeda (1998), the presence of such particles implies saturated conditions aloft at −18 to −13 ∘C; riming indicates the presence of supercooled droplets. The fact that the particles were intact at the surface also implies that they must have fallen through somewhat quiescent conditions with few if any collisions with other particles, which is confirmed by the stable conditions (low spectral Doppler width values from the MRR2).
In general, the precipitation type evolution at the surface during the westerly flow events was rain changing into mixed precipitation. This occurred in 8 of the 11 westerly flow events. The height of the snow line, defined as the top of the layer with rain and mixed precipitation, varied between 1724 m a.s.l. on 28 March 2015 and 1958 m on 17 April 2015. This was measured using the car-sonde technique (car-sonde, Appendix C) along Fortress Mountain (Fig. 1). On 31 March 2015, the height of the snowline was 1874 m, which corresponded closely with the top of the bright band aloft (Fig. 5a).
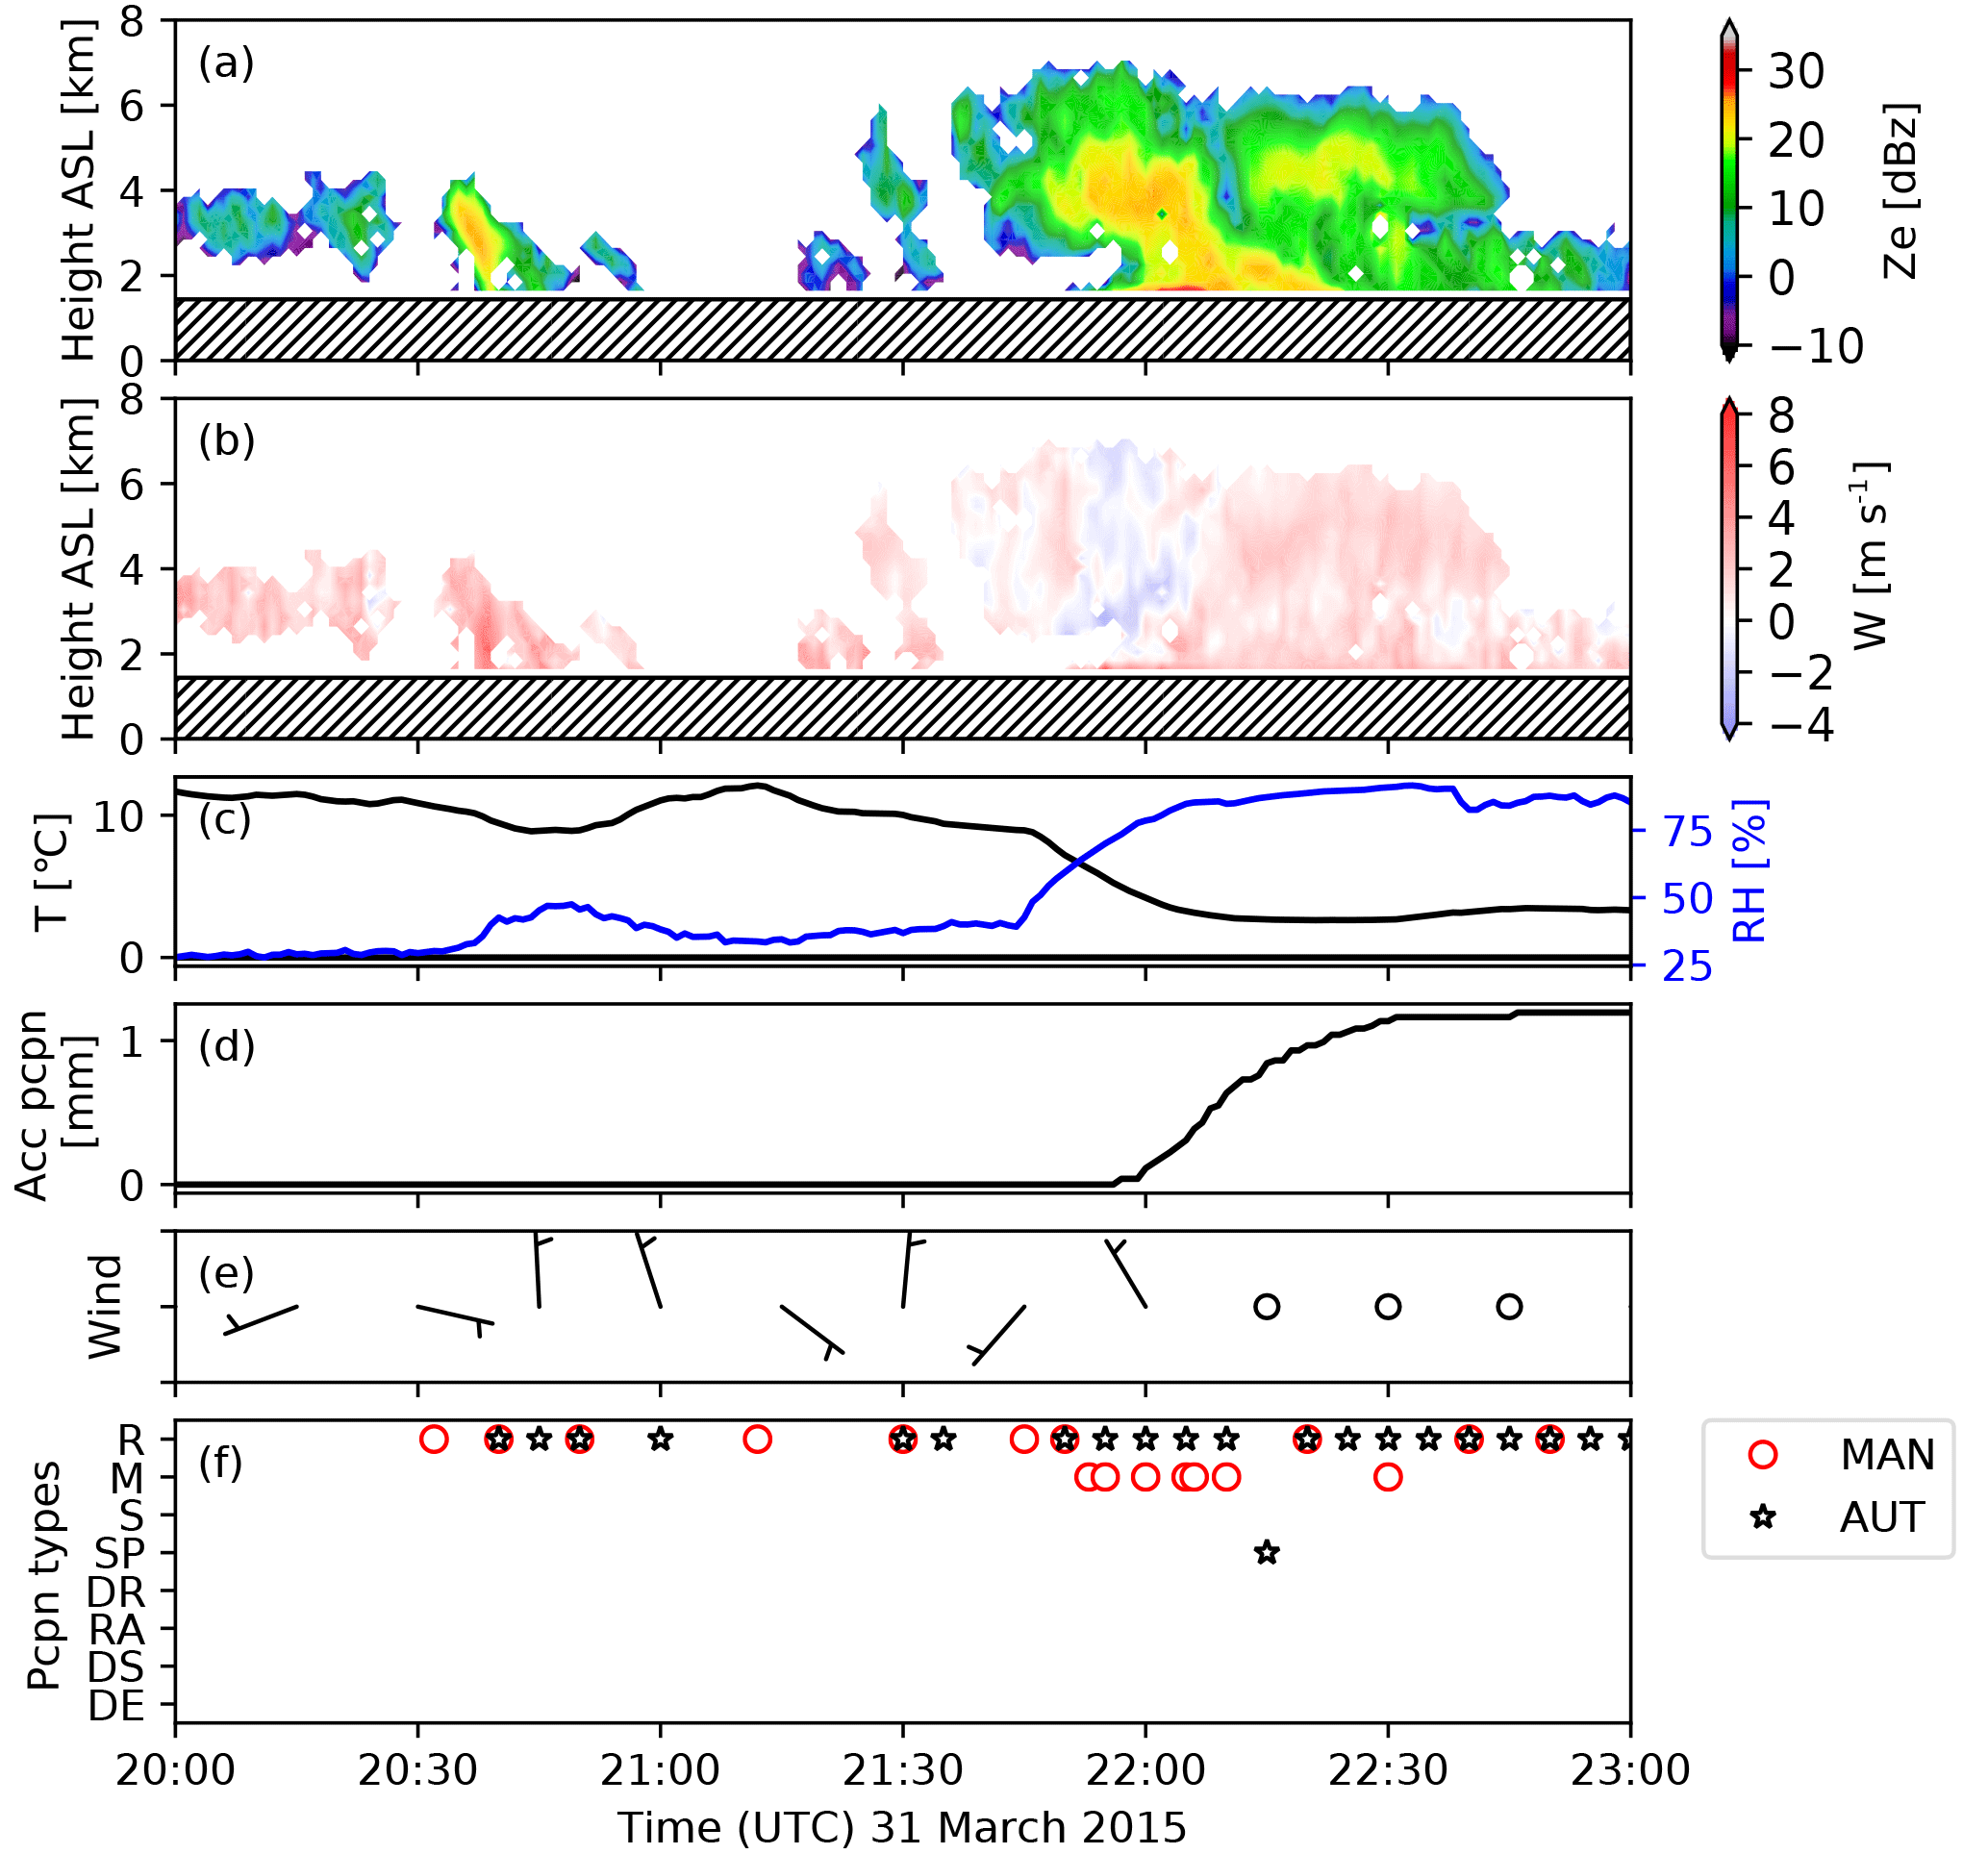
Figure 5Time evolution (UTC) on 31 March 2015 of (a) reflectivity and (b) vertical particle motion fields retrieved from the Micro Rain Radar 2 (MRR2) for the westerly flow field event. Positive Doppler velocities indicate downwards motion. (c) is the surface temperature (T) and relative humidity (RH), (d) is the unadjusted accumulated precipitation at the surface at KES, (e) is the wind speeds and direction represented by the wind barbs, and (f) is the manual observation of precipitation types (MAN) as well as diagnosed using the OTT Parsivel (AUTO) following Ishizaka et al. (2013). The hatched region on the MRR time series (a, b) indicates ground-level height. The MRR2 quality control was based on Maahn and Kollias (2012). See Appendix A for details on the precipitation type diagnostic method. Note that a wind barb is like an arrow on which the barb is the wind speed (short line is 5 knots and the long line is 10 knots). It points in the direction to which the wind is blowing.
4.1 Overview of precipitation types at the surface
The ratio of each type of precipitation was diagnosed for all the events. The automatic method suggested that 24.1 % of the precipitation occurrences were associated with rain (Fig. 8), whereas the manual observations led to 16 % rain as well as 6.3 % mixed precipitation (cf. Fig. 2). Mixed precipitation can be very wet snow particles that can be diagnosed as raindrops. Given these generally consistent results, the diagnostic method is used to study the difference in the precipitation characteristics associated with a varying flow field.
The main difference in the precipitation types for the flow field regimes was the relative amount of rain and snow pellets reaching the surface. Rain mainly occurred (36.4 % of the precipitation) during westerly flow events compared to 7.1 % during easterly flow events. In contrast, snow pellets commonly occurred during westerly flow event (47 %) compared to easterly flow ones (5 %). The fraction of densely rimed aggregates (DR) was nearly the same for both types of flow field.
During all events, the box plots indicate that the median surface temperature was close to 1 ∘C with a relative humidity of 82 % (Fig. 9). Warmer and drier conditions were associated with westerly flow (near 2 ∘C and 81 % relative humidity) events compared to those during easterly flow (0 ∘C and 85 %). The particle median diameter was 1.8 mm with a fall speed of 1.8 m s−1 for events during both flow field patterns but also due to more regions of upward motions leading to more riming, which impacts the fall speed (Figs. 5, 6 and Sect. 5). The westerly flow regime was associated with a wide range of fall speeds (0.5–4.5 m s−1), whereas the range was much narrower (1–3 m s−1) for the easterly flow regime. This is probably due to the higher fraction of rain during westerly flow events.
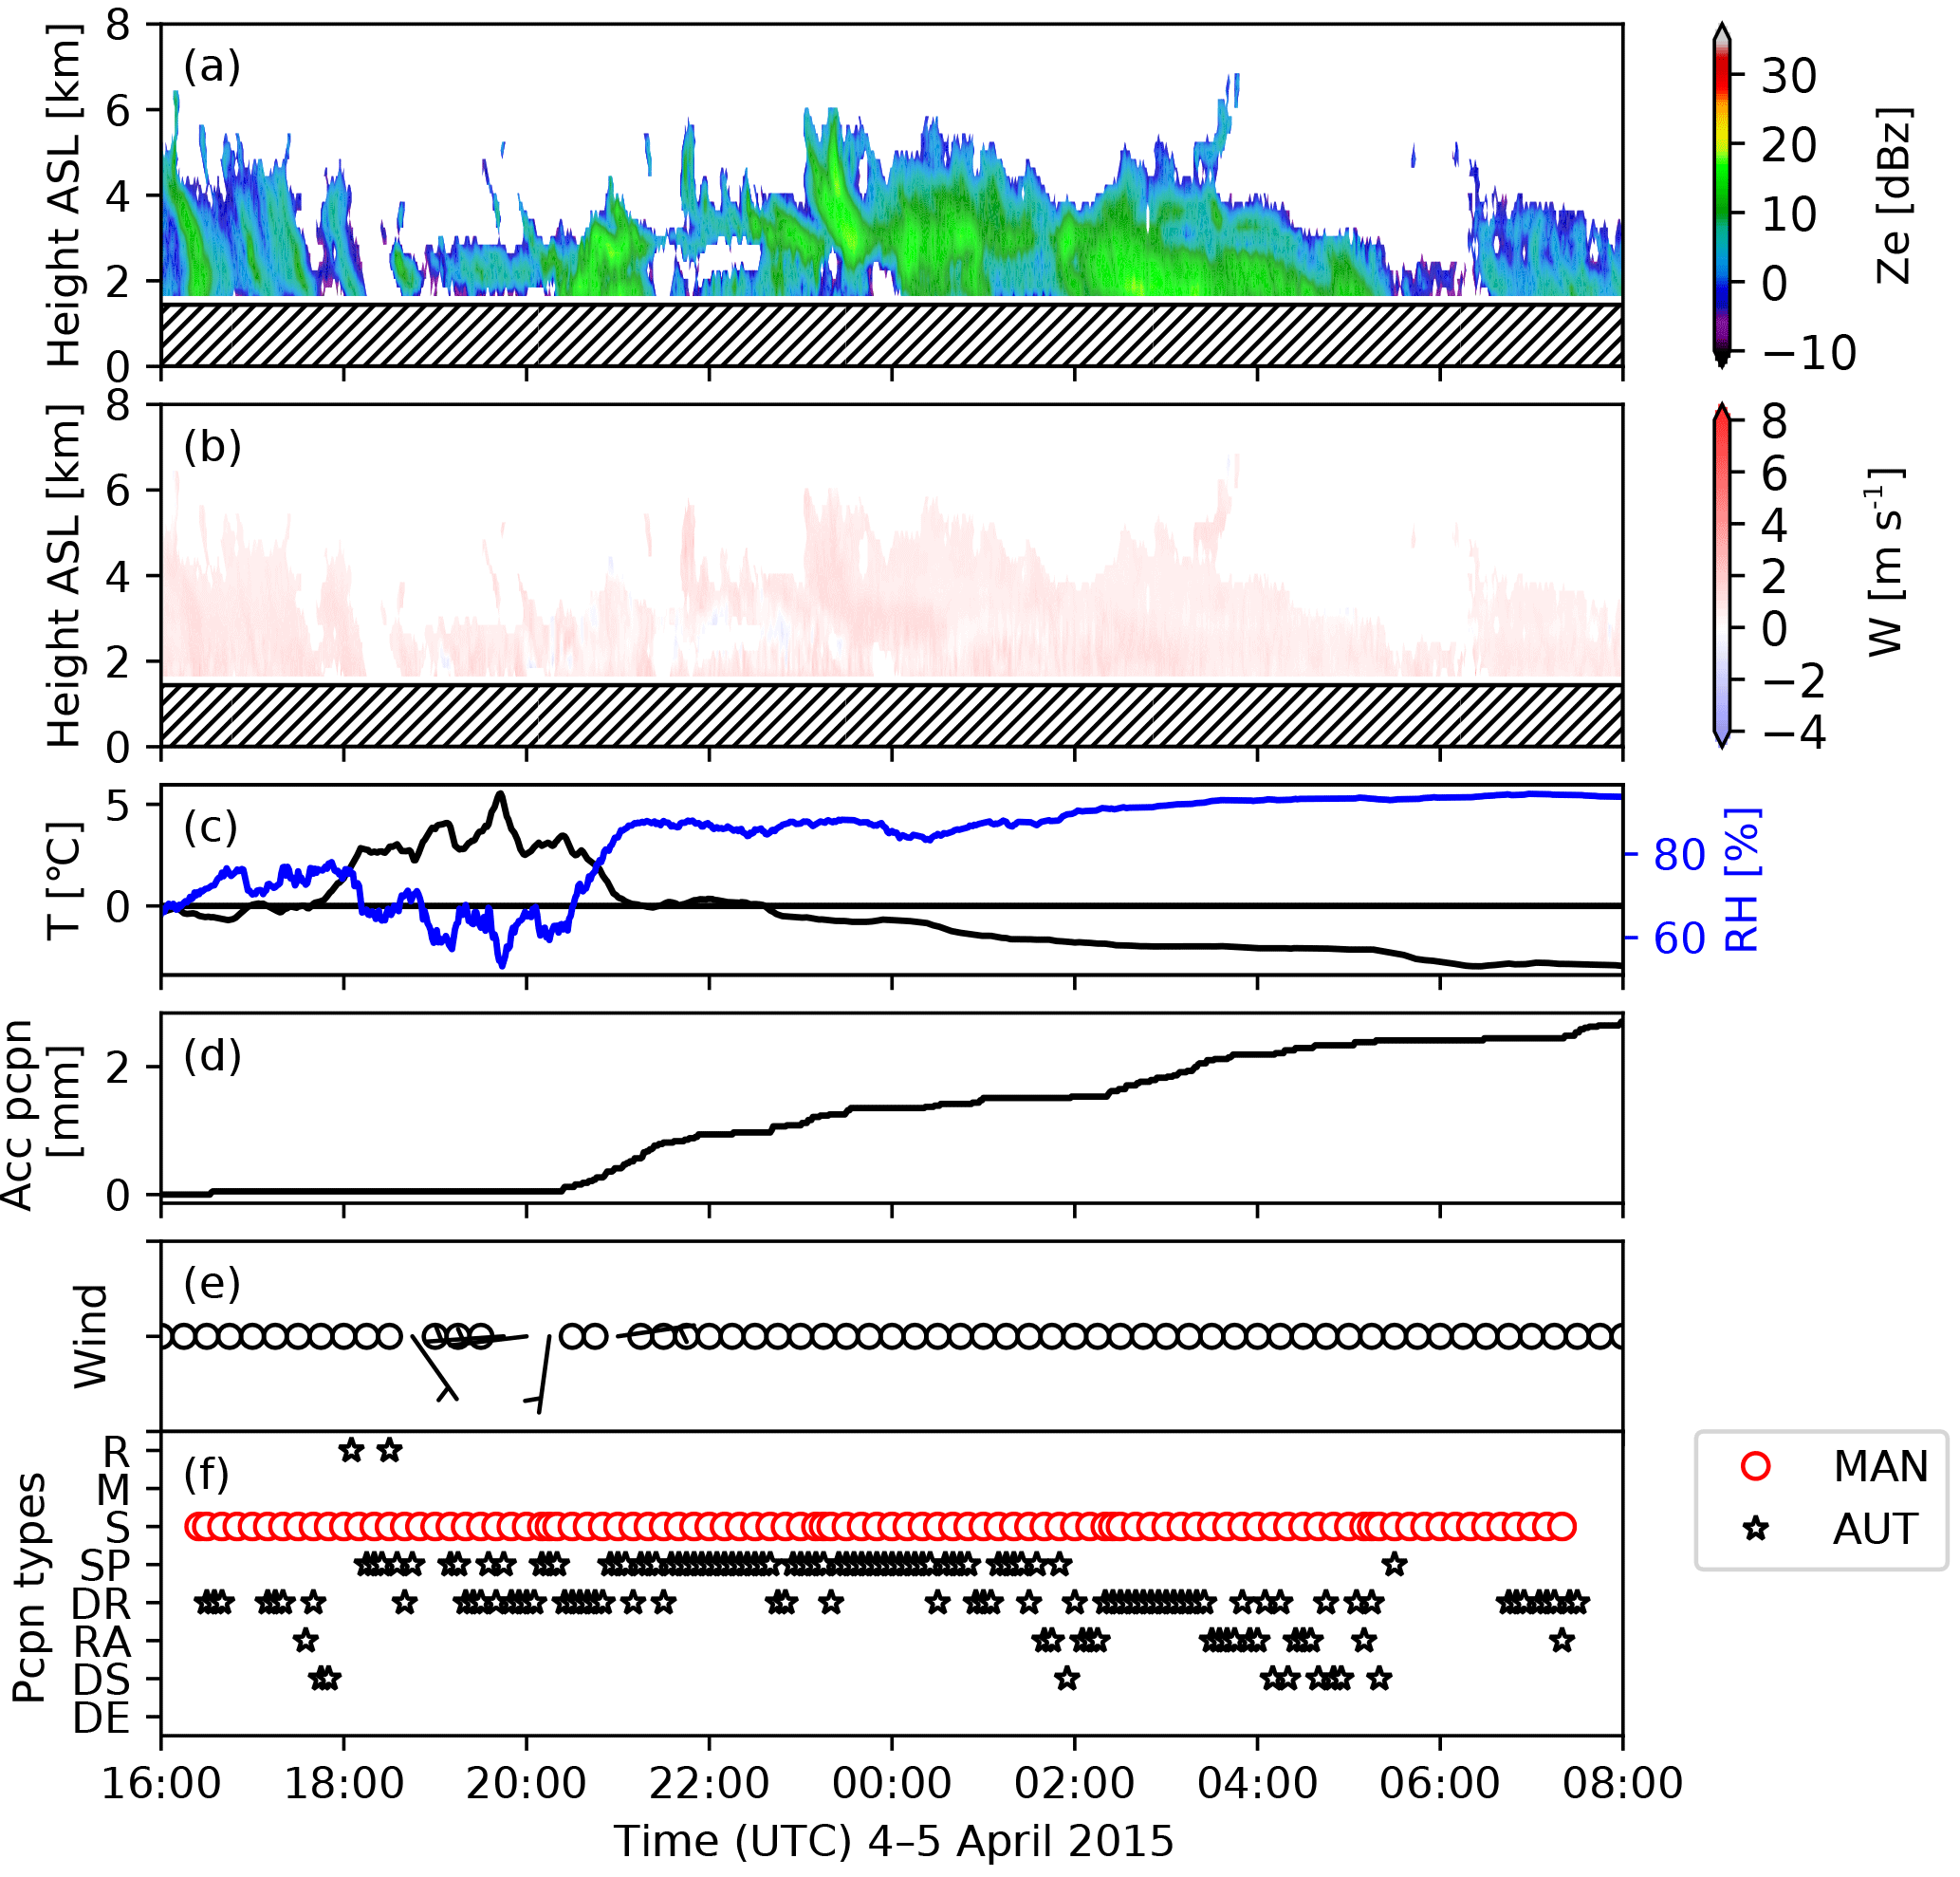
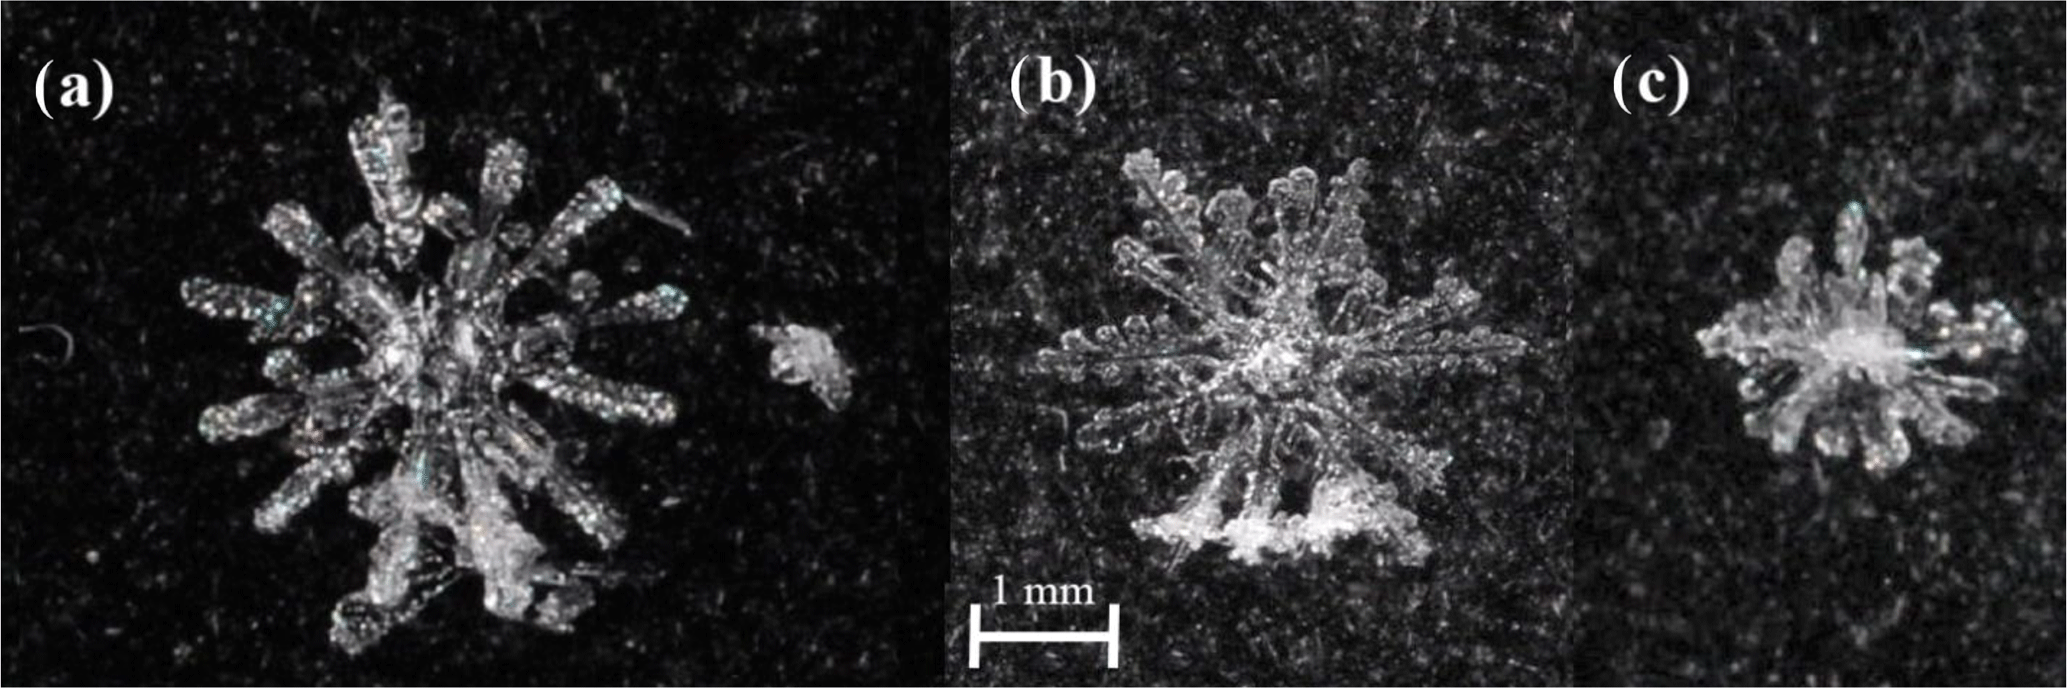
Figure 7The 12-branched dendrites were identified on 5 April 2015 at (a) 03:34 UTC, (b) 03:41 UTC and (c) 05:12 UTC. The scale is the same for each particle. These particles ranged in size from approximately 2 to 4 mm across and were lightly rimed. The average temperature when the particles were photographed at the surface was −2 ∘C with an average relative humidity of 93 %.
The temperature, relative humidity, fall speed and diameter associated with the four main types of precipitation (rain; snow pellets; rimed snow, RS; and dry snow, DS) for the flow field regimes are presented in Fig. 10. The two categories of rimed aggregates (RA) were combined and called rimed snow. The size and fall speed varied with the type of event. The fall speed increased with the degree of riming, following the empirical relationship given in Appendix B. The particles with a lower degree of riming were associated with colder and less humid atmospheric conditions near the surface compared to the completely rimed particles, which is consistent with Fig. 10. For example, snow pellets were associated with temperatures near 2∘C and relative humidity of 70 %–80 %, whereas dry snow was associated with temperatures near −1 ∘C and relative humidity around 80 %–90 %.
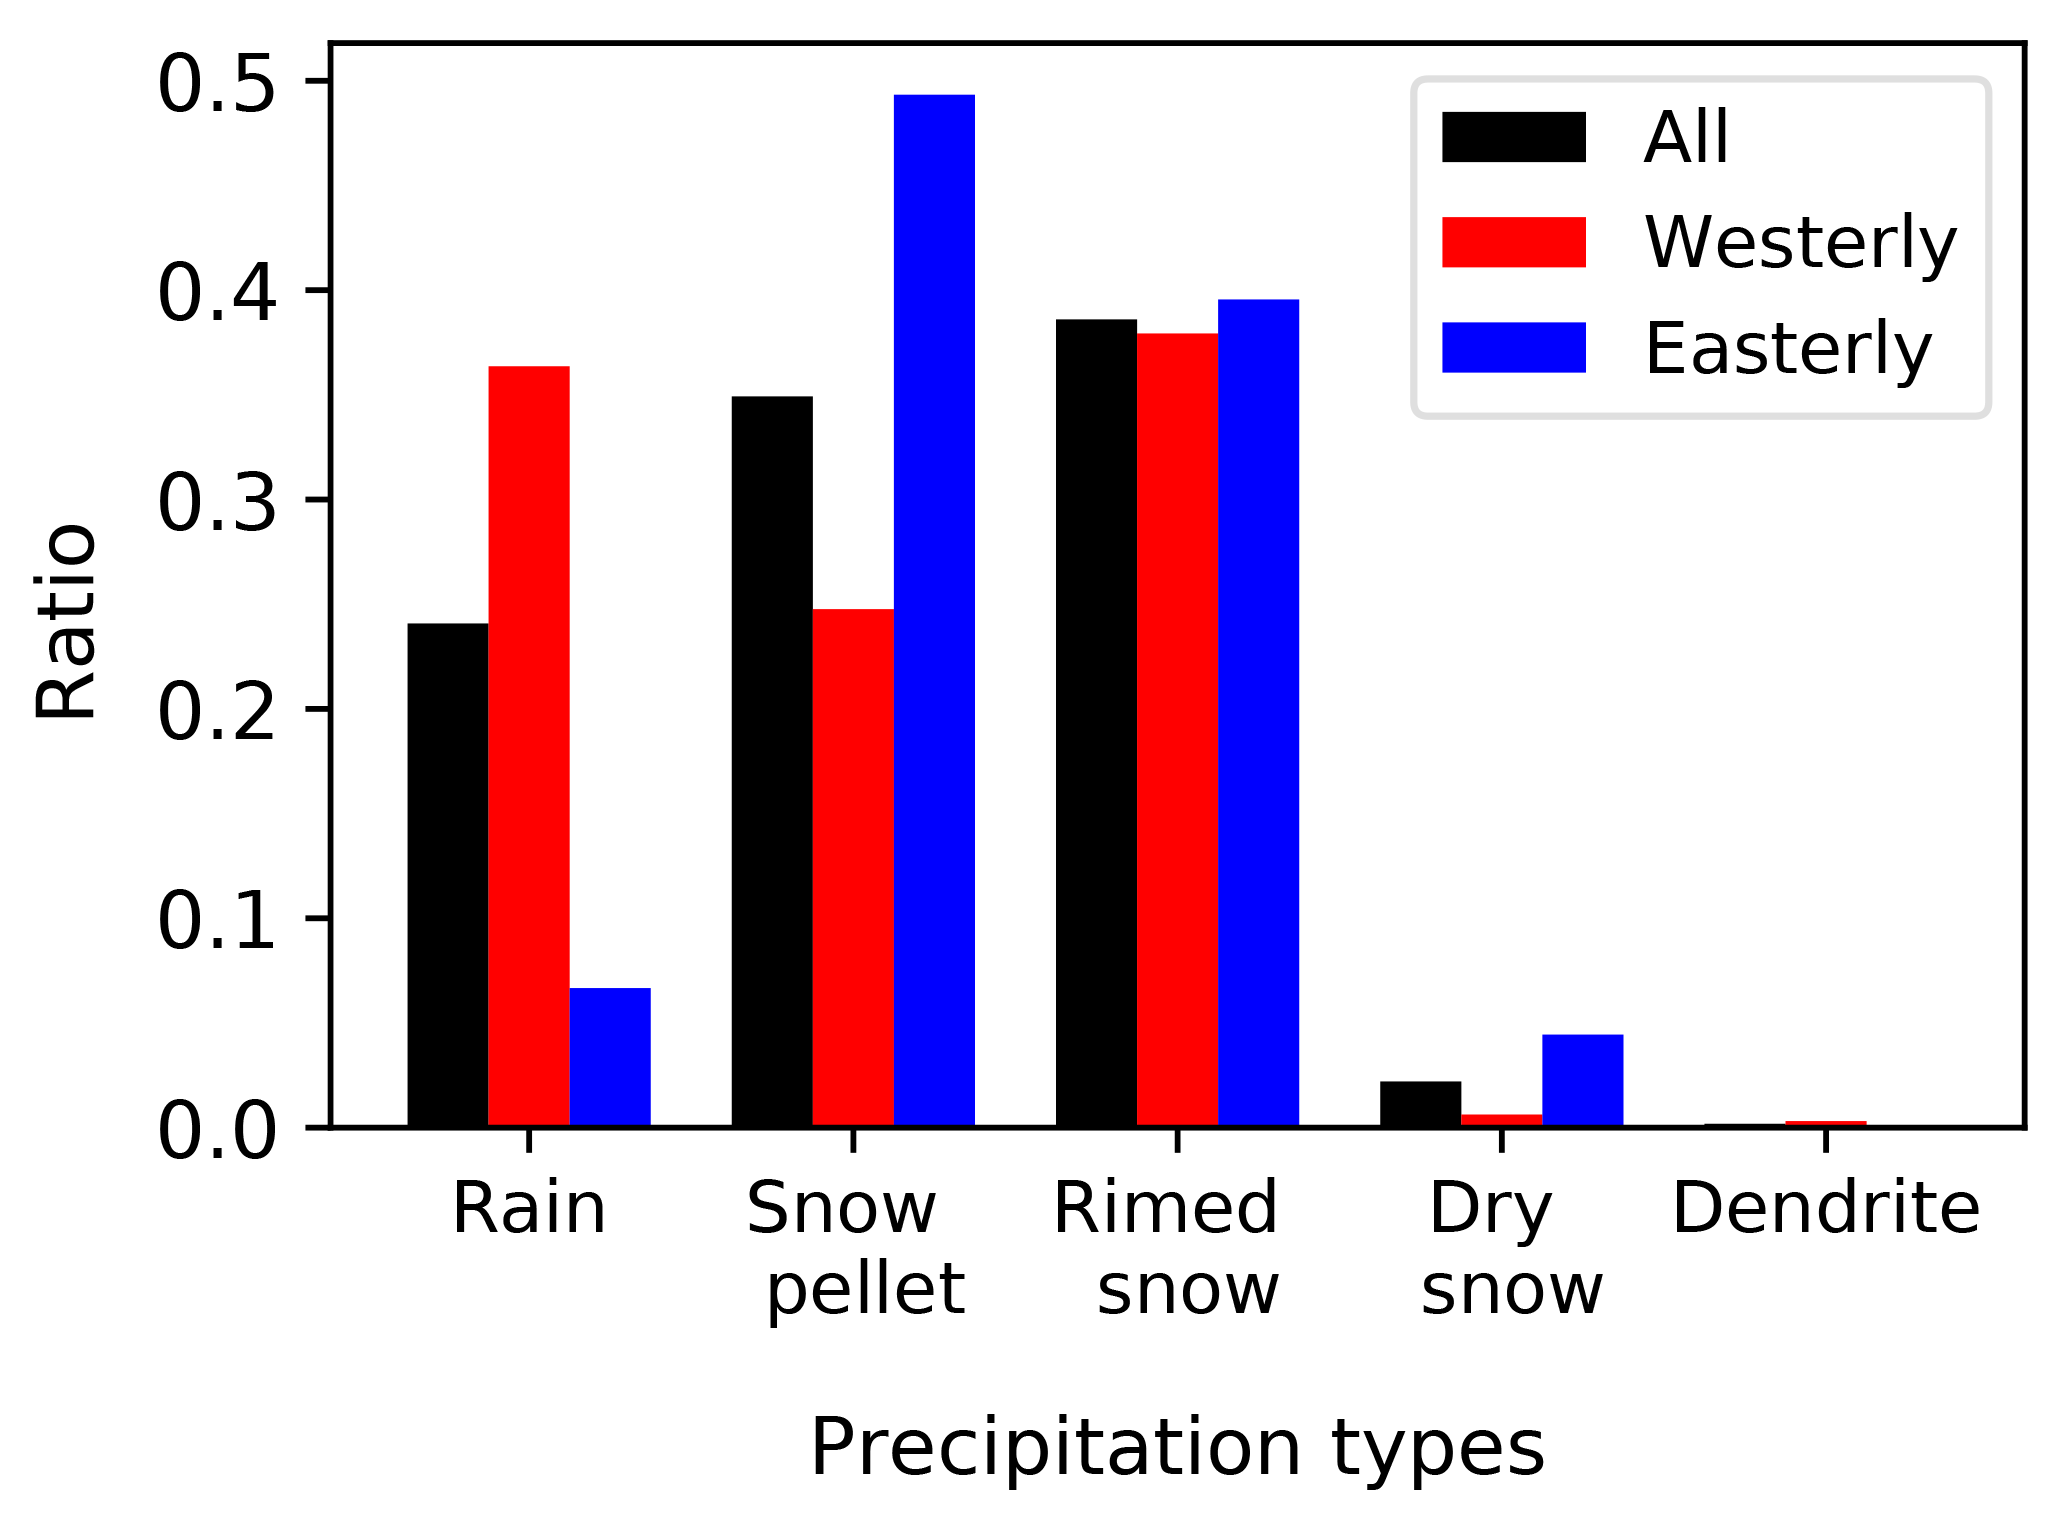
Figure 8The fraction (%) of precipitation and crystal types diagnosed with the Ishizaka et al. (2013) method using optical disdrometer information over the March–April 2015 period. A summary is provided for all events, westerly flow events and easterly flow events.
4.2 Characteristics of solid precipitation
The detailed structure of single solid particles was investigated with the microphotography system. The largest single ice crystal (5 mm diameter) was observed on 4 April 2015 and the largest aggregate (24 mm) was observed on 14 April 2015. The number of each particle type is summarized in Fig. 11a. The most common type of solid precipitation was irregular snow particles that Peterson et al. (1986) had described as being various snow crystals growing together at random. There was also a diverse occurrence of individual ice crystals as well as aggregates made up of different combinations.
Most of the unrimed particles with a discernible crystal habit were reported during one event (15–16 March 2015). During that event, 86 % of the particles were unrimed. This event produced a variety of ice crystal (column and plane) and rimed particles. The degree of riming was also estimated on each particle (Fig. 11b) using the classification proposed by Barthazy and Schefold (2006). Rimed particles were examined by eye in Adobe Photoshop and were placed into categories with respect to the degree of riming. Riming often occurred (63 %) although its fraction varied substantially with particle type.
4.3 Occurrence of solid precipitation at temperatures >0 ∘C
Due to the relatively dry atmospheric conditions in the region, seven events produced ice crystals and solid precipitation particles at the surface when temperatures were above 0 ∘C (Fig. 2). Such instances were previously found in this region by Harder and Pomeroy (2013). The particles were identified by either manual observation or by microphotography. There were, however, many cases when the particles instantly melted once in contact with the surface or with an object, making it impossible to determine particle type.
The highest temperature at which ice particles were identified was on 25 April at 9.1 ∘C with a relative humidity of 45 %. This is consistent with the maximum temperature for snowfall observed over 7 years by Harder and Pomeroy (2013) at a higher elevation in the region. The average temperature during these instances was 3.8 ∘C with a relative humidity of 57 %. Therefore, a combination of dense (rimed) solid particles (Fig. 11) and sub-saturated conditions near the surface (Fig. 2) may have been responsible for solid precipitation at the surface and it will be investigated in the following section.
4.4 Idealized simulations
To demonstrate the impact of riming and sub-saturated conditions on the type of precipitation reaching the surface, idealized numerical simulations were conducted. A one-dimensional cloud model coupled to a microphysics scheme (Sankaré and Thériault, 2016) was used. The one-dimensional kinematic cloud model solves the mass divergence form of the continuity equation for water vapour and for all the other hydrometeor categories predicted by the bulk microphysics scheme. These are rain, snow and mixed precipitation such as almost completely melted particles and wet snow. The one-dimensional kinematic cloud model has been used in numerous studies (Milbrandt and Yau, 2005a, b; Sankaré and Thériault, 2016; Thériault and Stewart, 2010). For this purpose, the initial types of solid precipitation were unrimed snow (Sankaré and Thériault, 2016) and snow pellets (Sankaré and Thériault, 2016). Two vertical air temperature and dew point temperature profiles measured during the field campaign were used. They are adapted for using the 1-D cloud model coupled with the Sankaré and Thériault (2016) microphysics scheme. The first sample is the sounding launched at 05:00 UTC 18 April 2015 when rain and mixed-phase precipitation was reported at the surface. The second sounding was associated with light snow at the surface at 08:00 UTC 18 April 2015. These data are interpolated to over 100 vertical levels, which extend from the surface to above the melting layer (2 to 3 km). Since low precipitation rates were reported throughout March and April, the model was initialized with a rate of 1 mm h−1.
The Sankaré and Thériault (2016) microphysics scheme can only be used in saturated conditions in steady-state mode to determine the type of precipitation that would be formed in the initial temperature profile. To use it in the environmental conditions observed during this field experiment, the wet-bulb temperature was computed. This temperature was used as both the air temperature and dew point temperature. This assumption allows one to only consider the impact of partial melting on the type of hydrometeor falling through a melting layer (Tw>0 ∘C); this is the main process impacting the evolution of precipitation types in saturated conditions (Stewart et al., 2014; Thériault et al., 2010). This assumption allows computing the depth of the atmospheric layer over which solid precipitation melts. This layer is shallower than the one associated with T>0 ∘C.

Figure 9Summary over the March–April 2015 period of the (a) diameter, (b) fall speed, (c) temperature and (d) relative humidity represented by a box plots. The red line is the median, the box is between the 25th and 75th percentiles, and the whiskers are the 5th and 95th percentiles.
The impact of the initial precipitation types aloft is shown in Fig. 12. When snow is assumed to fall through the warm layer, mainly rain reached the surface 05:00 UTC 18 April, because it melted completely. In contrast, when snow pellets are assumed, a mixture of solid precipitation and mixed-phase precipitation was produced at the surface by the model because they only melted partially because of the high fall speed. This is associated with an observed surface temperature of 6.9 ∘C and a depth of the warm layer (T>0 ∘C) of 900 m with an average relative humidity of 55 %. But the hydrometeors on melt when Tw>0 ∘C, which corresponds to a distance of only 500 m. At 08:00 UTC 18 April 2018, light snow, made up of rimed aggregates, was reported at the surface. The observations simulated assuming that snow pellets are falling through the melting layer. If unrimed snow is falling in the melting layer, 50 % of precipitation would be rain and <10 % of solid precipitation would reach the surface.
In summary, these idealized simulations demonstrated the impact of the type of solid precipitation aloft on the type of precipitation reaching the surface. It is not possible to assess the reduction of the mass flux due to sublimation or evaporation because the calculations were conducted using the wet-bulb temperature. But the wet-bulb temperature profiles give an indication of the region in the atmosphere where solid precipitation can melt. For example, at 05:00 UTC 18 April, the warm layer is 400 m deeper than the melting layer because of low relative humidity in that atmospheric layer (average of 55 %). This gives an indication of the impact of drier conditions on the melting rate, and, in turn, the type of precipitation reaching the surface. A combination of dry conditions, leading to a shallower melting layer, and completely rimed particles led to more solid precipitation at the surface (Stewart et al., 2014).
The processes leading to the various types of precipitation at the surface were investigated using radar signals (MRR2) with respect to the flow field. The Doppler velocity is defined to be positive if directed downwards.
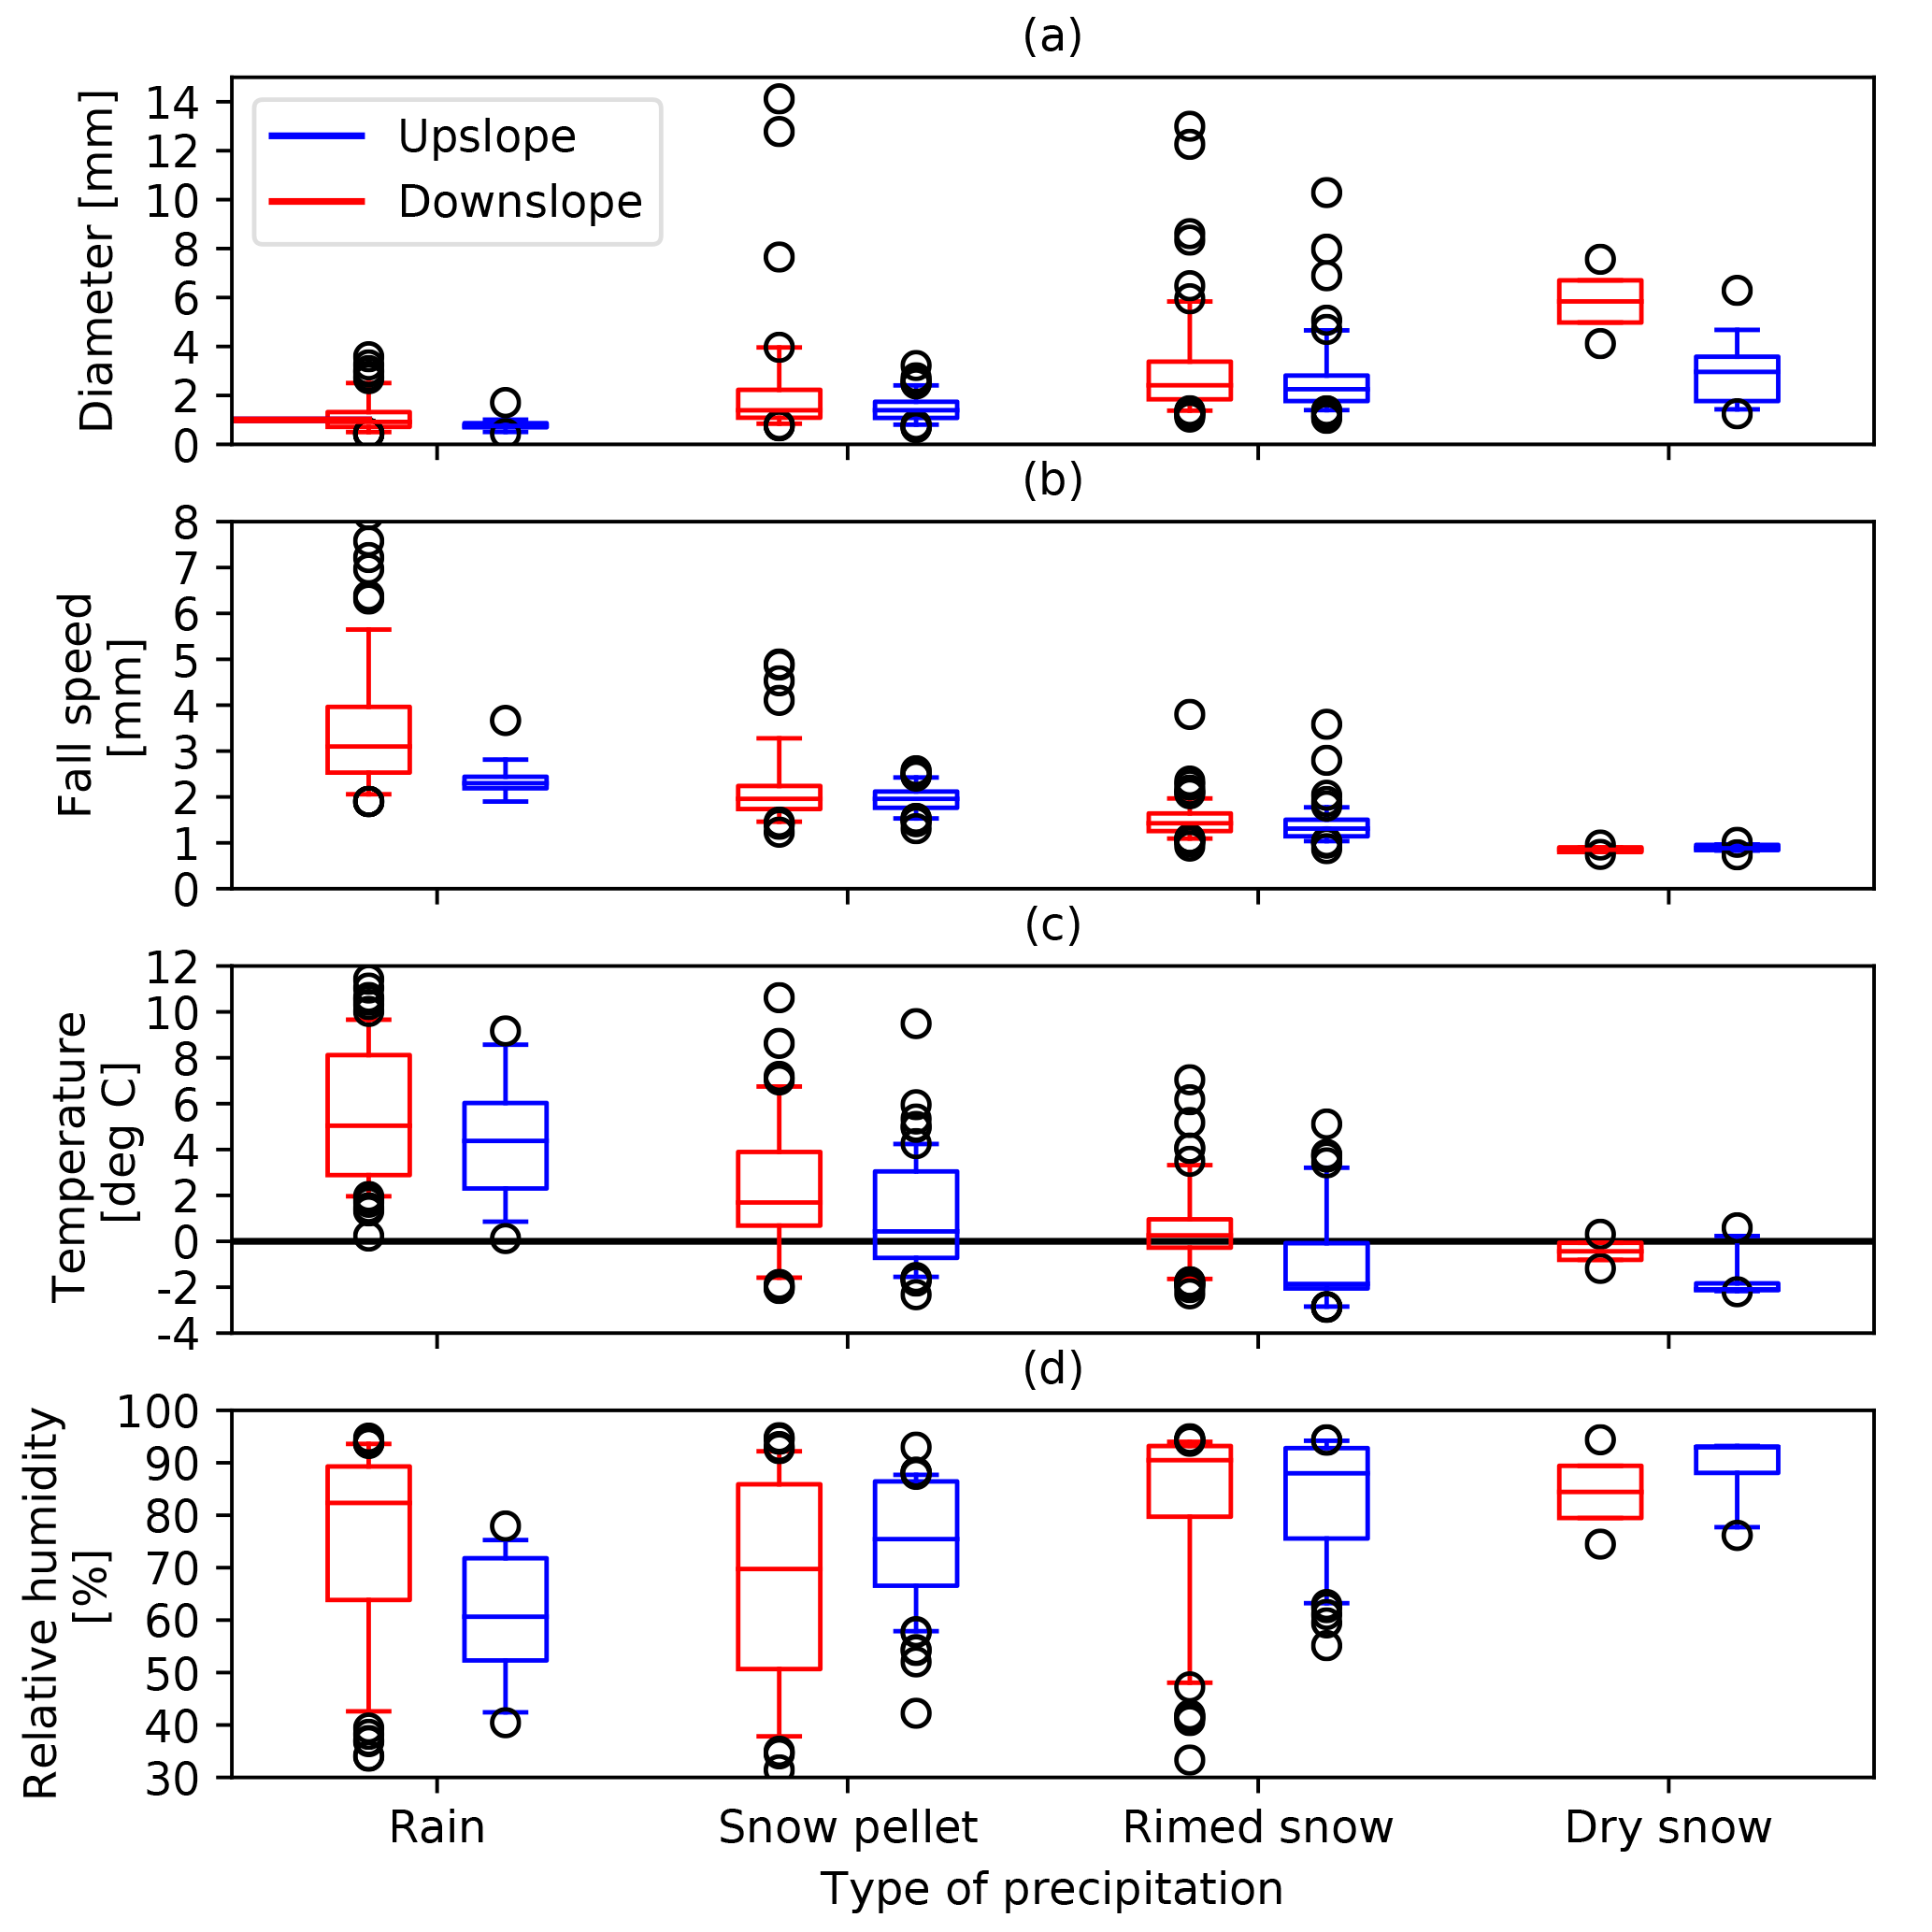
Figure 10Comparison of the surface conditions associated with the four main types of precipitation over the March–April 2015 period. The main types are rain (R), snow pellets (SP), rimed (RS) and dry snow (DS), and these are shown occurring during westerly (red) and easterly (blue) flow events. (a) is the diameter, (b) the fall speed, (c) the air temperature and (d) the relative humidity. The red line is the median, the box is between the 25th and 75th percentiles, and the whiskers are the 5th and 95th percentiles.
The radar reflectivity, Doppler velocity and spectral width during the two types of flow field regime exhibited distinct patterns (Fig. 13). Based on the reflectivity field, more precipitation (at least 5 dBZ) occurs over a deeper (near 1 km) layer aloft during westerly flow events compared to easterly flow. The Doppler velocity increased with descending height during westerly flow events, reaching 3 m s−1 near the surface. In contrast, during easterly flow events, the Doppler velocity was essentially constant with height (near 1 m s−1). The higher values and wider range of the spectral width associated with the westerly flow events support the surface observations that most of these precipitation events were associated with short and/or intermittent precipitation periods that could have been produced by local instability episodes. In contrast, the homogenous profile of low spectral width values explains the stratiform nature of precipitation caused by large-scale orographic lifting during easterly flow events.
The radar echoes were analyzed based on the types of precipitation and flow field (Fig. 14). In general, each type of particle was associated with a wider range of Doppler velocity and spectral width values during westerly events. This general statement, however, cannot be made for the reflectivity patterns. Furthermore, the radar echoes differed for the same type of precipitation depending on the flow field. Large differences in the signal among precipitation types are evident during westerly flow events compared to easterly flow events. First, the precipitation layer leading to rain at the surface was at least 2 km deeper during westerly flow events. Second, snow pellets had maximum reflectivity values during westerly flow events between 2000 and 4000 m as well as 1000 m a.g.l., and this maximum was not evident in the other types of solid precipitation and events. Within that layer, upward motion occurred, which is favourable for growth by accretion leading to completely rimed particles such as snow pellets. In contrast, upward motion was measured within a shallower layer when rimed snow reached the surface. The depth of the layer associated with upward motion is somewhat linked with the degree of riming. During periods with rimed snow at the surface, the upward motion occurred over a shallower layer (∼1000 m) than during periods with completely rimed particles (of order ∼2000 m). Finally, reflectivity values all decreased (except for downslope rain) with descending height just above the surface (∼1000 m). This is probably associated with sublimation of particles in that layer. The increase in reflectivity associated with the rain in westerly flow could be produced by the bright band near the surface from the melting of solid precipitation.
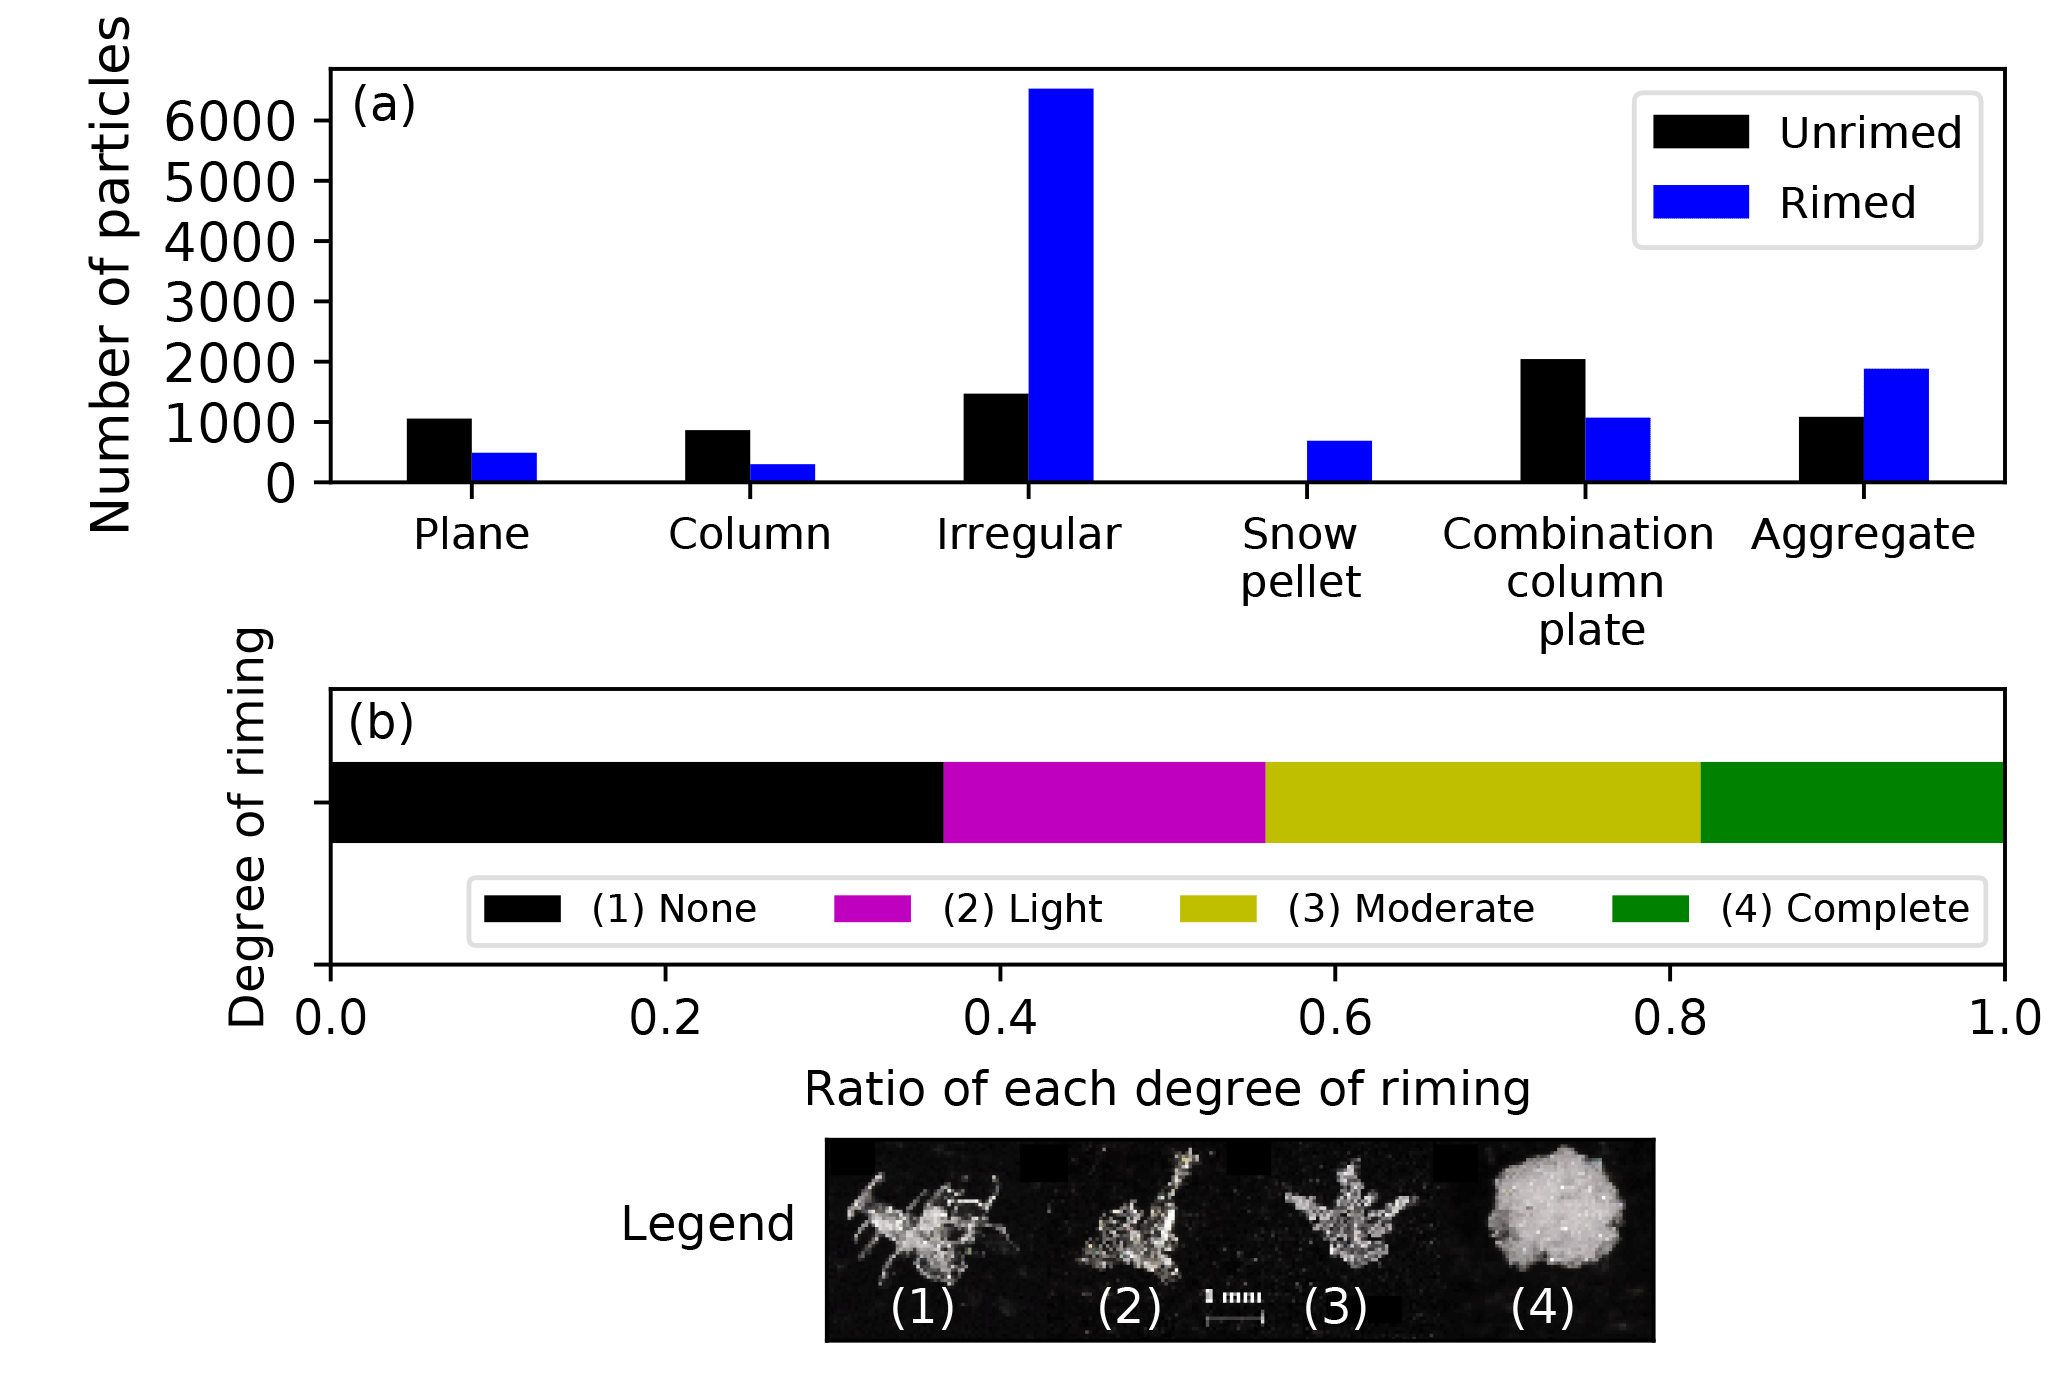
Figure 11(a) The number of unrimed and rimed ice crystals and solid precipitation particles identified using the microphotography observations over the March–April 2015 period. For simplification purposes, the other solid precipitation category was omitted from the image since fewer than five of these particles were observed. (b) The fraction of particles with varying degrees of riming as identified in microphotography observations over the March–April 2015 period. The insert provides a visual reference for the different categories of riming.
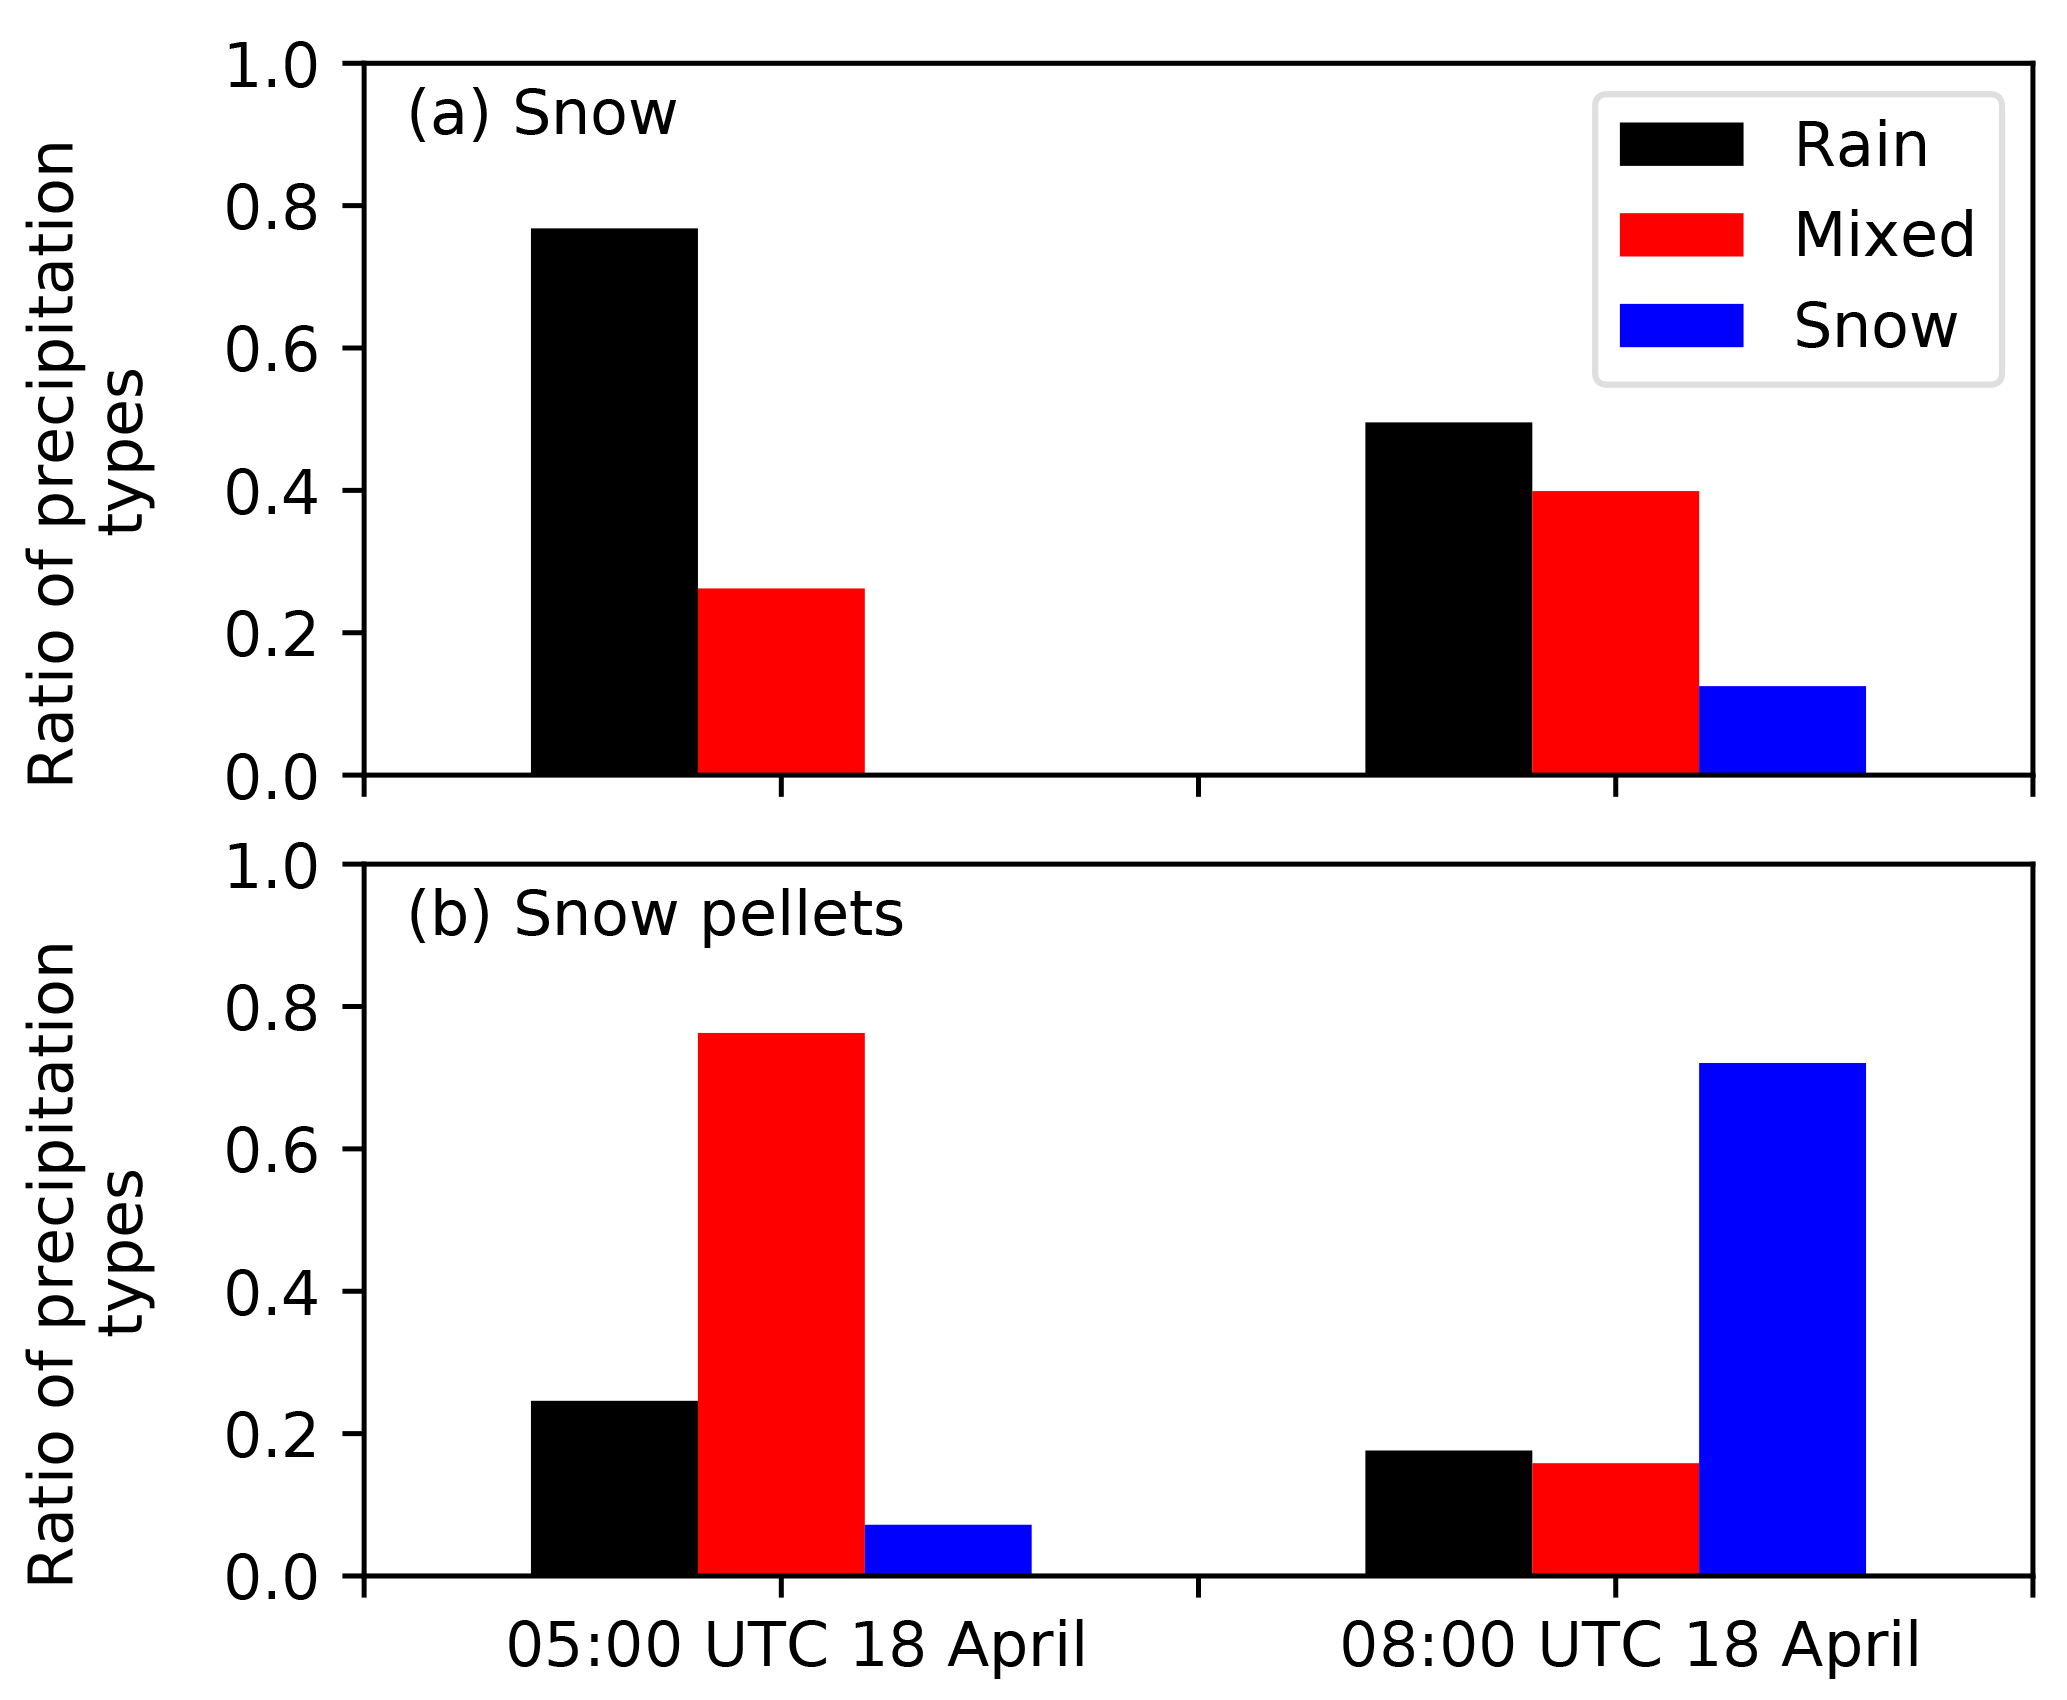
Figure 12Ratio of precipitation produced at the surface by the one-dimension cloud model coupled to a bulk microphysics scheme (Sankaré and Thériault, 2016). The precipitation produced assuming (a) snow and (b) snow pellets falling through the melting layer (T>0 ∘C) associated with two soundings.
In summary, distinct radar echo patterns somewhat depended on the type of flow field and the degree of riming of precipitation particles. It was suggested, for example, that growth through accretion occurred in both types of flow field events but at different elevations and, in addition to sublimation/evaporation, was sometimes important in the lower levels of the atmosphere.
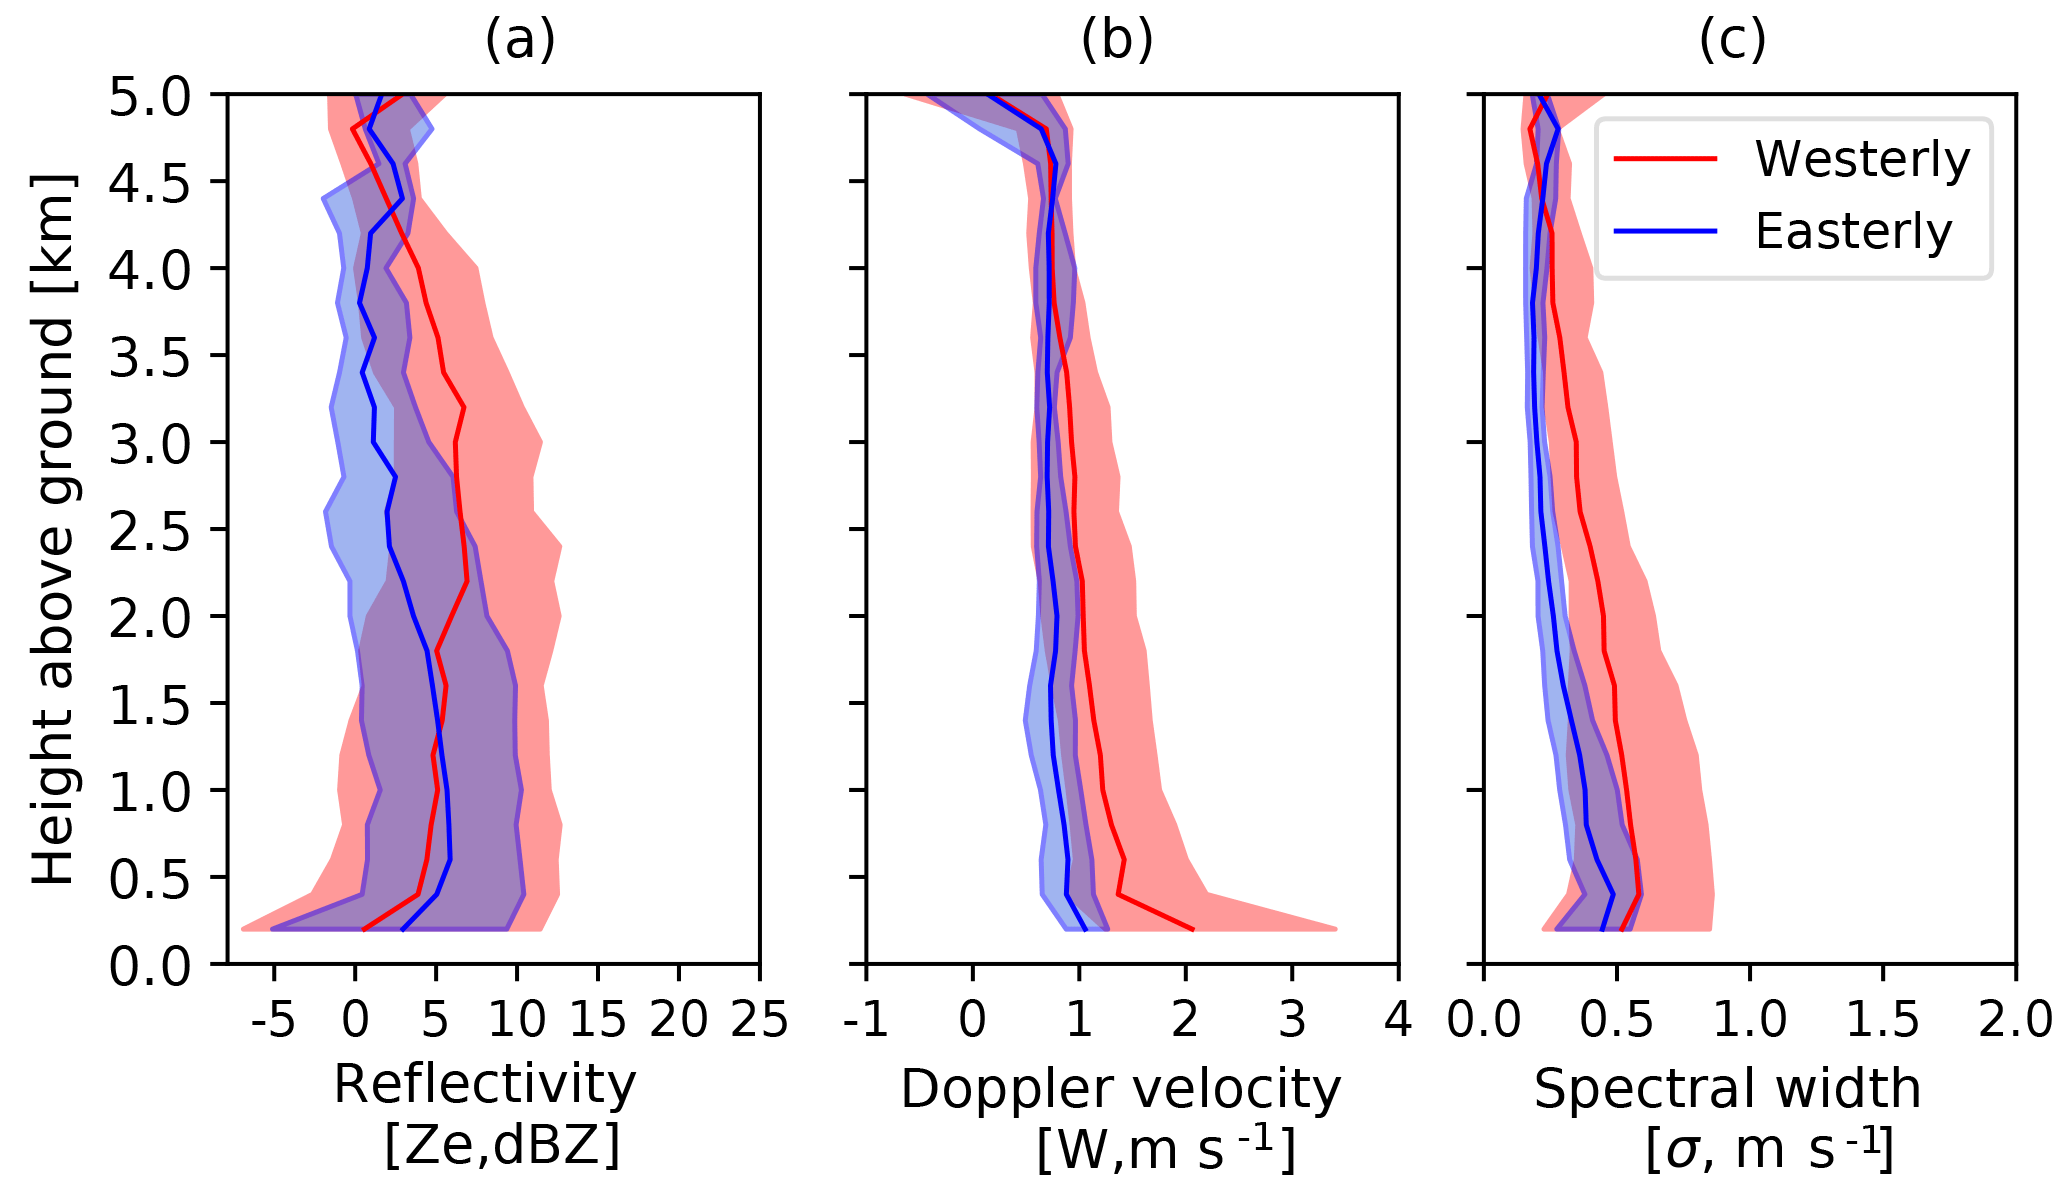
Figure 13MRR2 profiles with height (above ground level) associated with both westerly (downslope) and easterly (upslope) flow events over the March–April 2015 period. (a) is equivalent reflectivity (Ze, dBZ), (b) is Doppler velocity (W, m s−1) and (c) is spectral width (σ, m s−1). The height is above the radar and data from the first 200 m are not used to eliminate surface-induced noise. The colour shading is the region bound by the 25th and 75th percentiles. The median is the bold line.
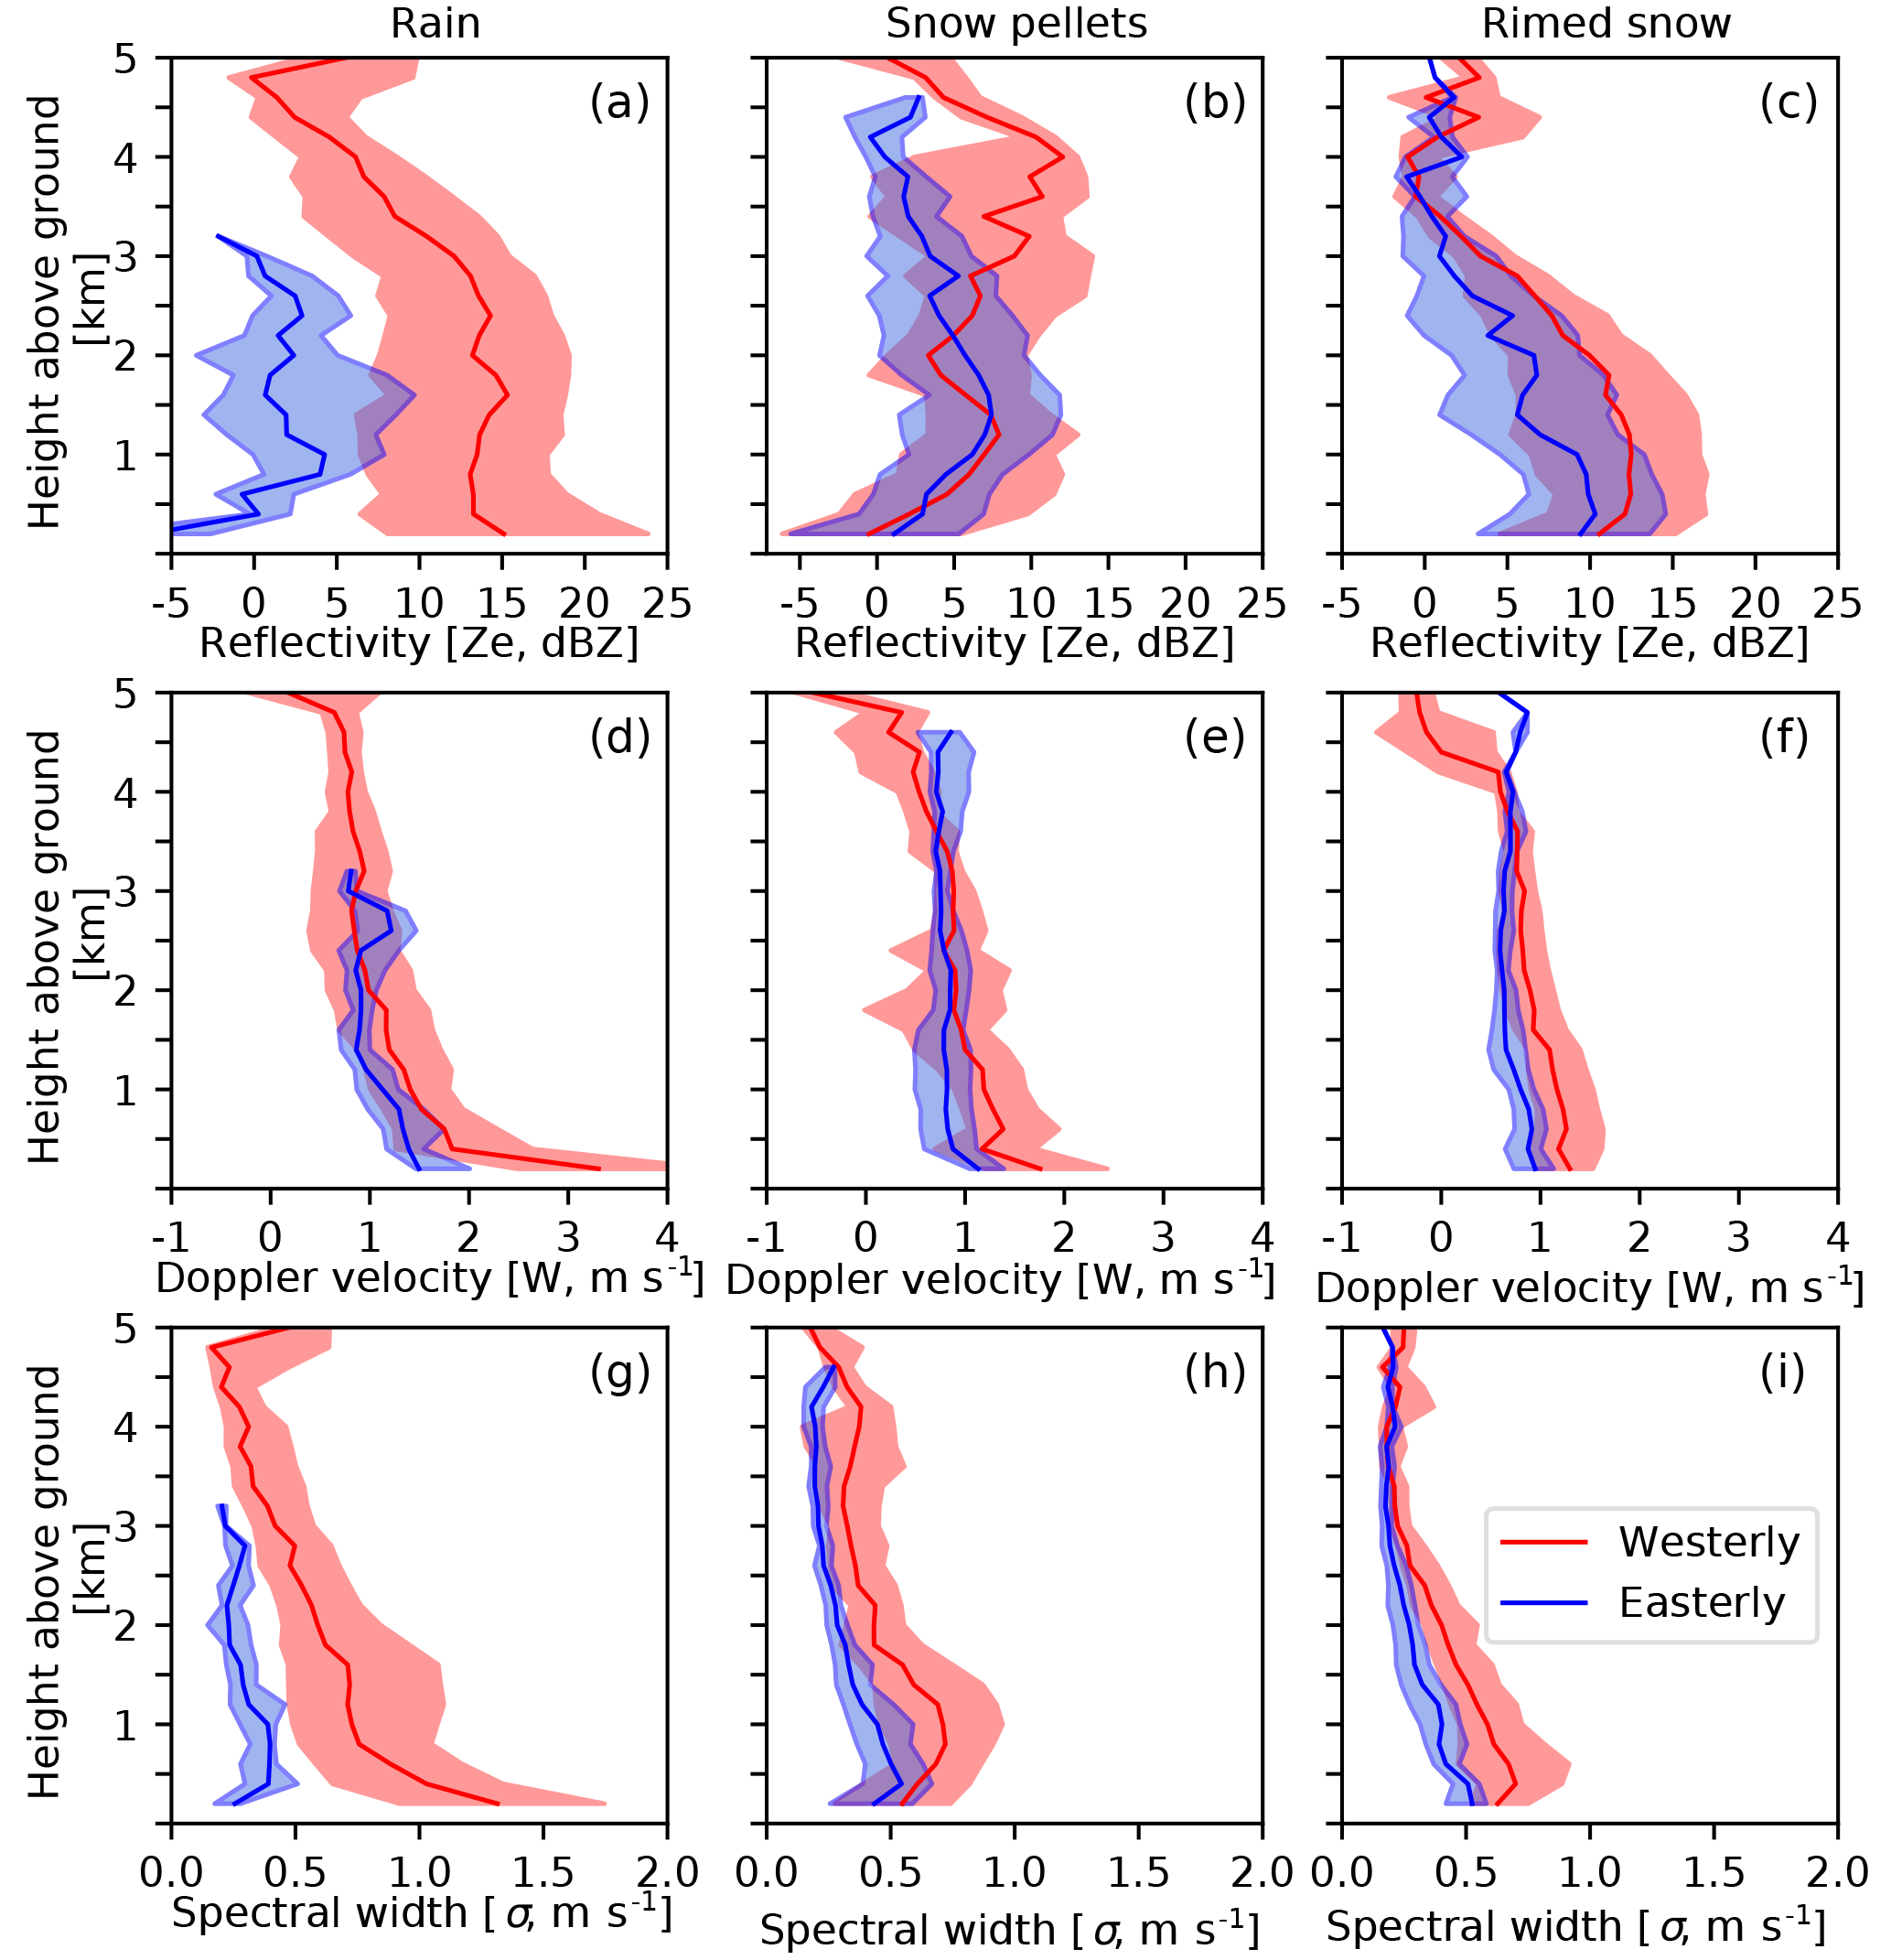
Figure 14MRR2 profiles with height (above ground level) associated with both westerly (downslope) and easterly (upslope) flow events over the March-April 2015 period for three types of precipitation: (a, d, g) rain, (b, e, h) snow pellets and (c, f, i) rimed snow. (a–d) are reflectivity, Ze (dBZ); (d–f) are Doppler velocity, W (m s−1); and (g–i) are spectral width, σ (m s−1). The height is above the radar and data from the first 200 m are not used to eliminate surface-induced noise. The colour shading is the region bound by the 25th and 75th percentiles. The median is the bold line.
Most of the solid particles found during March–April 2015 were rimed or were mixed with unrimed particles even under relatively drier surface conditions. These findings related to precipitation events associated with low intensity and rimed snow can be compared to the findings of some previous studies in other regions experiencing similar cold season precipitation.
Detailed precipitation characteristics along Whistler Mountain, Whistler, British Columbia, documented snowflake types during the Science of Nowcasting Olympic Weather for Vancouver 2010 (Isaac et al., 2014). The degree of near-surface saturation varied during this period but was generally saturated or near-saturated (Thériault et al., 2014). Associated precipitation was often rimed, up to 73 % of the total number of particles.
A few studies have examined precipitation features in northern Canada. First, Burford and Stewart (1998) studied precipitation at Inuvik and Tuktoyaktuk, Northwest Territories, and found that it fell in light intensity or as trace amounts. They attributed this at least partially to the absence of accreted particles aloft; unrimed particles largely sublimated before reaching the surface. Second, precipitation events were examined at Fort Simpson, Northwest Territories (Hudak et al., 2004; Stewart et al., 2004). Precipitation particles were largely single crystals and aggregates; rimed particles were rare. The associated light precipitation rates were attributed at least partially to the lack of factors producing rimed particles aloft. Third, Henson et al. (2011) and Fargey et al. (2014) examined precipitation in Iqaluit, Nunavut. Rimed particles, aggregates and snow pellets were very common even during light precipitation events. It was suggested that the development of rimed and large particles increased their likelihood of reaching the surface through the drier sub-cloud layer.
Other field projects were also conducted over complex terrain (Houze et al., 2017; Steiner et al., 2003) but few focused on the type of precipitation, in particular, the characteristics of solid precipitation. It is possible, however, to document the degree or riming automatically using a Multi-Angle Snowflake Camera (Garrett et al., 2012) as proposed by Praz et al. (2017). For example, they documented solid precipitation and the associated degree of riming in Antarctica.
In summary, cold season precipitation, such as occurring at Kananaskis, has been examined in several locations and the importance of accretion varied. At Kananaskis, this precipitation was associated with many rimed and unrimed particles. In contrast, precipitation was observed, or inferred to occur, with many rimed particles at Inuvik, Tuktoyaktuk, Iqaluit and Whistler but not at Fort Simpson.
Precipitation on the eastern slopes of the Canadian Rockies is a critical issue as illustrated through numerous hydrological studies (Pomeroy et al., 2016). This article focused on atmospheric aspects of this precipitation utilizing a special dataset obtained in March–April 2015 at the Kananaskis Emergency Services (KES) Centre. Compared with normal surface conditions, this period was associated with less precipitation, warmer conditions, and near-average relative humidity. The analysis of this information has led to several key points:
-
Precipitation events were associated with both westerly (downslope) and easterly flow fields (downslope) aloft. It is generally considered that only easterly conditions are significant but 11 of the 17 events were associated with westerly flow.
-
Even though the surface temperature was near 0 ∘C throughout the study period, westerly flow events were generally warmer and drier at the surface than easterly flow ones. This is consistent with general descent in westerly flows and ascent in easterly ones. Higher occurrences of rain occurred during westerly flow events.
-
The westerly flow events were generally associated with deep precipitation layers as well as more instability. The substantial precipitation layer (5 dBZ) was up to 1 km higher during those events but this also depended on the type of precipitation. For example, growth by accretion leading to snow pellets occurred at higher elevations during westerly flow events compared to easterly ones.
-
Rain, snow and mixed-phase precipitation all occurred at the surface and often within the same event.
-
Different combinations of precipitation particles were often observed simultaneously, including rimed and unrimed particles, but the actual combinations varied dramatically, including within the same event.
-
Solid precipitation particles reached the surface at temperatures up to 9 ∘C and down to 45 % relative humidity as previously reported by Harder and Pomeroy (2013).
-
Approximately 60 % of the solid precipitation particles were rimed with degree ranging from light to complete (such as snow pellets). Mixtures of rimed and unrimed particles had been observed in other regions under both near-saturated as well as dry conditions.
-
All degrees of riming were associated with both westerly and easterly flows although the nature of the conditions aloft exhibited differences. For example, particles were sometimes moving upwards at higher elevations (>4000 m a.g.l.) during westerly flow events, which would be associated with supercooled droplet formation and an ideal environment for growth by accretion. Such instances did not occur during easterly flow events but these were moister with widespread ascent, which would have led to widespread droplet formation to allow accretion.
Further investigation should be conducted. The local ridge near KES could have affected the precipitation at KES. Very high-resolution (<1 km) numerical simulations could be conducted to better understand the link between the larger-scale flow field and the interaction with the orography. Also, snowdrift was not an issue during the project as we quantified precipitation types and atmospheric conditions up to 6 km in the atmosphere. To investigate other conditions, however, snow distribution in complex terrain needs to be taken into account (Lehning et al., 2008).
To conclude, it is recognized that the field experiment occurred during an anomalous period with no major event producing tremendous amounts of precipitation. Nonetheless, considerable insight has been gained into precipitation production even though a comprehensive understanding requires the examination of all types of situations.
The dataset used to conduct this study is available through the Changing Cold Regions Network database (http://www.ccrnetwork.ca/outputs/data/; CCRN, 2018) and the corresponding author of the paper (theriault.julie@uqam.ca).
A1 Analysis of precipitation microphotography
A detailed analysis of the microphotography of solid precipitation particles was carried out and this included a classification of the type of ice crystals, their degree of riming and the atmospheric conditions in which they occurred (Hung, 2017). Microphotography of particles was performed during 7 precipitation events of the 17 precipitation events documented. Each image was analyzed using the Adobe Photoshop CS6 software. A point was placed on each ice crystal and solid precipitation particle using the “pen tool” to avoid duplication when being tallied and categorized. Overall, 1181 images were collected and analyzed. After analyzing each image, 17 504 ice crystals and solid precipitation particles were identified, with the most being collected on 4–5 April 2015.
Identified particles were organized into general categories adapted from the Kikuchi et al. (2013) classification of ice crystals and solid precipitation. For this study, irregular particles were placed into the irregular snow particle group. Particle types known as graupel-like snow and graupel particles from Kikuchi et al. (2013) were placed into a group referred to as the snow pellets category, created for this study for organizational and simplification purposes. A total of 12 categories were created, which have six types of crystal habits, whether they were rimed or not. Figure A1 illustrates the categories into which the particles were placed. For example, a rimed dendrite was placed into the category called the rimed plane crystal group.
A2 Diagnostic of precipitation types using the optical disdrometer
The type of precipitation was also diagnosed automatically using the optical disdrometer (Battaglia et al., 2010) based on the method proposed by Ishizaka et al. (2013). This technique takes into account the momentum of the particle. Further details are given in Vaquer (2017). To determine the particle type, the centre of mass flux (CMF) is computed and defined as
where r is a vector that indicates the location of each particle in the fall-speed–diameter diagram; f is the flux defined as f=mv, where m is the mass of the particle given by m(D)=cDd; and v is the fall speed, v(D)=aDb. Examples are shown in Fig. A2a and c.
The fall-speed–diameter and the mass–diameter relationships used to classify the main type of precipitation, based on the degree of riming, are given in Table A1. The main types of precipitation considered differ from those shown in Fig. A1, which are snow pellet, densely rimed aggregates (DR), rimed aggregates, dry snow and dendrites (DE). These types reflect different degrees of riming rather than the specific crystal habit that generally falls at around 1 m s−1 for any diameter. To compare the microphotography analysis and the diagnostic of precipitation type from optical sensor information, densely rimed aggregates and rimed aggregates were combined to a single category called rimed snow (RS). See Appendix B for a comparison with the manual observations and the automatic diagnostic. All the particles with a diameter <1 mm falling at <2 m s−1 were neglected to allow the calculation of CMF (Ishizaka et al., 2013). Note that Yuter et al. (2006) also neglected the lower diameter values.
As an example, Fig. A2 shows the recorded fall speed–diameter during 5 min, the computed CMF and the associated solid precipitation observed at that time. Figure A2a and c are for densely rimed aggregates and snow pellets, respectively. The sizes of particles estimated from the microphotographs corresponded well with the optical disdrometer measurements. In particular, the densely rimed aggregate had a diameter about 3 mm (Fig. A2b) and a more rimed particle had a diameter about 2 mm (Fig. A2d).
A3 Atmospheric conditions aloft
Precipitation in this region is generally formed through orographic lifting associated with an easterly flow over the lee side of the Canadian Rockies. This was, however, not always the case during March and April 2015. Most of the precipitation events (11/17) were associated with a westerly flow aloft at the KES site (Table 1).
To classify the weather events based on the flow regime, the GEM-LAM (Milbrandt et al., 2016) model simulations at 2.5 km resolution were used. A 6×6 grid point was used at a frequency output of 1 h resolution. More details are given in Vaquer (2017).
To correlate the surface weather conditions with the atmospheric conditions aloft, the data collected by the MRR2 were analyzed. The method developed by Maahn and Kollias (2012) for snow was used to process the data and to obtain the equivalent reflectivity (Ze), Doppler velocity (W) and spectral width (σ). The types of precipitation at the surface diagnosed with the optical disdrometer were then correlated with the MRR2 signals and the wind direction at 3000 m a.s.l. (above sea level). Only the events with operational optical disdrometer, MRR2 and ECCC weather station (Table 1) were used for this investigation. We used the diagnosed precipitation type instead of the microphotography to consider all precipitation types and events. A comparison between the disdrometer diagnostic and the particle microphotography was performed when solid precipitation occurred. The results are summarized in Appendix B.
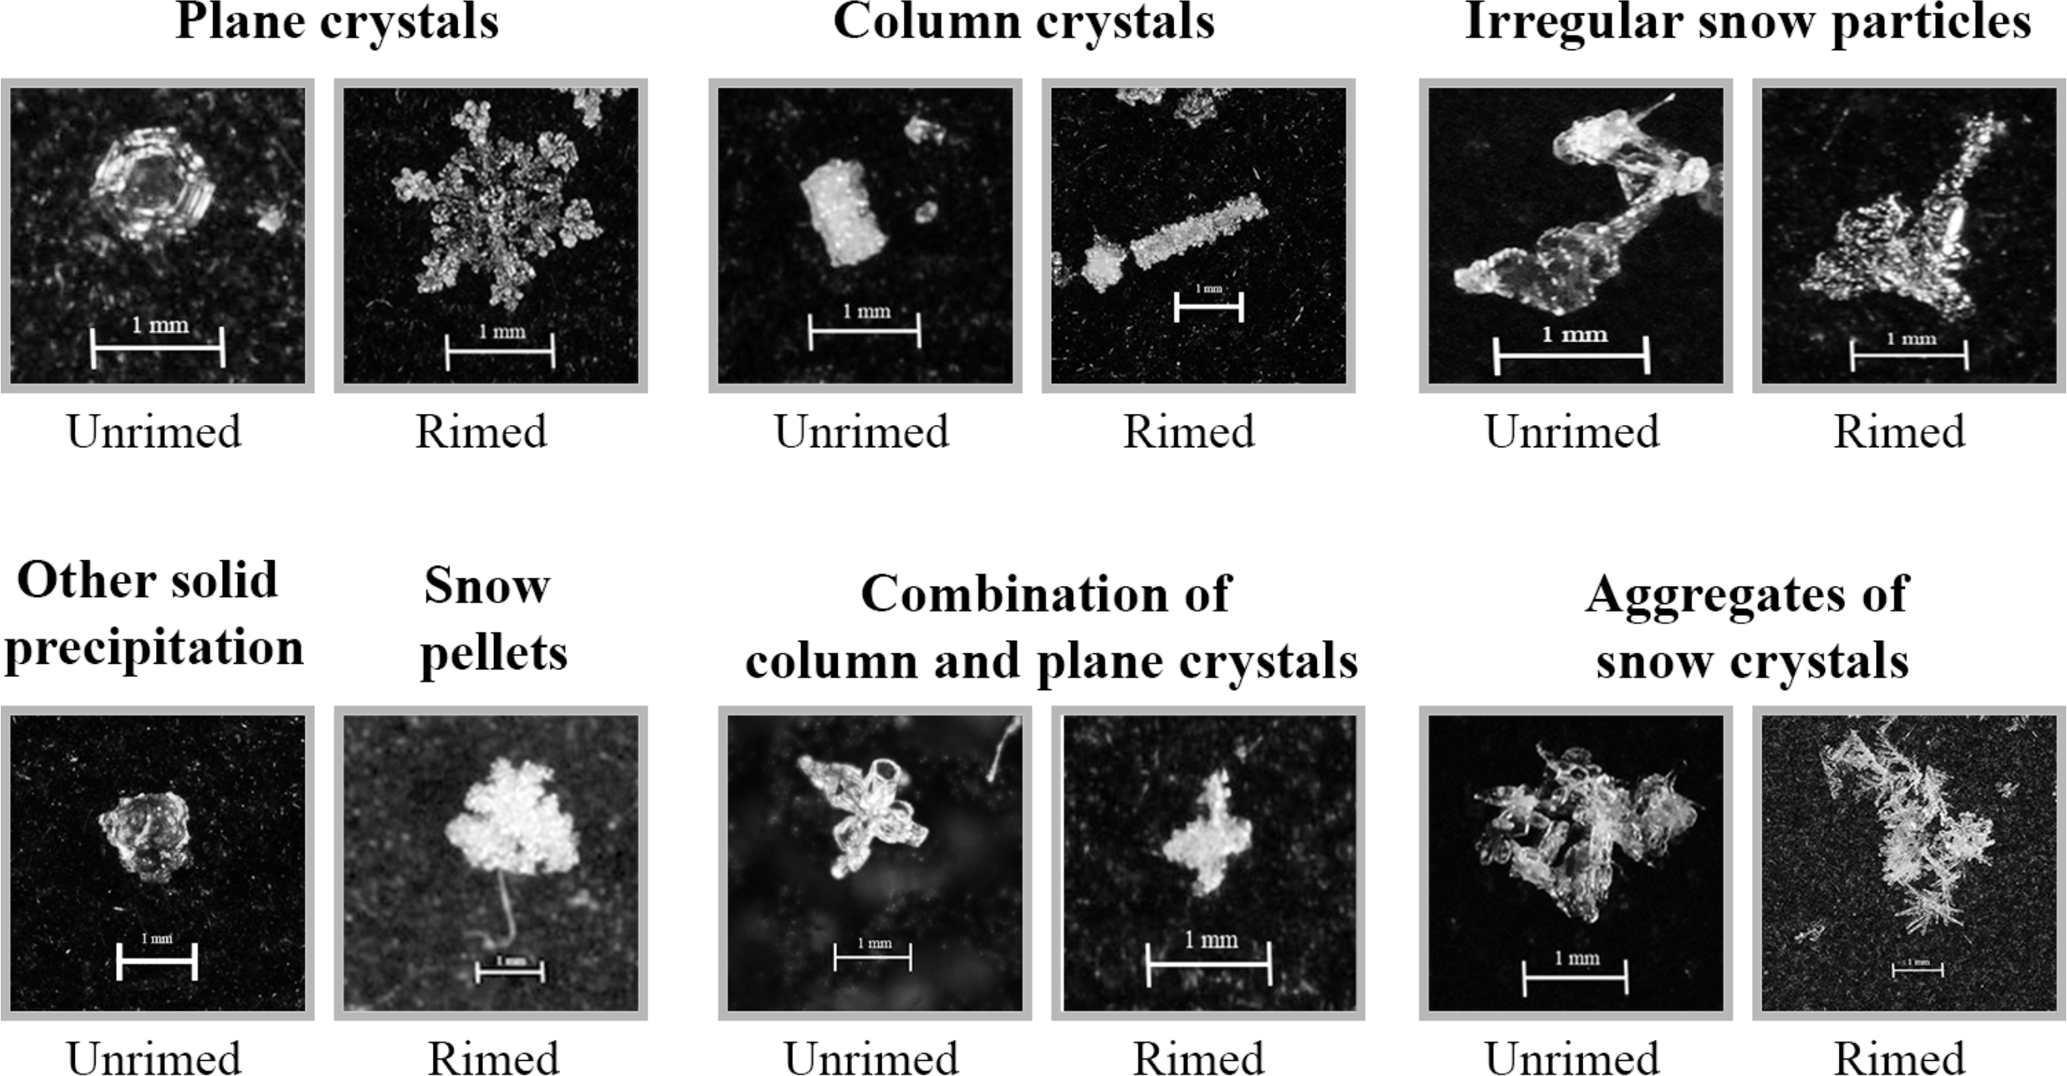
Figure A1The 12 categories of ice particles utilized in the analysis of the microphotography images. The categories are adapted from Kikuchi et al. (2013).
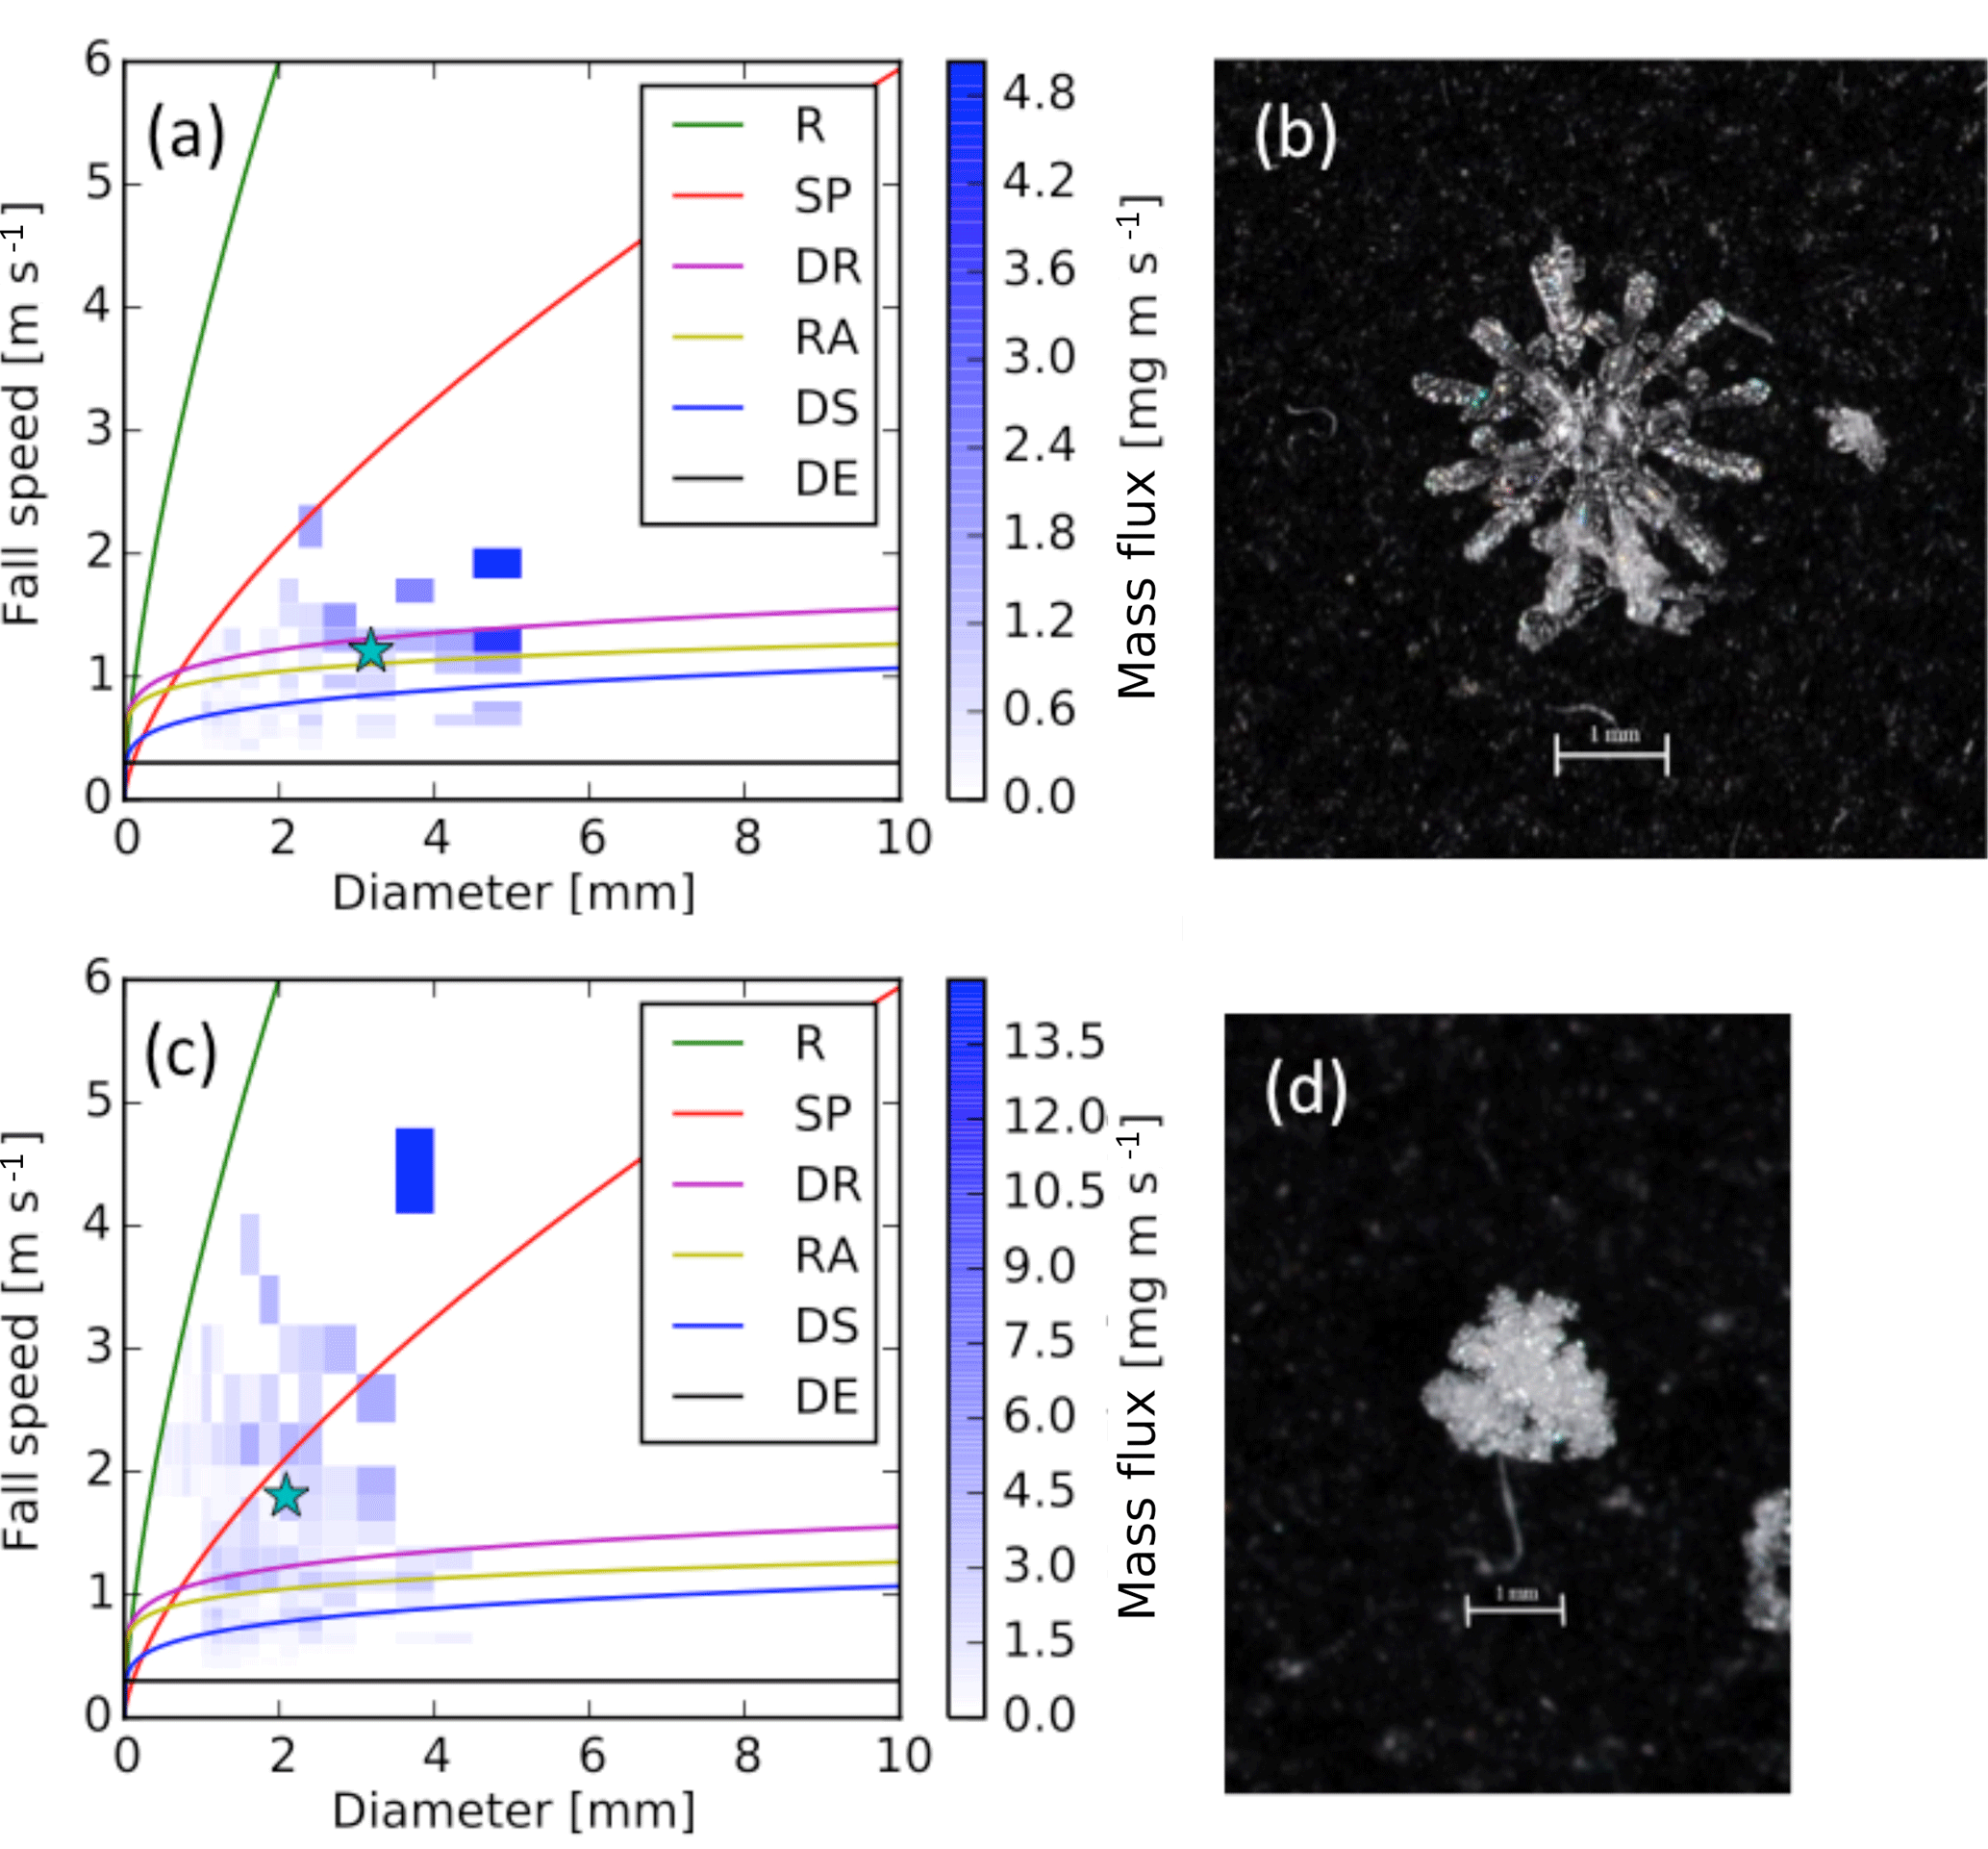
Figure A2(a, c) The 5 min average of the fall-speed–diameter distributions within which two types of snow have been diagnosed using the Ishizaka et al. (2013) method. (b, d) are the associated snowflake images, respectively. The green star indicates the CMF associated with the main type of particles. (a, b) is associated with a rimed particles and (c, d) is associated with snow pellet. The abbreviations of particle types are defined in Table A1.
Table A1Fall speed–diameter, v(D)=aDb in m s−1, and mass–diameter, m(D)=cDd in mg, used to diagnose the type of precipitation using the Ishizaka et al. (2013) method. The values are from Atlas and Ulbrich (1977), Locatelli and Hobbs (1974), Ishizaka (1995), Rasmussen et al. (1999) and Nakaya (1954), respectively. The diameter, D, is in mm.
A comparison of the precipitation observed or inferred by the optical disdrometer, manual observations and microphotography was carried out (Table B1). Although the optical disdrometer only considered specific precipitation types, the data are generally comparable to the manual observations. However, the optical disdrometer inferred rain on several instances during the 4–5 April and 11–12 April events, whereas snow was reported in the manual observations. As well, rain was inferred on 25–26 April when mixed precipitation was reported in manual observations.
The 12 categories identified in the microphotography observations were compared to the optical disdrometer precipitation types. Precipitation categories were generally comparable when both observations identified rimed and aggregated particles but not for rain events. When snow pellet, densely rimed aggregates or rimed aggregates were inferred by the optical disdrometer, microphotography identified rimed particles, rimed aggregates or snow pellets. In contrast, when the optical disdrometer inferred rain mixed with several types of ice particles, it correlated with manual observations but not always with manual photography. Overall, the optical disdrometer is reasonably comparable with both the manual and microphotography observations.
Table B1A comparison of the optical disdrometer, manual and microphotography observations over the March–April 2015 period. Events between 15 and 23 March 2015 were omitted due to missing data.
The car-sonde technique followed a similar methodology to that of the ski-sonde conducted along Whistler Mountain during the Science of Nowcasting Olympic Weather for Vancouver 2010 (Thériault et al., 2014). This technique was used to characterize the height and thickness of the melting layer only when rain was reported in the Kananaskis Valley. A handheld weather station (e.g. Kestrel 400) was attached to a stick and held outside the car while ascending the mountain road. At the same time, the exact location was tracked by a GPS and weather conditions, including precipitation types, were recorded as driving. When solid precipitation was reported, microphotography of particles was performed. The route of the car-sonde is on Fig. 1c.
JMT wrote most of the manuscript, led the field project, and the scientific study as well as conducted some analyses. IH and PV conducted most of the scientific analysis and they also participated in the field project. RES and JWP contributed scientifically through the planning of the field project and through data analysis. All authors contributed scientifically by providing comments and suggestions for the manuscript.
Author, John Pomeroy, is a guest editor of the special issue “Understanding and predicting Earth system and hydrological change in cold regions”.
This article is part of the special issue “Understanding and predicting Earth system and hydrological change in cold regions”. It is not associated with a conference.
The authors would like to thank the many people who contributed to the
successful field experiment. These are Juris Almonte, Stephen Berg,
Émilie Bresson, Mélissa Cholette, Dominic Matte, Émilie Poirier,
Housseyni Sankare, Bruce Cole, Craig Smith, May Guan, Angus Duncan,
Scott Landolt, Al Jachick and Roy Rasmussen as well as the Biogeosciences
Institute of the University of Calgary and the Kananaskis Emergency Services
Centre firefighters. We also thank Xing Fang, Centre for Hydrology, for
helping with the precipitation analysis at Marmot Creek. The research was
supported by the Changing Cold Regions Network (CCRN), which was funded by
the Natural Sciences and Engineering Research Council of Canada (NSERC),
Global Water Futures (GWF) and by the NSERC Discovery Grants of Julie M.
Thériault and Ronald E. Stewart.
Edited
by: John Hanesiak
Reviewed by: two anonymous referees
Atlas, D. and Ulbrich, C. W.: Path-and area-integrated rainfall measurement by microwave attenuation in the 1–3 cm band, J. Appl. Meteorol., 16, 1322–1331, 1977. a
Barthazy, E. and Schefold, R.: Fall velocity of snowflakes of different riming degree and crystal types, Atmos. Res., 82, 391–398, 2006. a
Battaglia, A., Rustemeier, E., Tokay, A., Blahak, U., and Simmer, C.: PARSIVEL snow observations: A critical assessment, J. Atmos. Ocean. Tech., 27, 333–344, 2010. a, b
Burford, J. and Stewart, R. E.: The sublimation of falling snow over the Mackenzie River Basin, Atmos. Res., 49, 289–314, 1998. a
CCRN (Changing Cold Regions Network): Data, available at: http://www.ccrnetwork.ca/outputs/data/, last access: 13 August 2018.
DeBeer, C. M., Wheater, H. S., Carey, S. K., and Chun, K. P.: Recent climatic, cryospheric, and hydrological changes over the interior of western Canada: a review and synthesis, Hydrol. Earth Syst. Sci., 20, 1573–1598, https://doi.org/10.5194/hess-20-1573-2016, 2016. a
Fargey, S., Hanesiak, J., Stewart, R., and Wolde, M.: Aircraft observations of orographic cloud and precipitation features over southern Baffin Island, Nunavut, Canada, Atmos. Ocean, 52, 54–76, 2014. a
Flesch, T. K. and Reuter, G. W.: WRF model simulation of two Alberta flooding events and the impact of topography, J. Hydrometeorol., 13, 695–708, 2011. a
Garrett, T. J., Fallgatter, C., Shkurko, K., and Howlett, D.: Fall speed measurement and high-resolution multi-angle photography of hydrometeors in free fall, Atmos. Meas. Tech., 5, 2625–2633, https://doi.org/10.5194/amt-5-2625-2012, 2012. a
Gibson, S. R. and Stewart, R. E.: Observations of ice pellets during a winter storm, Atmos. Res., 85, 64–76, 2007. a
Hanesiak, J. M., Stewart, R. E., Bonsal, B. R., Harder, P., Lawford, R., Aider, R., Amiro, B. D., Atallah, E., Barr, A. G., Black, T. A., Bullock, P., Brimelow, J. C., Brown, R., Carmichael, H., Derksen, C., Flanagan, L. B., Gachon, P., Greene, H., Gyakum, J., Henson, W., Hogg, E. H., Kochtubajda, B., Leighton, H., Lin, C., Luo, Y., McCaughey, J. H., Meinert, A., Shabbar, A., Snelgrove, K., Szeto, K., Trishchenko, A., van der Kamp, G., Wang, S., Wen, L., Wheaton, E., Wielki, C., Yang, Y., Yirdaw, S., and Zha, T.: Characterization and summary of the 1999–2005 Canadian Prairie drought, Atmos. Ocean, 49, 421–452, 2011. a
Harder, P. and Pomeroy, J.: Estimating precipitation phase using a psychrometric energy balance method, Hydrol. Process., 27, 1901–1914, 2013. a, b, c, d
Henson, W., Stewart, R., and Hudak, D.: Vertical reflectivity profiles of precipitation over Iqaluit, Nunavut during Autumn 2007, Atmos. Res., 99, 217–229, 2011. a, b
Houze, R. A., McMurdie, L. A., Petersen, W. A., Schwaller, M. R., Baccus, W., Lundquist, J. D., Mass, C. F., Nijssen, B., Rutledge, S. A., Hudak, D. R., Tanelli, S., Mace, G. G., Poellot, M. R., Lettenmaier, D. P., Zagrodnik, J. P., Rowe, A. K., DeHart, J. C., Madaus, L. E., Barnes, H. C., and Chandrasekar, V.: The Olympic Mountains Experiment (OLYMPEX), B. Am. Meteorol. Soc., 98, 2167–2188, 2017. a
Hudak, D., Currie, B., Stewart, R., Rodriguez, P., Burford, J., Bussières, N., and Kochtubajda, B.: Weather systems occurring over Fort Simpson, Northwest Territories, Canada, during three seasons of 1998–1999: 1. Cloud features, J. Geophys. Res., 109, 1–19, 2004. a
Hung, I.: Characteristics and formation of precipitation over the Kananaskis characteristics and formation of precipitation over the Kananaskis emergency site during March and April 2015, MS thesis, University of Manitoba, Manitoba, 2017. a
Isaac, G. A., Joe, P., Mailhot, J., Bailey, M., Bélair, S., Boudala, F., Brugman, M., Campos, E., Carpenter, R., Crawford, R. W., Cober, S., Denis, B., Doyle, C., Reeves, H., Gultepe, I., Haiden, T., Heckman, I., Huang, L., Milbrandt, J., Mo, R., Rasmussen, R., Smith, T., Stewart, R. E., and Wang, D.: Science of Nowcasting Olympic Weather for Vancouver 2010 (SNOW-V10): A World Weather Research Programme project, Pure Appl. Geophys., 171, 1–24, 2014. a
Ishizaka, M.: Measurement of falling velocity of rimed snowflakes, Seppyo, 57, 229–238, 1995. a
Ishizaka, M., Motoyoshi, H., Nakai, S., Shiina, T., Kumakura, T., and Muramoto, K.: A new method for identifying the main type of solid hydrometeors contributing to snowfall from measured size-fall speed relationship, J. Meteorol. Soc. Jpn., 91, 747–762, 2013. a, b, c, d, e, f
Kikuchi, K. and Uyeda, H.: Formation mechanisms of multibranched snow crystals (twelve-, eighteen-, twenty-four-branched crystals), Atmos. Res., 47–48, 169–179, 1998. a
Kikuchi, K., Kameda, T., Higuchi, K., and Yamashita, A.: A global classification of snow crystals, ice crystals, and solid precipitation based on observations from middle latitudes to polar regions, Atmos. Res., 132–133, 460–472, 2013. a, b, c
Klugmann, D., Heinsohn, K., and Kirtzel, H. J.: A low cost 24 GHz FM-CW Doppler radar rain profiler, Contrib. Atmos. Phys., 69, 247–253, 1996. a
Kochtubajda, B., Stewart, R. E., Boodoo, S., Thériault, J. M., Li, Y., Liu, A., Mooney, C., Goodson, R., and Szeto, K.: The June 2013 Alberta catastrophic flooding event – Part 2: Fine-scale precipitation and associated features, Hydrol. Process., 30, 4917–4933, 2016. a
Lehning, M., Löwe, H., Ryser, M., and Raderschall, N.: Inhomogeneous precipitation distribution and snow transport in steep terrain, Water Resour. Res., 44, 1–19, 2008. a
Liu, A. Q., Mooney, C., Szeto, K., Thériault, J. M., Kochtubajda, B., Stewart, R. E., Boodoo, S., Goodson, R., Li, Y., and Pomeroy, J.: The June 2013 Alberta catastrophic flooding event: Part 1 – Climatological aspects and hydrometeorological features, Hydrol. Process., 30, 4899–4916, 2016. a, b
Locatelli, J. D. and Hobbs, P. V.: Fall speeds and masses of solid precipitation particles, J. Geophys. Res., 86, 2185–2197, 1974. a
Maahn, M. and Kollias, P.: Improved Micro Rain Radar snow measurements using Doppler spectra post-processing, Atmos. Meas. Tech., 5, 2661–2673, https://doi.org/10.5194/amt-5-2661-2012, 2012. a, b
Matsuo, T., Sasyo, Y., and Sato, T.: Relationship between types of precipitation on the ground and surface meteorological elements, J. Meteorol. Soc. Jpn., 59, 462–476, 1981. a
Milbrandt, J. A. and Yau, M. K.: A multi-moment bulk microphysics parameterization. Part I: Analysis of the role of the spectral shape parameter, J. Atmos. Sci., 62, 2051–3064, 2005a. a
Milbrandt, J. A. and Yau, M. K.: A multimoment bulk microphysics parameterization. Part II: A proposed three-moment closure and scheme description, J. Atmos. Sci., 62, 3065–3081, 2005b. a
Milbrandt, J. A., Bélair, S., Faucher, M., Vallée, M., Carrera, M. L., and Glazer, A.: The Pan-Canadian high resolution (2.5 km) deterministic prediction system, Weather Forecast., 31, 1791–1816, 2016. a, b
Nakaya, U.: Snow crystal natural and artificial, Harvard University Press, Cambridge, 510 pp., 1954. a
Peterson, T. C., Yeh, J. D., and Cotton, W. R.: Manual for snowflake observation, identification, and replication, Tech. rep., Dept. of Atmospheric Science, Colorado State University, Colorado, 1986. a
Pomeroy, J. W., Fang, X., and Ellis, C.: Sensitivity of snowmelt hydrology in Marmot Creek, Alberta, to forest cover disturbance, Hydrol. Process., 26, 1891–1904, 2012. a
Pomeroy, J. W., Stewart, R. E., and Whitfield, P. H.: The 2013 flood event in the South Saskatchewan and Elk River basins: Causes, assessment and damages, Can. Water Resour. J., 41, 105–117, 2016. a, b, c, d
Praz, C., Roulet, Y.-A., and Berne, A.: Solid hydrometeor classification and riming degree estimation from pictures collected with a Multi-Angle Snowflake Camera, Atmos. Meas. Tech., 10, 1335–1357, https://doi.org/10.5194/amt-10-1335-2017, 2017. a
Rasmussen, R. M., Vivekanandan, J., Cole, J., Meyers, B., and Masters, C.: The estimation of snowfall rate using visibility, J. Appl. Meteorol. Clim., 38, 1542–1563, 1999. a
Sankaré, H. and Thériault, J. M.: On the relationship between the snowflake type aloft and the surface precipitation types at temperatures near 0 ∘C, Atmos. Res., 180, 287–296, 2016. a, b, c, d, e, f, g
Shook, K.: The 2005 flood events in the Saskatchewan River Basin: Causes, assessment and damages, Can. Water Resour. J., 41, 94–104, 2016. a
Smith, C. D.: The Relationship between Monthly Precipitation and Elevation in the Alberta Foothills during the foothills orographic precipitation experiment, in: Cold region atmospheric and hydrologic studies, The Mackenzie GEWEX Experience, edited by: Woo, M., Chapter 10, Springer, Berlin, Heidelberg, 2008. a
Smith, G.: Correcting the wind bias in snowfall measurements made with a Geonor T-200B precipitation gauge and Alter wind shield, in: Proc. 14th AMS Symposium on Meteorological Observations and Instrumentation, San Anotnio, 2007. a, b
Steiner, M., Bousquet, O., Houze Jr., R. A., Smull, B. F., and Mancini, M.: Airflow within major Alpine river valleys under heavy rainfall, Q. J. Roy. Meteorol. Soc., 129, 411–431, 2003. a
Stewart, R. E., Burford, J. E., Hudak, D. R., Currie, B., Kochtubajda, B., Rodriguez, P., and Liu, J.: Weather systems occurring over Fort Simpson, Northwest Territories, Canada, during three seasons of 1998–1999: 2. Precipitation features, J. Geophys. Res., 109, 1–19, 2004. a
Stewart, R. E., Thériault, J. M., and Henson, W.: On the characteristics of and processes producing winter precipitation types near 0 ∘C, B. Am. Meteorol. Soc., 96, 623–639, 2014. a, b
Stoelinga, M. T., Stewart, R. E., Thompson, G., and Thériault, J. M.: Chapter 7: Microphysical processes within winter orographic cloud and precipitation systems, Mountain Weather Research and Forecasting: Recent progress and current challenges, Springer Netherlands, 345–408, 2013. a
Thériault, J. M. and Stewart, R. E.: A parameterization of the microphysical processes forming many types of winter precipitation, J. Atmos. Sci., 67, 1492–1508, 2010. a
Thériault, J. M., Stewart, R. E., and Henson, W.: On the dependence of winter precipitation types on temperature, precipitation rate, and associated features, J. Appl. Meteorol. Clim., 49, 1429–1442, 2010. a
Thériault, J. M., Rasmussen, R., Ikeda, K., and Landolt, S.: Dependence of snow gauge collection efficiency on snowflake characteristics, J. Appl. Meteorol. Clim., 51, 745–762, 2012. a
Thériault, J. M., Rasmussen, K. L., Fisico, T., Stewart, R. E., Joe, P., Gultepe, I., Clément, M., and Isaac, G. A.: Weather observations on Whistler Mountain during five storms, Pure Appl. Geophys., 171, 129–155, 2014. a, b, c
Vaquer, P.: Caractéristiques des précipitations hivernales et des conditions atmosphériques sur la face orientale des Rocheuses canadiennes de l'Alberta, MS thesis, Universite du Quebec a Montreal, 2017. a, b, c
Yuter, S., Kingsmill, D., Nance, L. B., and Loffler-Mang, M.: Observations of precipitation size and fall speed characteristics within coexisting rain and wet snow, J. Appl. Meteorol. Clim., 45, 1450–1464, 2006. a
- Abstract
- Introduction
- Overview of the field experiment
- Documented weather events
- Precipitation characteristics at the surface
- Precipitation processes aloft
- Perspectives
- Conclusions
- Data availability
- Appendix A: Data analysis
- Appendix B: Comparison of precipitation type and particles
- Appendix C: Description of the technique to measure temperature and precipitation along the mountainside (car-sonde)
- Author contributions
- Competing interests
- Special issue statement
- Acknowledgements
- References