the Creative Commons Attribution 4.0 License.
the Creative Commons Attribution 4.0 License.
 | 28 Aug 2018
Evaluation of multiple climate data sources for managing environmental resources in East Africa
Solomon Hailu Gebrechorkos
Stephan Hülsmann
Christian Bernhofer
Managing environmental resources under conditions of climate change and extreme climate events remains among the most challenging research tasks in the field of sustainable development. A particular challenge in many regions such as East Africa is often the lack of sufficiently long-term and spatially representative observed climate data. To overcome this data challenge we used a combination of accessible data sources based on station data, earth observations by remote sensing, and regional climate models. The accuracy of the Africa Rainfall Climatology version 2.0 (ARC2), Climate Hazards Group InfraRed Precipitation (CHIRP), CHIRP with Station data (CHIRPS), Observational-Reanalysis Hybrid (ORH), and regional climate models (RCMs) are evaluated against station data obtained from the respective national weather services and international databases. We did so by performing a comparison in three ways: point to pixel, point to area grid cell average, and stations' average to area grid cell average over 21 regions of East Africa: 17 in Ethiopia, 2 in Kenya, and 2 in Tanzania. We found that the latter method provides better correlation and significantly reduces biases and errors. The correlations were analysed at daily, dekadal (10 days), and monthly resolution for rainfall and maximum and minimum temperature (Tmax and Tmin) covering the period of 1983–2005. At a daily timescale, CHIRPS, followed by ARC2 and CHIRP, is the best performing rainfall product compared to ORH, individual RCMs (I-RCM), and RCMs' mean (RCMs). CHIRPS captures the daily rainfall characteristics well, such as average daily rainfall, amount of wet periods, and total rainfall. Compared to CHIRPS, ARC2 showed higher underestimation of the total (−30 %) and daily (−14 %) rainfall. CHIRP, on the other hand, showed higher underestimation of the average daily rainfall (−53 %) and duration of dry periods (−29 %). Overall, the evaluation revealed that in terms of multiple statistical measures used on daily, dekadal, and monthly timescales, CHIRPS, CHIRP, and ARC2 are the best performing rainfall products, while ORH, I-RCM, and RCMs are the worst performing products.
For Tmax and Tmin, ORH was identified as the most suitable product compared to I-RCM and RCMs. Our results indicate that CHIRPS (rainfall) and ORH (Tmax and Tmin), with higher spatial resolution, should be the preferential data sources to be used for climate change and hydrological studies in areas of East Africa where station data are not accessible.
- Article
(6519 KB) -
Supplement
(2104 KB) - BibTeX
- EndNote


In Sub-Saharan Africa (SSA) about 80 % of people living in poverty will continue to depend on the agriculture sector as their major income sources under continuing global change (Dixon et al., 2001; IFPRI, 2009). Unlike in other regions of the world, agricultural activities in SSA are marked by low production, mainly due to poor natural resource management, rainfall amount and variability, economy, and technologies. According to IFPRI (2009), reducing poverty in SSA is becoming more challenging due to rapid population growth and associated decline in the quality and availability of environmental resources (e.g. water and soil). Additionally, food security and livelihoods of people are threatened by the direct impacts of change in climate such as the increasing frequency of extreme events and weather variability impacts on the production and productivity of agricultural lands (Malo et al., 2012). In general, the impact of climate change in Africa ranges from social and economic to health, water, and food security, which is a threat to the lives of Africans (Urama and Ozor, 2010; Gan et al., 2016).
These challenges outlined hold in particular for the eastern parts of SSA, including Ethiopia, Kenya, and Tanzania. The population (> 80 %) mainly depends on agriculture for their livelihood in this region and agriculture-based income contributes 40 % to the country's gross domestic product (GDP) (FAO, 2014). Observed changes in extreme climate events such as recurring droughts and floods have a tremendous impact on the socio-economy of the region (Gebrechorkos et al., 2018). Devastating droughts in SSA linked to the high variability (seasonal and inter-annual) of rainfall (Sheffield et al., 2013) are projected to increase in frequency (IPCC, 2007, 2014; Niang et al., 2014). In addition to the projected impact, the region is already facing significant food security issues and natural-resource-based clashes (UNEP, 2011; World Bank, 2012).
The impacts of future climate change in East Africa vary from region to region. In order to understand the impacts of future climate at the regional and local scale, ground station data with high spatial and temporal resolution are crucial. Regions with poor ground observations are highly vulnerable to climate threats (Wilby and Yu, 2013), which holds particularly for developing countries. In Africa, high-quality climate data from meteorological field stations are scarce (Dinku et al., 2013) and inconsistencies exist between other data products, largely due to a limited number of ground stations, merging and interpolation methods (Huffman et al., 2009; Nikulin et al., 2012; Sylla et al., 2013), limited time resolution, and limited documentation quality. In addition, climate data with high temporal and spatial resolution, even if collected by the national meteorological agencies, are often not available due to data sharing policies. With advancements of technologies and research activities, a number of climate data products from different sources (remote sensing, climate model, and reanalysis) have been produced over the last decades that can fill the data gap particularly for drought-prone regions (Gan et al., 2016) and can be used for hydrological and climate change studies.
Several satellite-based rainfall estimates have been developed over the last decades (Sapiano and Arkin, 2009; Zambrano-Bigiarini et al., 2017). In Africa, a list of rainfall and temperature products are available that can be used for climate change studies, such as the African Rainfall Climatology version 2.0 (ARC2) from the Climate Prediction Center (CPC) of the National Oceanic and Atmospheric Administration (NOAA) with a spatial resolution of 0.1∘ (Novella et al., 2013) and Climate Hazards Group InfraRed Precipitation (CHIRP), and CHIRP with Station data (CHIRPS) from the Climate Hazard Group (CHG) with a spatial resolution of 0.05∘ (Funk et al., 2015). In addition, the Multi-Source Weighted-Ensemble Precipitation (MSWEP) (Beck et al., 2017), Tropical Applications of Meteorology using Satellite and ground-based observations (TAMSAT) (Tarnavsky et al., 2014), TAMSAT African Rainfall Climatology And Time series (TARCAT) (Maidment et al., 2014), and data from the Enhancing National Climate Services (ENACTS) initiative (Dinku et al., 2014) are available at varying spatial and temporal resolutions and for longer periods.
As another source of climate information, climate model-derived data are suitable tools for assessing climate variability and change. Globally, reanalysis-based climate products, such as the Observational Reanalysis Hybrid (Sheffield et al., 2006), Modern-Era Retrospective analysis for Research and Applications version 2 (MERRA-2) (Gelaro et al., 2017), and Climate Forecast System Reanalysis (CFSR) (Saha et al., 2010), are widely used for climate and hydrological studies. Moreover, dynamically downscaled data from global climate models (GCMs) are widely used in regional- and local-scale climate studies. Regional climate models (RCMs) produced from dynamically downscaled GCMs provide spatial resolutions that suit end users (Sun et al., 2006). However, downscaling of climate information from GCMs to assess the impact of climate change on environmental resources at regional or smaller scale has only recently been performed, e.g. as dynamical downscaling within the CORDEX community (CORDEX-Africa; see e.g. Abiodun et al., 2016). In Africa (CORDEX-Africa domain) the spatial resolution of RCMs is available at about 0.44∘ (∼50 km) and at varying temporal resolutions. In East Africa, a number of studies have been done with the applications of RCMs for climate studies (Anyah and Semazzi, 2006, 2007; Diro et al., 2011; Endris et al., 2013; Segele et al., 2009).
Before being used as input to different climate or hydrological models, climate data products need to be evaluated against field-based meteorological stations. For studying climate change and climate extremes, data with high accuracy and from long periods (> 30 years) are required. In addition, current hydrological (e.g. Soil and Water Assessment Tool, SWAT; Neitsch et al., 2002) and climate models (e.g. Statistical DownScaling Model, SDSM; Wilby and Dawson, 2004) require daily time series of rainfall and temperature covering long periods. Considering these requirements, concerning lengths of time series and temporal resolution on the one hand and the limited availability of station data on the other hand, it is not surprising that comprehensive evaluations of climate data products, particularly on a daily timescale, are not available for East Africa to the best of our knowledge. However, a few studies are available based on monthly gridded data (e.g. Cattani et al., 2016; Kimani et al., 2017), for limited time periods. Moreover, Kimani et al. (2017) only considered CHIRPS, while a more comprehensive evaluation and comparison of different data sources would be highly desirable. Based on the data requirements of impact models, the climate data products to be included in such an evaluation should be selected or excluded based on high spatial and temporal (i.e. daily) resolution, quality (missing values), and temporal coverage (length of time series), while also taking the results from previous studies (e.g. Cattani et al., 2016; Bayissa et al., 2017; Kimani et al., 2017) in to account.
Therefore, this study aims at comparing and evaluating the available climate data products for Ethiopia, Kenya, and Tanzania at the highest possible spatial and temporal (i.e. daily, for reasons of comparability extended also to dekadal and monthly) resolution against station data using the most widely applied and accepted statistical and graphical evaluation methods. Results of our study will help overcome the data scarcity in the study area, in terms of spatial coverage and temporal resolution gaps of daily, dekadal, and monthly climate data products that can be used for hydrological and climate change and impact studies at a watershed or regional scale. In addition, the data sets can be used for local and regional climate projections using climate models, such as the Statistical DownScaling Model (SDSM) (Wilby and Dawson, 2004).
2.1 Study region
The study focuses on the evaluation of daily, dekadal, and monthly climate data sources for regions of East Africa, particularly Ethiopia, Kenya, and Tanzania (Fig. 1). The region is divided by the Great Rift Valley and is topographically one of the most diverse and complex parts of Africa, characterized by multiple rainfall regimes. Generally, the rainfall cycle (climatological annual cycle) in East Africa is linked to the position changes of the intertropical convergence zone (ITCZ) (Endris et al., 2013). Variability in the rainfall patterns in this region is partly induced by local factors such as the heterogeneity of the land surface and complex topography and their interaction with global climate forcing systems. Countries of the region face similar weather and climate variabilities (spatial and temporal variabilities) and increasing temperature and decreasing precipitation trends (Pricope et al., 2013). In addition, all East African countries face similar issues, such as frequent droughts, floods, poverty, and a lack of clean and adequate water supply. The conditions could worsen in the near future due to climate change; therefore, sustainable adaptation and mitigation strategies are required, which rely on advanced climate and hydrological models and the respective data inputs.
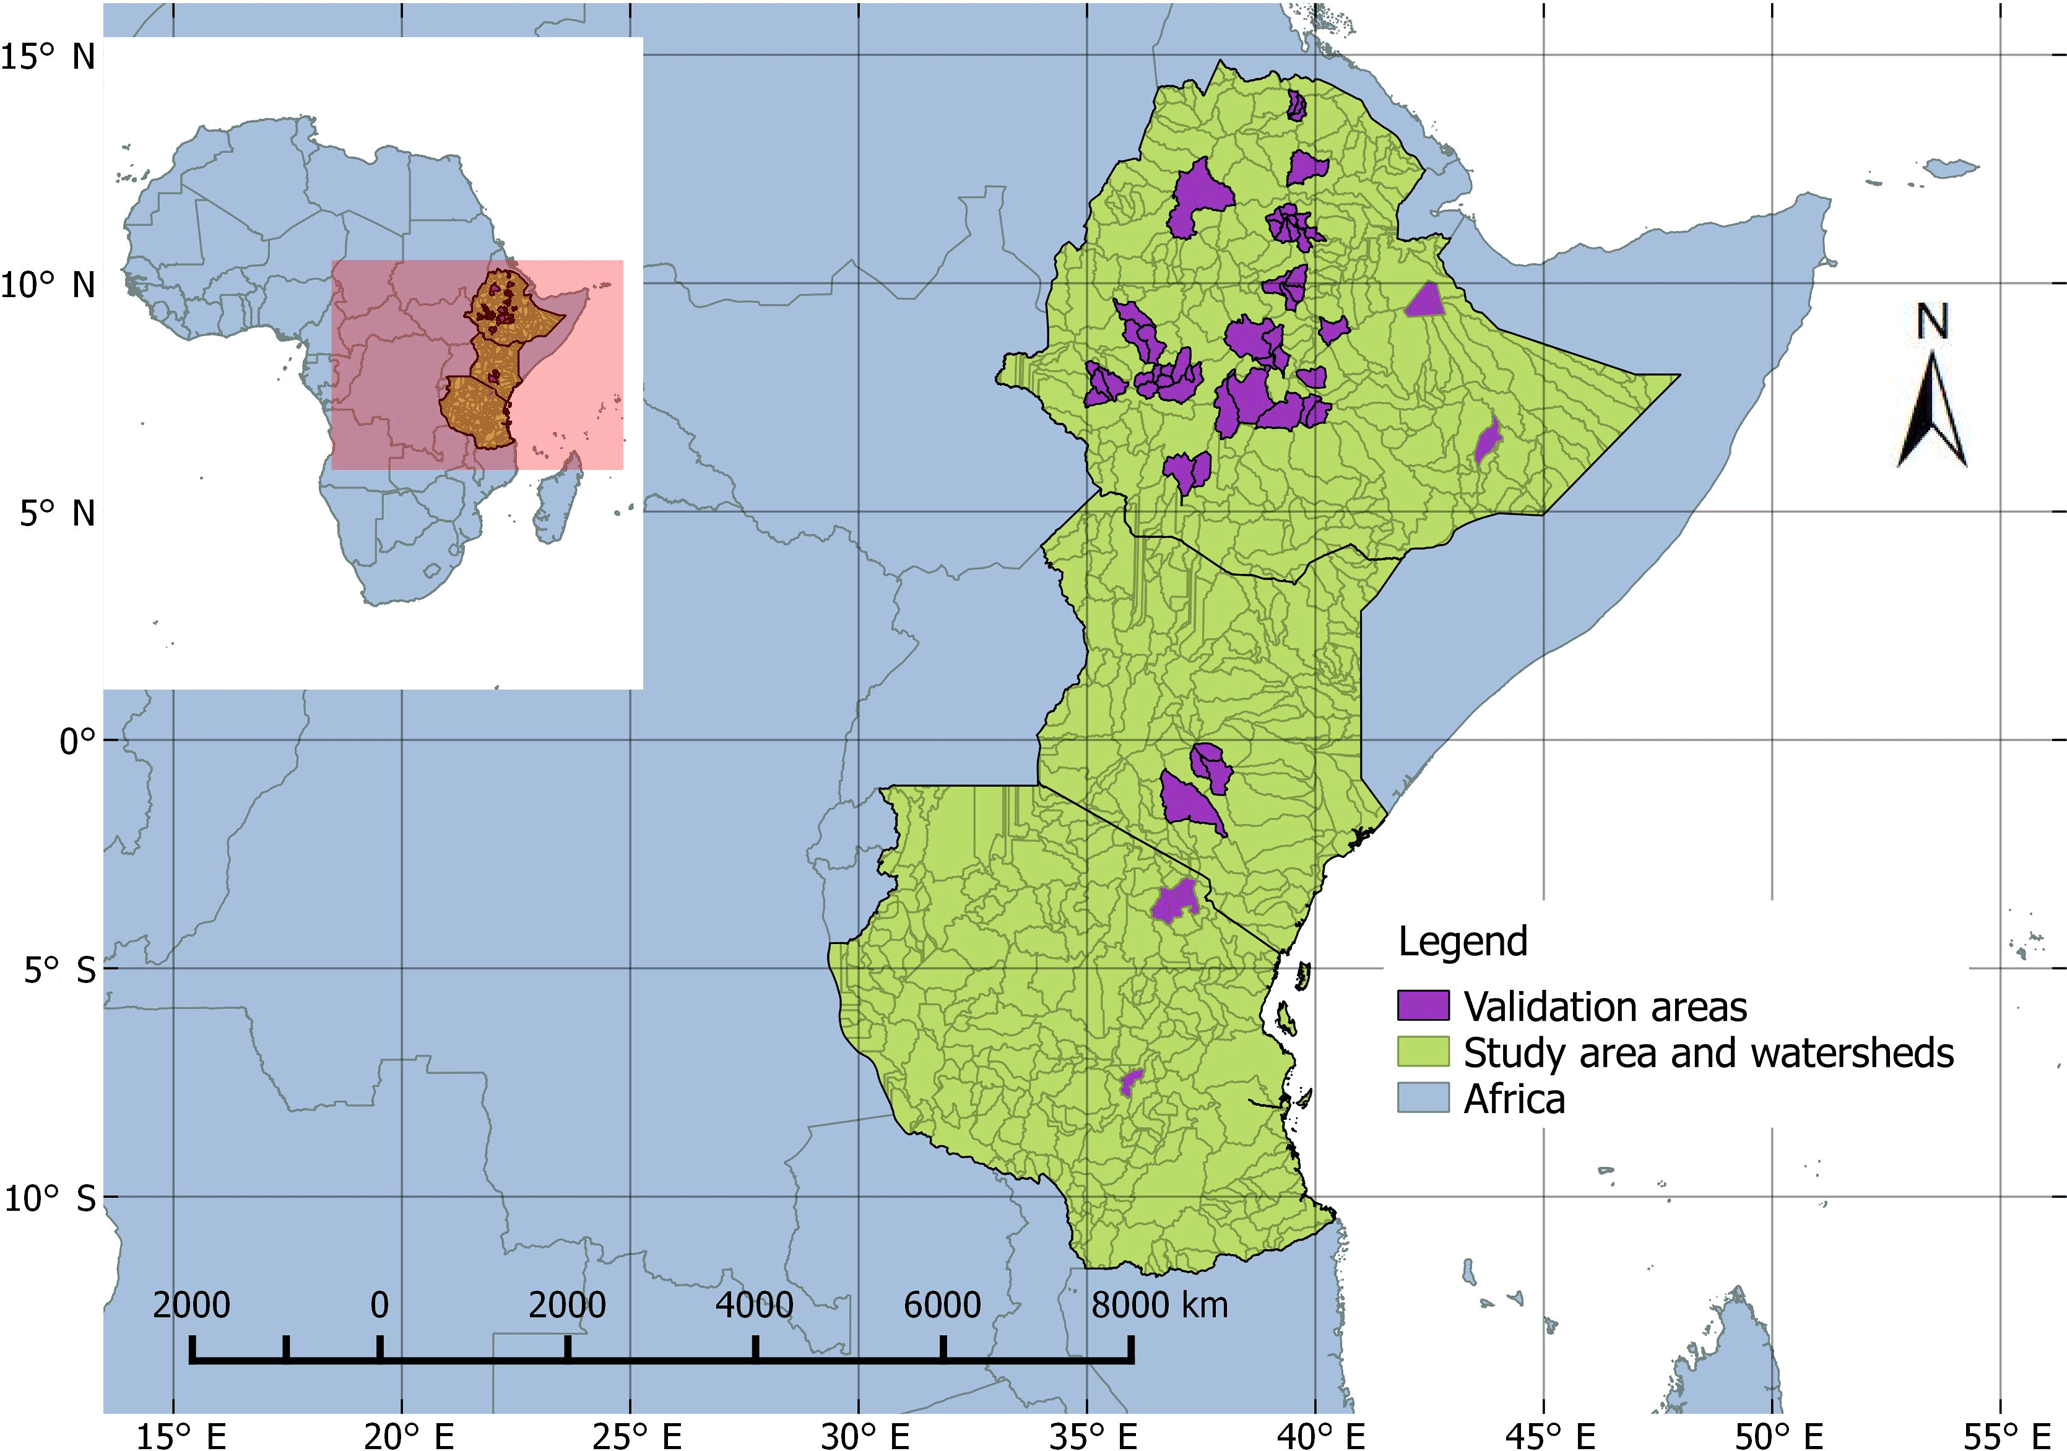
Figure 1Map of Africa and study regions (Ethiopia, Kenya, and Tanzania) with data validation areas (EthioShed1–17, KenShed1 and 2, and TanzShed1&2). The basins are retrieved from the WaterBase global data portal (http://www.waterbase.org/, last access: 18 January 2017).
2.2 Data sets
The reference data sets used for the evaluation of multiple data products in this study are based on daily rainfall, maximum temperature (Tmax), and minimum temperature (Tmin) derived from 332 rain gauges and synoptic stations. Station data for Ethiopia were provided by the National Meteorological Agency (NMA) of Ethiopia for the period 1954–2016. The daily data provided by NMA were carefully and extensively checked for their quality and some missing data were filled in from hard copies. For Kenya and Tanzania, the global summary of the day available at the National Climate Data Center (NCDC) (https://www.ncdc.noaa.gov/, last access: 14 March 2017) is used. For evaluation, based on the criteria outlined above, we considered satellite-based rainfall estimates, Observational-Reanalysis Hybrid (ORH), and a historical period of RCMs driven by GCMs to be compared against field-based meteorological stations. The three satellite-based rainfall estimates fulfilling all criteria are the African Rainfall Climatology Version 2.0 (ARC2) (Novella et al., 2013), the Climate Hazards Group InfraRed Precipitation (CHIRP) and CHIRP with Station data version 2 (CHIRPS) (Funk et al., 2015). Not included was, for example, TAMSAT, which is available at higher spatial and temporal resolution and for a longer time period but contains considerable data gaps (Maidment et al., 2017, https://icdc.cen.uni-hamburg.de/1/daten/atmosphere/tamsat-rainfall-africa/, last access: 7 January 2017) during the evaluation period. ENACTS and TARCAT are available only on dekadal (10 days) timescales. In addition, MERRA-2 and CFS-R are not included in this study due to their coarse spatial resolution compared to the other reanalysis products (i.e. ORH).
ARC2 is the second version of the ARC and is compatible with the algorithm of the Rainfall Estimation Version 2 (RFE 2.0) (Novella et al., 2013). The product is a composite of 3-hourly geostationary infrared data, which makes it different from RFE, centred over Africa provided by the European Organization for the Exploitation of Meteorological Satellites (EUMETSAT) and quality-controlled daily rainfall records acquired from the Global Telecommunication System (GTS) gauges. ARC2 is consistent with the historical data sets of the Climate Prediction Center Merged Analysis of Precipitation (CMAP) (Xie and Arkin, 1997) and Global Precipitation Climatology Project (GPCP) (Novella et al., 2013). The data set is updated regularly and it is available at a spatial resolution of 0.1∘ covering the period from 1983 to present. ARC2 is available at the International Research Institute climate data library (IRI/LDEO, 2016).
CHIRPS is a semi-global rainfall product designed for drought monitoring and global environmental changes (Funk et al., 2015). The product provides daily, pentadal, dekadal, and monthly data at a 0.05∘ spatial resolution available at the Climate Hazards Group (CHG; ftp://ftp.chg.ucsb.edu/pub/org/chg/products) and the International Research Institute climate data library (IRI/LDE, 2016). CHIRPS combines a 0.05∘ resolution of satellite images and data from ground stations to form a gridded rainfall time series. Station data (see also below) are used to produce a preliminary 2-day rainfall product by blending data from sparsely located GTS gauges with rainfall estimates retrieved from the cold cloud duration (CCD) at every pentad. In addition, the final product is developed by blending the best available monthly and pentadal station data with the monthly and pentadal rainfall estimates retrieved from the CCD, respectively, to produce a gridded rainfall product (Funk et al., 2015). The development process of CHIRPS includes the 0.05∘ monthly precipitation climatology (CHPclim), satellite-only Climate Hazards Group InfraRed Precipitation (CHIRP), and station blending techniques. CHIRP is available at the Climate Hazards Group (CHG, 2017). The second version of CHIRPS, which is updated regularly, provides an improved daily rainfall time series (1981–present) with a spatial resolution of 0.05∘ ranging from 50∘ S to 50∘ N (and all longitudes) (Funk et al., 2015). The development process of CHIRPS and its application in drought monitoring in Africa (e.g. Ethiopia) is explained in detail by Funk et al. (2015). CHIRPS is not only used for drought monitoring, but also for other global environmental applications (Zambrano-Bigiarini et al., 2017), water resource management, and climate dynamics (Ceccherini et al., 2015; Deblauwe et al., 2016). ORH is a global (Sheffield et al., 2006) and regional (Northern/West/East Africa) (Chaney et al., 2014) 3-hourly, daily, and monthly meteorological data set covering the period between 1901 and 2012. ORH is developed by a spatial downscaling of the NCEP–NCAR reanalysis (Kalnay et al., 1996) up to a spatial resolution of 0.1∘ using a bilinear interpolation. ORH merges multiple data products such as the NASA Langley Surface Radiation Budget (SRB), the monthly temperature data from the University of East Anglia Climate Research Unit (CRU), Tropical Rainfall Measuring Mission Multi-satellite Precipitation Analysis (TMPA) (Huffman et al., 2007), and other observational-based rainfall products (Chaney et al., 2014). The spatial downscaling of ORH is done with the inclusion of changes in elevation and it is evaluated against ground stations (global summary of the day) available at the US National Climatic Data Center (NCDC). ORH is corrected for temporal inhomogeneity and biases, and random errors are omitted through assimilation with quality-controlled and gap-filled ground station data available at NCDC (https://www.ncdc.noaa.gov/, last access: 28 March 2017) as a global summary of the day (Chaney et al., 2014). These data are freely available from the Terrestrial Hydrology Research Group, Princeton University (http://hydrology.princeton.edu, last access: 12 May 2016; Terrestrial Hydrology Research Group Princeton University, 2016). Even though ORH is not updated regularly, it has been widely used in climate and hydrological studies (e.g. Troy et al., 2011; Wang et al., 2011; Demaria et al., 2012; Sheffield et al., 2014)
Compared to the other rainfall products, monthly ground station data from Ethiopia, Kenya, and Tanzania are included in CHIRPS. Evaluating CHIRPS based on ground station data might thus raise concerns about the independence of data. However, not all stations used in this study are included in CHIRPS and in general the stations are not consistently used in the development process of CHIRPS. In addition, the station data used in CHIRPS are mainly a monthly total from a limited number of stations. For example, in Ethiopia, where all station data originate from NMA, during January 1983–February 1983 and August 2005–December 2005, the monthly stations used in CHIRPS declined from 139 to 132 and from 175 to 169, respectively. In 2015, the number of stations included in CHIRPS even declined to below 10. Moreover, in Kenya and Tanzania, during the period of January 1983–December 2005 the number of stations used in CHIRPS declined from 142 to 62 and from 171 to 55, respectively (ftp://chg-ftpout.geog.ucsb.edu/pub/org/chg/products/CHIRPS-2.0/diagnostics/). Besides the difference in temporal resolution (monthly vs. daily) and the number of stations between station data included in CHIRPS and the validation data set, the latter deviated from the former since we used original data provided by NMA (Ethiopia) which were quality-controlled and extended by adding data from hard copies. Overall, while not fully independent, the relation between CHIRPS and the validation data set should be weak, besides the fact that there is no other (fully independent) validation data set available.
Historical data (control model runs) of the CORDEX RCMs are also used as a potential source for rainfall, Tmax, and Tmin data. RCMs are climate models with a higher spatial resolution compared to GCMs. The driving data of RCMs are derived from GCMs or reanalysis data and can include greenhouse gases (GHGs) and aerosol forcing. Compared to GCMs, RCMs consider local factors such as complex topography and land cover inhomogeneity in a physically based manner (IPCC, 2007). In Africa, dynamical downscaling was performed in a large effort within the CORDEX community (CORDEX-Africa). Within CORDEX-Africa the continent's climate was dynamically modelled by an international consortium, providing a spatial resolution of about 50 km. According to the IPCC report (2007), RCMs can be used for a wide range of applications such as climate change studies. Following the recommendation of Endris et al. (2015), the historical data derived from two CORDEX RCMs, RCA (Samuelsson et al., 2011), and COSMO-CLM or CCLM (Baldauf et al., 2011), driven by HadGEM2-ES (MOHC, United Kingdom), MPI-ESM-LR (MPI, Germany), and GFDL-ESM2M (NOAA/GFDL, United States) are used. Rainfall, Tmax, and Tmin products of both RCMs are retrieved from the Earth System Grid Federation (ESGF, 2016) data portal.
3.1 Selection of validation areas and ground stations
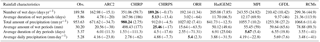
The evaluation of multiple daily, dekadal (10 days), and monthly rainfall, Tmax, and Tmin products were conducted for selected basins of Ethiopia (EthioShed1–EthioShed17), Kenya (KenShed1 and KenShed2), and Tanzania (TanzShed1 and TanzShed2) (Fig. 1). The polygons in Fig. 1 are river basins retrieved from the global river basins available in the WaterBase data portal hosted by the United Nations University (UNU-INWEH: http://www.waterbase.org/, last access: 18 January 2017). In most regions of Africa not only are the density and availability of field-based meteorological stations limited, but their accessibility is very restricted for many reasons. For this study, it was only possible to get daily station data from the National Meteorological Agency (NMA) of Ethiopia with a reasonable spatial and temporal coverage. Therefore, the selection of validation areas is based on the availability, quality, and density of field-based meteorological stations during the period of 1983–2005. It was almost impossible to find multiple stations in one satellite grid cell. For Kenya and Tanzania, therefore, stations with more than 10 years (> 50 % of the study period) were included for evaluation (Table 1).
Table 1General characteristics of selected validation areas and meteorological stations covering the time period 1983–2005.
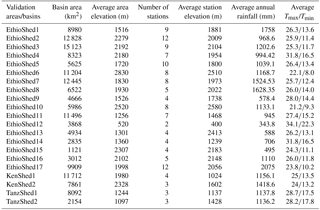
The quality of selected stations was checked and extremely high rainfall records during dry seasons, such as daily rainfall of > 480 mm preceding and following dry days, were excluded. Finally, a total of 132 stations were found suitable for comparison, 2 to 12 stations located in the validation areas. In addition to these stations in the validation areas, 78 stations, randomly distributed over the region, are used to compare on an individual basis with the rainfall and temperature products. Compared to Kenya and Tanzania, the quality, continuity, and spatial and temporal coverage of stations were better in Ethiopia and only stations with missing values of less than 20 % were considered. The availability of multiple stations in a validation area helps to check the quality of individual stations by using methods such as the double mass curve (Vernimmen et al., 2012) and allows for replacement of missing values of one station from a nearby station.
3.2 Comparing ground data with satellite, observational reanalysis, and climate model-based data
The most commonly used method to compare ground observations with other data products such as satellite-based rainfall estimates and climate model outputs is point (station) to pixel comparison. When comparing daily rainfall, particularly in very complex topography, on a point to pixel basis it can be challenging to acquire reasonable agreement. Therefore, in this study we used point to pixel, point to area grid cell average, and stations' average to area grid cell average comparison to evaluate the accuracy of each product. The area grid cell average is the average number of pixels covering the basin or the validation area. Similarly, the station average is used to indicate the average value of the stations inside the validation area. Therefore, during the comparison process, the individual or the stations' average is compared to the area grid cell average of the product. The most commonly used statistical methods such as the Pearson correlation coefficient (CC), bias, relative bias (Rbias), mean absolute error (MAE), root mean square error (RMSE), and index of agreement (IA) (Cohen Liechti et al., 2012; Daren Harmel and Smith, 2007; Moazami et al., 2013) are used. CC (Eq. 1) is applied to evaluate the agreement of individual products (P) to station data (O). A value of CC close to 1 shows a perfect positive fit between the products and station data.
The average differences and systematic bias of each product are given as bias (Eq. 2) and Rbias (Eq. 3). Bias can be positive (overestimation) or negative (underestimation) according to the accuracy of each product.
The MAE and RMSE (Eqs. 4 and 5) are well known and accepted indicators of goodness of fit, which shows the differences between ground observations and model or other product outputs (Legates and McCabe, 1999).
The IA (Willmott, 1981) is another widely used indicator of goodness of fit between observed and model output. IA (Eq. 6) describes how much of the model or product output (rainfall, Tmax, and Tmin products) are error-free compared to the ground observations.
In addition to the above statistical methods, the Taylor diagram (Taylor, 2001) is used to summarize the statistical relationship between ground station data and the products for rainfall, Tmax, and Tmin. In this diagram, the relationships between the two fields are explained by the correlation coefficient (R), centred mean square (rms) difference (E′), and standard deviation (σ). The diagram is useful for evaluating the accuracy of multiple data sources or model output against a reference or observational data (IPCC, 2001). A single point on the diagram displays three statistical values (R, E′, and σ) and their relationship is given by Eq. (7).
where and are the variance of the model and observation fields and R is the correlation coefficient between the two fields (Eq. 8).
In the diagram, the distance from the reference point (observed data) is given as the centred rms difference of the two fields (Eq. 9). A model with no error would show a perfect correlation to the observations.
where f is the test (e.g. model or satellite) field and r is the reference (observed) field, whereas σf and σr are the standard deviations of the model and reference fields (Eqs. 10a and b).
Additionally, rainfall characteristics such as the number of wet days, duration and amount of wet periods, duration of dry periods, and daily and total rainfall are used to evaluate the accuracy of individual rainfall products by comparing to the observed data. Rainfall characteristics are widely used indicators in rainfall modelling (Wilby and Dawson, 2007; Jebari et al., 2012) and include the number of wet days (days yr−1), which is the count of days with rainfall per year; duration (days) of wet and dry periods, indicating the average number of consecutive wet and dry days during the study period; and the amount of wet periods (mm), indicating the amount of rainfall observed during the identified wet period.
4.1 Validation of satellite, observational reanalysis, and climate model-based products
The correlation of each rainfall product with station data is summarized in Fig. 2 for the 21 validation areas, and details (scatter plots) are provided in the Supplement (Fig. S1). The results show that in most of the validation areas, CHIRPS, followed by CHIRP and ARC2, is more strongly correlated with station data compared to ORH and the individual RCMs (I-RCM). In addition to the lower correlation, ORH and I-RCM showed large biases in all the validation areas (Fig. S1).

Figure 2The correlation coefficient (CC) values between the observed monthly rainfall and data from ARC2, CHIRP, CHIRPS, ORH, and RCMs for the 21 validation areas (1–17 for EthioShed1–17, 18–19 for KenShed1 and 2, and 20–21 for TanShed1–2; see Table 1) covering the period of 1983–2005.
Based on the results in Fig. 2 and the scatter plots provided in the Supplement (Fig. S1), CHIRPS and CHIRP are the most accurate rainfall products, with higher correlation and lower biases, and ARC2 and ORH are the second best products. I-RCM and RCMs' mean (RCMs) correlate weakly in most of the validation areas. In addition, I-RCM (not shown in Fig. 2 but provided in the Supplement Table S1) and RCMs show a strong over- and underestimation of monthly rainfall compared to the other products. In EthioShed1, for example, CHIRPS and CHIRP are shown to be the most accurate products, while ARC2 and ORH showed higher dispersion above and below the regression line (see Fig. S1). Similarly, in EthioShed4 both CHIRP and CHIRPS have an equal R2, but in terms of biases (points below and above the regression line) CHIRPS performed better. The observed biases in CHIRP and higher correlations in CHIRPS in all the validation areas highlight the role of the station-satellite data blending techniques. Compared to other validation areas, the agreement of products in EthioShed16 is comparably weak, and CHIRPS and CHIRP showed the higher correlation (0.7) compared to ARC2, ORH, and RCMs.
As for the daily, dekadal, and monthly resolution, the comparison is performed in three ways: point to pixel, point to area grid cell average, and stations' average to area grid cell average using the methods described in Sect. 3.2. An explanatory example is given in Table 2, using stations of EthioShde1, displaying the difference in comparing products through point (station) to pixel, point to area grid cell average, and stations' average to area grid cell average. The agreement of each product with station data on a daily timescale and in the point to pixel comparison is weak, with significantly higher biases and errors. For rainfall, in general, the latter method, stations' average to area grid cell average, provides better correlation, higher index of agreement, and lower biases and errors. Compared to the point to pixel method, the stations' average to area grid cell average improves the correlations of ARC2, CHIRP, and CHIRPS by 81.3 %, 65.7 %, and 8 %, respectively. In addition to the correlation, the method reduces the RMSE by more than 66 %. Compared to ARC2 and CHIRP (Table 2), CHIRPS gives a significantly higher correlation and IA and lower biases and RMSE. During area averaging, extremely high rainfall events obtained for a location from the various data products are levelled off by averaging, and this makes the product more representative of the area. In most of the rainfall products, there are occasionally higher daily rainfall values recorded and the averaging removes these extremes, which are much higher than the observed station data in the area. Compared to the point to pixel method, the second method, the point to area grid cell average, provides a reasonable correlation.
Table 2An example of the statistics used to compare ground rainfall data with satellite products (e.g. ARC2, CHIRP, and CHIRPS) in EthioShed1. The three modes of comparison are compared based on a range of statistical variables (Sect. 3.2). The point (station) to area grid cell average is computed by comparing individual stations to the area grid cell average of each product. Best fit of the last three rows is indicated in bold; best fits of the nine stations are also highlighted.
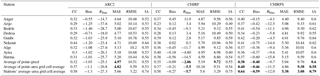
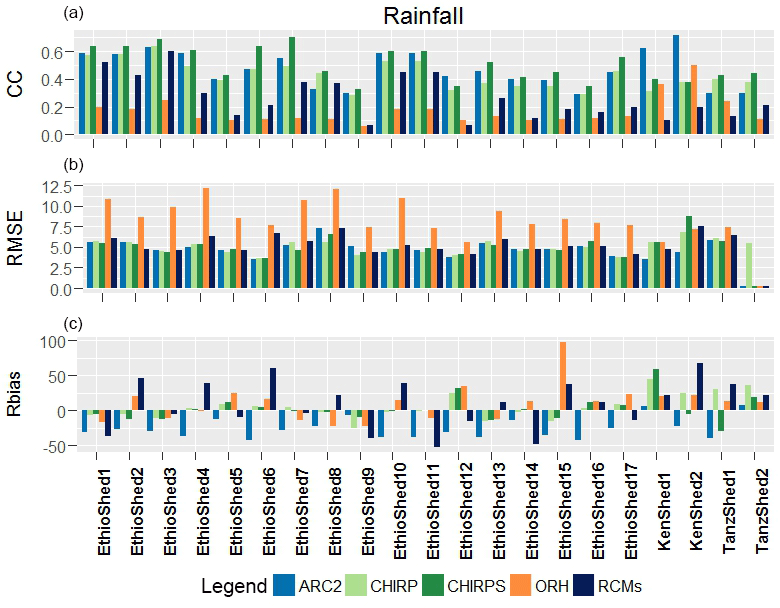
Figure 3Statistical evaluation of daily rainfall retrieved from ARC2, CHIRP, CHIRPS, ORH, and RCMs against ground observations: CC (a), RMSE (b), and Rbias (c) during the period of 1983–2005 for 21 validation areas of East Africa (see Table 1).
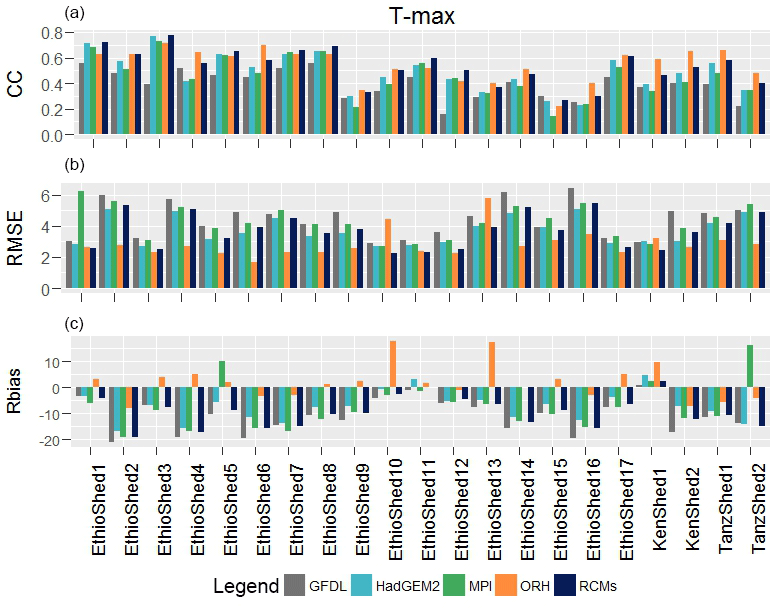
Figure 4Statistical evaluation of daily Tmax retrieved from GFDL, HadGEM2, MPI, ORH, and RCMs against ground observations: CC (a), RMSE (b), and Rbias (c) over the period of 1983–2005 for 21 validation areas of East Africa.
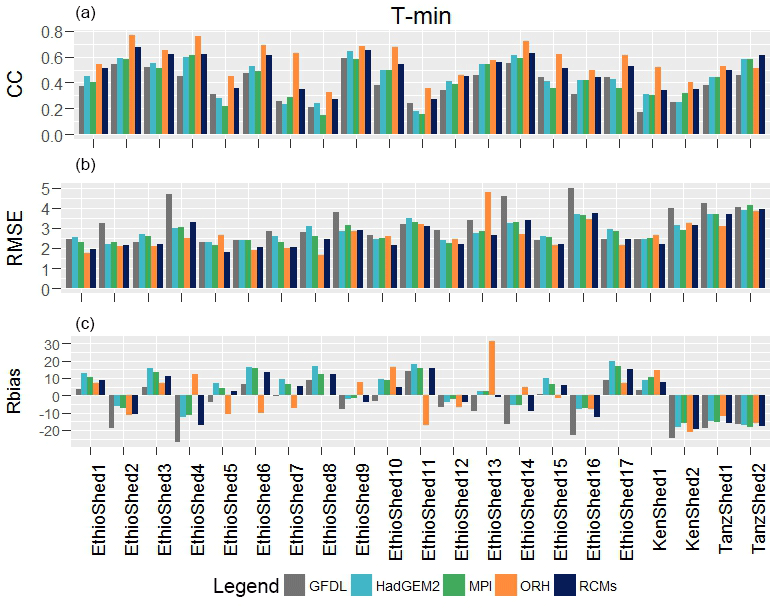
Figure 5Statistical evaluation of daily Tmin retrieved from GFDL, HadGEM2, MPI, ORH, and RCMs against ground observations: CC (a), RMSE (b), and Rbias (c) over the period of 1983–2005 for 21 validation areas of East Africa (see Table 1).
For Tmax and Tmin, only ORH, I-RCM, and RCMs are compared with station data. For 21 validation areas, ORH proved to be the most accurate product for both Tmax (Fig. 4) and Tmin (Fig. 5). In comparison to I-RCM and RCMs, ORH showed a significantly higher correlation and lower biases and errors in most of the validation areas. In 7 of the 21 validation areas, RCMs showed a higher correlation in Tmax than ORH and I-RCM. However, for Tmin, ORH in 20 of the 21 validation areas showed a higher correlation. In general, I-RCM and RCMs showed higher RMSE and biases in most of the validation areas compared to ORH. Next to ORH and compared to I-RCM, RCMs appeared to be the best data source, particularly for Tmax. RCMs showed a relatively higher correlation and lower biases and errors compared to I-RCM in most of the validation areas.
The agreement of each product increases with decreasing temporal resolution, from daily to dekadal and monthly resolutions. Including the historical data of each individual RCM, all RCMs, and ORH, the overall comparison using some of the statistical methods is summarized in Figs. 3, 4, and 5 for rainfall, Tmax, and Tmin, respectively. The evaluation of each rainfall product (ARC2, CHIRP, CHIRPS, ORH, and RCMs) showed a different degree of agreement with station data (Fig. 3). The performance of the individual RCMs (I-RCM) for all the validation areas is provided in the Supplement (Table S1). At a daily timescale, CHIRPS, followed by ARC2 and CHIRP, proved to be the most accurate rainfall product compared to ORH, I-RCM, and RCMs in all the validation areas. In general, out of the 21 validation areas, CHIRPS, ARC2, and CHIRP showed a higher correlation in 17, 3, and 1 validation areas, respectively. In addition to the higher correlation, CHIRPS, CHIRP, and ARC showed lower RMSE than ORH, I-RCM, and RCMs. Similarly, CHIRPS and CHIRP showed lower biases than observed in ARC2, ORH, I-RCM, and RCMs in most of the validation areas.
Moreover, the observed daily rainfall characteristics are well represented by CHIRPS and ARC2 in most of the validation areas (Table S2). On average, over the 21 validation areas, CHIRPS captures the number of wet days (−0.17 % deviation), average duration of wet (−13.4 % deviation) and dry periods (−17.6 % deviation), total rainfall (−4.5 % deviation), average amount of wet periods (−17 % deviation), and average daily rainfall (−7.7 % deviation) well (Table 3). Next to CHIRPS, ARC2 showed higher agreement in producing the average duration of wet (−20 % deviation) and dry periods (11.3 % deviation) and average amount of wet periods (−38 % deviation). CHIRP, on the other hand, showed a higher agreement in the total amount of rainfall with a 2.75 % deviation, which is higher than CHIRPS, ARC2, ORH, I-RCM, and RCMs. In contrast, ARC2 and GFDL showed higher underestimation (−34.7 % deviation) and overestimation (27.2 % deviation), respectively, of the total amount of rainfall compared to the other products. In addition, ARC2 showed a higher underestimation of the number of wet days (−15.1 % deviation) and average daily rainfall (−23.8 % deviation) compared to CHIRPS and ORH. CHIRP, on the other hand, showed higher overestimation of the number of wet days and duration and amount of wet periods (> 59.7 % deviation) and underestimation of the duration of dry periods and average daily rainfall (−62 % deviation) compared to the other products. Moreover, RCMs, next to CHIRP, showed higher overestimation of the number of wet days and duration and amount of wet periods (> 44.9 % deviation) and total rainfall amount (11.4 % deviation) and underestimation of the average duration of dry periods and daily rainfall by about 41 %. In general, the observed rainfall characteristics are captured well by CHIRPS, with a percentage difference from the observations of −0.17 % to −17.6 % for the number of wet days and duration of dry periods, respectively, compared to CHIRP, ARC2, ORH, I-RCM, and RCMs (Table 3).
Table 3Summary of daily rainfall characteristics retrieved from multiple rainfall products and averaged over the validation areas of Ethiopia, Kenya, and Tanzania. Values in brackets give the deviation from the observed value (%). The value which comes closest to the observed value is highlighted in bold.
The average daily rainfall of the study region retrieved from CHIRPS is displayed in Fig. 6 for the study period 1983–2005. Using CHIRPS as reference rainfall data, the absolute difference is presented in Fig. 6 for ARC2, CHIRP, ORH, and individual RCMs (HadGEM2, GFDL, and MPI). The average daily rainfall from the individual RCMs (I-RCM) shows large discrepancies from CHIRPS compared to CHIRP, ARC2 and ORH. The comparison at a daily timescale, particularly of rainfall, is challenging and more emphasis is given to this evaluation compared to dekadal and monthly resolutions. RCMs (RCA4 and CCLM) driven by HadGEM2-ES (HadGEM2), MPI-ESM-LR (MPI), and GFDL-ESM2M (GFDL) are used in this study. For RCMs driven by all GCMs, the average is used. The daily rainfall, Tmax, and Tmin maps of GFDL display the result of a single RCM (RCA4) driven by GFDL-ESM2M for the period of 1983–2005. Higher and lower average daily rainfall values are displayed by GFDL and ORH, respectively (Fig. 6). However, all the products showed a similar tendency in capturing the daily rainfall distribution: higher in the western and lower in the eastern part of the region. In addition, the average daily Tmax and Tmin (Fig. 7) of the region show relatively higher disagreement between ORH and I-RCM, which is given as an absolute difference from ORH. Even though I-RCM shows high deviation from ORH, it showed higher agreement in Ethiopia, Kenya, and Tanzania for Tmax and Tmin.
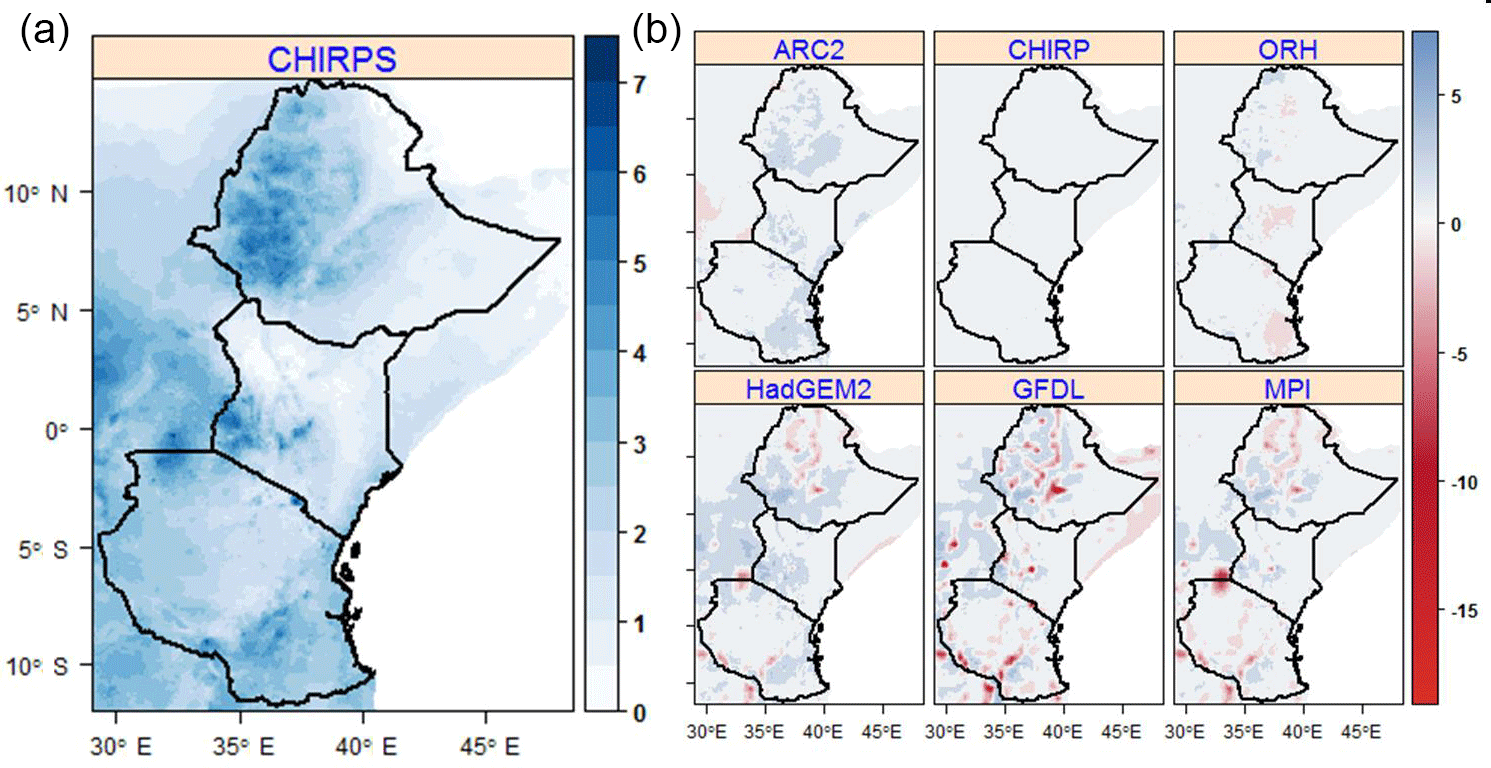
Figure 6Average daily rainfall (mm day−1) map of East Africa retrieved from CHIRPS (a) for the study period 1983–2005. For rainfall data from ARC2, CHIRP, ORH, and RCMs (b), the absolute difference (mm day−1) from CHIRPS is displayed. All the maps are given in a 0.05∘ spatial resolution.
4.2 Validation of satellite, observational reanalysis, and climate model-based products at dekadal and monthly resolutions
To understand the role of higher spatial resolution in improving the agreement with station data, a similar statistical evaluation was performed using the coarse resolution of CHIRPS (0.25∘). Compared to the coarse resolution of CHIRPS, the daily improved version (0.05∘) used in this study showed an increased correlation of up to 3.2 % in all the validation areas. In line with the daily evaluation, the comparison was extended to dekadal and monthly resolutions for rainfall, Tmax, and Tmin using the same statistical methods. For this analysis the observed daily ground observations and data from ARC2, CHIRP, CHIRPS, ORH, I-RCM, and RCMs were aggregated to dekadal and monthly resolutions. With decreasing temporal resolution (daily to monthly), the agreement of each product showed a marked improvement in all the validation areas. In addition to the increase in correlation, biases (bias and Rbias) and errors (MAE and RMSE) in rainfall are decreased at dekadal and monthly resolutions.
At dekadal and monthly resolution, the agreement of all rainfall products with station data increased compared to daily resolutions and the results for eight validation areas of Ethiopia, Kenya, and Tanzania are given in Fig. 8. The same plots – with similar results – for another 13 areas are provided in the Supplement (Fig. S2). Similar to the daily evaluation, CHIRPS appeared to be the most accurate rainfall product both at dekadal and monthly resolutions in most of the validation areas compared to the other products. In addition to the higher correlation of CHIRPS with station data at monthly and dekadal timescales, the centred mean square (rms) difference and the standard deviation are close to the observations in most of the validation areas. Following CHIRPS, CHIRP appeared to be the second best data source for dekadal and monthly rainfall and in three validation areas (EthioShed3, 15, and 16) showed a slightly higher correlation than CHIRPS. In two validation areas (KenShed1 and 2), ARC2 showed a slightly higher correlation than CHIRP and CHIRPS. However, in KenShed2, ARC2 showed a higher deviation from the observed value compared to CHIRP and CHIRPS. CHIRPS has, for example, almost identical standard deviation to the station data in all the validation areas except in areas with a lower number of ground stations (EthioShed12–15 and TanzShed1). Overall, CHIRPS, CHIRP, and ARC2 were found to be the best performing rainfall products, while ORH, I-RCM, and RCMs are the worst performing products.
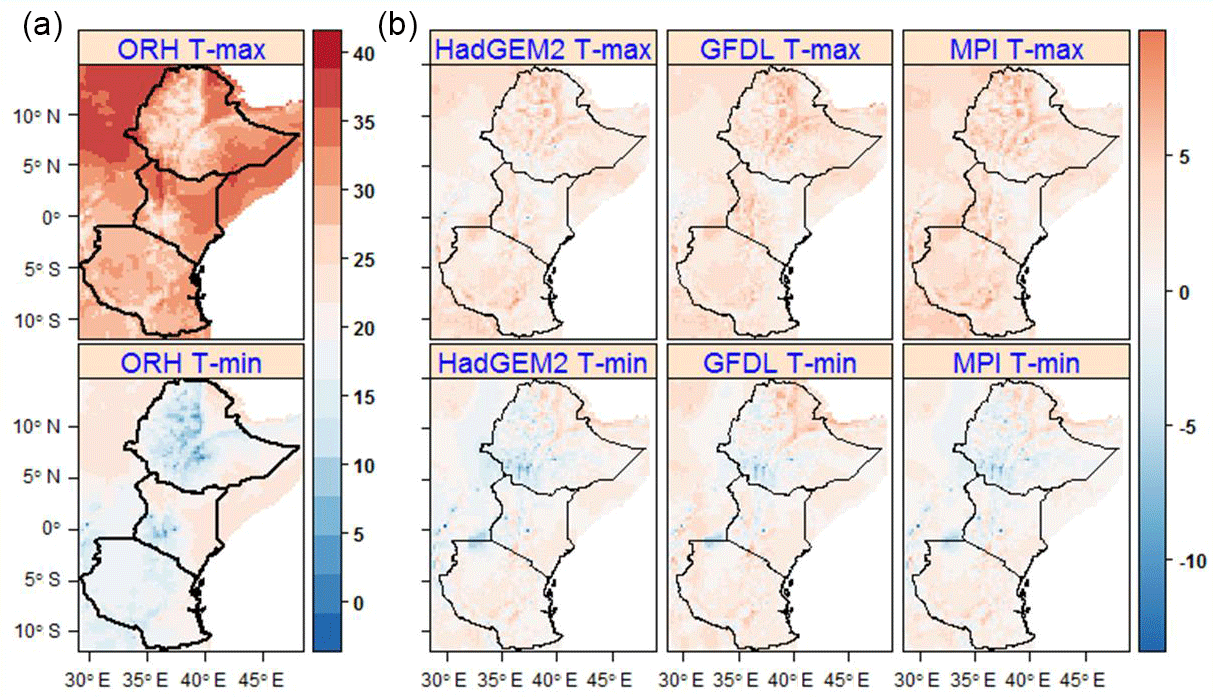
Figure 7Map of average daily Tmax and Tmin (∘C) for East Africa generated from ORH (a) for the study period 1983–2005. For temperature data from HadGEM2, GFDL, and MPI (b), the absolute difference (∘C) from ORH is displayed. All the maps are given in a 0.1∘ spatial resolution.
Moreover, for Tmax and Tmin, the correlation of ORH, I-RCM, and RCMs increased from daily to dekadal and monthly resolutions. The agreement of each product with station data, for eight validation areas of Ethiopia, Kenya, and Tanzania, is given in Figs. 9 and 10 for Tmax and Tmin, respectively. The same plots – with similar results – for another 13 areas are provided in the Supplement (Figs. S3 and S4 for Tmax and Tmin, respectively). Compared to I-RCM and RCMs, the correlation between ORH and station data is higher in most of the validation areas. In addition, ORH showed lower centred mean square (rms) difference and biases (bias and Rbias). In addition, compared to the I-RCM and RCMs, the standard deviation of ORH is close to the respective observations in most of the validation areas. Compared to I-RCM, the standard deviation and centred mean square (rms) difference of RCMs are lower in most of the validation areas.
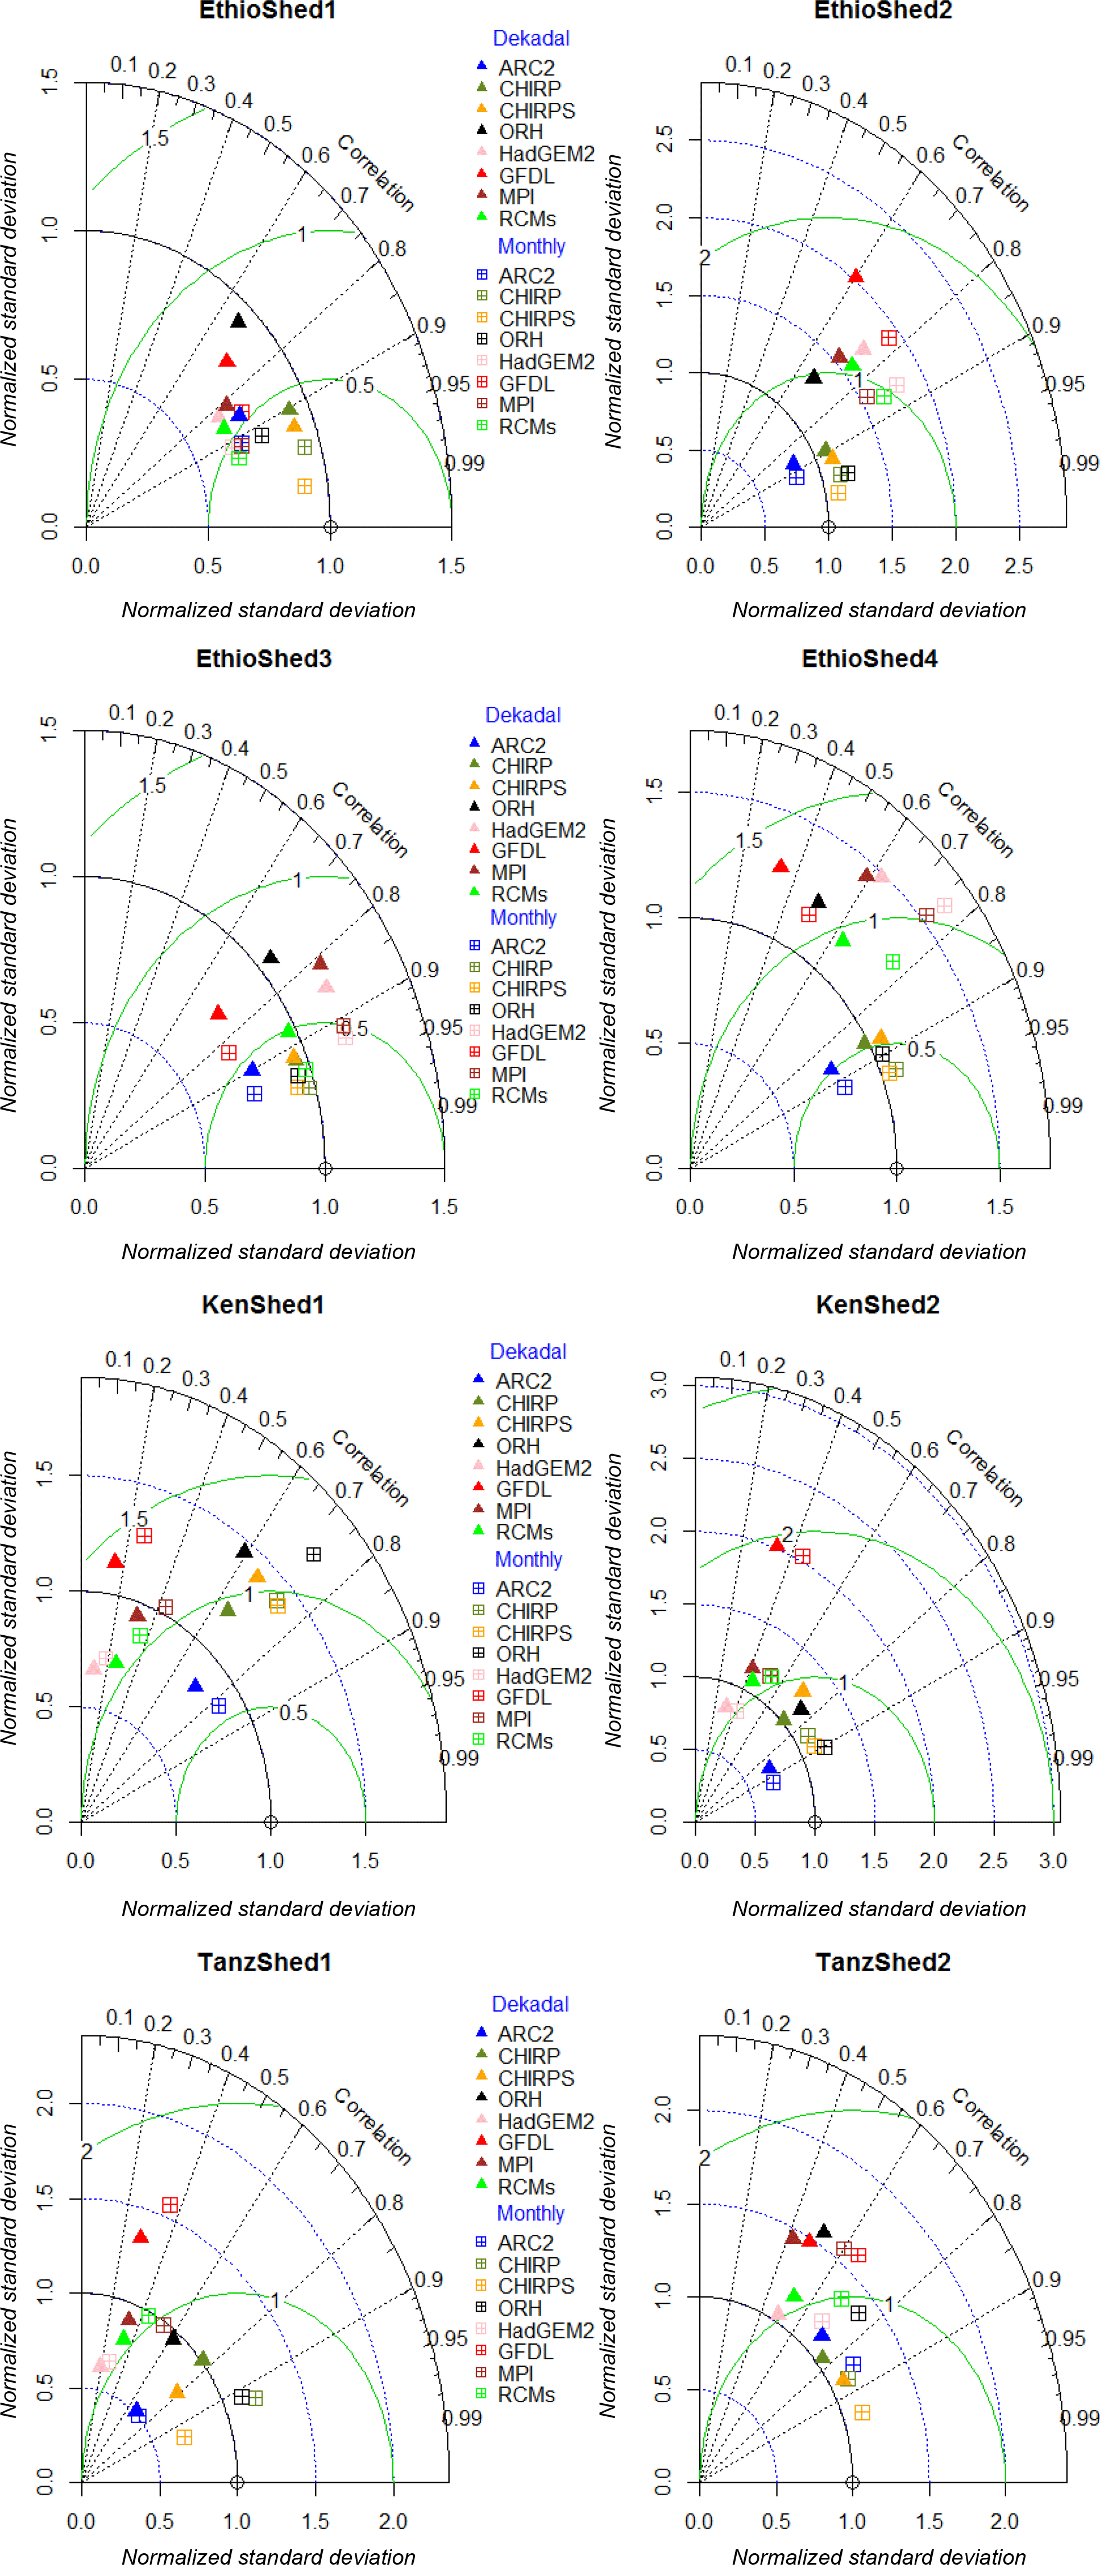
Figure 8Taylor diagram displaying the agreement between ground observations and synthesized dekadal and monthly rainfall over eight validation areas of Ethiopia, Kenya, and Tanzania covering the period of 1983–2005.
Detection of rainfall characteristics by satellite observations or climate model simulations' output (GCMs and RCMs) is very challenging as compared to temperature. This is especially evident in East Africa, where the topography is complex and characterized by multiple rainfall regimes. In particular, it is difficult to estimate rainfall with satellite imageries in the mountainous region of East Africa (Cattani et al., 2016) because these products inevitably do not represent the regional rainfall patterns and complexity of the region's topography (Romilly and Gebremichael, 2011). Here, for an improved understanding of the climatic conditions of this complex region and their impact on environmental resources, daily rainfall, Tmax, and Tmin products from high-resolution satellite imageries, observational reanalysis, and climate models outputs are compared against ground observations. Such an evaluation was not available until now for the considered region. Therefore, an in-depth evaluation was performed, more specifically, on a daily timescale, of the satellite-based rainfall products (ARC2, CHIRPS, and CHIRP), ORH, and RCMs (CCLM and RCA) driven by three GCMs. ARC2, CHIRP, and CHIRPS are rainfall products, whereas ORH and RCMs provide rainfall, Tmax, and Tmin.
From the comparison (using point to pixel, point to area grid cell average, and stations' average to area grid cell average methods), the stations' average to area grid cell average showed the best correlation and least biases and errors in all the validation areas. A study by Duan et al. (2016) in the Adige basin (Italy) found that comparing rainfall products such as CHIRPS on a watershed scale showed a marked improvement in overall agreement compared to the point to pixel method on daily and monthly timescales. Comparing the coarse resolution of satellite products and of RCMs using the point to pixel method cannot be expected to result in a high agreement with station data. Ground stations provide point data measured over continuous time periods, whereas satellite products provide area averages based on discontinuous (rain) estimates. Field-based stations (as point measurements) cannot be considered as reference data for the evaluation of area-based rainfall estimates (Cohen Liechti et al., 2012; Wang and Wolff, 2010), if not compared at a monthly or annual timescale. This is similar to our finding that the point to pixel comparison for all products inside and outside the validation areas show weak statistical relations with ground stations (see e.g. Table 2). The correspondence of all products at a daily timescale and in all the validation areas was found to be comparably weak, and the findings are in agreement with earlier studies (Cohen Liechti et al., 2012; Dembélé and Zwart, 2016).
At a daily timescale, CHIRPS, followed by ARC2 and CHIRP, showed higher correlation and lower errors and biases in all the validation areas compared to ORH, I-RCM, and RCMs. In addition, CHIRPS captured the daily rainfall characteristics well, while ARC2 showed higher underestimation of the average daily and total rainfall. The agreement of all the rainfall products increases from daily to dekadal and monthly timescales (Fig. 8), and this is consistent with other studies (Cohen Liechti et al., 2012; Dembélé and Zwart, 2016; Kimani et al., 2017). Generally, CHIRPS, with a high spatial resolution, followed by CHIRP and ARC2, was the best performing rainfall product in terms of correlation, biases, and errors and in characterizing regional rainfall characteristics. By contrast, ORH, I-RCM, and RCMs appeared to be less precise rainfall products at all timescales and in all validation areas. When looking at the performance of different data products in the selected validation areas (Fig. S1), dispersion is comparably higher in areas with a lower number of ground stations. An additional confounding factor could be the very complex topography of the region. This might explain why products with coarser spatial resolution (ORH, I-RCM, and RCMs) showed higher dispersion compared to products with higher spatial resolution (CHIRPS, CHIRP, and ARC2).
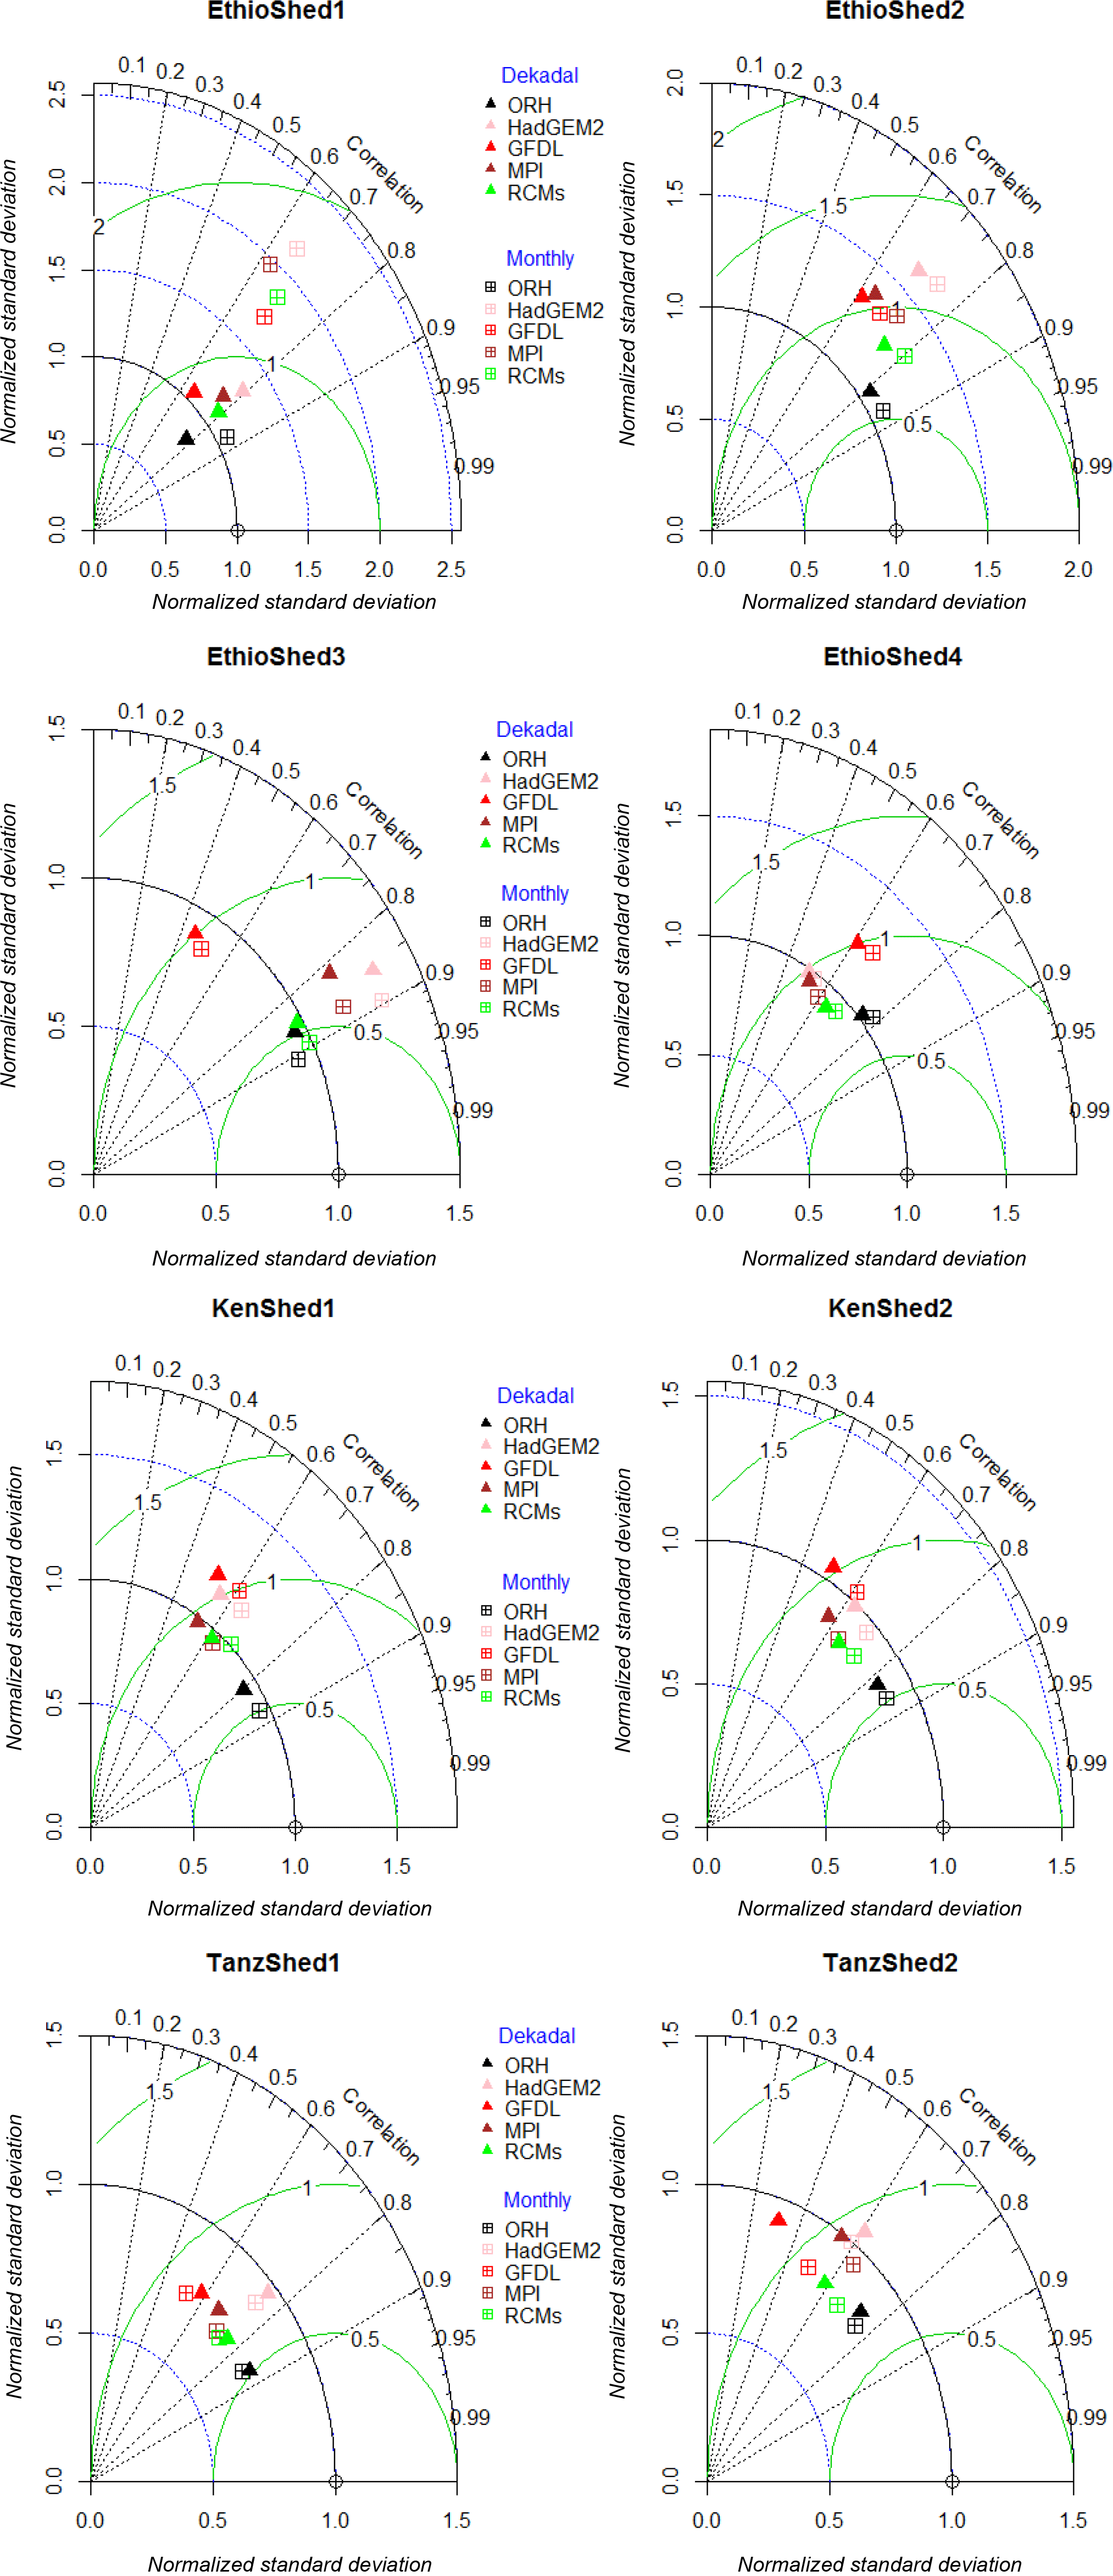
Figure 9Taylor diagram displaying the agreement between ground observations and synthesized dekadal and monthly Tmax over eight validation areas of Ethiopia, Kenya, and Tanzania covering the period of 1983–2005.
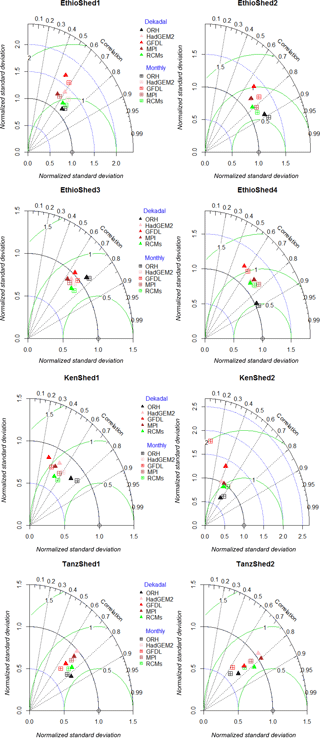
Figure 10Taylor diagram displaying the agreement between ground observations and synthesized dekadal and monthly Tmin over eight validation areas of Ethiopia, Kenya, and Tanzania covering the period of 1983–2005.
The daily rainfall data (global summary of the day) available at the National Climate Data Center (NCDC) needed to be controlled for quality before application. In East Africa, particularly Ethiopia, the data available at NCDC are very poor and only few stations are available. Therefore, products developed based on the global summary of the day such as ORH cannot be expected to provide as accurate results, particularly for the most complex climate variable, rainfall, as CHIRPS and ARC2. CHIRPS incorporates monthly station data obtained from different regional meteorological organizations, e.g. from Ethiopia, Kenya, and Tanzania. In all the validation areas one to seven stations were included in the development of CHIRPS in different months during 1981–2005. In EthioShed1 (Table 2), for example, six of the nine stations we considered in this study are included in CHIRPS. The inclusion of monthly station data can be assumed to improve CHIRPS' performance compared to other rainfall products. This particular feature of CHIRPS (compared to CHIRP and other data products) is somewhat problematic for our analysis, since the correlated data are not fully independent. However, since only monthly data from a limited number of stations were included in CHIRPS, the dependency is rather weak and indirect. In fact, the improved performance of CHIRPS was even shown in areas where station data are not included (e.g. Arijo, Bedele, and Hurma stations in EthioShed1) and on a daily timescale.
Even though ORH was one of the worst performing rainfall products, it appeared to be the most accurate data source for Tmax and Tmin at daily, dekadal, and monthly resolutions compared to I-RCM and RCMs. Nikulin et al. (2012) presented a detailed comparison of daily gridded observations with multiple RCMs, including RCA and CCLM, and they found large discrepancies over the whole region of Africa. However, in this region, RCMs appeared to be the second best data source for both Tmax and Tmin, and I-RCM is less precise, with slightly higher biases and errors. In this region, other studies (Endris et al., 2013; Kim et al., 2014) concluded that the multi-model or ensemble mean of CORDEX RCMs provides reasonable results compared to individual RCMs (I-RCM). The systematic bias of I-RCM and RCMs is higher in most of the validation areas compared to the other products, particularly for rainfall, that can be improved by applying different bias correction techniques such as empirical quantile mapping (Lafon et al., 2013; Maraun, 2013; Teng et al., 2015) before application to different hydrological and climate models (e.g. SDSM). In general, in topographically complex regions such as East Africa, RCMs require further improvements in terms of spatial resolution and accuracy by adding more local information to the modelling process, particularly for precipitation.
The evaluation of rainfall, Tmax, and Tmin from different sources against station data was performed for large parts of East Africa (Ethiopia, Kenya, and Tanzania) using three methods: point to pixel, point to area grid cell average, and stations' average to area grid cell averages. Compared to the other two methods, the last-mentioned method (stations' average to area grid cell average) provides a better correlation and index of agreement (IA) and lower errors (MAE and RMSE) and biases (bias and Rbias). Using this method, individual rainfall, Tmax, and Tmin products were compared at daily, dekadal (10 days), and monthly resolutions. At a daily timescale, CHIRPS, ARC2, and CHIRP provide a better agreement with station data compared to ORH, I-RCM, and RCMs. Compared to CHIRPS and CHIRP, ARC2, ORH, I-RCM, and RCMs showed higher biases and errors in most of the validation areas. Overall, the performance of CHIRPS is higher than the other rainfall products in capturing the daily rainfall characteristics, such as the number of wet days, duration of wet and dry periods, total and daily rainfall, and amount of wet periods. ARC2 better captures duration of wet and dry periods, but showed higher underestimation of the total and daily rainfall and number of wet days compared to CHIRPS and CHIRP. I-RCM and RCMs, on the other hand, showed higher overestimation of the number of wet days, duration and amount of wet periods, and total rainfall and underestimation of the average duration of dry periods and daily rainfall.
ORH, conversely, appeared to be one of the worst performing rainfall products for the study region, but the most accurate product, compared to I-RCM and RCMs, for Tmax and Tmin at a daily timescale in most of the validation areas. The evaluation of the above products at dekadal and monthly timescales showed that CHIRPS with high spatial resolution (0.05∘) has a higher correlation and lower errors and biases than the other rainfall products. As the temporal resolution gets coarser (e.g. monthly), the correlation between ground observations and the above products significantly increases. In addition, biases (bias and Rbias) and errors (MAE and RMSE) significantly decreased. Similar to that of rainfall, the comparison at dekadal and monthly resolution showed an improved correlation and lower errors and biases for both Tmax and Tmin. Compared to I-RCM and RCMs, ORH with higher spatial resolution was found to be more accurate at dekadal and monthly resolutions. Next to ORH, RCMs showed a better performance than I-RCM, with lower biases and errors.
In general, CHIRPS for rainfall and ORH for Tmax and Tmin performed best in the considered regions of Ethiopia, Kenya, and Tanzania. Further studies need to confirm whether this finding holds for other regions as well, and our approach may represent a blueprint of how to address this question. Since CHIRPS and ORH are available with higher spatial and temporal resolution and for longer periods, these data sources can be used for long-term climate studies (trend, variability, and extreme indices) and input for climate or hydrological models. Considering the typical need for daily data for model input, it remains to be investigated whether poor daily data with a limited bias and similar variance are an acceptable replacement of missing station data when used for impact model studies. In addition, the products can be used to check the plausibility of available ground stations or substitute ground observations in regions of Ethiopia, Kenya, and Tanzania where ground station data are not available or accessible.
In this study, publicly available daily rainfall and maximum and minimum temperature data are retrieved from multiple climate data sources, as provided below. The rainfall products used in this study are the Africa Rainfall Climatology version 2.0 (ARC2), available at the International Research Institute climate data library (https://iridl.ldeo.columbia.edu/SOURCES/.NOAA/.NCEP/.CPC/.FEWS/.Africa/.DAILY/.ARC2/; IRI/LDEO, 2016), Climate Hazards Group InfraRed Precipitation (CHIRP), available at the Climate Hazards Group (ftp://ftp.chg.ucsb.edu/pub/org/chg/products/CHIRP/daily/; CHG, 2017), and Climate Hazards Group InfraRed Precipitation with Station (CHIRPS), available at the International Research Institute climate data library (https://iridl.ldeo.columbia.edu/SOURCES/.UCSB/.CHIRPS/; IRI/LDE, 2016). In addition, daily rainfall and maximum and minimum temperature data are retrieved from the Observational-Reanalysis Hybrid (ORH), available at the Terrestrial Hydrology Research Group, Princeton University (http://hydrology.princeton.edu/data.php; Terrestrial Hydrology Research Group Princeton University, 2016), and the regional climate models (RCMs) of the CORDEX-Africa domain, available at the Earth System Grid Federation (https://esgf-index1.ceda.ac.uk/projects/esgf-ceda/; ESGF, 2016).
The supplement related to this article is available online at: https://doi.org/10.5194/hess-22-4547-2018-supplement.
SHG, SH, and CB designed the research, and SHG performed the data analysis and wrote the paper, with substantial contributions from SH and CB.
The authors declare that they have no conflict of interest.
We would like to thank the National Meteorological Agency (NMA) of Ethiopia
for providing adequate data for the study and the World Meteorological
Organization (WMO) representative for Eastern and Southern Africa for their
kind support in data collection. We would also like to thank the Graduate
Academy of Technische Universität Dresden (TU Dresden) for its financial
support during the study period.
Edited by: Shraddhanand Shukla
Reviewed by: Chris Shitote and one anonymous referee
Abiodun, B. J., Abba Omar, S., Lennard, C., and Jack, C.: Using regional climate models to simulate extreme rainfall events in the Western Cape, South Africa: Simulating Extreme Rainfall Events in Western Cape, Int. J. Climatol., 36, 689–705, https://doi.org/10.1002/joc.4376, 2016.
Anyah, R. O. and Semazzi, F. H. M.: Climate variability over the Greater Horn of Africa based on NCAR AGCM ensemble, Theor. Appl. Climatol., 86, 39–62, https://doi.org/10.1007/s00704-005-0203-7, 2006.
Anyah, R. O. and Semazzi, F. H. M.: Variability of East African rainfall based on multiyear Regcm3 simulations, Int. J. Climatol., 27, 357–371, https://doi.org/10.1002/joc.1401, 2007.
Baldauf, M., Seifert, A., Förstner, J., Majewski, D., Raschendorfer, M., and Reinhardt, T.: Operational Convective-Scale Numerical Weather Prediction with the COSMO Model: Description and Sensitivities, Mon. Weather Rev., 139, 3887–3905, https://doi.org/10.1175/MWR-D-10-05013.1, 2011.
Bayissa, Y., Tadesse, T., Demisse, G., and Shiferaw, A.: Evaluation of Satellite-Based Rainfall Estimates and Application to Monitor Meteorological Drought for the Upper Blue Nile Basin, Ethiopia, Remote Sens., 9, 669, https://doi.org/10.3390/rs9070669, 2017.
Beck, H. E., van Dijk, A. I. J. M., Levizzani, V., Schellekens, J., Miralles, D. G., Martens, B., and de Roo, A.: MSWEP: 3-hourly 0.25∘ global gridded precipitation (1979–2015) by merging gauge, satellite, and reanalysis data, Hydrol. Earth Syst. Sci., 21, 589–615, https://doi.org/10.5194/hess-21-589-2017, 2017.
Cattani, E., Merino, A., and Levizzani, V.: Evaluation of Monthly Satellite-Derived Precipitation Products over East Africa, J. Hydrometeorol., 17, 2555–2573, https://doi.org/10.1175/JHM-D-15-0042.1, 2016.
Ceccherini, G., Ameztoy, I., Hernández, C., and Moreno, C.: High-Resolution Precipitation Datasets in South America and West Africa based on Satellite-Derived Rainfall, Enhanced Vegetation Index and Digital Elevation Model, Remote Sens., 7, 6454–6488, https://doi.org/10.3390/rs70506454, 2015.
Chaney, N. W., Sheffield, J., Villarini, G., and Wood, E. F.: Development of a High-Resolution Gridded Daily Meteorological Dataset over Sub-Saharan Africa: Spatial Analysis of Trends in Climate Extremes, J. Climate, 27, 5815–5835, https://doi.org/10.1175/JCLI-D-13-00423.1, 2014.
Climate Hazards Group (CHG): Climate Hazards Group InfraRed Precipitation (CHIRP): available at ftp://ftp.chg.ucsb.edu/pub/org/chg/products/CHIRP/daily/, last access: 24 July 2017.
Cohen Liechti, T., Matos, J. P., Boillat, J.-L., and Schleiss, A. J.: Comparison and evaluation of satellite derived precipitation products for hydrological modeling of the Zambezi River Basin, Hydrol. Earth Syst. Sci., 16, 489–500, https://doi.org/10.5194/hess-16-489-2012, 2012.
Daren Harmel, R. and Smith, P. K.: Consideration of measurement uncertainty in the evaluation of goodness-of-fit in hydrologic and water quality modeling, J. Hydrol., 337, 326–336, https://doi.org/10.1016/j.jhydrol.2007.01.043, 2007.
Deblauwe, V., Droissart, V., Bose, R., Sonké, B., Blach-Overgaard, A., Svenning, J.-C., Wieringa, J. J., Ramesh, B. R., Stévart, T., and Couvreur, T. L. P.: Remotely sensed temperature and precipitation data improve species distribution modelling in the tropics: Remotely sensed climate data for tropical species distribution models, Global Ecol. Biogeogr., 25, 443–454, https://doi.org/10.1111/geb.12426, 2016.
Demaria, E. M. C., Maurer, E. P., Sheffield, J., Bustos, E., Poblete, D., Vicuña, S., and Meza, F.: Using a Gridded Global Dataset to Characterize Regional Hydroclimate in Central Chile, J. Hydrometeorol., 14, 251–265, https://doi.org/10.1175/JHM-D-12-047.1, 2012.
Dembélé, M. and Zwart, S. J.: Evaluation and comparison of satellite-based rainfall products in Burkina Faso, West Africa, Int. J. Remote Sens., 37, 3995–4014, https://doi.org/10.1080/01431161.2016.1207258, 2016.
Dinku, T., Kinfe, H., Ross, M., Elena, T., and Stephen, C.: Combined use of satellite estimates and rain gauge observations to generate high-quality historical rainfall time series over Ethiopia, Int. J. Climatol., 34, 2489–2504, https://doi.org/10.1002/joc.3855, 2013.
Dinku, T., Block, P., Sharoff, J., Hailemariam, K., Osgood, D., Corral, J. del, Cousin, R., and Thomson, M. C.: Bridging critical gaps in climate services and applications in Africa, Earth Perspect., 1, 15, https://doi.org/10.1186/2194-6434-1-15, 2014.
Diro, G. T., Grimes, D. I. F., and Black, E.: Teleconnections between Ethiopian summer rainfall and sea surface temperature: part I – observation and modelling, Clim. Dynam., 37, 103–119, https://doi.org/10.1007/s00382-010-0837-8, 2011.
Dixon, J., Gulliver, A., and Gibbon, D.: Farming systems and poverty, Food and Agricultural Organization of the United Nations and World Bank, Rome and Washington, DC, available at: http://www.fao.org/docrep/003/y1860e/y1860e00.htm (last access: 3 August 2015), 2001.
Duan, Z., Liu, J., Tuo, Y., Chiogna, G., and Disse, M.: Evaluation of eight high spatial resolution gridded precipitation products in Adige Basin (Italy) at multiple temporal and spatial scales, Sci. Total Environ., 573, 1536–1553, https://doi.org/10.1016/j.scitotenv.2016.08.213, 2016.
Earth System Grid Federation (ESGF): Regional Climate Models (RCMs), available at: https://esgf-index1.ceda.ac.uk/projects/esgf-ceda/, last access: 16 November 2016.
Endris, H. S., Omondi, P., Jain, S., Lennard, C., Hewitson, B., Chang'a, L., Awange, J. L., Dosio, A., Ketiem, P., Nikulin, G., Panitz, H.-J., Büchner, M., Stordal, F., and Tazalika, L.: Assessment of the Performance of CORDEX Regional Climate Models in Simulating East African Rainfall, J. Climate, 26, 8453–8475, https://doi.org/10.1175/JCLI-D-12-00708.1, 2013.
Endris, H. S., Lennard, C., Hewitson, B., Dosio, A., Nikulin, G., and Panitz, H.-J.: Teleconnection responses in multi-GCM driven CORDEX RCMs over Eastern Africa, Clim. Dynam., 46, 2821–2846, https://doi.org/10.1007/s00382-015-2734-7, 2015.
FAO: Adapting to climate change through land and water management in Eastern Africa, Food and Agricultural Organization of the United Nations and World Bank, Rome, available at: http://www.fao.org/3/a-i3781e.pdf (last access: 3 August 2015), 2014.
Funk, C., Peterson, P., Landsfeld, M., Pedreros, D., Verdin, J., Shukla, S., Husak, G., Rowland, J., Harrison, L., Hoell, A., and Michaelsen, J.: The climate hazards infrared precipitation with stations – a new environmental record for monitoring extremes, Sci. Data, 2, 150066, https://doi.org/10.1038/sdata.2015.66, 2015.
Gan, T. Y., Ito, M., Hülsmann, S., Qin, X., Lu, X. X., Liong, S. Y., Rutschman, P., Disse, M., and Koivusalo, H.: Possible climate change/variability and human impacts, vulnerability of drought-prone regions, water resources and capacity building for Africa, Hydrolog. Sci. J., 61, 1209–1226, https://doi.org/10.1080/02626667.2015.1057143, 2016.
Gebrechorkos, S. H., Hülsmann, S., and Bernhofer, C.: Changes in temperature and precipitation extremes in Ethiopia, Kenya, and Tanzania, Int. J. Climatol., 1–13, https://doi.org/10.1002/joc.5777, 2018.
Gelaro, R., McCarty, W., Suárez, M. J., Todling, R., Molod, A., Takacs, L., Randles, C. A., Darmenov, A., Bosilovich, M. G., Reichle, R., Wargan, K., Coy, L., Cullather, R., Draper, C., Akella, S., Buchard, V., Conaty, A., da Silva, A. M., Gu, W., Kim, G.-K., Koster, R., Lucchesi, R., Merkova, D., Nielsen, J. E., Partyka, G., Pawson, S., Putman, W., Rienecker, M., Schubert, S. D., Sienkiewicz, M., and Zhao, B.: The Modern-Era Retrospective Analysis for Research and Applications, Version 2 (MERRA-2), J. Climate, 30, 5419–5454, https://doi.org/10.1175/JCLI-D-16-0758.1, 2017.
Huffman, G. J., Bolvin, D. T., Nelkin, E. J., Wolff, D. B., Adler, R. F., Gu, G., Hong, Y., Bowman, K. P., and Stocker, E. F.: The TRMM Multisatellite Precipitation Analysis (TMPA): Quasi-Global, Multiyear, Combined-Sensor Precipitation Estimates at Fine Scales, J. Hydrometeorol., 8, 38–55, https://doi.org/10.1175/JHM560.1, 2007.
Huffman, G. J., Adler, R. F., Bolvin, D. T., and Gu, G.: Improving the global precipitation record: GPCP Version 2.1, Geophys. Res. Lett., 36, L17808, https://doi.org/10.1029/2009GL040000, 2009.
IFPRI: Economywide Impacts of Climate Change on Agriculture in Sub-Saharan Africa – climatechange-agriculture.pdf, available at: http://www.indiaenvironmentportal.org.in/files/climatechange-agriculture.pdf (last access: 3 August 2015), 2009.
IPCC: IPCC Third Assessment Report: Climate Change 2001 (TAR), Geneva Switzerland, available at: http://www.ipcc.ch/ipccreports/tar/wg1/ (last access: 3 August 2015), 2001.
IPCC: Climate Change 2007: The Physical Science Basis: Contribution of Working Group I to the Fourth Assessment Report of the of the IPCC, edited by: Solomon, S. et al., CAmbridge University Press, available at: https://www.ipcc.ch/publications_and_data/ar4/wg1/en/contents.html (last access: 30 November 2016), 2007.
IPCC: AR5 IPCC Whats in it for Africa, available at: https://cdkn.org/resource/highlights-africa-ar5/ (last access: 4 January 2017), 2014.
International Research Institute climate data library (IRI/LDE): Climate Hazards Group InfraRed Precipitation with Station data (CHIRPS), available at: https://iridl.ldeo.columbia.edu/SOURCES/.UCSB/.CHIRPS/, last access: 12 May 2016.
International Research Institute climate data library (IRI/LDEO): Africa Rainfall Climatology version 2 (ARC2), available at: https://iridl.ldeo.columbia.edu/SOURCES/.NOAA/.NCEP/.CPC/.FEWS/.Africa/.DAILY/.ARC2/, last access: 31 October 2016.
Jebari, S., Berndtsson, R., Olsson, J., and Bahri, A.: Soil erosion estimation based on rainfall disaggregation, J. Hydrol., 436–437, 102–110, https://doi.org/10.1016/j.jhydrol.2012.03.001, 2012.
Kalnay, E., Kanamitsu, M., Kistler, R., Collins, W., Deaven, D., Gandin, L., Iredell, M., Saha, S., White, G., Woollen, J., Zhu, Y., Leetmaa, A., Reynolds, R., Chelliah, M., Ebisuzaki, W., Higgins, W., Janowiak, J., Mo, K. C., Ropelewski, C., Wang, J., Jenne, R., and Joseph, D.: The NCEP/NCAR 40-Year Reanalysis Project, B. Am. Meteorol. Soc., 77, 437–471, https://doi.org/10.1175/1520-0477(1996)077<0437:TNYRP>2.0.CO;2, 1996.
Kimani, M. W., Hoedjes, J. C. B., and Su, Z.: An Assessment of Satellite-Derived Rainfall Products Relative to Ground Observations over East Africa, Remote Sens., 9, 430, https://doi.org/10.3390/rs9050430, 2017.
Kim, J., Waliser, D. E., Mattmann, C. A., Goodale, C. E., Hart, A. F., Zimdars, P. A., Crichton, D. J., Jones, C., Nikulin, G., Hewitson, B., Jack, C., Lennard, C., and Favre, A.: Evaluation of the CORDEX-Africa multi-RCM hindcast: systematic model errors, Clim. Dynam., 42, 1189–1202, https://doi.org/10.1007/s00382-013-1751-7, 2014.
Lafon, T., Dadson, S., Buys, G., and Prudhomme, C.: Bias correction of daily precipitation simulated by a regional climate model: a comparison of methods, Int. J. Climatol., 33, 1367–1381, https://doi.org/10.1002/joc.3518, 2013.
Legates, D. R. and McCabe, G. J.: Evaluating the use of “goodness-of-fit” Measures in hydrologic and hydroclimatic model validation, Water Resour. Res., 35, 233–241, https://doi.org/10.1029/1998WR900018, 1999.
Maidment, R. I., Grimes, D., Allan, R. P., Tarnavsky, E., Stringer, M., Hewison, T., Roebeling, R., and Black, E.: The 30 year TAMSAT African Rainfall Climatology And Time series (TARCAT) data set, J. Geophys. Res.-Atmos., 119, JD021927, https://doi.org/10.1002/2014JD021927, 2014.
Maidment, R. I., Grimes, D., Black, E., Tarnavsky, E., Young, M., Greatrex, H., Allan, R. P., Stein, T., Nkonde, E., Senkunda, S., and Alcántara, E. M. U.: A new, long-term daily satellite-based rainfall dataset for operational monitoring in Africa, Sci. Data, 4, 170063, https://doi.org/10.1038/sdata.2017.63, 2017.
Malo, M., Jember, G., and Woodfine, A.: Strenghtening Capacity for Climate Change Adaptation in the Agriculture Sector in Ethiopia, Proceedings from National Workshop, Food and Agricultural Organization of the United Nations and World Bank, Nazreth, Ethiopia, available at: http://www.fao.org/docrep/014/i2155e/i2155e00.pdf (last access: 4 August 2015), 2012.
Maraun, D.: Bias Correction, Quantile Mapping, and Downscaling: Revisiting the Inflation Issue, J. Climate, 26, 2137–2143, https://doi.org/10.1175/JCLI-D-12-00821.1, 2013.
Moazami, S., Golian, S., Kavianpour, M. R., and Hong, Y.: Comparison of PERSIANN and V7 TRMM Multi-satellite Precipitation Analysis (TMPA) products with rain gauge data over Iran, Int. J. Remote Sens., 34, 8156–8171, https://doi.org/10.1080/01431161.2013.833360, 2013.
Neitsch, S., Arnold, J., Kiniry, J., Williams, J., and King, K.: Soil and Water Assement Tool Theoretical Documentation, available at: https://swat.tamu.edu/media/1290/swat2000theory.pdf (last access: 23 May 2018), 2002.
Niang, I., Ruppel, O. C., Abdrabo, M. A., Essel, A., Lennard, C., Padgham, J., and Urquhart, P.: Africa. In: Climate Change 2014: Impacts, Adaptation, and Vulnerability. Part B: Regional Aspects, Contribution of Working Group II to the Fifth Assessment Report of the Intergovernmental Panel on Climate Change, edited by: Barros, V. R., Field, C. B., Dokken, D. J., Mastrandrea, M. D., Mach, K. J., Bilir, T. E., Chatterjee, M., Ebi, K. L., Estrada, Y. O., Genova, R. C., Girma, B., Kissel, E. S., Levy, A. N., MacCracken, S., Mastrandrea, P. R., and White, L. L., Cambridge University Press, Cambridge, United Kingdom and New York, NY, USA, 1199–1265, available at: http://www.ipcc.ch/pdf/assessment-report/ar5/wg2/WGIIAR5-Chap22_ FINAL.pdf (last access: 4 January 2017), 2014.
Nikulin, G., Jones, C., Giorgi, F., Asrar, G., Buechner, M., Cerezo-Mota, R., Christensen, O. B., Deque, M., Fernandez, J., Haensler, A., van Meijgaard, E., Samuelsson, P., Sylla, M. B., and Sushama, L.: Precipitation Climatology in an Ensemble of CORDEX-Africa Regional Climate Simulations, J. Climate, 25, 6057–6078, https://doi.org/10.1175/JCLI-D-11-00375.1, 2012.
Novella, N. S., Thiaw, W. M., Novella, N. S., and Thiaw, W. M.: African Rainfall Climatology Version 2 for Famine Early Warning Systems, Httpdxdoiorg101175JAMC–11-02381, available at: http://journals.ametsoc.org/doi/abs/10.1175/JAMC-D-11-0238.1 (last access: 30 November 2016), 2013.
Pricope, N. G., Husak, G., Lopez-Carr, D., Funk, C., and Michaelsen, J.: The climate-population nexus in the East African Horn: Emerging degradation trends in rangeland and pastoral livelihood zones, Global Environ. Chang., 23, 1525–1541, https://doi.org/10.1016/j.gloenvcha.2013.10.002, 2013.
Romilly, T. G. and Gebremichael, M.: Evaluation of satellite rainfall estimates over Ethiopian river basins, Hydrol. Earth Syst. Sci., 15, 1505–1514, https://doi.org/10.5194/hess-15-1505-2011, 2011.
Saha, S., Moorthi, S., Pan, H.-L., Wu, X., Wang, J., Nadiga, S., Tripp, P., Kistler, R., Woollen, J., Behringer, D., Liu, H., Stokes, D., Grumbine, R., Gayno, G., Wang, J., Hou, Y.-T., Chuang, H., Juang, H.-M. H., Sela, J., Iredell, M., Treadon, R., Kleist, D., Van Delst, P., Keyser, D., Derber, J., Ek, M., Meng, J., Wei, H., Yang, R., Lord, S., van den Dool, H., Kumar, A., Wang, W., Long, C., Chelliah, M., Xue, Y., Huang, B., Schemm, J.-K., Ebisuzaki, W., Lin, R., Xie, P., Chen, M., Zhou, S., Higgins, W., Zou, C.-Z., Liu, Q., Chen, Y., Han, Y., Cucurull, L., Reynolds, R. W., Rutledge, G., and Goldberg, M.: The NCEP Climate Forecast System Reanalysis, B. Am. Meteorol. Soc., 91, 1015–1058, https://doi.org/10.1175/2010BAMS3001.1, 2010.
Samuelsson, P., Jones, C. G., WilléN, U., Ullerstig, A., Gollvik, S., Hansson, U., Jansson, C., KjellströM, E., Nikulin, G., and Wyser, K.: The Rossby Centre Regional Climate model RCA3: model description and performance: THE ROSSBY CENTRE REGIONAL CLIMATE MODEL RCA3, Tellus A, 63, 4–23, https://doi.org/10.1111/j.1600-0870.2010.00478.x, 2011.
Sapiano, M. R. P. and Arkin, P. A.: An Intercomparison and Validation of High-Resolution Satellite Precipitation Estimates with 3-Hourly Gauge Data, J. Hydrometeorol., 10, 149–166, https://doi.org/10.1175/2008JHM1052.1, 2009.
Segele, Z. T., Leslie, L. M., and Lamb, P. J.: Evaluation and adaptation of a regional climate model for the Horn of Africa: rainfall climatology and interannual variability, Int. J. Climatol., 29, 47–65, https://doi.org/10.1002/joc.1681, 2009.
Sheffield, J., Goteti, G., Wood, E. F., Sheffield, J., Goteti, G., and Wood, E. F.: Development of a 50-Year High-Resolution Global Dataset of Meteorological Forcings for Land Surface Modeling, https://doi.org/10.1175/JCLI3790.1, 2006.
Sheffield, J., Wood, E. F., Chaney, N., Guan, K., Sadri, S., Yuan, X., Olang, L., Amani, A., Ali, A., Demuth, S., and Ogallo, L.: A Drought Monitoring and Forecasting System for Sub-Sahara African Water Resources and Food Security, B. Am. Meteorol. Soc., 95, 861–882, https://doi.org/10.1175/BAMS-D-12-00124.1, 2013.
Sheffield, J., Wood, E. F., Chaney, N., Guan, K., Sadri, S., Yuan, X., Olang, L., Amani, A., Ali, A., Demuth, S., and Ogallo, L.: A Drought Monitoring and Forecasting System for Sub-Sahara African Water Resources and Food Security, B. Am. Meteorol. Soc., 95, 861–882, https://doi.org/10.1175/BAMS-D-12-00124.1, 2014.
Sun, L., Li, H., Zebiak, S. E., Moncunill, D. F., Filho, F. D. A. D. S., and Moura, A. D.: An Operational Dynamical Downscaling Prediction System for Nordeste Brazil and the 2002–04 Real-Time Forecast Evaluation, J. Climate, 19, 1990–2007, https://doi.org/10.1175/JCLI3715.1, 2006.
Sylla, M. B., Giorgi, F., Coppola, E., and Mariotti, L.: Uncertainties in daily rainfall over Africa: assessment of gridded observation products and evaluation of a regional climate model simulation, Int. J. Climatol., 33, 1805–1817, https://doi.org/10.1002/joc.3551, 2013.
Tarnavsky, E., Grimes, D., Maidment, R., Black, E., Allan, R. P., Stringer, M., Chadwick, R., and Kayitakire, F.: Extension of the TAMSAT Satellite-Based Rainfall Monitoring over Africa and from 1983 to Present, J. Appl. Meteorol. Clim., 53, 2805–2822, https://doi.org/10.1175/JAMC-D-14-0016.1, 2014.
Taylor, K. E.: Summarizing multiple aspects of model performance in a single diagram, J. Geophys. Res.-Atmos., 106, 7183–7192, https://doi.org/10.1029/2000JD900719, 2001.
Teng, J., Potter, N. J., Chiew, F. H. S., Zhang, L., Wang, B., Vaze, J., and Evans, J. P.: How does bias correction of regional climate model precipitation affect modelled runoff?, Hydrol. Earth Syst. Sci., 19, 711–728, https://doi.org/10.5194/hess-19-711-2015, 2015.
Terrestrial Hydrology Research Group Princeton University: Observational-Reanalysis hybrid (ORH), available at: http://hydrology.princeton.edu/data.php, last access: 12 May 2016.
Troy, T. J., Sheffield, J., and Wood, E. F.: Estimation of the Terrestrial Water Budget over Northern Eurasia through the Use of Multiple Data Sources, J. Climate, 24, 3272–3293, https://doi.org/10.1175/2011JCLI3936.1, 2011.
UNEP: The Democratic Republic of the Congo Post-Conflict Environmental Assessment United Nations Environment Programme Synthesis for Policy Makers, available at: http://postconflict.unep.ch/publications/UNEP_ DRC_PCEA_EN.pdf (last access: 30 November 2016), 2011.
Urama, K. and Ozor, N.: Impacts of climate change on water resources in Africa?: the Role of Adaptation, African Technology Policy Studies Network (ATPS), available at: https://www.researchgate.net/publication/267218899_Impacts_of_climate_change_on_water_resources_in_Africa_the_role_of_adaptation (last access: 5 August 2015), 2010.
Vernimmen, R. R. E., Hooijer, A., Mamenun, Aldrian, E., and van Dijk, A. I. J. M.: Evaluation and bias correction of satellite rainfall data for drought monitoring in Indonesia, Hydrol. Earth Syst. Sci., 16, 133–146, https://doi.org/10.5194/hess-16-133-2012, 2012.
Wang, A., Lettenmaier, D. P., and Sheffield, J.: Soil Moisture Drought in China, 1950–2006, J. Climate, 24, 3257–3271, https://doi.org/10.1175/2011JCLI3733.1, 2011.
Wang, J. and Wolff, D. B.: Evaluation of TRMM Ground-Validation Radar-Rain Errors Using Rain Gauge Measurements, J. Appl. Meteorol. Clim., 49, 310–324, https://doi.org/10.1175/2009JAMC2264.1, 2010.
Wilby, R. L. and Dawson, C. W.: sdsm – a decision support tool for the assessment of regional climate change impacts, Environ. Modell. Softw., 17, 145–157, https://doi.org/10.1016/S1364-8152(01)00060-3, 2004.
Wilby, R. L. and Dawson, C. W.: SDSM 4.2 – A decision support tool for the assessment of regional climate change impacts, United Kingdom, available at: https://sdsm.org.uk/SDSMManual.pdf (last access: 11 January 2017), 2007.
Wilby, R. L. and Yu, D.: Rainfall and temperature estimation for a data sparse region, Hydrol. Earth Syst. Sci., 17, 3937–3955, https://doi.org/10.5194/hess-17-3937-2013, 2013.
Willmott, C. J.: On the Validation of Models, Phys. Geogr., 2, 184–194, 1981.
World Bank: Doing business in The East African Community, IFC/World Bank Rep., 116 pp., available at: http://www.tzdpg.or.tz/fileadmin/_migrated/content_uploads/DB12-EAC_01.pdf (last access: 30 November 2016), 2012.
Xie, P. and Arkin, P. A.: Global Precipitation: A 17-Year Monthly Analysis Based on Gauge Observations, Satellite Estimates, and Numerical Model Outputs, B. Am. Meteorol. Soc., 78, 2539–2558, https://doi.org/10.1175/1520-0477(1997)078<2539:GPAYMA>2.0.CO;2, 1997.
Zambrano-Bigiarini, M., Nauditt, A., Birkel, C., Verbist, K., and Ribbe, L.: Temporal and spatial evaluation of satellite-based rainfall estimates across the complex topographical and climatic gradients of Chile, Hydrol. Earth Syst. Sci., 21, 1295–1320, https://doi.org/10.5194/hess-21-1295-2017, 2017.