the Creative Commons Attribution 4.0 License.
the Creative Commons Attribution 4.0 License.
 | 20 Sep 2018
Hydrological control of dissolved organic carbon dynamics in a rehabilitated Sphagnum-dominated peatland: a water-table based modelling approach
Léonard Bernard-Jannin
Stéphane Binet
Sébastien Gogo
Fabien Leroy
Christian Défarge
Nevila Jozja
Renata Zocatelli
Laurent Perdereau
Fatima Laggoun-Défarge
Hydrological disturbances could increase dissolved organic carbon (DOC) exports through changes in runoff and leaching, which reduces the potential carbon sink function of peatlands. The objective of this study was to assess the impact of hydrological restoration on hydrological processes and DOC dynamics in a rehabilitated Sphagnum-dominated peatland. A conceptual hydrological model calibrated on the water table and coupled with a biogeochemical module was applied to La Guette peatland (France), which experienced a rewetting initiative on February 2014. The model (eight calibrated parameters) reproduced water-table (0.1<NS<0.61) and pore-water DOC concentrations (2<RMSE<11 mg L−1) in a time series (1 April 2014 to 15 December 2017) in two contrasting locations (rewetted and control) in the peatland. Hydrological restoration was found to impact the water balance through a decrease in slow deep drainage and an increase in fast superficial runoff. Observed DOC concentrations were higher in summer in the rewetted location compared to the control area and were linked to a difference in dissolved organic matter composition analyzed by fluorescence. Hydrological conditions, especially the severity of the water-table drawdown in summer, were identified as the major factor controlling DOC-concentration dynamics. The results of the simulation suggest that the hydrological restoration did not affect DOC loads, at least in a short-term period (3 years). However, it impacted the temporal dynamics of DOC exports, which were the most episodic and were mainly transported through fast surface runoff in the area affected by the restoration, while slow deep drainage dominated DOC exports in the control area. In relation to dominant hydrological processes, exported DOC is expected to be derived from more recent organic matter in the top peat layer in the rewetted area, compared to the control area. Since it is calibrated on water-table and DOC concentration, the model presented in this study proved to be a relevant tool in identifying the main hydrological processes and factors controlling DOC dynamics in different areas of the same peatland. It is also a suitable alternative to a discharge-calibrated catchment model when the outlet is not easy to identify or to monitor.


Sphagnum-dominated peatlands represent a major stock of the global soil carbon (C) pool (Gorham, 1991). Dissolved organic carbon (DOC) exports through runoff and leaching could account for up to 25 % of the C fluxes (Yu, 2012), reducing the potential C storage function of peatlands (Billett et al., 2004) and impacting downstream water quality (Ritson et al., 2014). DOC dynamics in peatlands has been found to be strongly controlled by site hydrology, especially by the water-table depth (WTD) (e.g. Hribljan et al., 2014; Jager et al., 2009; Strack et al., 2008, 2015). Therefore, hydrological disturbances such as drainage can lead to increased DOC exports in relation to WTD variations (Strack et al., 2008; Worrall et al., 2007). Where disturbances have occurred, hydrological restoration can be undertaken to re-establish peatland functioning (Menberu et al., 2016) with a potential impact on DOC dynamics and exports (Glatzel et al., 2003; Strack et al., 2015; Worrall et al., 2007).
In peatlands, as in many terrestrial ecosystems, DOC dynamics are controlled on the one hand by its production-to-consumption ratio in pore water and on the other hand by lateral water fluxes that drive its exports. DOC production through organic matter decomposition is known to increase with temperature (Clark et al., 2009; Freeman et al., 2001) and DOC consumption, mainly due to heterotrophic bacterial activity, also positively correlates to temperature and can lead to decreased DOC concentrations during droughts (Clark et al., 2009; Pastor et al., 2003). The export of the DOC produced in pore water is mainly controlled by peatland hydrology (Pastor et al., 2003; Strack et al., 2008), especially by the partitioning between quick near-surface flow and groundwater flow (Birkel et al., 2014). Due to the complexity of the interactions between these factors, field studies can show contradictory results regarding the effect of rewetting on DOC dynamics, with some studies reporting increasing concentrations (Hribljan et al., 2014; Strack et al., 2015) while others report decreasing concentrations (Höll et al., 2009; Wallage et al., 2006).
While changes in DOC net production resulting from WTD drawdown can be assessed through field monitoring, the relative contributions of DOC production and consumption cannot be evaluated (Strack et al., 2008). Process-based biogeochemical models can be relevant tools for understanding DOC dynamics (Evans et al., 2005) and can help identify factors controlling its production and consumption in such environments. In particular, conceptual models are appropriate because they are parsimonious in terms of their number of parameters, avoiding over-parameterization issues (Birkel et al., 2017; Seibert et al., 2009). Nevertheless, these parameters have to be adjusted to every condition through calibration and validation phases when a more physical model would require only adjusting boundary conditions. In addition, conceptual models are valid for a specific range of input data and should not be used for prediction where conditions lie out of their validation range. However, another advantage of using conceptual models is that they usually require commonly measured data (e.g. precipitation and water discharge or water level) so they can be applied to numerous study sites where such data are available, making them a suitable tool for comparing sites with different settings.
When studying DOC dynamics in peatlands, existing conceptual models are composed of a DOC module combined with a hydrological model (Birkel et al., 2014; Futter et al., 2007; Lessels et al., 2015). In these studies, the hydrological model is usually adapted to the catchment and calibrated on stream discharge. However, stream discharge in peatlands is difficult to monitor because the diffuse runoff that occurs in these flat areas can result in multiple outlets. Furthermore, while WTD is a key parameter to explain DOC dynamics (Strack et al., 2008), it is usually not considered for calibration, and water discharge is preferred instead. Therefore, while these models have proven to be well-adapted when modelling a catchment containing a peatland area (Birkel et al., 2014; Futter et al., 2007; Lessels et al., 2015), where the outlet is well-defined, they are more difficult to apply when considering a lone peatland. In this case, the model should focus on the simulation of the WTD, especially when studying DOC dynamics in peatland pore water. Furthermore, a model based on WTD can also provide interesting information about the spatial variability of the dominant hydrological processes when applied to different locations within the same peatland. Models simulating DOC dynamics are usually based on a simple mass balance and DOC production and consumption rates, usually expressed as first-order rate processes (Birkel et al., 2014; Futter et al., 2007; Lessels et al., 2015). In these cases, DOC production and consumption rates are modified using terms related to temperature and soil moisture as these two parameters control the microbial activity and peat decomposition that regulate the production and consumption of DOC in peat water.
In this study, we propose the coupling of existing WTD-dependent hydrological model specifically developed for simulating peatland hydrology (Binet et al., 2013) with a biogeochemical module simulating DOC production and consumption as first-order rate processes. The hydrological model was calibrated on WTD, which is an important driver of the DOC dynamics in peatlands. The model was applied to two sites of a Sphagnum-dominated peatland, one of them having experienced a rewetting initiative. The objectives of this study were (1) to identify the dominant hydrological processes in both rewetted and undisturbed peatland locations, (2) to understand how these hydrological processes affect the DOC dynamics in each of these two locations and (3) to assess the impact of the rewetting on DOC exports in a Sphagnum-dominated peatland.
2.1 Study area and data collection
2.1.1 Site description
The La Guette peatland (150 m a.s.l., 47∘19′N, 2∘16′ E, 20 ha) located in the Sologne forest (Neuvy-sur-Barangeon, France) is an acidic fen with a homogeneous plant cover composed mainly of moss patches (Sphagnum cuspidatum, S. rubellum and S. palustre) and ericaceous shrubs (Calluna vulgaris and Erica tetralix). The peatland has been invaded by Molinia caerulea and Betula spp for 70 years, with an acceleration of the invasion in recent decades (Gogo et al., 2011). This was partly caused by a road ditch located near the outlet that accelerated the peatland drainage (Fig. 1). In February 2014, hydrological restoration was undertaken in the road ditch to raise the WTD and reduce its fluctuations in order to promote soil rewetting. The site is an oligotrophic fen that has not developed any abundant hummock and hollow microtopography, such as is found in a typical ombrotrophic site.
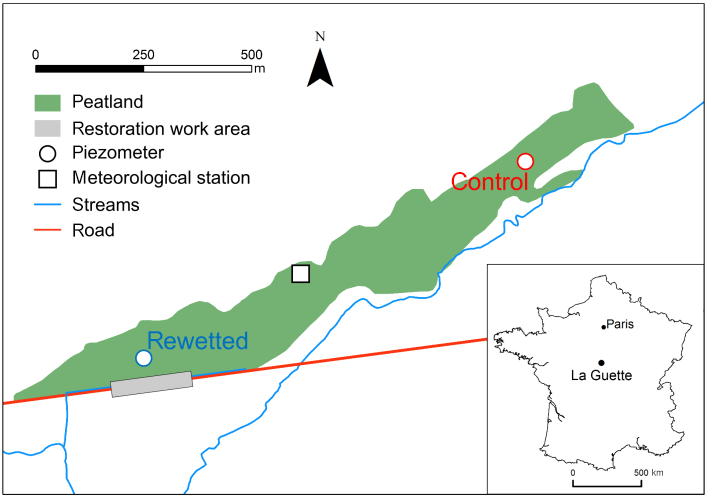
Figure 1Location and settings of the study area. Locations of control and rewetted monitoring are indicated.
2.1.2 Data collection and analysis
WTD and DOC concentrations (DOC) in pore-water were monitored in two locations in the peatland. One is affected by the restoration work and is called “rewetted” while the other is not affected and is called “control” (Fig. 1). The WTDs were recorded in piezometers since February 2014 at a 15 min time step using vented-pressure probes (Orpheus mini, OTT Hydromet). Pore-water was sampled in four wells surrounding each piezometer (each of them less than 5 m from the piezometer) during 13 campaigns that took place every 1 to 4 months between February 2014 and December 2017. The pipes were emptied before sampling to avoid the presence of rain water and ensure that the water sampled was representative of the peatland water. The water samples were filtered using 0.45 µm PES filters on the field and transported in an ice box to the lab where DOC concentrations were determined with a total organic carbon (TOC) analyzer (TOC-L, Shimadzu) within 2 days following sampling (samples stored at 4 ∘C). In this study, the measured DOC is considered to correspond to the DOC of the macropore water as pipes are expected to be filled by gravitational water after being emptied (Zsolnay, 2003).
Pore-water dissolved organic matter (DOM) was characterized by its fluorescence properties through three-dimensional excitation emission matrices (EEMs; Fellman et al., 2010) acquired with F-2500 and F-7000 spectrofluorometers (Hitachi). EEMs were recorded using a 10×10 mm quartz mirrored cell at a photomultiplier voltage of 400 V and with a scan speed of 1500 nm min−1, over ranges of excitation of 220–500 nm in 10 nm steps and with an emission of 230–550 nm in 1 nm steps, respectively; the slit widths of both monochromators were set at 5 nm. A parallel factor analysis (PARAFAC) was performed using the drEEM toolbox according to the processing described in Murphy et al. (2013). PARAFAC is a commonly used method to analyze EEMs based on the decomposition of the DOM fluorescence signature into individual components that provide estimates of the relative contribution of each component to the total DOM fluorescence (Fellman et al., 2010). The method was applied to analyze the samples of two campaigns, those of March 2015 (wet conditions) and September 2015 (dry conditions), in order to compare the DOM composition in two contrasting hydrological settings.
Meteorological data were recorded at an hourly time step from a station located within the peatland between the two studied areas (Fig. 1). Rainfall was measured with a tipping bucket rain gauge and potential evapotranspiration (PET) computed with the FAO Penman–Monteith equation at an hourly time step (Allen et al., 1998) using local solar radiation, wind speed, relative humidity and temperature measurements.
The effect of hydrological conditions (dry period from 1 June to 30 November and wet period from 1 December to 31 May) and location (rewetted or control) on DOC and DOM composition were tested using two-way ANOVA and Tukey's post-hoc tests were used to identify the significant differences (p-value is referred as p).
2.2 Model description
The modelling approach used in this study combines a conceptual hydrological model with a biogeochemical model simulating DOC dynamics. The hydrological model is based on a conceptual water-table-dependent hydrological model that has already been successfully applied in the study area (Binet et al., 2013). This model is coupled with a module based on functions describing DOC production and consumption in pore water that was developed for this study. The model is described in detail in the following subsections.
2.2.1 Hydrological model
The hydrological model is based on the model described by Binet et al. (2013). It is a daily time step, reservoir model specifically developed for peatland hydrology, which integrates a WTD-dependent runoff. Compared to the original model, a few modifications were made in this study in order to improve the model. The overall structure of the new model is presented in Fig. 2.
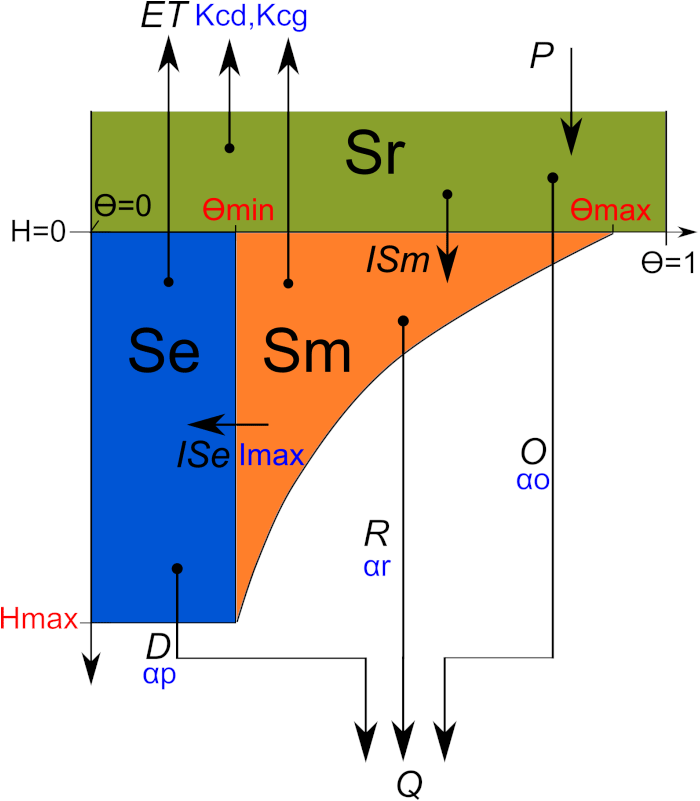
Figure 2Structure of the hydrological model, composed of the three reservoirs of surface (Sr), macroporosity (Sm) and retention (Se). The different fluxes are indicated in italics: P (precipitation), ET (evapotranspiration), ISm (infiltration from Sr to Sm), ISe (infiltration from Sm to Se), D (deep drainage from Se), R (runoff from Sm) and O (overland flow from Sr). Total discharge Q corresponds to the sum of D, R and O. Note that given parameters are in red and calibrated parameters associated with each flux are in blue (see description in Table 1).
The relation between soil-water content and WTD was improved. In the original version the user had to know the relation between WTD and soil-water content. Now the model automatically computes the soil-water content based on the porosity of the percolation reservoir (Θmin), the porosity at the surface (Θmax) and peat depth (Hmax) (Fig. 2). The porosity of the percolation reservoir is considered to be constant over the depth and equal to Θmin. The porosity of the Sm reservoir is equal to 0 at the maximum depth (Hmax) and increases linearly with the storage until the surface where it reaches Θmax–Θmin, with Θmax being the total porosity of the Se and Sm reservoirs at the surface. The new relation between WTD and soil moisture content is given by
where H is the WTD (mm), Θ is the sum of the porosities in Sm and Se at a given H and Smax is the maximum amount of water contained in both Sm and Se (mm).
With this modification, the maximum amount of water stored in the Se reservoir (Semax in mm), which was a calibrated parameter in the original version of the model, is now automatically computed with
Overall, this definition improved the relation between WTD and the water content. In the original version of the model, the porosity of the Sm reservoir was equal to 1, while it now depends on the WTD in order to better represent reality (Bourgault et al., 2017).
A third reservoir was added, Sr (overland flow storage), in order to differentiate the overland flow water (Sr) from the water entering the peat macroporosity (Sm), which were not differentiated in the original model. While it might not significantly affect the hydrological model, this was done to prepare for the addition of the biogeochemical processes that are different for these two reservoirs. Following the addition of the Sr reservoir, a maximum amount of water contained in the Sm reservoir is defined (Smmax in mm) and is computed according to
The routing was also slightly modified to take into account the addition of the new reservoir (Sr). Water from precipitation first fills the Sm reservoir, and the Sr reservoir starts to fill only when Sm is full (Sm = Smmax). The order of priority in which evapotranspiration is removed from the 3 reservoirs is now Sr, Sm and Se.
Finally a discharge coefficient was added to compute the flow from the new Sr reservoir, represented by
where O is the overland flow from the Sr reservoir (mm), αo is the discharge coefficient of the Sr reservoir and Sr is the volume of water in the Sr reservoir (mm).
This flux is added to the total discharge which is now computed according to
where Q is the total discharge (mm), D is the percolation rate from the Se reservoir (mm) and R is the runoff rate from the Sm reservoir (mm).
Given the structure of the model, D represents the drainage of the retention reservoir and can be assimilated to slow deep drainage. R and O represent the drainage of the macroporosity and the overland flow and can be assimilated to fast superficial drainage.
Concerning evapotranspiration, the crop coefficient used to compute evapotranspiration (ET) from ETP was separated into the dormant (Kcd) and the growing (Kcg) season. The latter runs from May to September, with a linear relation between the two coefficients during April and October. This was done to take into account the impact of vascular vegetation growth in peatlands. Finally, a condition was added so that the water level in Sm cannot be lower than the water level in Se.
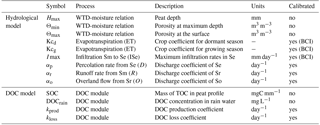
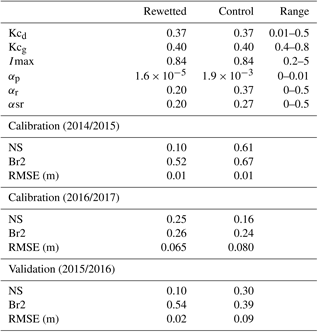
Table 1List of the parameters used in the hydrological and the DOC models. The hydrological flux associated to each parameter is in parenthesis. Calibrated parameters and boundary condition independent (BCI) parameters are indicated.
The computation of the following processes remained unchanged, with infiltration from Sm to Se (ISe), percolation (P) and runoff (R). The reader may refer to Binet et al. (2013) for a more detailed description of the computation of these processes.
The modified hydrological model is now controlled by nine parameters (Table 1). Three input parameters describe the peat structure (Hmax, Θmin and Θmax) and six calibrated parameters control the water fluxes in the model, namely Kcd and Kcg for ET, Imax for the ISe and a discharge coefficient for each reservoir (αp, αr and αo). The forcing variables remained as daily precipitation and PET, the same the original model.
2.2.2 DOC model
To simulate DOC dynamics, a module was developed based on first-order production and loss and mass balance, similar to what can be found in the literature (Birkel et al., 2014; Lessels et al., 2015). Production and loss are computed in the Se and Sm reservoirs, only since the main biogeochemical processes linked to DOC dynamics occur in soil storage and no reaction takes place in the Sr reservoir. DOC production was based on a production coefficient and two additional modifiers based on soil-water content and air temperature, as usually considered in DOC production models (Birkel et al., 2014; Futter et al., 2007; Lessels et al., 2015). The effect of the temperature was based on a Q10 formulation (the factor by which the rate of a reaction increases for every 10∘ rise in the temperature) with a value of 2 according to the value commonly used in DOC production models (Lessels et al., 2015; Michalzik et al., 2003; Tjoelker et al., 2001). The rate modifier based on water content was expressed with a quadratic function to represent the non-linear production of DOC with the variation in soil moisture. DOC production is computed as follows;
where PDOC is the DOC production rate (mg day−1 m−2), kprod is the production constant (day−1), SOC is the amount of organic carbon per mm of peat per square meter (mg mm−1 m−2), T is the air temperature (∘C), S is the amount of water in the reservoir considered (mm) and Smax is the maximum amount of water in the reservoir considered (mm).
DOC loss, corresponding to mineralization and sorption, was based on a loss coefficient linked to air temperature in the same way as DOC production. DOC loss is computed according to
where LDOC is the DOC loss rate (mg day−1 m−2), kloss is the loss constant (day−1), DOC is the DOC concentration in pore water (mg L−1) and S is the amount of water in the reservoir considered (mm).
Finally, the mass balance of DOC is computed in the Sm and Se reservoirs at the daily time step
where the upper index represents the time step, the subscript indicates the reservoir considered (Sm or Se), DOC is the mass of DOC in the considered reservoir per unit area (mg m−2), [DOC]rain is the DOC concentration in rain water (mg L−1), Ise is the infiltration from Sm to Se per unit area (mm day−1), Ism is the infiltration from Sr to Sm (mm day−1) and dt is the time step (here chosen as 1 day).
The DOC model is controlled by four parameters (Table 1). Two input parameters (SOC and DOCrain) and two calibrated parameters controlling DOC dynamics (kloss and kprod). The additional forcing variable is air temperature.
2.2.3 Model setup
The hydrological and biogeochemical model parameters were calibrated for each piezometer in the peatland for the wettest period (1 April 2014 to 1 April 2015) and the driest period (1 October 2016 to 15 December 2017) considering the available data. The model was validated over a period with a more intermediate condition (1 April 2015 to 1 April 2016). The period from 1 May 2016 to 30 September 2016 was not simulated because exceptionally heavy rainfall (return period of about 50 years) occurred on 31 May 2016, causing extensive flooding in the whole region. The definition of the model is not suitable for these exceptional events because the water coming from the river during the flood is not taken into account in the model. However, the flood was not expected to impact DOC in the peat profile since it was already saturated with rain water when the flood of the river reached the peatland. In addition, it has to be noted that the model is able to represent less exceptional events as long as the flood does not reach the peatland (estimated at a 10 to 20-year return period in our case). Θmin and Θmax were set at 0.2 and 1, respectively, and Hmax at 0.6 m, based on field data. [DOC]rain was 2 mg L−1 according to measurements performed on rain water and SOC was set at 833 103 mg mm−1 m−2 following measurements performed on peat samples. Initial conditions were set to observed values for water-table depth and to 15 mg L−1 for DOC.
Table 2Water and DOC balance computed for the simulated period (1 April 2014 to 1 April 2016 and 1 October 2016 to 10 December 2017) in rewetted and control areas. P is precipitation, ET is evapotranspiration, Q is total discharge, O is overland flow, R is macroporosity runoff and D is deep drainage. Best fit is indicated and 5th and 95th percentiles of the behavioural runs and are between brackets.
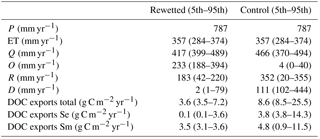
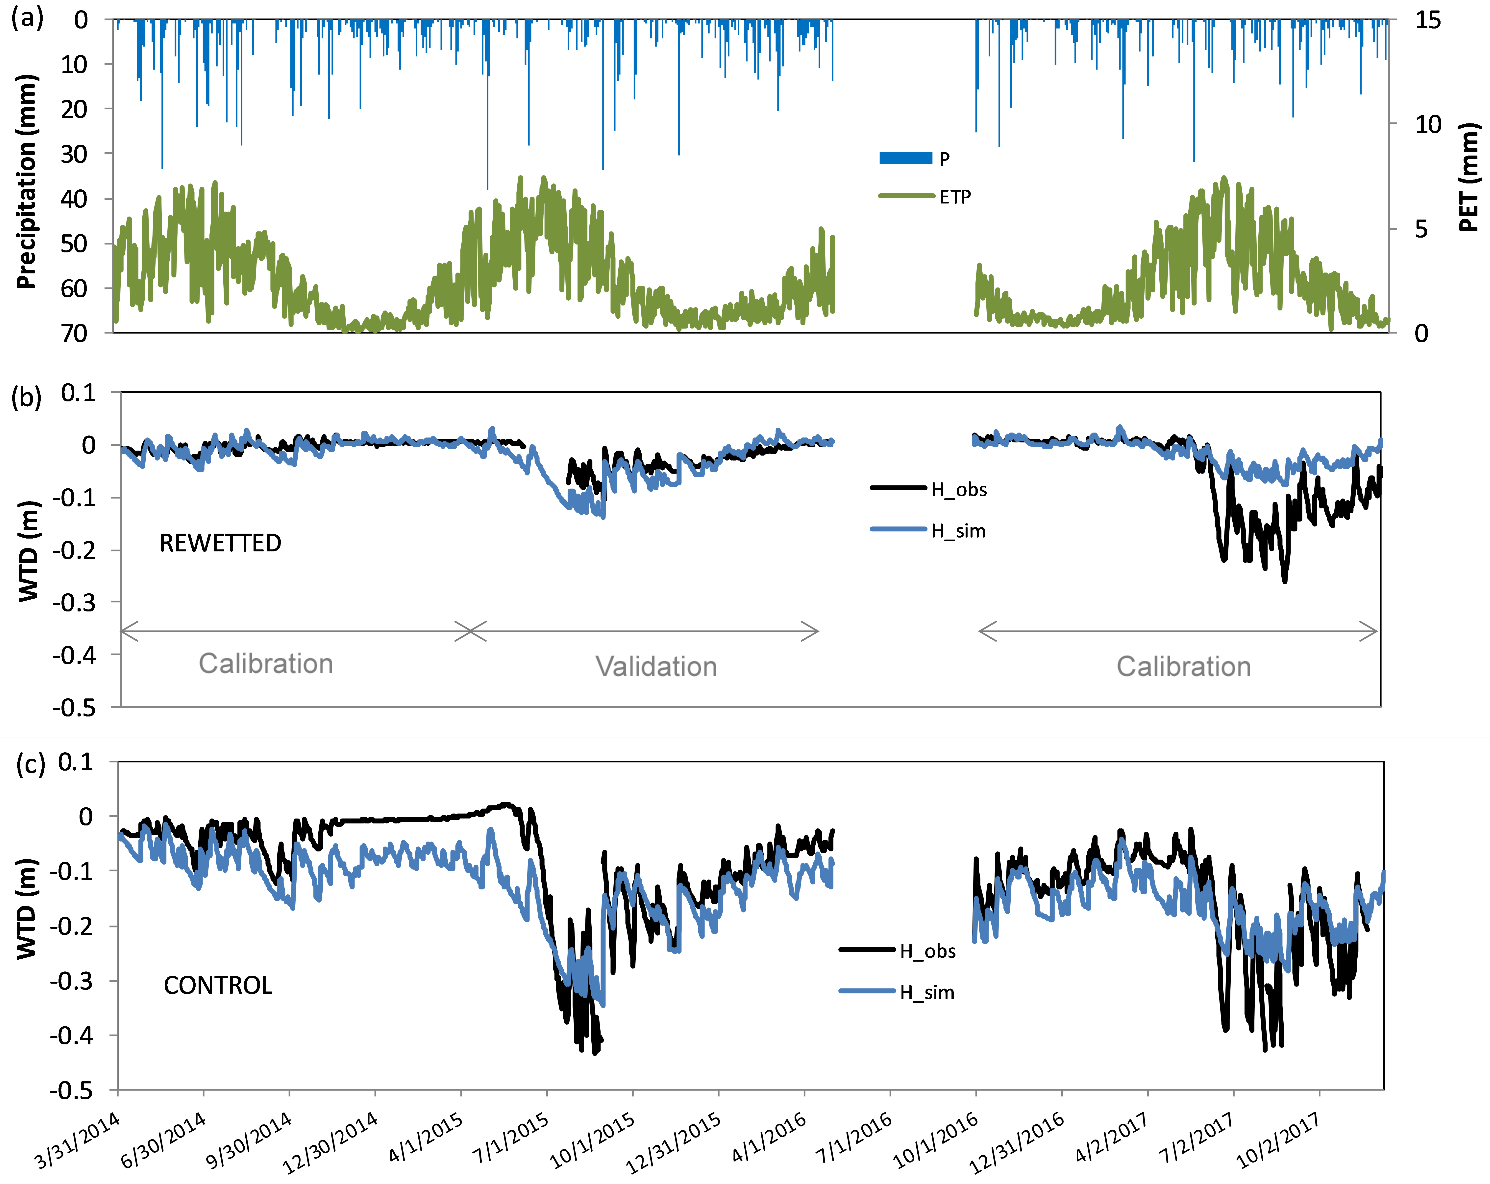
Figure 3(a) Time series of meteorological data (PET, potential evapotranspiration and P, precipitation) used as input data in the hydrological model, (b) simulated (blue) and observed (black) WTD in the rewetted site and (c) simulated and observed WTD in the control site. Calibration and validation periods are also indicated.
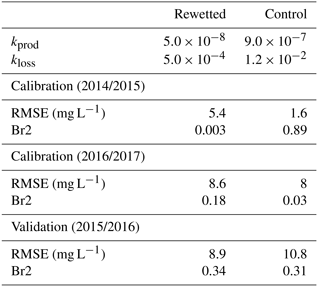
Table 3Calibrated parameters and efficiency criteria for the different periods of calibration and validation. Ranges of parameters used for autocalibration are also indicated.
2.2.4 Model calibration and evaluation
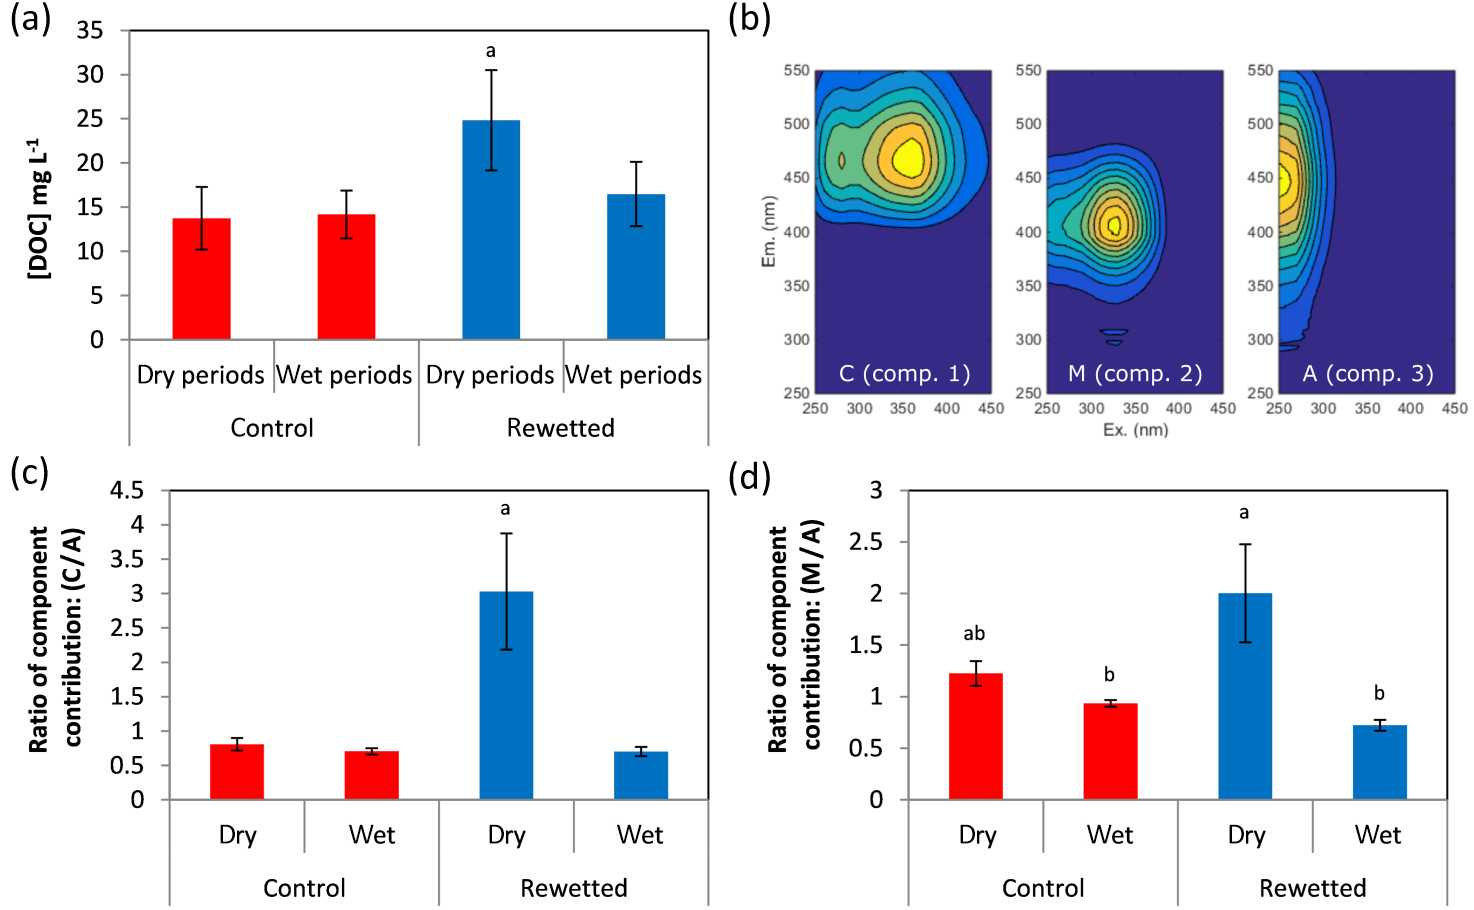
Figure 4(a) DOC concentrations in control and rewetted sites for dry (1 June to 30 November, n=7) and wet periods (1 December to 31 May, n=6). (b) Excitation–emission matrices for the identified PARAFAC components (see the text for details). (c) Ratio of contribution of component C over component A for dry and wet conditions in control and rewetted sites (n=4). (d) Ratio of contribution of component M over component A for dry and wet conditions in control and rewetted sites (n=4). The letter above the bar indicates significant differences across different conditions (Tukey's p<0.01). (b) Excitation–emission matrices for the identified PARAFAC components (see the text for details).
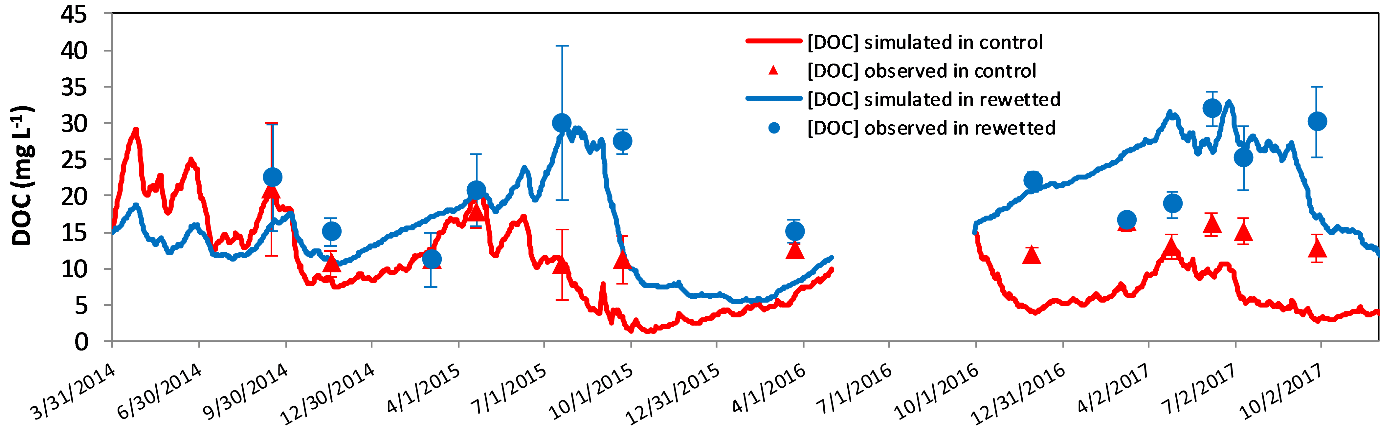
Figure 5Simulated and observed pore-water DOC in control and rewetted sites. Observations are the average of four samples for each sampling date. Error bars indicate standard deviation.
The parameters were calibrated with a Nelder–Mead algorithm (Varadhan et al., 2016), implemented in the R software (R Core Team, 2012) using the Nash–Sutcliffe coefficient on the water-table depth (NS, Nash and Sutcliffe, 1970) as the objective function for the hydrological module and the root-mean-square error (RMSE) for the DOC concentrations in Sm. NS was chosen for the hydrological model because it can take the large variation of the water table into account while RMSE was chosen for the DOC model because DOC variations are not very large and the RMSE provides a quantitative estimate of the error. In addition, the coefficient of determination multiplied by the slope of the regression (Br2; Krause et al., 2005) was computed for both the hydrological and DOC model to better assess the quality of the simulations. The hydrological model was calibrated following a multi-site strategy. The parameters independent of the location within the peatland were kept similar for both sites (Kcd, Kcg and Imax) and only the parameters expected to differ between sites were set free for each site (αr, αsr and αp). This was done in order to prevent an overfitting of the model. The hydrological module was calibrated first because substantially more water-table data were available than DOC concentrations. The DOC module was then calibrated after the calibration of the hydrological model. The ranges allowed for the calibrated parameters are indicated in Table 3. A sensitivity analysis was performed using a Latin-hypercube One-factor-at-a-time (LH-OAT) procedure (Zambrano-Bigiarini and Rojas, 2014) implemented in the R software. The sensitivity analysis was based on NS for the hydrological model. The sensitivity analysis was not performed for the DOC model since it contains only two parameters, both considered sensitive. Finally, an uncertainty analysis of the hydrological model was performed based on a generalized likelihood uncertainty estimation (GLUE) analysis (Beven and Freer, 2001) with 50 000 runs, using a criteria of NS > 0 for both locations to select behavioural simulations. Parameter ranges were the same as the ones used for the calibration (Table 3). Uncertainty boundaries on fluxes are presented as the 5th and 95th of the fluxes obtained from the weighted behavioural parameter sets. The main objective of the uncertainty analysis was to better assess the confidence in the simulated fluxes for which no data were available.
3.1 Observed hydrology and DOC
The mean annual precipitation (P) of the area was 787 mm yr−1 and the mean annual PET 935 mm yr−1 for the period ranging from 1 April 2014 to 10 December 2017 (Table 2). WTD and DOC exhibited different dynamics between rewetted and control areas (Figs. 3, 4 and 5). The water table was close to the surface level in each piezometer during the wet season but the length of this season depended on the severity of the water-table drawdown that occurred during the previous drier season. In 2014, a particularly wet year (P=906 mm and PET = 904 mm from 1 April 2014 to 1 April 2015), the water table reached the surface in December 2014, while for the following season, which was relatively dry (P=736 mm and PET = 960 mm from 1 April 2015 to 1 June 2016), it reached the surface in May 2016. The WTD was lower on average and had a greater variability in the control area than in the rewetted area, but the main difference between the sites was the severity of the maximum water-table drawdown, which was 26 cm in the rewetted and more than 43 cm in the control site, with the same climatic conditions for both locations.
The average of the DOC measurements was 13.3±4.6 mg L−1 in the control site and 21.6±7.2 mg L−1 in the rewetted one. DOCs were globally higher in the rewetted site than in the control site (p-value < 0.001), but this was especially true in the dry period. Overall, DOCs were higher in dry periods than in wet periods for the rewetted site, while this difference was not observed in the control site (Fig. 4a). Finally, when considering the temporal evolution of DOC, the main difference was observed between April and October 2015, where DOCs rose in the rewetted but decreased in the control site (Fig. 5).
The PARAFAC analysis revealed three main components characterizing the DOM (Fig. 4b). According to the review by Fellman et al. (2010), the first component (ex 360, em 466) can be described as having a high molecular weight and being humic, and it is referred to here under its original name as C. The second component (ex 330, em 407) can be described as having a low molecular weight and is referred to here as M. The third component (ex 250, em 446) can be described as having a high molecular weight and being humic, and it is referred to here as A. Component A is known to be more aromatic than C (Fellman et al., 2010), and even if in our case, the shorter emission wavelength of component A compared to component C may also indicate that C is more aromatic than A (McKnight et al., 2001). The ratio of the contribution of component C to the contribution of A and of the contribution of component M to the contribution of A in pore-water samples of the wet and dry campaigns are presented in Fig. 4c and d. A large increase in the contribution of C relative to the contribution of A was observed in dry conditions in the rewetted area (p<0.001), while the ratio was similar for control and rewetted sites in wet conditions. Similarly, a significant increase in the contribution of M relative to the contribution of A was observed during dry conditions in the rewetted site compared to wet conditions in control and rewetted areas (p<0.001).
3.2 Hydrological modelling
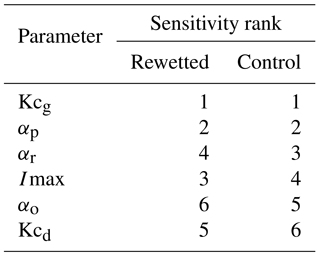
The best simulated and the observed WTD dynamics are shown in Fig. 3. NS and Br2 were greater than 0.10 and 0.24 for calibration periods and reached values greater than 0.10 and 0.39 for validation periods, respectively. The RMSE ranged between 1 and 9 cm and no drop in the model performance was observed for the validation period, compared to the calibration ones (Table 3). The model performed better during the wettest year in the control area and better during the intermediate and the driest years in the rewetted area. The important point is that the model was able to reproduce two different WTD dynamics using the same input data (i.e. rainfall and PET). These differences are explained by the modification in calibrated parameter values. As the evapotranspiration coefficient and maximum infiltration rates were the same for each site, the differences are driven by the discharge coefficients. The values of the three discharge coefficients (αp, αr and αsr), corresponding to the intensity of the drainage of the three reservoirs (Se, Sm and Sr), were higher in the control site than in the rewetted one (Table 3). These differences were reflected in the water balance of each location, with a lower water discharge (Q) in the rewetted site than in the control one (Table 2). However, fast superficial drainage (O) was higher in the rewetted site than in the control one, in contrast to the slow deep drainage (R+D). This is confirmed by the uncertainty analysis, which showed that despite large uncertainties in flows (80 to 250 mm), the difference between overland flow and drainage flow in the two sites can be considered significant, as the ranges provided by the uncertainty analysis do not overlap. Finally, the sensitivity analysis indicated that the model is the most sensitive to the evapotranspiration coefficient in the growing season and the Se discharge coefficient, and the model is least sensitive to the evapotranspiration coefficient in the dormant period and the Sr discharge coefficient for both locations (Table 4).
Table 4Sensitivity rank of the parameters of the hydrological model.
3.3 DOC dynamics modelling
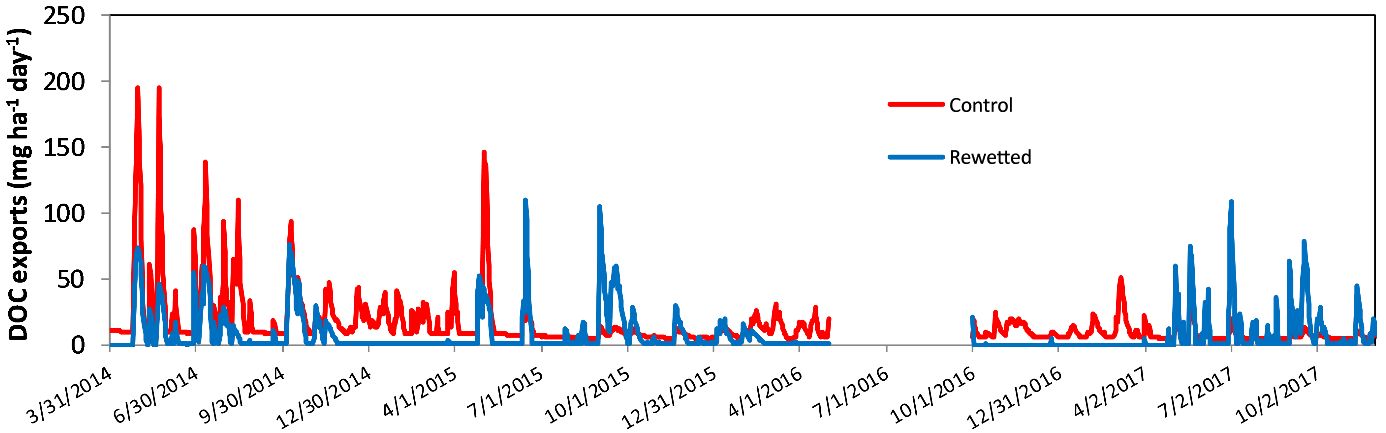
Simulated and observed pore-water DOCs are shown in Fig. 5. The simulations presented a RMSE < 9 mg L−1 for calibration and RMSE <11 mg L−1 for validation in both rewetted and control sites, and with no systematic overestimations or underestimations. The model performed better for the control than for the rewetted site, except for the driest year (Table 5). The model was able to reproduce DOC dynamics in both locations, especially the rising concentrations in the rewetted site and the decreasing concentrations in the control site during summer 2015 (Fig. 5). The DOC balance was computed for each location and is shown in Table 2. Overall, DOC exports were slightly higher but were within the same order of magnitude for each location. Nevertheless, a difference can be observed for the partitioning between the exports from the Se and Sm reservoirs. While 44 % of the total DOC exports originated from Se in the control site, exports from Se only account for 0.02 % of the total DOC exported in the rewetted site (Table 2). Figure 6 shows the temporal dynamics of simulated daily DOC exports for each location. DOC exports were episodic in both locations, with the highest peaks for the control site during the wettest year and the highest peaks in the rewetted site for the driest year. The minimum daily export rates were higher in the control site than in the rewetted site.
4.1 Hydrological processes
In this study, observed water-table dynamics were used to better understand the dominant hydrological processes taking place in the two locations of a restored peatland (rewetted and control) by calibrating a conceptual model. Though simple (six calibrated parameters), the model was able to reproduce the specific water-table dynamics in each location of the studied area using the same input data (precipitation and potential evapotranspiration). This difference in observed water-table dynamics (17 cm of difference for the maximum water-table drawdown) is reflected in the calibrated parameter values for each location (Table 3). In addition, and in order to better assess the dominant processes, a sensitivity analysis of the model was performed for each location (Table 4). The results indicate that the most sensitive parameters are Kcg and αp, which are related to the evapotranspiration during the growing season and the deep drainage of the retention reservoir (Se), respectively, meaning that these processes are the most important in explaining the peatland hydrology. While evapotranspiration coefficients are the same for both sites, the drainage coefficient of the retention reservoir is the highest for the control location, and this difference may explain the dissimilarity in the severity of the observed water-table drawdown and simulated water-table balance in the two locations. Overland flow (O) accounts for 56 % of the total discharge in the rewetted site, while it represents less than 1 % of the total discharge in the control one. On the contrary, deep drainage (D) represents less than 1 % of the total discharge in the rewetted site and 24 % in the control one. This difference in the partitioning between fast superficial and slow deep discharge can be related to the restoration work, since the blockage of the drain could have reduced the deep drainage and increased the amount of surface drainage in the rewetted area. While the difference in water-table dynamics between the two locations can be explained by other factors than restoration (e.g. geomorphological settings and vegetation cover), observations showed that the restoration work created an inundated area in its vicinity, in agreement with the results of Wilson et al. (2010), indicating that the frequency of the full saturation of the peat increases markedly after a drain blocking operation. In addition, microtopography and vegetation cover are very homogenous in the area and these factors cannot explain the observed differences in water-table dynamics between the two locations. Therefore, in this case, the model can help to characterize the impact of restoration as seen in the simulated water balance and the value of the deep drainage coefficients. It enables deep-drainage-dominated (control) and surface-drainage-dominated (rewetted) systems to be identified within the same peatland, in relation to hydrological restoration work. However, these results can only be considered an interpretation, as there are no measurements of fluxes.
4.2 Control factors of DOC dynamics
4.2.1 Simulation results
A module simulating DOC production and loss was added to the hydrological model in order to better understand DOC dynamics in the two peatland locations, with RMSE between 1.6 and 10.8 mg L−1 for the different calibration and validation periods. However, the quality of the results is more difficult to assess than the hydrological model, because few data were available for the calibration and validation steps. Nevertheless, it is noteworthy that the model, based on only two calibrated parameters, is able to capture the two different dynamics recorded in each location, i.e. a rising DOC in the downstream location in summer 2015 and a decreasing DOC in the upstream location in the same period.
4.2.2 DOC concentrations and control factors
Long-term studies have reported decreasing pore-water DOC more than 10 years after a restoration operation took place (Höll et al., 2009; Wallage et al., 2006), while others observed increasing DOC after restoration (Hribljan et al., 2014; Strack et al., 2015). Glatzel et al. (2003) observed an increase in pore-water DOC following a drain blocking operation but predicted a decrease in DOC over time due to a depletion of easily decomposable organic matter in the peat. In this study, the results indicate that during the three years following a restoration operation, DOCs were higher in the rewetted site than in the control location during the dry period (from 1 June to 30 November), while they were similar during the wet period. In addition, the difference in DOC dynamics are also reflected in DOM quality inferred from its fluorescence properties, with a greater increase in low molecular weight compounds (component M) and fewer aromatic high molecular weight compounds (component C) in the rewetted location during the dry season compared to the control area. These findings are in agreement with the studies by Höll et al. (2009), Hribljan et al. (2014) and Strack et al. (2015), who observed that wetter sites would result in pore water with smaller and fewer aromatic dissolved organic molecules (likely sourced from inputs of fresh litter from growing vegetation) than the sites with a lower water table.
The main difference in DOC is observed during the dry period, when the water-table dynamics are different between the two locations. This would confirm that hydrology, especially the magnitude of the water-table drawdown, might be a major factor controlling DOC dynamics in the peatland. Indeed, the higher WTD in the dry period in the rewetted site is related to a higher DOC than in the control site where the WTD is lower. A larger proportion of low aromatic DOC is also observed during the same period in the rewetted site than in the control site. Therefore, we propose to explain the differences in DOC by the difference in water-table drawdown in the dry period. When the water-table drawdown is small (high water table), more DOC is produced from the top peat layer containing more recent and easily biodegradable organic matter than when the water-table drawdown is more severe (low water table). In addition, anaerobic conditions in the rewetted site would lead to the less efficient decomposition of organic matter, increasing the production of water-soluble intermediate metabolites (Kalbitz et al., 2000; Strack et al., 2008). An increase in DOC in the rewetted location can also be explained by an increase in the photic zone, potentially supporting the algae photosynthate production that enhances the DOC release into the water column, as suggested by Hribljan et al. (2014). However, the latter hypothesis is the least probable in our case, since no ponding water is observed in summer in the study area. The ability of the model to reproduce pore-water DOC dynamics can be attributed to its consideration of the water-table drawdown, which is expressed in the model through the use of soil moisture (based on water level in the Sm and Se reservoirs) as a production rate modifier. Finally, while this study focuses on the hydrological control on DOC dynamics, it is important to note that other factors not directly integrated in the model are also known to affect DOC exports such as the pH and redox state (e.g. Grybos et al., 2009; Knorr, 2013).
4.2.3 DOC exports
The model enables DOC exports to be estimated for each location (Table 2). The results (values) are in the range reported in the literature (from 4.2 to 18.9 g-C m2 yr−1, Birkel et al., 2014, 2017; Jager et al., 2009). The DOC exported from the control site is slightly higher than that from the rewetted but is within the same order of magnitude for both sites. Therefore, taking into account the simplicity of the model, the difference in DOC exports between both sites was not considered significant. The reduction in DOC exports for the best-fit simulation has to be related to the increase in the amount of quick surface overflow in the rewetted site, which is characterized by a low DOC and therefore low DOC exports. In the rewetted site, the water does not infiltrate in the already saturated peat porosity and while DOC increases, DOC exports decreases. In addition, the partitioning between DOC exports from the two production reservoirs is clearly different for each location. According to the water balance, DOC exports are mainly driven by the drainage from the Sm reservoir in the rewetted site, while the amount of DOC exported through deep drainage and runoff is more balanced in the control site. This clearly reflects the dominant hydrological processes in each location and can be seen in the temporal variability in DOC exports (Fig. 6). The DOC exports are more episodic in the rewetted site, with 75 % of the DOC exported during only 13 % of the total simulated period length (47 % of the total DOC export for the same period in the control site). These results are consistent with the results of Birkel et al. (2017), who highlighted the non-linearity of DOC exports in a peatland catchment and reported that 60 % of the DOC was exported in 30 % of the time through rapid near-surface runoff in a small peat catchment. However, in the control site, DOC exports are less episodic than in the rewetted one in accordance with the dominance of a slow but regular deep drainage of the Se reservoir in this site. These results confirm that hydrology has a major impact on DOC load dynamics (Birkel et al., 2017; Tunaley et al., 2016), since it is the partitioning between superficial quick flow and slow deep drainage that controls the temporal dynamics of DOC exports (Birkel et al., 2014). This study also suggests that this hydrological control on DOC fluxes also affects the source of DOC exported from the peatland, in relation to the difference in DOM composition observed with the fluorescence analysis. Therefore, in the rewetted area, the DOC exported will exhibit characteristics of top peat-layer recent organic matter (less aromatic), while it is likely derived from older and deeper organic matter (more aromatic) in the control area. These findings indicate that while its impact on DOC loads can be negligible, restoration work might have an impact on stream ecosystems by releasing a less aromatic DOM, especially during the dry season. However, these findings are valid for a 3-year period following the restoration and might be different for the future, underlining the need for long-term monitoring to correctly assess the impact of hydrological restoration on DOC dynamics.
4.3 Perspectives for application of the model
The model developed in this study follows a parsimonious coupled hydrology-biogeochemistry model philosophy (Birkel et al., 2014, 2017; Lessels et al., 2015). By keeping parameterization to a minimum, it was able to identify factors controlling WTD and DOC dynamics in the two contrasting sites of the studied peatland with a relatively low requirement of input data (precipitation, potential evapotranspiration and temperature). Contrary to similar models, here hydrology is calibrated on WTD instead of on stream discharge. This way, the model proves to be a relevant tool to be applied in flat areas where catchment delineation is highly uncertain and outlets difficult to monitor. It is also useful to explore the hydrology of areas located within the same peatland by performing a multi-site calibration. However, it is necessary to perform an uncertainty analysis to better assess confidence in the computed fluxes when no data are available. The careful application of the model highlights the impact of hydrological restoration on hydrology and DOC dynamics that would have been difficult to study with models calibrated on stream discharge and are applicable at the catchment scale only. In addition, the DOC model developed in this study has shown good results in modelling pore-water DOC dynamics, meaning that the two-calibrated parameter model is adapted to simulate DOC dynamics in peatland ecosystems. Therefore, if applied to several WTD time series, it could provide spatial information by identifying the main areas of DOC production within a peatland. This model could also be applied to longer time series and different study sites to assess the effect of hydrological restoration over longer periods, and the dominant controlling factors in peatlands with different settings.
A conceptual hydrological model, developed especially for peatland and calibrated on WTD, has been combined with a simple DOC production–loss model and applied to two locations of a peatland, one which was affected by hydrological restoration. The application of this model has shown the following:
-
The hydrological restoration was found to impact water balance by increasing fast superficial drainage, compared to slow deep drainage.
-
The intensity of the maximum water-table drawdown was found to be the main factor in controlling pore-water DOC dynamics in the peatland.
-
A higher DOC in the rewetted location was linked to differences in DOM composition.
-
Simulated DOC exports were within the same order of magnitude for rewetted and control locations in a short-term period (3 years).
-
Water partitioning between fast superficial drainage and slow deep drainage controls DOC sources as well as the temporal dynamics of DOC exports.
These results suggest that hydrological restoration does not affect short term DOC fluxes in peatland. In addition, this study has shown that the proposed conceptual hydrological and biogeochemical model can provide relevant information about water balance and the factors controlling element cycling processes in peatlands. The application of a WTD-based model is a relevant alternative to a discharge calibrated catchment model when the outlet is not easily identifiable or when seeking spatial information within peatlands.
Data and model code are available on request from the authors.
FLD, SG and SB designed the study site restoration and monitoring. LBJ, SG, FLD, FL and LP helped with instrumentation and data collection. CD, NJ and RZ helped with fluorescence analysis and data interpretation. LBJ and SB developed the model. LBJ performed simulations and data analysis. LBJ prepared the draft of the manuscript. FL, SG, CD, NJ, FLD and SB helped improve the final manuscript.
The authors declare that they have no conflict of interest.
This paper is a contribution of the Labex VOLTAIRE (ANR-10-LABX-100- 01) and
of the PIVOTS project (ARD 2020 of the Centre Val de Loire region, CPER and
FEDER). This study was undertaken in the framework of the Service National
d'Observation Tourbières (French Peatland Observatory), accredited by the
INSU/CNRS. The authors would like to thank Audrey Guirimand-Dufour and Franck Le
Moing for their help in fluorescence analysis, Nathalie Lottier for the DOC analysis,
Elizabeth Rowley-Jolivet for the revision of the English version and the reviewers for
their helpful comments and suggestions.
Edited
by: Insa Neuweiler
Reviewed by: Michel Bechtold and one anonymous referee
Allen, R. G., Pereira, L. S., Raes, D., and Smith, M.: Crop evapotranspiration: Guidelines for computing crop water requirements, in: FAO, p. 300, 1998.
Beven, K. and Freer, J.: Equifinality, data assimilation, and uncertainty estimation in mechanistic modelling of complex environmental systems using the GLUE methodology, J. Hydrol., 249, 11–29, https://doi.org/10.1016/S0022-1694(01)00421-8, 2001.
Billett, M. F. F., Palmer, S. M. M., Hope, D., Deacon, C., Storeton-West, R., Hargreaves, K. J. J., Flechard, C., and Fowler, D.: Linking land-atmosphere-stream carbon fluxes in a lowland peatland system, Global Biogeochem. Cy., 18, GB1024, https://doi.org/10.1029/2003GB002058, 2004.
Binet, S., Gogo, S., and Laggoun-Défarge, F.: A water-table dependent reservoir model to investigate the effect of drought and vascular plant invasion on peatland hydrology, J. Hydrol., 499, 132–139, https://doi.org/10.1016/j.jhydrol.2013.06.035, 2013.
Birkel, C., Soulsby, C., and Tetzlaff, D.: Integrating parsimonious models of hydrological connectivity and soil biogeochemistry to simulate stream DOC dynamics, J. Geophys. Res.-Biogeo., 119, 1030–1047, https://doi.org/10.1002/2013JG002551, 2014.
Birkel, C., Broder, T., and Biester, H.: Nonlinear and threshold-dominated runoff generation controls DOC export in a small peat catchment, J. Geophys. Res.-Biogeo., 122, 498–513, https://doi.org/10.1002/2016JG003621, 2017.
Bourgault, M.-A., Larocque, M., and Garneau, M.: Quantification of peatland water storage capacity using the water table fluctuation method, Hydrol. Process., 31, 1184–1195, https://doi.org/10.1002/hyp.11116, 2017.
Clark, J. M., Ashley, D., Wagner, M., Chapman, P. J., Lane, S. N., Evans, C. D., and Heathwaite, A. L.: Increased temperature sensitivity of net DOC production from ombrotrophic peat due to water table draw-down, Glob. Change Biol., 15, 794–807, https://doi.org/10.1111/j.1365-2486.2008.01683.x, 2009.
Evans, C. D., Monteith, D. T., and Cooper, D. M.: Long-term increases in surface water dissolved organic carbon: Observations, possible causes and environmental impacts, Environ. Pollut., 137, 55–71, https://doi.org/10.1016/j.envpol.2004.12.031, 2005.
Fellman, J. B., Hood, E., and Spencer, R. G. M.: Fluorescence spectroscopy opens new windows into dissolved organic matter dynamics in freshwater ecosystems: A review, Limnol. Oceanogr., 55, 2452–2462, https://doi.org/10.4319/lo.2010.55.6.2452, 2010.
Freeman, C., Evans, C. D., Monteith, D. T., Reynolds, B., and Fenner, N.: Export of organic carbon from peat soils, Nature, 412, p. 785, https://doi.org/10.1038/35090628, 2001.
Futter, M. N., Butterfield, D., Cosby, B. J., Dillon, P. J., Wade, A. J., and Whitehead, P. G.: Modeling the mechanisms that control in-stream dissolved organic carbon dynamics in upland and forested catchments, Water Resour. Res., 43, W02424, https://doi.org/10.1029/2006WR004960, 2007.
Glatzel, S., Kalbitz, K., Dalva, M., and Moore, T.: Dissolved organic matter properties and their relationship to carbon dioxide efflux from restored peat bogs, Geoderma, 113, 397–411, 2003.
Gogo, S., Laggoun-Défarge, F., Delarue, F., and Lottier, N.: Invasion of a Sphagnum-peatland by Betula spp and Molinia caerulea impacts organic matter biochemistry. Implications for carbon and nutrient cycling, Biogeochemistry, 106, 53–69, https://doi.org/10.1007/s10533-010-9433-6, 2011.
Gorham, E.: Northern peatlands: Role in the carbon cycle and probably responses to climate warming, Ecol. Appl., 1, 182–195, https://doi.org/10.2307/1941811, 1991.
Grybos, M., Davranche, M., Gruau, G., Petitjean, P., and Pédrot, M.: Increasing pH drives organic matter solubilization from wetland soils under reducing conditions, Geoderma, 154, 13–19, https://doi.org/10.1016/j.geoderma.2009.09.001, 2009.
Höll, B. S., Fiedler, S., Jungkunst, H. F., Kalbitz, K., Freibauer, A., Drösler, M., and Stahr, K.: Characteristics of dissolved organic matter following 20 years of peatland restoration, Sci. Total Environ., 408, 78–83, https://doi.org/10.1016/j.scitotenv.2009.08.046, 2009.
Hribljan, J. A., Kane, E. S., Pypker, T. G., and Chimner, R. A.: The effect of long-term water table manipulations on dissolved organic carbon dynamics in a poor fen peatland, J. Geophys. Res.-Biogeo., 119, 577–595, https://doi.org/10.1002/2013JG002527, 2014.
Jager, D. F., Wilmking, M., and Kukkonen, J. V. K.: The influence of summer seasonal extremes on dissolved organic carbon export from a boreal peatland catchment: evidence from one dry and one wet growing season, Sci. Total Environ., 407, 1373–1382, https://doi.org/10.1016/j.scitotenv.2008.10.005, 2009.
Kalbitz, K., Solinger, S., Park, J.-H, Michalzik, B., and Matzner, E.: Controls on the dynamics of dissolved organic matter in soils: a review, Soil Sci., 165, 277–304, https://doi.org/10.1097/00010694-200004000-00001, 2000.
Knorr, K.-H.: DOC-dynamics in a small headwater catchment as driven by redox fluctuations and hydrological flow paths – are DOC exports mediated by iron reduction/oxidation cycles?, Biogeosciences, 10, 891–904, https://doi.org/10.5194/bg-10-891-2013, 2013.
Krause, P., Boyle, D. P., and Bäse, F.: Comparison of different efficiency criteria for hydrological model assessment, Adv. Geosci., 5, 89–97, https://doi.org/10.5194/adgeo-5-89-2005, 2005.
Lessels, J. S., Tetzlaff, D., Carey, S. K., Smith, P., and Soulsby, C.: A coupled hydrology–biogeochemistry model to simulate dissolved organic carbon exports from a permafrost-influenced catchment, Hydrol. Process., 29, 5383–5396, https://doi.org/10.1002/hyp.10566, 2015.
McKnight, D. M., Boyer, E. W., Westerhoff, P. K., Doran, P. T., Kulbe, T., and Andersen, D. T.: Spectrofluorometric characterization of dissolved organic matter for indication of precursor organic material and aromaticity, Limnol. Oceanogr., 46, 38–48, https://doi.org/10.4319/lo.2001.46.1.0038, 2001.
Menberu, M. W., Tahvanainen, T., Marttila, H., Irannezhad, M., Ronkanen, A. K., Penttinen, J., and Kløve, B.: Water-table-dependent hydrological changes following peatland forestry drainage and restoration: Analysis of restoration success, Water Resour. Res., 52, 3742–3760, https://doi.org/10.1002/2015WR018578, 2016.
Michalzik, B., Tipping, E., Mulder, J., Gallardo-Lancho, J. F., Matzner, E., Bryant, C. L., Clarke, N., Lofts, S., and Vicente-Esteban, M. A.: Modelling the production and transport of Dissolved Organic Carbon in forest soils, Biogeochemistry, 66, 241–264, https://doi.org/10.1023/B:BIOG.0000005329.68861.27, 2003.
Murphy, K. R., Stedmon, C. A., Graeber, D., and Bro, R.: Fluorescence spectroscopy and multi-way techniques. PARAFAC, Anal. Methods, 5, 6557–6566, https://doi.org/10.1039/c3ay41160e, 2013.
Nash, J. and Sutcliffe, J. V: River flow forecasting through conceptual models part I – A discussion of principles, J. Hydrol., 10, 282–290, 1970.
Pastor, J., Solin, J., Bridgham, S. D., Updegraff, K., Harth, C., Weishampel, P., and Dewey, B.: Global warming and the export of dissolved organic carbon from boreal peatlands, Oikos, 100, 380–386, https://doi.org/10.1034/j.1600-0706.2003.11774.x, 2003.
R Core Team: R: A language and environment for statistical computing, R Foundation for Statistical Computing, Vienna, Austria, available at: http://www.r-project.org/ (last access: 17 September 2018), 2012.
Ritson, J. P., Bell, M., Graham, N. J. D., Templeton, M. R., Brazier, R. E., Verhoef, A., Freeman, C., and Clark, J. M.: Simulated climate change impact on summer dissolved organic carbon release from peat and surface vegetation: implications for drinking water treatment, Water Res., 67, 66–76, https://doi.org/10.1016/j.watres.2014.09.015, 2014.
Seibert, J., Grabs, T., Köhler, S., Laudon, H., Winterdahl, M., and Bishop, K.: Linking soil- and stream-water chemistry based on a Riparian Flow-Concentration Integration Model, Hydrol. Earth Syst. Sci., 13, 2287–2297, https://doi.org/10.5194/hess-13-2287-2009, 2009.
Strack, M., Waddington, J. M., Bourbonniere, R. A., Buckton, E. L., Shaw, K., Whittington, P., and Price, J. S.: Effect of water table drawdown on peatland dissolved organic carbon export and dynamics, Hydrol. Process., 22, 3373–3385, https://doi.org/10.1002/hyp.6931, 2008.
Strack, M., Zuback, Y., McCarter, C., and Price, J.: Changes in dissolved organic carbon quality in soils and discharge 10 years after peatland restoration, J. Hydrol., 527, 345–354, https://doi.org/10.1016/j.jhydrol.2015.04.061, 2015.
Tjoelker, M. G., Oleksyn, J., and Reich, P. B.: Modelling respiration of vegetation: Evidence for a general temperature-dependent Q10, Glob. Change Biol., 7, 223–230, https://doi.org/10.1046/j.1365-2486.2001.00397.x, 2001.
Tunaley, C., Tetzlaff, D., Lessels, J., and Soulsby, C.: Linking high-frequency DOC dynamics to the age of connected water sources, Water Resour. Res., 52, 5232–5247, https://doi.org/10.1002/2015WR018419, 2016.
Varadhan, R., Borchers, H. W., and Varadhan, M. R.: Package “dfoptim”, available at: https://cran.r-project.org/web/packages/dfoptim/index.html (last access: 17 September 2018), 2016.
Wallage, Z. E., Holden, J., and McDonald, A. T.: Drain blocking: an effective treatment for reducing dissolved organic carbon loss and water discolouration in a drained peatland, Sci. Total Environ., 367, 811–21, https://doi.org/10.1016/j.scitotenv.2006.02.010, 2006.
Wilson, L., Wilson, J., Holden, J., Johnstone, I., Armstrong, A., and Morris, M.: Recovery of water tables in Welsh blanket bog after drain blocking: Discharge rates, time scales and the influence of local conditions, J. Hydrol., 391, 377–386, https://doi.org/10.1016/j.jhydrol.2010.07.042, 2010.
Worrall, F., Gibson, H. S., and Burt, T. P.: Modelling the impact of drainage and drain-blocking on dissolved organic carbon release from peatlands, J. Hydrol., 338, 15–27, https://doi.org/10.1016/j.jhydrol.2007.02.016, 2007.
Yu, Z. C.: Northern peatland carbon stocks and dynamics: a review, Biogeosciences, 9, 4071–4085, https://doi.org/10.5194/bg-9-4071-2012, 2012.
Zambrano-Bigiarini, M. and Rojas, R.: hydroPSO: Particle swarm optimisation, with focus on environmental models, available at: https://cran.r-project.org/web/packages/hydroTSM/, http://rforge.net/hydroTSM/ (last access: 17 September 2018), R Package, version 0.3-3, 2014.
Zsolnay, Á.: Dissolved organic matter: Artefacts, definitions, and functions, Geoderma, 113, 187–209, 2003.