the Creative Commons Attribution 4.0 License.
the Creative Commons Attribution 4.0 License.
 | 05 Nov 2018
Seasonal drought predictability and forecast skill in the semi-arid endorheic Heihe River basin in northwestern China
Feng Ma
Lifeng Luo
Qingyun Duan
Endorheic and arid regions around the world are suffering from serious drought problems. In this study, a drought forecasting system based on eight state-of-the-art climate models from the North American Multi-Model Ensemble (NMME) and a Distributed Time-Variant Gain Hydrological Model (DTVGM) was established and assessed over the upstream and midstream of Heihe River basin (UHRB and MHRB), a typical arid endorheic basin. The 3-month Standardized Precipitation Index (SPI3) and 1-month Standardized Streamflow Index (SSI1) were used to capture meteorological and hydrological drought, and values below −1 indicate drought events. The skill of the forecasting systems was evaluated in terms of anomaly correlation (AC) and Brier score (BS) or Brier skill score (BSS). The predictability for meteorological drought was quantified using AC and BS with a “perfect model” assumption, referring to the upper limit of forecast skill. The hydrological predictability was to distinguish the role of initial hydrological conditions (ICs) and meteorological forcings, which was quantified by root-mean-square error (RMSE) within the ESP (Ensemble Streamflow Prediction) and reverse ESP framework. The UHRB and MHRB showed season-dependent meteorological drought predictability and forecast skill, with higher values during winter and autumn than that during spring. For hydrological forecasts, the forecast skill in the UHRB was higher than that in MHRB. Predicting meteorological droughts more than 2 months in advance became difficult because of complex climate mechanisms. However, the hydrological drought forecasts could show some skills up to 3–6 lead months due to memory of ICs during cold and dry seasons. During wet seasons, there are no skillful hydrological predictions from lead month 2 onwards because of the dominant role of meteorological forcings. During spring, the improvement of hydrological drought predictions was the most significant as more streamflow was generated by seasonal snowmelt. Besides meteorological forcings and ICs, human activities have reduced the hydrological variability and increased hydrological drought predictability during the wet seasons in the MHRB.


Drought is among the most costly natural hazards in many parts of the world. It is defined as a prolonged period of below-average rainfall, leading to water shortages in soil and the hydrologic system. Drought can have a substantial effect on many sectors, such as agriculture, ecosystem and economy, and its impacts can vary from region to region. Mitigation of drought impact requires improved understanding of the predictability of drought and the capability to predict drought at sufficient lead times (Below et al., 2007; Sheffield and Wood, 2012; Smith and Katz, 2013). Statistical, dynamic and hybrid (statistical–dynamic) methods have been used for drought predictions (Mariotti et al., 2013; Hao et al., 2018; Mishra and Singh, 2011; Pozzi et al., 2013; Luo and Wood, 2007; Luo et al., 2008). The statistical method is based on the historical relationship between some aspects of drought and a number of predictors (e.g., large-scale climate signals). The dynamic method relies on the skill of state-of-the-art general circulation models (GCMs) or hydrologic models that represent physical processes linked with drought development. A hybrid method combines the statistical and dynamic methods, which has been shown to improve drought prediction in certain case studies (Pan et al., 2013; Schepen et al., 2016). However, drought remains one of the least understood natural hazards that are affected by many contributing factors, including meteorological anomalies, land–atmosphere interaction and human activities (Van Loon et al., 2016a, b), which makes accurate drought prediction a challenge (Hao et al., 2018).
Recently, climate forecasts from the North American Multi-Model Ensemble (NMME; Kirtman et al., 2014) have been widely applied to drought predictions globally and regionally (Ma et al., 2015, 2017; Mo and Lyon, 2015; Thober and Kumar, 2015; Yuan and Wood, 2013; Yuan, 2016). The NMME-based climate forecasts (e.g., precipitation and temperature) for hydrometeorological forecasts exhibit some improvement in skills over the reference forecasts such as climatology forecasts, persistence forecasts or ensemble streamflow prediction (ESP) (e.g., Ma et al., 2015, 2017; Mo and Lettenmaier, 2014; Shukla et al., 2016; Yuan, 2016). However, the improvement varies with different regions and seasons, and the understanding of its application in endorheic and semi-arid and arid basins remains poor. Endorheic regions cover ∼ 11.4 % of global land, which are mostly located in semi-arid and arid regions (Li et al., 2018). The semi-arid and arid regions occupy approximately 40 % of earth's land surface, and show an accelerated expansion trend (Huang et al., 2016b). The fragile ecosystems in such regions are sensitive to climate change and human activities (Huang et al., 2016a). Therefore, the aim of this study is to fill the gaps in understanding drought predictions and predictability in endorheic and arid basins by addressing the following questions:
How do climate forecasts perform for meteorological and hydrological drought forecasting in an endorheic river basin?
How do meteorological forcings, initial hydrologic conditions and human activities influence hydrological predictability?
Here, predictability is considered as the possible maximum forecast skill that a forecast system can achieve (Luo and Wood, 2006). The Heihe River basin, which is a typical endorheic river basin in the semi-arid and arid region of northwestern China, is selected in this study to address the above questions. The Heihe River basin is an important part of the historic Silk Road and an important breadbasket in northwestern China (Zhang et al., 2015). However, the basin is subject to serious drought problems historically and in recent decades related to climate change and intensified human activities (Zhang et al., 2016). Therefore, it is crucial to develop a drought forecast system to promote the development of adapting strategies for sustainable water resource and ecological management in the Heihe River basin.
The study is organized as follows: in Sect. 2, we provide a brief description of the study region and data used in this study; in Sect. 3, we introduce the framework of the study and methods used; in Sect. 4, we present the analysis results and discussion, followed by conclusions in Sect. 5. Because few studies have focused on dynamic drought predictions based on GCMs and/or hydrological models in the region, this study will offer new clues for the development of more accurate drought monitoring and forecasting systems.
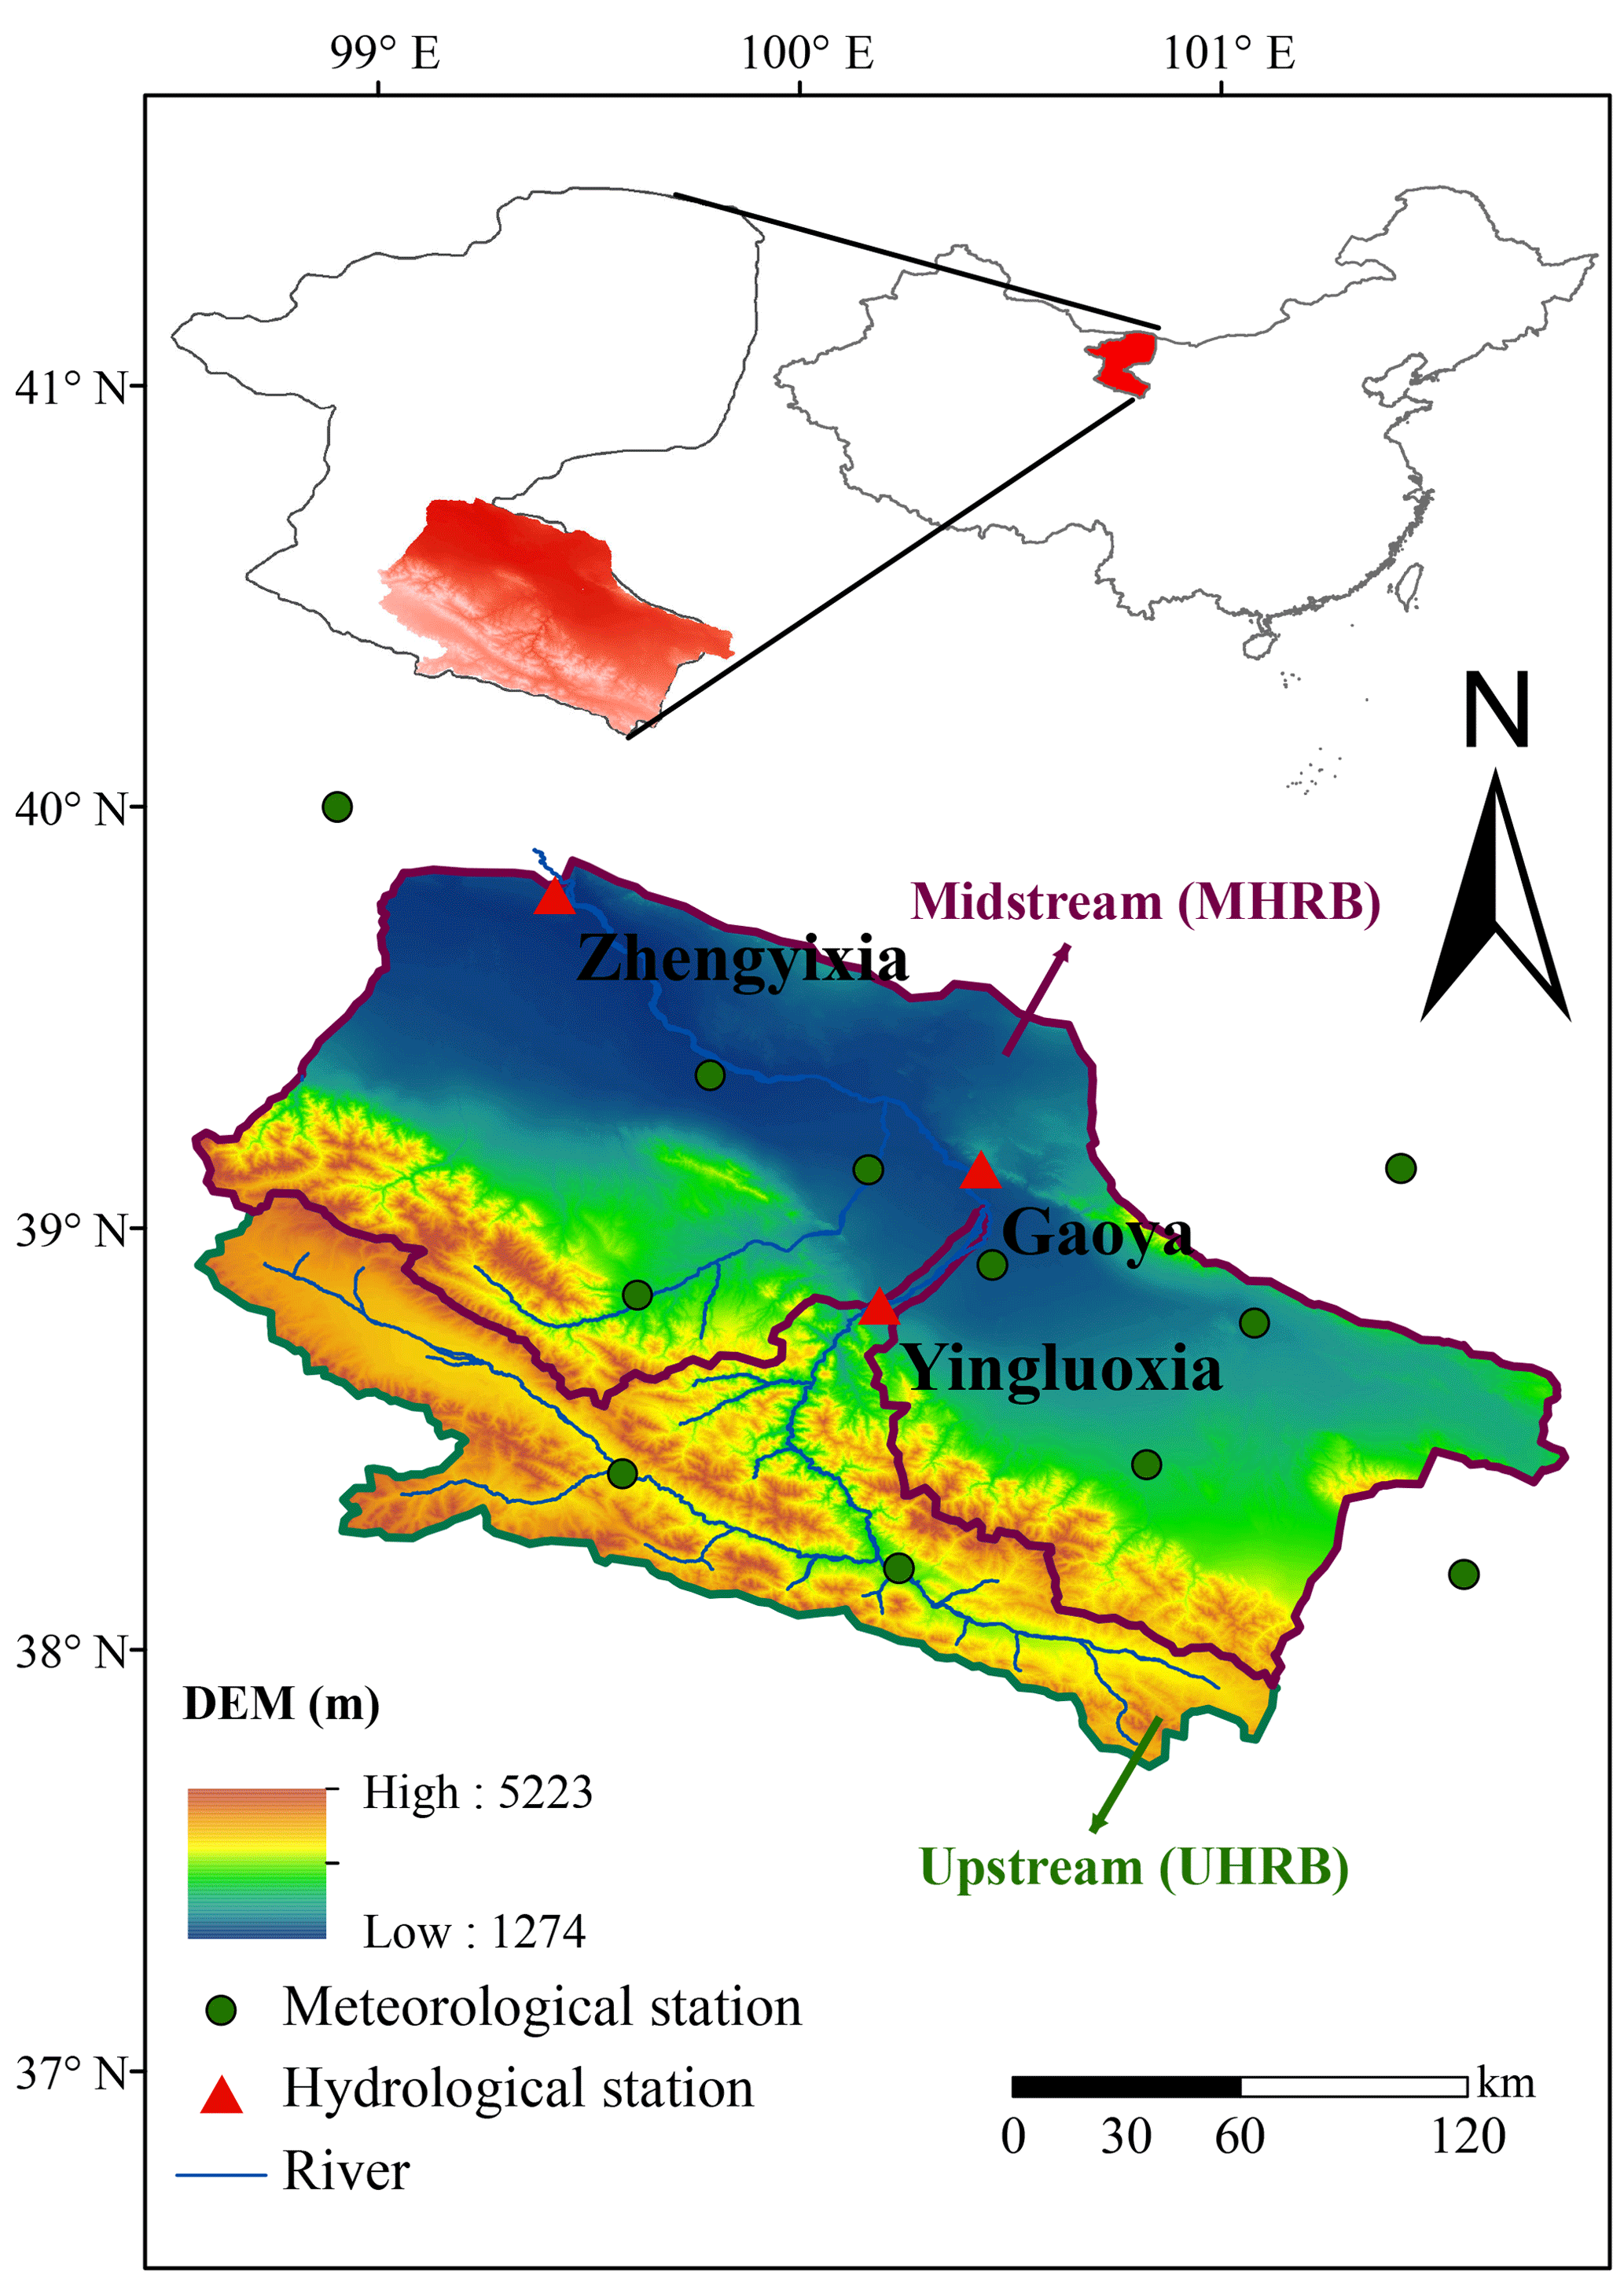
Figure 1Geographical location of the study area (upstream and midstream of Heihe River basin) used in this study. The top diagram shows the location of the entire Heihe River basin. The bottom diagram shows the geographic distribution of hydrometeorological stations in the UHRB and MHRB.
2.1 The Heihe River basin
The Heihe River basin (HRB; Fig. 1) is the second largest inland river basin of China, located deep in the hinterland of Eurasia. The river originates from the north side of Qilian Mountain, with a drainage area of 128 900 km2 (37∘41′–42∘42′ N, 96∘42′–02∘00′ E; Ma and Frank, 2006). The HRB has an apparent landscape, ecological and climate gradient from upstream to downstream. The landscape varies from glaciers and alpine biomes in the upstream to oases with irrigated agriculture in the midstream, to riparian ecosystems and the vast Gobi desert in the downstream. Most precipitation is concentrated in the upstream during wet season (June–September). During spring and summer, as temperature rises, snowmelt and glacier melt and permafrost thaw generally occur. Most of the streamflow in the HRB originates from precipitation, snowmelt, glacier melt and permafrost thaw in the upstream mountains (Wang et al., 2008), which contribute approximately 71 %, 25 % and 4 % of the total runoff (Li et al., 2018). Most water consumption happens in the midstream for human activities (e.g., agricultural irrigation). In this study, we focus on the upstream (UHRB) and midstream (MHRB) of HRB, as these two subbasins show drastic differences in terms of impacts of human activities on hydrological processes.
2.2 Data
Daily temperature and precipitation data at 0.5∘ spatial resolution (Zhao and Zhu, 2015) are obtained for 1961–2016, which were interpolated using thin plate spline (TPS) and 3-D geospatial information from 2472 meteorological stations by the National Meteorological Information Center, China Meteorological Administration (CMA) (Hutchinson, 1998a, b). Hydrological data (1982–2011) used in this study were monthly streamflow datasets from Yingluoxia (YLX) and Zhengyixia (ZYX) hydrologic stations that are located at the outlet of UHRB and MHRB. The data for the hydrological model (the Distributed Time-Variant Gain Hydrological Model, DTVGM, in this study) setup and calibration were mainly obtained from the Chinese Academy of Sciences, Gansu Water Resources Bulletin, and Statistical Yearbooks, which are presented in Ma et al. (2018) in detail.
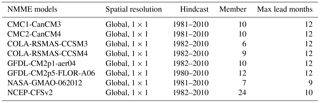
Climate hindcast data with 1∘ × 1∘grids (Table 1) were obtained from the North American Multi-Model Ensemble (NMME; Kirtman et al., 2014) archive (http://iridl.ldeo.columbia.edu/SOURCES/.Models/.NMME/; last access: 13 February 2018). Monthly precipitation, maximum, mean and minimum temperature data covering 1982–2010 were used for this study. The climate models with real-time forecast were selected for drought forecasting. In this study, “lead month 1” refers to forecasts initialized at the beginning of one month for itself, and “lead month 2” is that for the next month.
3.1 Meteorological and hydrological drought index
To analyze meteorological and hydrological drought, the Standardized Precipitation Index (SPI, McKee et al., 1993) and Standardized Streamflow Index (SSI; Vicente-Serrano et al., 2012) were used in this study. In the calculation, a probability distribution of monthly precipitation or streamflow for each month was generated and standardized using the empirical Gringorten plotting position (Farahmand and AghaKouchak, 2015; Gringorten, 1963):
where n is the time span, i is the position of precipitation or streamflow time series sorted from smallest to largest and p(xi) is the corresponding empirical probability. Finally, normalization was calculated to make the index comparable over time and space. For SPI in the upstream and midstream, catchment average precipitation in the upstream and midstream were used respectively. SSI in the upstream and midstream was calculated using streamflow at YLX (the outlet of the upstream) and the streamflow difference between ZYX (the outlet of the midstream) and YLX. SPI-3 and SSI-1 were selected to characterize the seasonal meteorological and hydrological droughts, respectively. We select SSI-1 for its good description of hydrological drought (e.g., Barker et al., 2016; Gustard et al., 1992; Huang et al., 2017; Ma et al., 2018). A total of 9 different lead months' forecasts are combined with observation to construct 3 months' accumulated precipitation for computing SPI3. For example, for SPI3 in August, lead month 1 uses the forecast at lead month 1 (August) combined with 2 months' observation (June to July). Lead month 2 means the sum of forecasts at lead month 1–2 (July and August) and 1 month of observation in June. Lead month 3 refers to forecasts at lead month 1–3 (June to August). In this study, drought is defined when the drought index value is below −1.
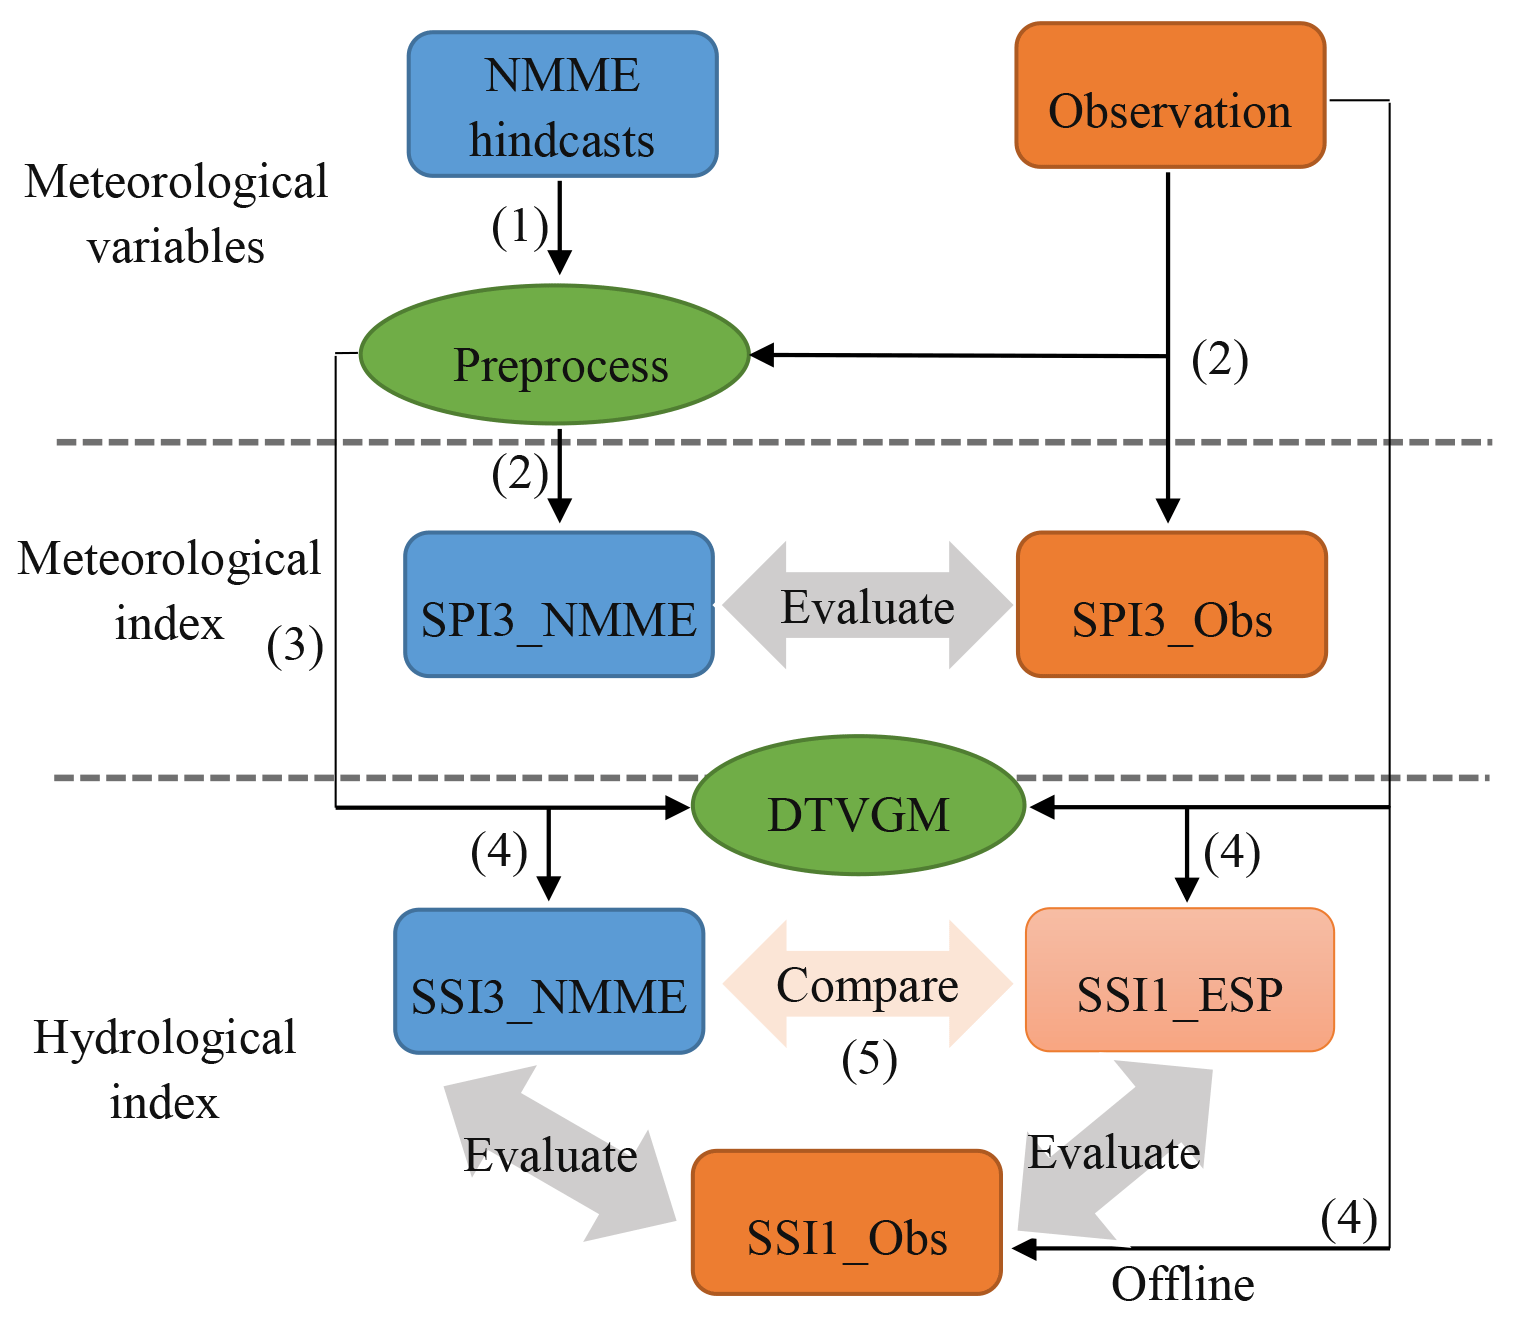
Figure 2Flow chart explaining the seasonal meteorological and hydrological drought forecasting system. The numbers (1)–(5) refer to the steps for the development and assessment of a seasonal drought prediction system.
3.2 Seasonal drought forecasting system
In this study, meteorological drought forecasting was produced using NMME climate forecasts, and hydrological drought forecasting makes use of a hydrological model forced by NMME climate forecasts (Fig. 2). To improve the forecast skill and drive the hydrological model, the NMME hindcasts were bias-corrected and downscaled using the quantile mapping method (Wood et al., 2002). The 1 ∘ monthly NMME precipitation and temperature hindcasts were interpolated into 0.5 ∘ with bilinear interpolation over the Heihe River basin. Then the cumulative distribution functions (CDFs) of NMME hindcasts and observations were constructed with all years except the target year (leave-one-out), and matched to remove model forecast bias. The daily hindcasts were then generated using a temporally downscaled technique by matching the monthly hindcasts with the daily samples from observations. In this approach (Luo and Wood, 2008), a randomly selected daily observation time series from the entire historical period (1961–2016) is used as a candidate for each member, and they are adjusted to match the predicted monthly values from the distributions obtained in the previous step. Finally, the 0.5 ∘ bias-corrected daily hindcasts were bilinearly interpolated into 140 subbasins to drive the hydrological model over the HRB. The last step is only necessary in this study as our hydrological model as described below runs on subbasin scales instead of regular latitude–longitude grids.
In this study, the Distributed Time-Variant Gain Hydrological Model (DTVGM; Mao et al., 2016) was used to simulate and predict streamflow. It is a distributed, catchment-based hydrological model with modules to simulate snow, runoff, streamflow routing, water use and reservoir operation. The degree-day factor (DDF) method is used to compute snowmelt. The runoff module is based on the water balance equation, and the routing is based on a kinematic scheme (Ye et al., 2010, 2013). Three runoff components for each subbasin, i.e., surface runoff, subsurface runoff and base flow, are computed based on precipitation, soil hydraulic parameters, and land cover parameters and sets of calibrated parameters (Ma et al., 2018; Ye et al., 2010). The human activities module, i.e., water use and reservoir models, can be switched on or off to simulate real streamflow and naturalized streamflow. Here, water use includes irrigation water, industrial water and domestic water, which are derived from irrigation areas and irrigation quota, industrial GDP and population distribution, respectively. The reservoir regulation rules are defined according to reservoir storage capacity and ecological flow during wet (June–September) and dry seasons. The DTVGM model has been calibrated with the human activities module turned on using observed streamflow at YLX, Gaoya and ZYX stations. The DTVGM could capture the variations of streamflow well, with Nash–Sutcliffe efficiency coefficient (NSE) values greater than 0.86 and 0.52 for the UHRB and MHRB during both calibration and validation periods, respectively. In the MHRB, except for input and structural errors, the unrefined human activities module also increases the uncertainties of the hydrology model, leading to a NSE value lower than that in the UHRB. Detailed description of the DTVGM model and its calibration process can be found in Mao et al. (2016) and Ma et al. (2018). Before making forecasts, the DTVGM was continuously run for the period of 1961–1981 to spin up the hydrological model, and continuously driven by observed meteorological forcings from 1982 to 2010 to generate the offline initial hydrological conditions (ICs) for NMME-based and ESP-type forecast experiments. In this study, ESP (Ensemble Streamflow Prediction) forecasts (see Sect. 3.4), which were based on ensemble of historical meteorological forcings, were used as a reference hydrological forecast.
3.3 Forecast verification
The meteorological and hydrological drought forecast skills for 9 different lead months were evaluated using both deterministic and probabilistic metrics. The deterministic metric that we use is the anomaly correlation (AC; Wilks, 2011), which is calculated as
where is the anomaly for NMME hindcasts and is the anomaly for observations; for a given lead and target month/season and member, i is the target month/season and n is the time span (29 years in this study).
The probabilistic metric that we use is the Brier score (BS; Wilks, 2011), which is the mean squared error of probability forecasts, considering that the observation is ok=1 if drought occurs, otherwise ok=0. The BS can be defined as
where k means a numbering of the n forecast–event pairs and yk is the forecast probability. The BS is negatively oriented (0≤ BS ≤1), with perfect forecast exhibiting BS = 0. The Brier skill score (BSS; Wilks, 2011) is then calculated as
where BS* is the BS for the reference system. A positive BSS value indicates a better forecast, while a negative value indicates a worse forecast than the reference system.
3.4 Experiment design for understanding the hydrological predictability
With the calibrated DTVGM hydrological model, two experiments were carried out to distinguish the importance of initial hydrological conditions (ICs) and meteorological forcings in the hydrological forecasting. The first experiment is the Ensemble Streamflow Prediction (ESP), which was initialized at the beginning of each month during 1982–2010, with 28 ensemble members of 9-month meteorological forcings taken from the same period without the target year. For example, the ESP simulation starting in January 1982 was initialized on the first day in January, and driven by 28 9-month meteorological forcings during January–September of 1983, 1984, …, 2010. The second experiment is the so-called reverse-ESP (revESP; Shukla and Lettenmaier, 2011; Shukla et al., 2013; Wood and Lettenmaier, 2008), which was driven by the observed meteorological forcings of the target year, but with 28 different ICs except the target year. For example, the revESP simulation starting in January 1982 was driven by the meteorological forcings during January–September of 1982, but initialized with hydrological conditions in January of 1982, 1984, …, 2010.
To determine whether the meteorological forcings or ICs are more important in the hydrologic cycle, the RMSE ratio was calculated, which is defined as
where RMSEESP and RMSErevESP are the root-mean-square error (RMSE) for ESP and revESP. Here, the RMSE was calculated using the ensemble means of ESP and revESP. The RMSE ratio is lower than 1 when ICs play a more important role than the meteorological forcings in the hydrologic predictability, and the ratio is larger than 1 when the meteorological forcings dominate.
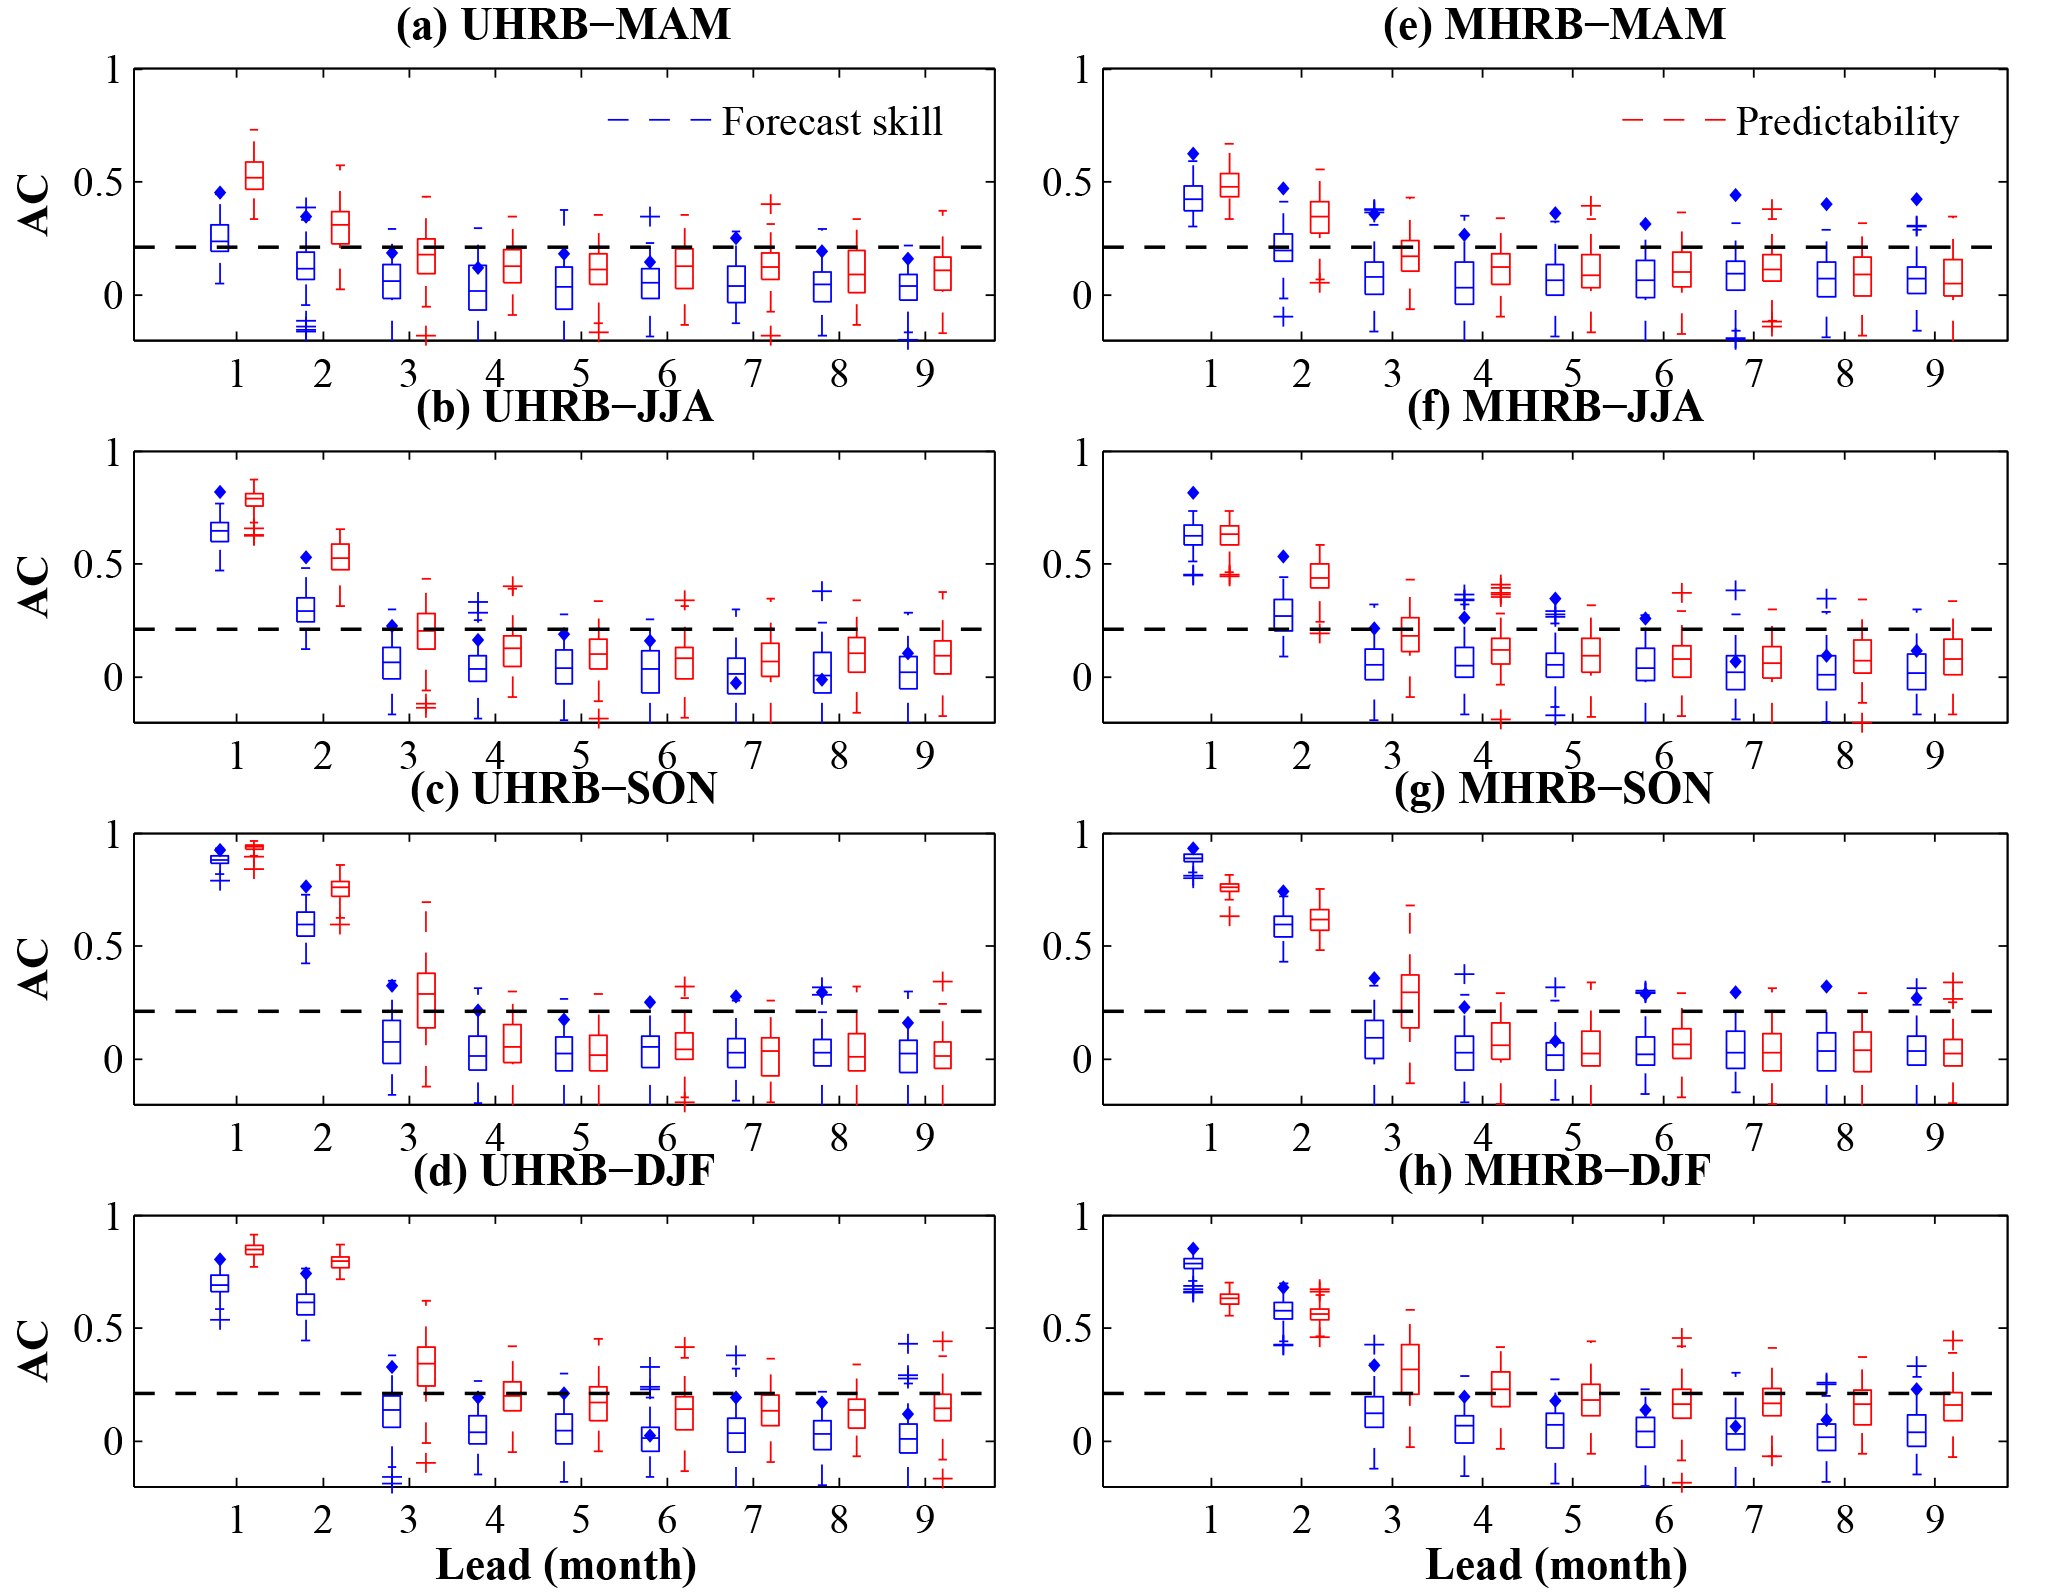
Figure 3Anomaly correlation (AC) of the forecast of seasonal SPI3. The red box plots show the spread of predictability, and the blue box plots show the spread of forecast skill for each ensemble member. The blue diamonds show the AC of the grand ensemble mean. The blue (red) crosses show the outliers for forecast skill (predictability). The dashed black line indicates the threshold (AC = 0.21) of 95 % confidence intervals calculated from the t test.
4.1 The predictability and forecast skill for meteorological droughts
To evaluate the performance of seasonal drought prediction system, we first examined the predictability and forecast skill of NMME meteorological predictions based on SPI3 series in terms of AC metric (Fig. 3). The red box refers to the AC for predictability, and the blue box is the AC for forecast skill. Here, predictability is defined by using a “perfect model” assumption (Luo and Wood, 2006; Wang and Yuan, 2018), which considers one member of the ensemble as the “observation”, and the average of remaining members as prediction. The analysis is rotated through using all 88 ensemble members as the observations, and 88 values of AC are then calculated as the ensemble of predictability. For each season (3 months), there are 29 year hindcasts leading to a sample size of 87, so a correlation of 0.21 is statistically significant using a 95 % significance interval.
Meteorological predictability is higher than the forecast skill in terms of AC in most cases (Fig. 3), indicating some room for improving the meteorological predictions. The meteorological predictability and forecast skill depend on the target season because of a strong seasonality for climate in the HRB. The predictability is higher in autumn and winter than that in summer and spring, which corresponds to a higher forecast skill in autumn and winter. Most climate anomalies (i.e., sea surface temperature (SST) anomaly) occur in winter and autumn, and SST is also a potentially important predictor (Becker et al., 2014). In addition, the climatic noise of monthly precipitation over China has obvious seasonal variation and it is greater in summer than in winter (Liu et al., 2000). The multi-model ensemble mean skill, shown by the blue diamonds, is generally located at the upper part of the distribution, indicating that the forecast skill of the grand ensemble mean is higher than that of most members. It is not surprising that the SPI3 predictions perform well in the first 2 lead months, where 1 or 2 of the three months come from observations. However, as the lead month increases beyond 2 months, both the predictability and forecast skill decrease significantly, for which correlations of most of members are lower than 0.21.
In fact, NMME climate predictions have lower predictability and forecast skill in the northwest inland areas of China, in comparison with southeast monsoon regions (Ma et al., 2016). The HRB is located far from oceans and in midlatitudes, and is little affected by SST from oceans, especially equatorial oceans, which are the major source of predictability at a seasonal timescale. Topographic influence on regional and local weather and climate cannot be resolved by GCMs, for example, local ascending motion affected by the Qinghai–Tibet Plateau exists and has a considerable impact on precipitation over the HRB (Sun et al., 2011). In addition, the joint extreme phases of climate oscillations instead of a single one could trigger extremes (e.g., drought) over the arid endorheic basin, and almost no climate models can capture the complex and multiple teleconnections (Shi et al., 2016).
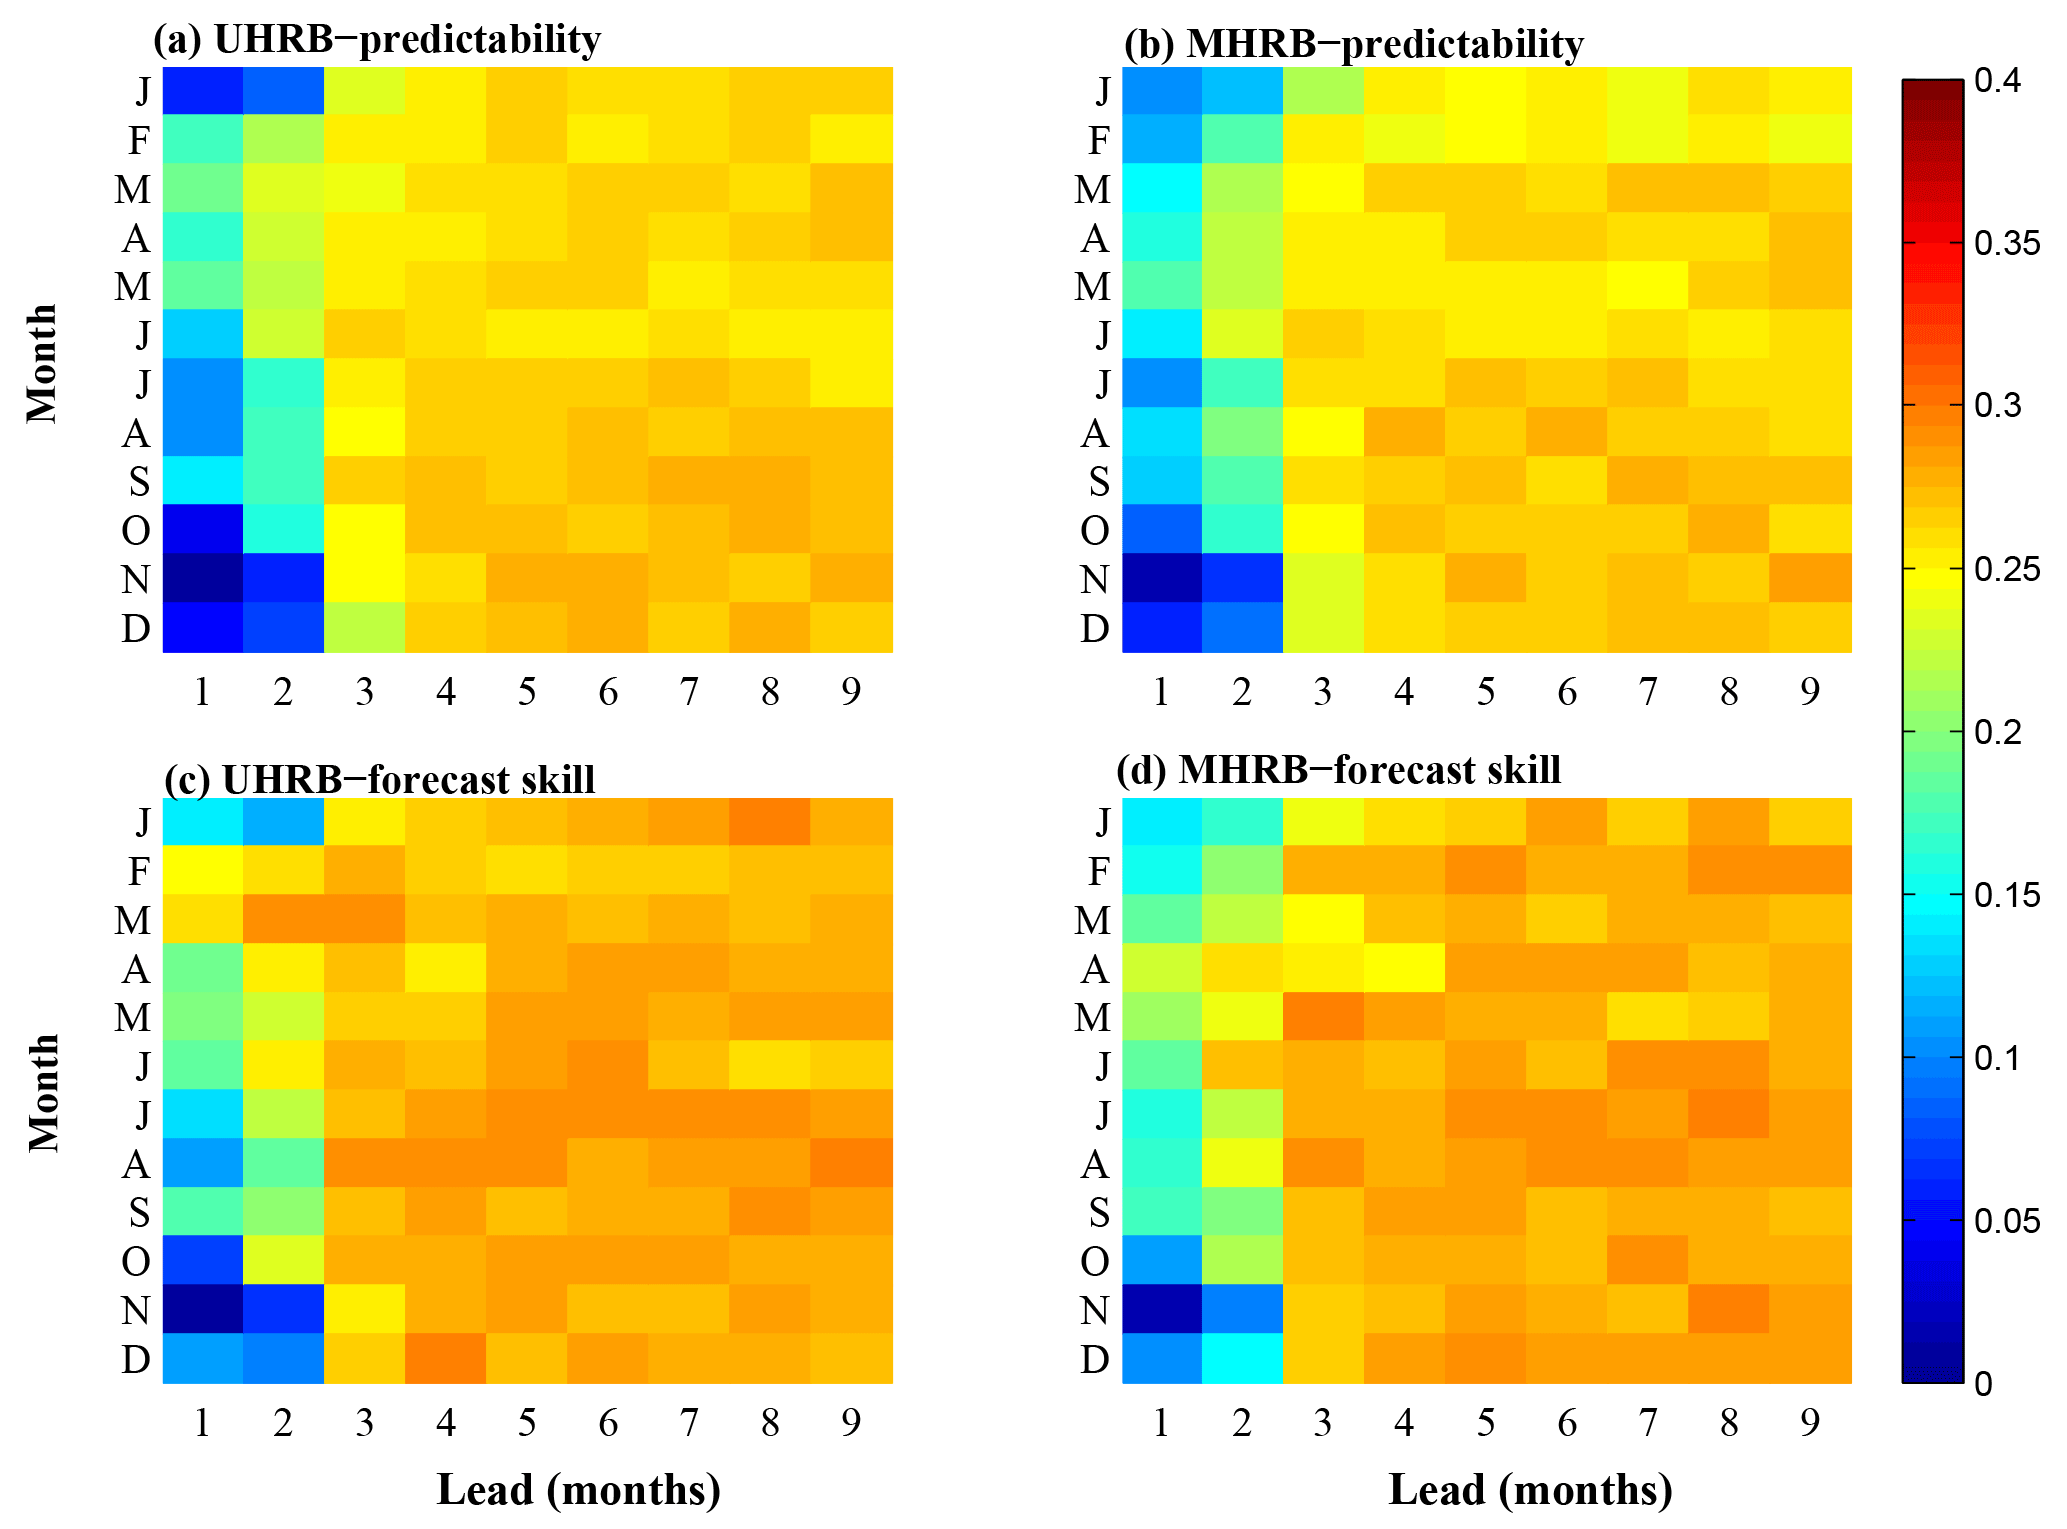
Figure 4Brier score (BS) of NMME forecast for meteorological drought events. (a–b) Meteorological drought predictability in the upstream (a) and upstream (b). (c–d) Meteorological drought forecast skill in the upstream (c) and midstream (d). Here, a meteorological drought event happens when the SPI3 value is below −1. The BS is negatively oriented (0≤ BS ≤1), with perfect forecast exhibiting BS = 0. The color from deep blue to deep red (0–0.4) means increasing BS values, i.e., decreasing predictability or forecast skill.
When defining a meteorological drought as SPI3 below −1, the results of predictability and forecast skill for meteorological drought predictions are similar to that for SPI3 predictions. Figure 4 shows the BS for meteorological drought events in the upstream and midstream of Heihe River basin. AC of SPI3 reflects the forecast skill for both the dry spells and wet spells. The BS for the different months shows the forecast skill, which primarily aims at predicting drought events. It can be seen that the NMME-based meteorological droughts show higher predictability and forecast skill in the first 2 lead months, especially during October–January. The results indicate that the NMME-based SPI3 predictions could reasonably capture meteorological drought conditions in the first 2 lead months.

Figure 5Anomaly correlation (AC) of the forecast of seasonal SSI1. The red box plots show the spread of AC of each member from NMME, and the blue box plots show that from ESP. The blue (red) crosses show the outliers for NMME (ESP) forecast skill. The dashed black line indicates the threshold (AC = 0.21) of 95 % confidence intervals calculated from the t test. The predictions and simulations are carried out with the human activities module switched on.
4.2 The predictability and forecast skill for hydrological droughts
Hydrological processes and predictions are more complex, especially in the MHRB. Figure 5 shows the performance of NMME for SSI1 predictions compared to ESP, which is assessed using the AC metric. The predictions from NMME and ESP experiments are verified against DTVGM offline simulations, driven by observed meteorological forcings and calibrated against observed streamflow at Yingluoxia, Gaoya and Zhengyixia stations. Ensemble hydrological predictions from NMME show less spread than ensemble meteorological predictions, especially in the cold seasons. Due to the memory of initial hydrologic conditions, hydrological predictions show less uncertainty than the corresponding meteorological forcings. There are notable differences in hydrological predictions between the upstream and midstream, with higher overall forecast skill in the upstream. The winter season shows the highest forecast skill, followed by autumn, spring and summer. During spring, NMME hydrological predictions show the most significant improvement over ESP, in spite of low forecast skill for precipitation predictions. During March–June, approximately 70 % of streamflow is generated by seasonal snowmelt (Wang and Li, 1999). Therefore, hydrological predictions skill may also rely more on temperature predictions, which are generally more skillful than precipitation predictions (Becker et al., 2014; Shukla et al., 2016), and the accuracy of the initial hydrological condition in terms of snow amount. In summer, NMME hydrological predictions show some improvement compared to ESP in the upstream, especially in the first lead month. However, in the midstream, low forecast skills were detected in all lead months, which are likely due to poor precipitation predictions and effects from human activities. Predicting seasonal streamflow during summer in advance is difficult and both NMME and ESP exhibit weak skills. In autumn, lead time with good forecast skill could be up to 3 months in the upstream and 2 months in the midstream, which are similar to meteorological predictions. In addition, NMME hydrological predictions also show improvement over ESP in the first 3–4 lead months. In winter, until lead month 6, both ESP and NMME show skillful hydrology predictions due to the more important role of initial conditions, which will be discussed in the later part of this section.
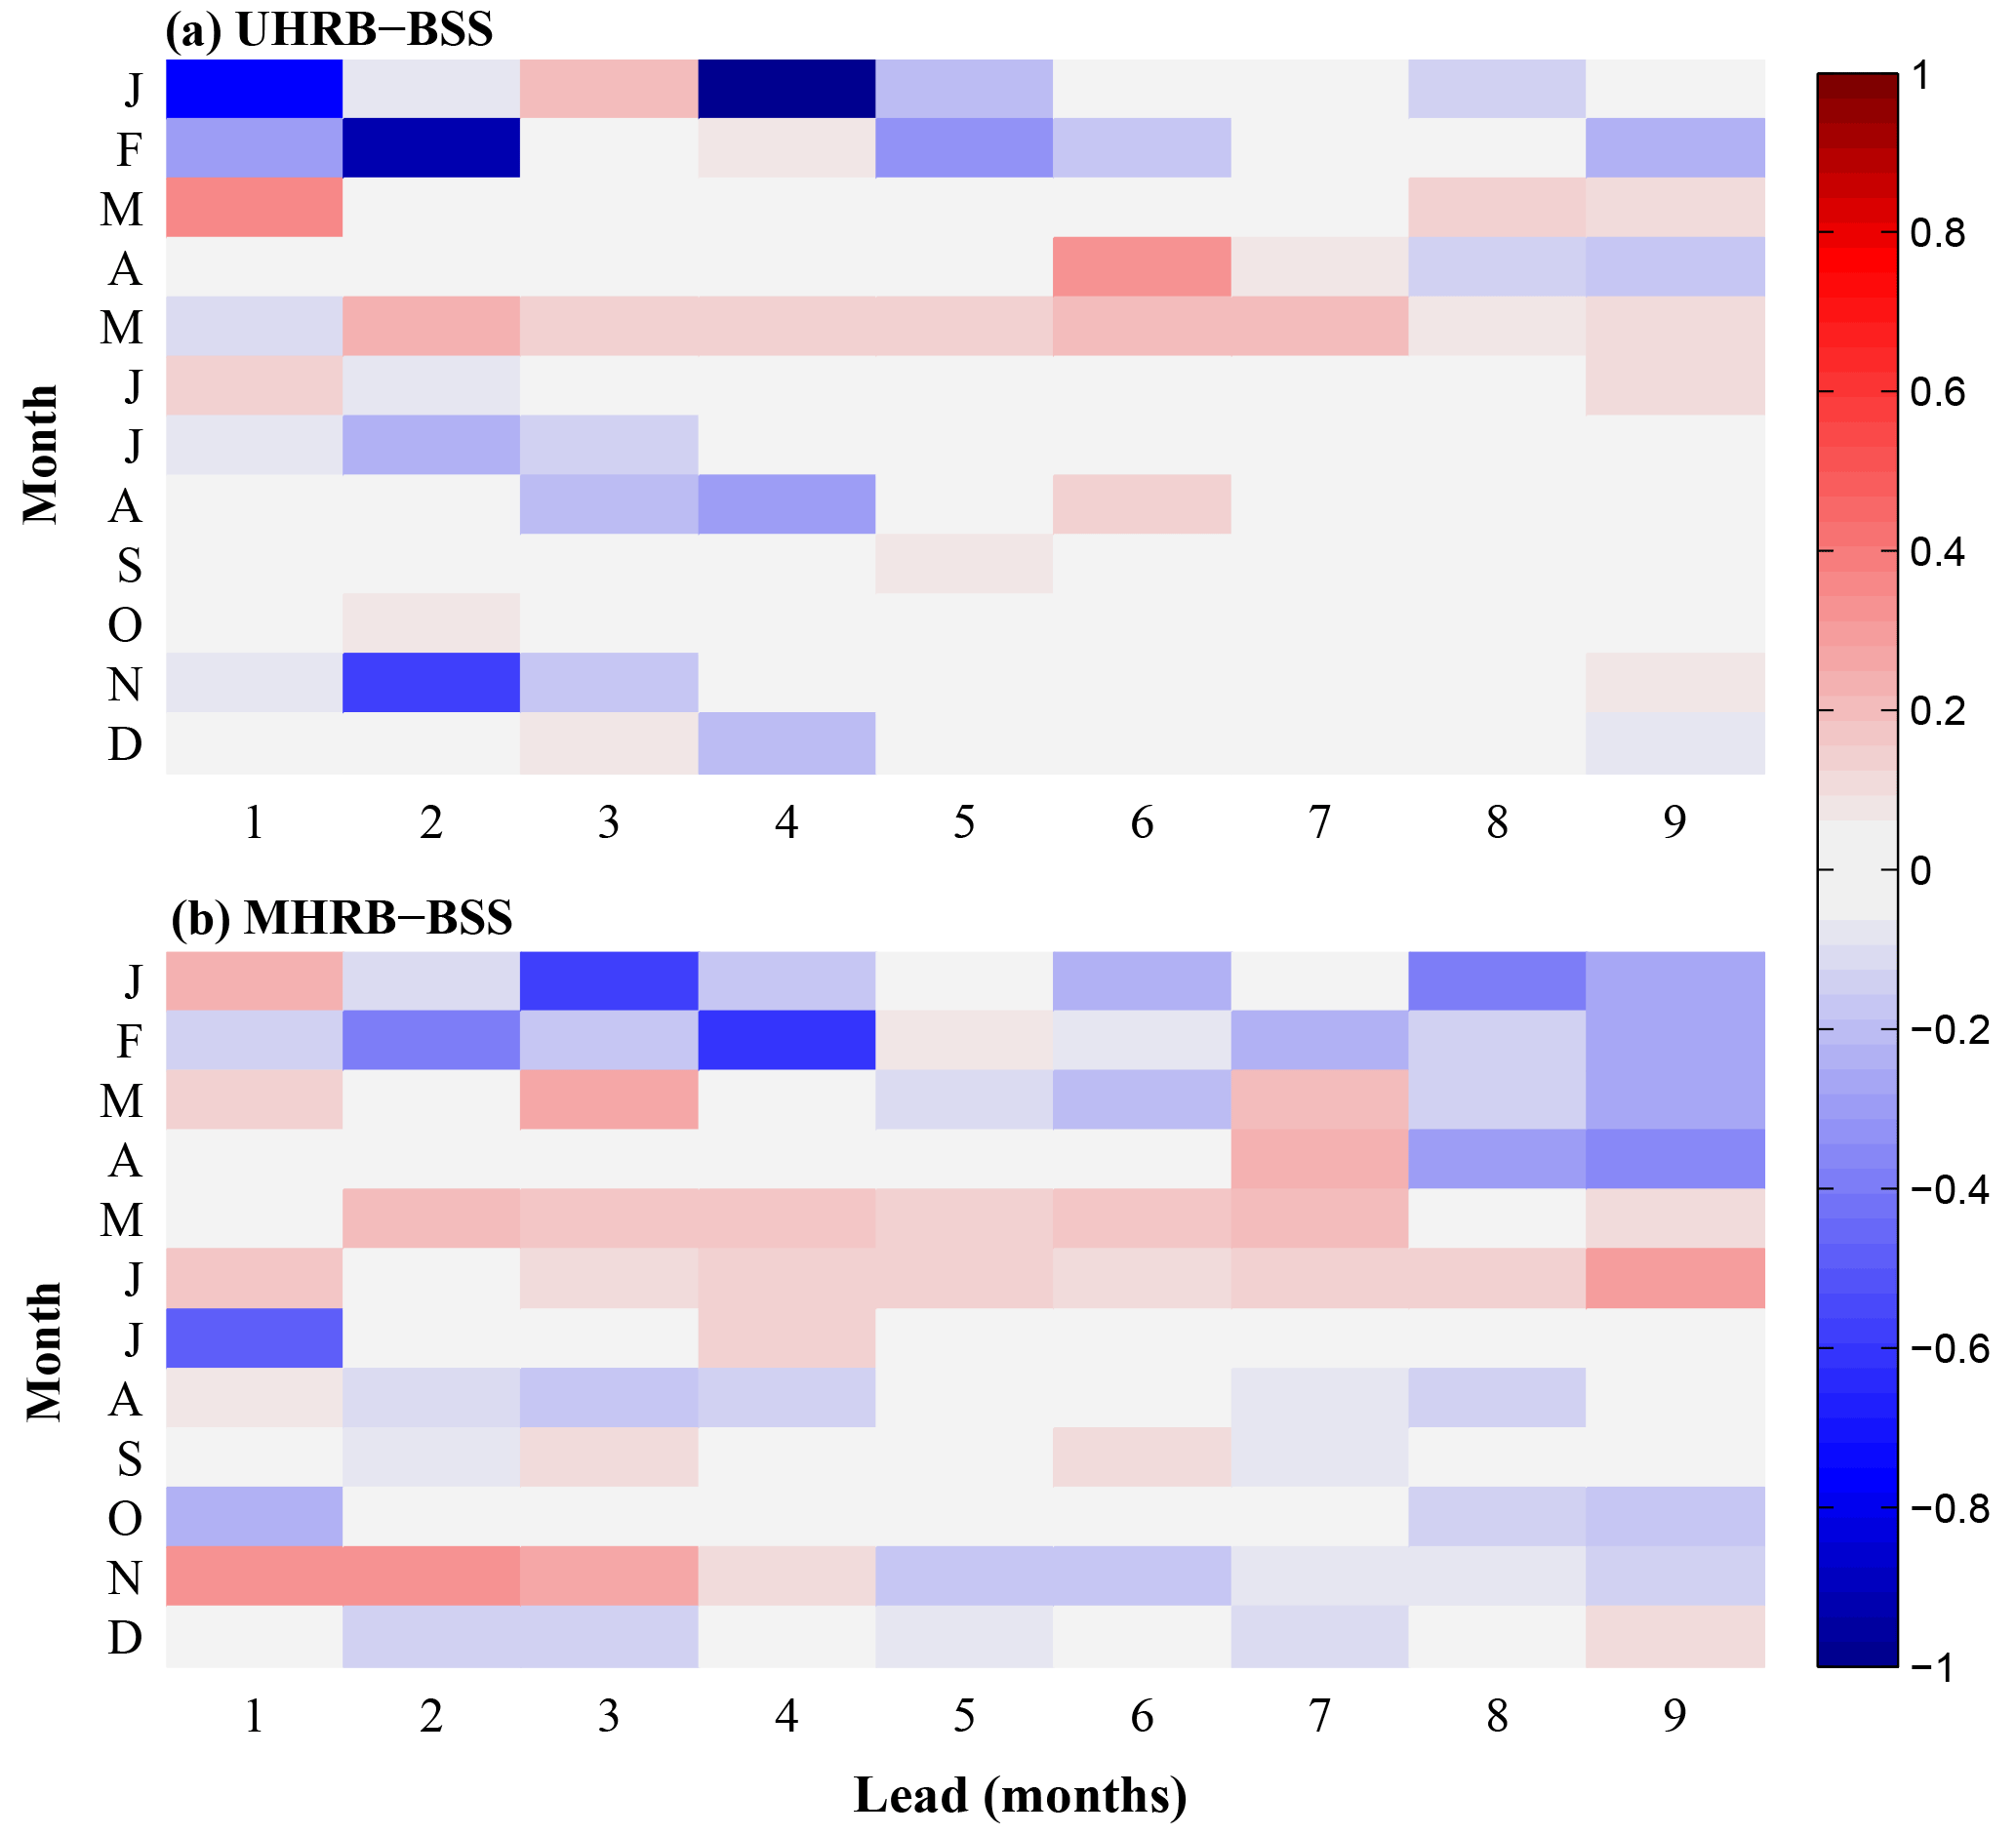
Figure 6Brier skill score (BSS) of NMME forecast for hydrological drought events. Here, a hydrological drought event happens when the SSI1 value is below −1. The reference forecasts are simulations from the ESP experiment. The predictions and simulations are carried out with the human activities module switched on.
To further evaluate the performance of NMME-based hydrological predictions compared with ESP for droughts (i.e., SSI1 <1), the BSS metric is used and shown in Fig. 6. The skill for hydrological drought predictions from NMME is higher than that from ESP during late spring. The improvement is even more clear for longer lead times (6–7 lead months), which may be linked with the higher skill in temperature forecasting. In general, NMME outperforms ESP for the 1–4 lead months (with some exceptions), but the improvement is not obvious due to a long memory of initial conditions during the cold season and poor meteorological predictions during summer.
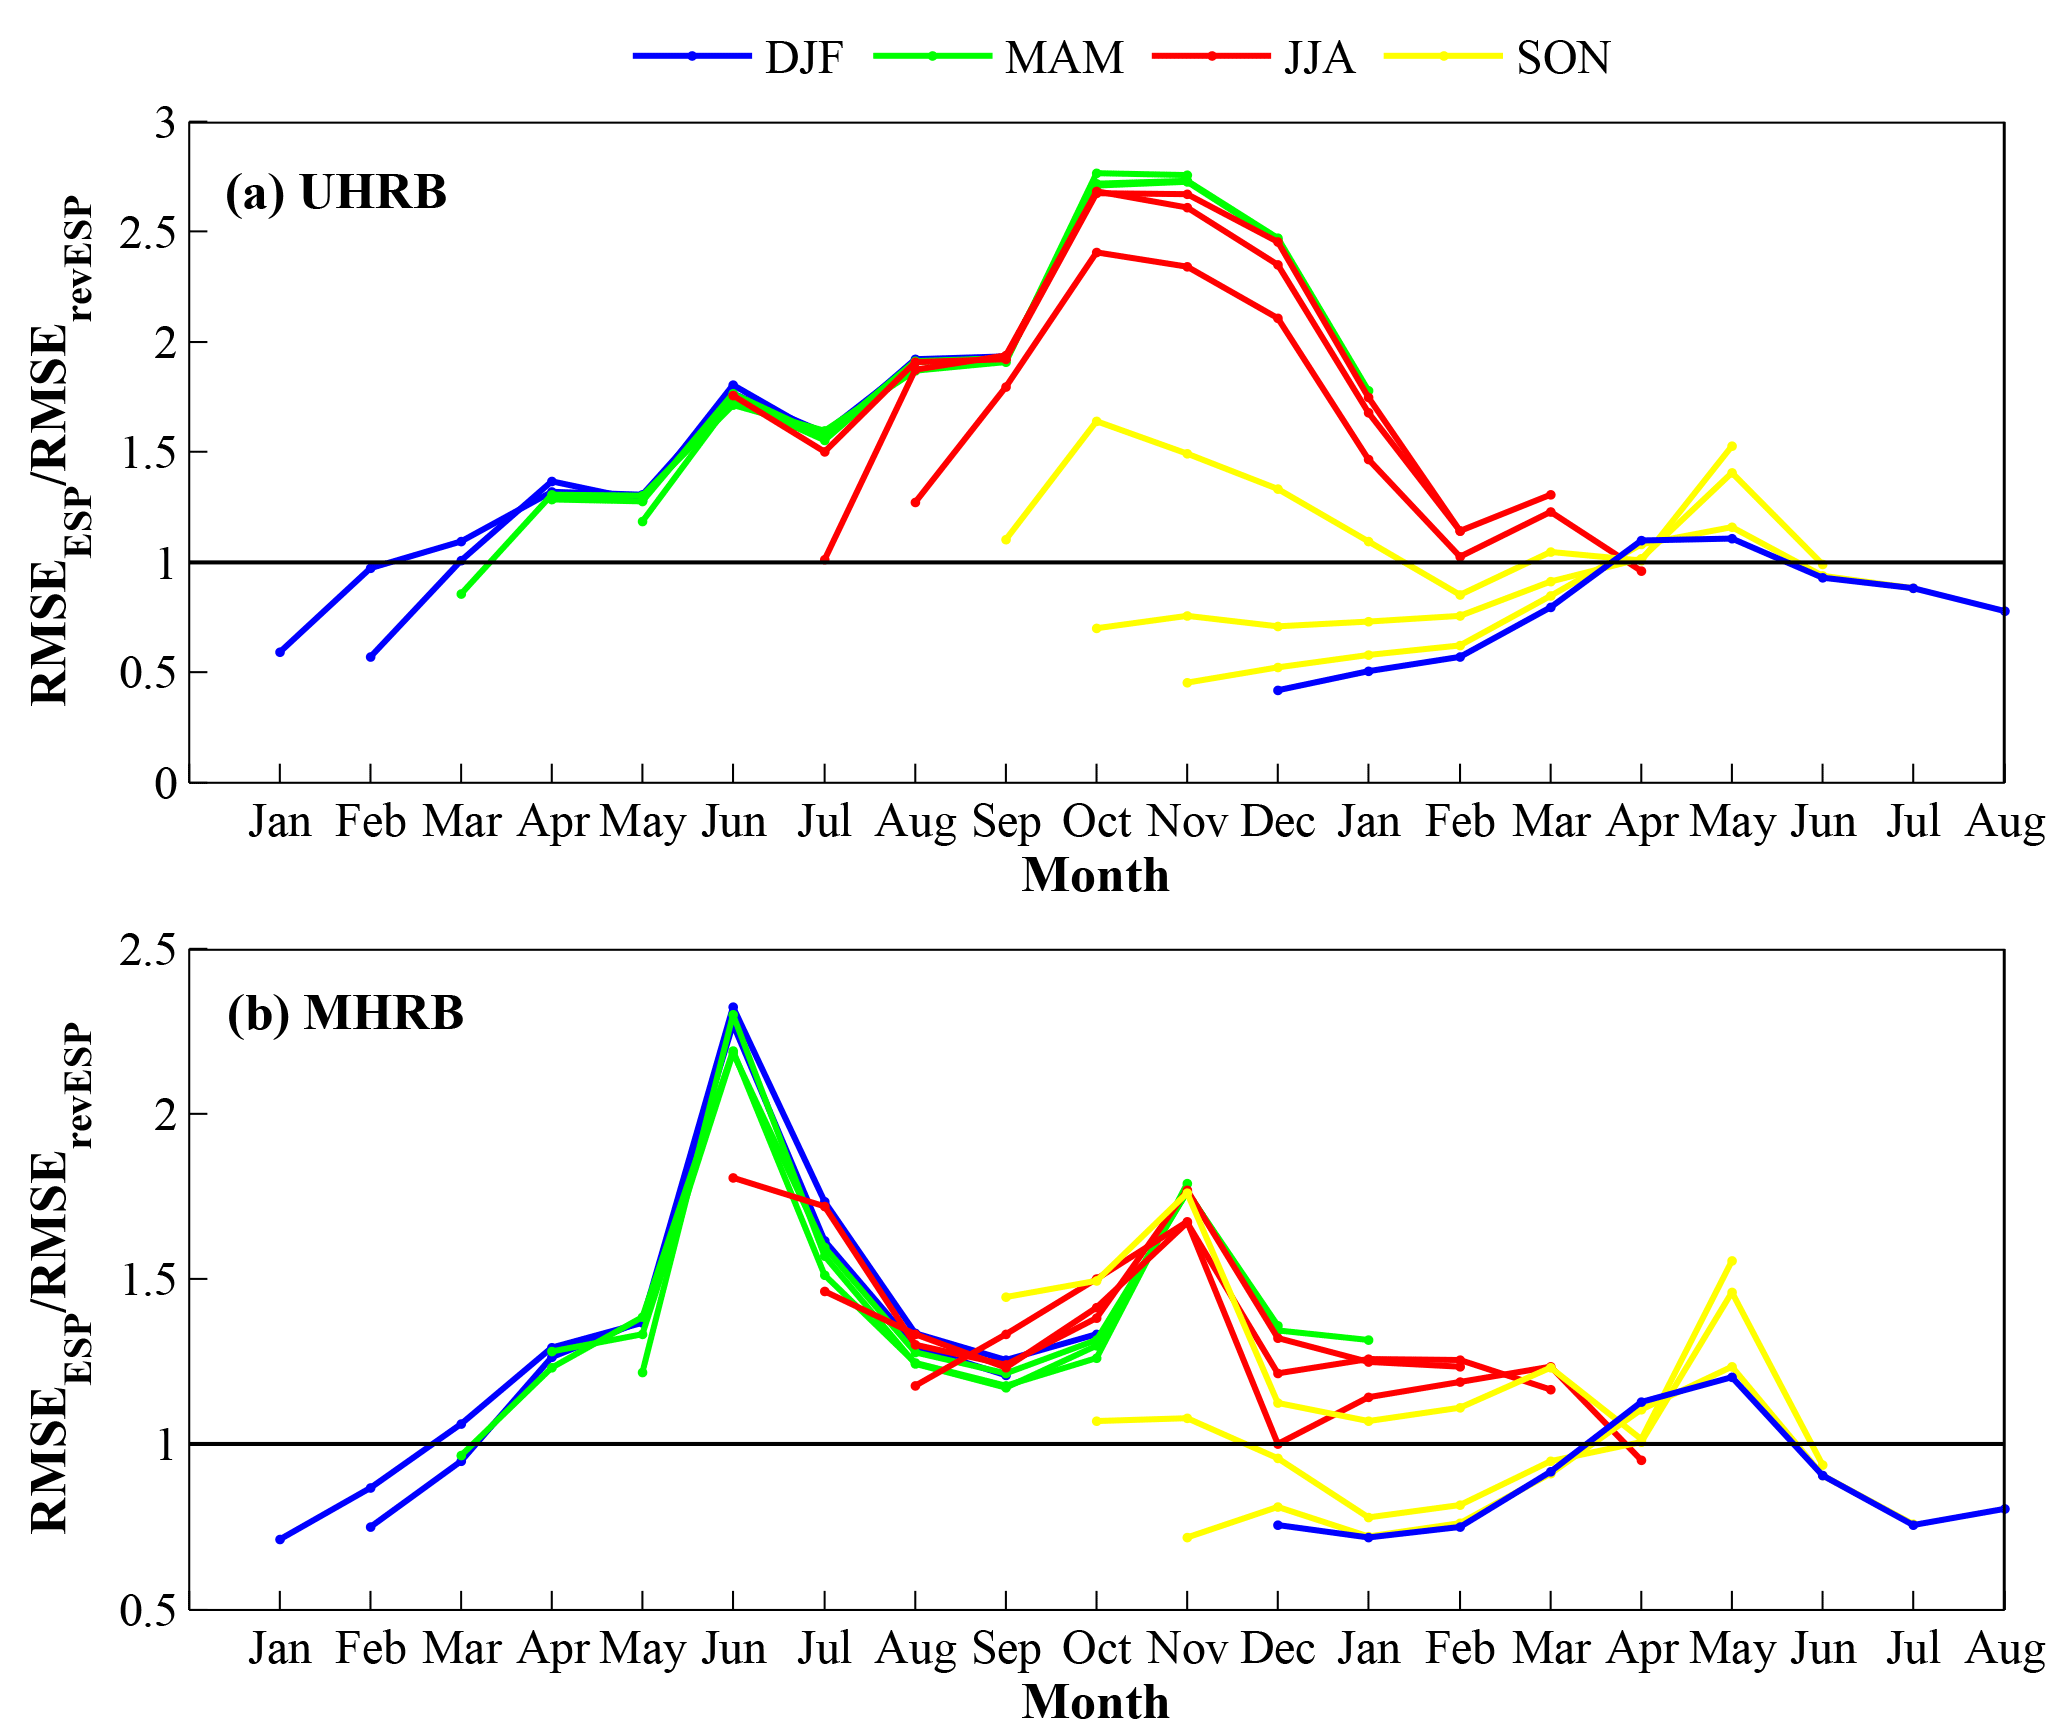
Figure 7The RMSE ratio (RMSEESP∕RMSErevESP) as a function of start month and lead time over the upstream and midstream. The RMSEESP (RMSErevESP) is calculated between the SSI1 series from the offline simulation and that from the ESP (revESP) experiments with the human activities module switched on.
As mentioned above, the forecast skill for NMME shows a notable difference between meteorological and hydrological droughts during different seasons, that is because besides meteorological forcings, initial conditions also play an important role in hydrological predictions. Figure 7 shows the relative role of initial hydrological conditions (ICs) in hydrological predictability for different months and lead times over the upstream and midstream of Heihe River basin. During cold and dry seasons (October–March), the RMSE ratio is lower than 1 in the first 2–7 months, indicating that the hydrological initial conditions play a more important role in hydrological predictability up to 2–7 lead months. The maximum lead times in which the ICs prevail over the meteorological forcings in the hydrological predictability could even be up to 5–7 months during October–December. In general, as the lead time increases, the contribution of initial conditions decreases, while that of the meteorological forcings gradually increases over the ICs. For the forecasts in April–August, the influence of ICs could not persist for 1 month, and the meteorological forcings significantly contribute to the hydrological predictability. This means that the ICs make more contribution to hydrological predictability during the cold and dry season than that during the warm and wet season. This helps to explain why hydrological predictions are more skillful in the dry season than that in the wet season.
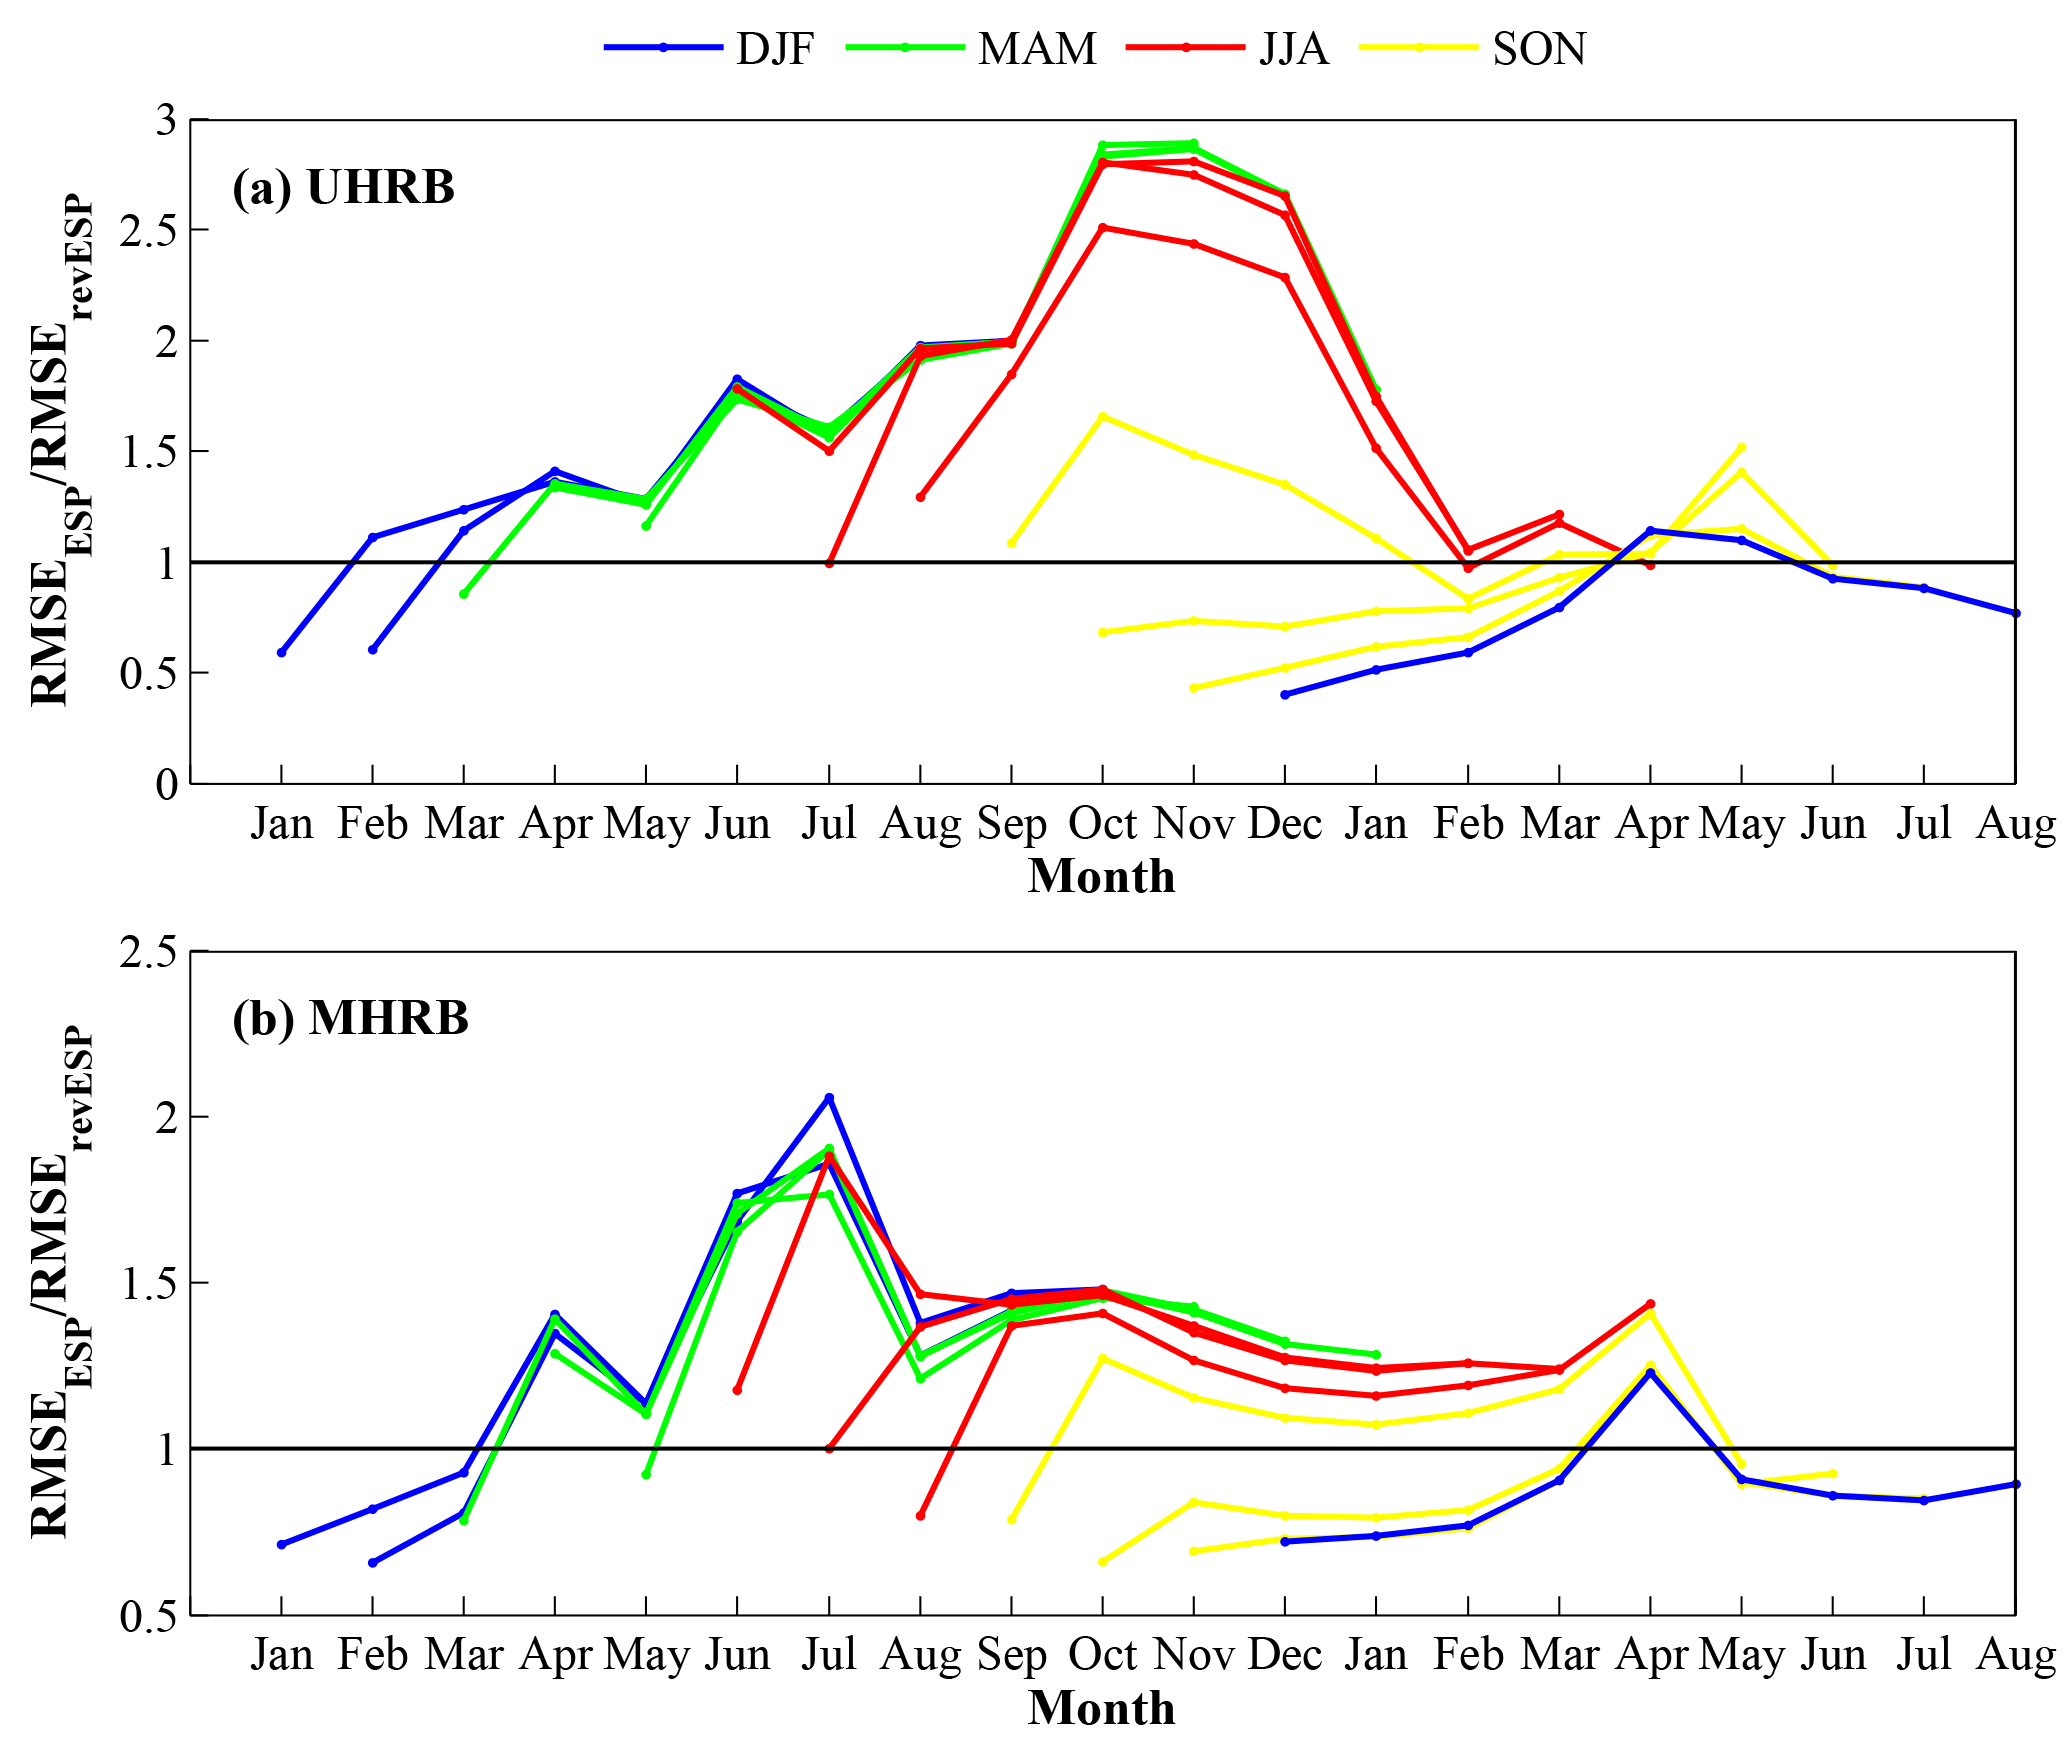
Figure 8The RMSE ratio (RMSEESP∕RMSErevESP) as a function of start month and lead time over the upstream and midstream. The RMSEESP (RMSErevESP) is calculated between the SSI1 series from the offline simulation and that from the ESP (revESP) experiments with the human activities module switched off.
From a hydrological perspective, the MHRB is a human-dominant basin (Ma et al., 2018). To explore the influence of human activities on hydrological predictability, an additional experiment is conducted by turning off the human activities module in the hydrological model. The RMSE ratios of ESP and revESP without human activities are then calculated, and the results are shown in Fig. 8. The impact of human activities is less noticeable in the upstream because there is less human activity there. As for the midstream, without the impact of human activities, the RMSE ratio is less than 1 in the first lead month initialized in May and July–September (Fig. 8b). This indicates that the initial hydrological conditions have less variability in the wet seasons due to more human activities (e.g., irrigation and reservoir regulation), and human activities reduce the effect of ICs on hydrological predictability for 1 month. Therefore, the memory from ICs could only last for less than 1 month and would not contribute much to the hydrological prediction when human activities are the interference, which makes hydrological predictability rely more on meteorological prediction. In addition, the RMSE ratios in the midstream have a smaller spread for all forecast lead times when human activities are considered (Figs. 7b, 8b). This indicates that human activities reduce hydrologic variability between years, and could potentially increase the hydrological predictability. Considering droughts (i.e., dry conditions), human activities could also increase hydrological drought predictability, mainly by reasonable reservoir regulation. When droughts happen, discharge from reservoir will be increased, aiming to maintain ecological flow and human (domestic, agricultural and industrial) water demand, which will decrease the hydrological variability during dry periods. Therefore, human activities can outweigh meteorological variability and play a more important role in hydrological predictability. The results are similar to Yuan et al. (2017), which found human interventions can outweigh the climate variability for the hydrological drought forecasting over the Yellow River basin.
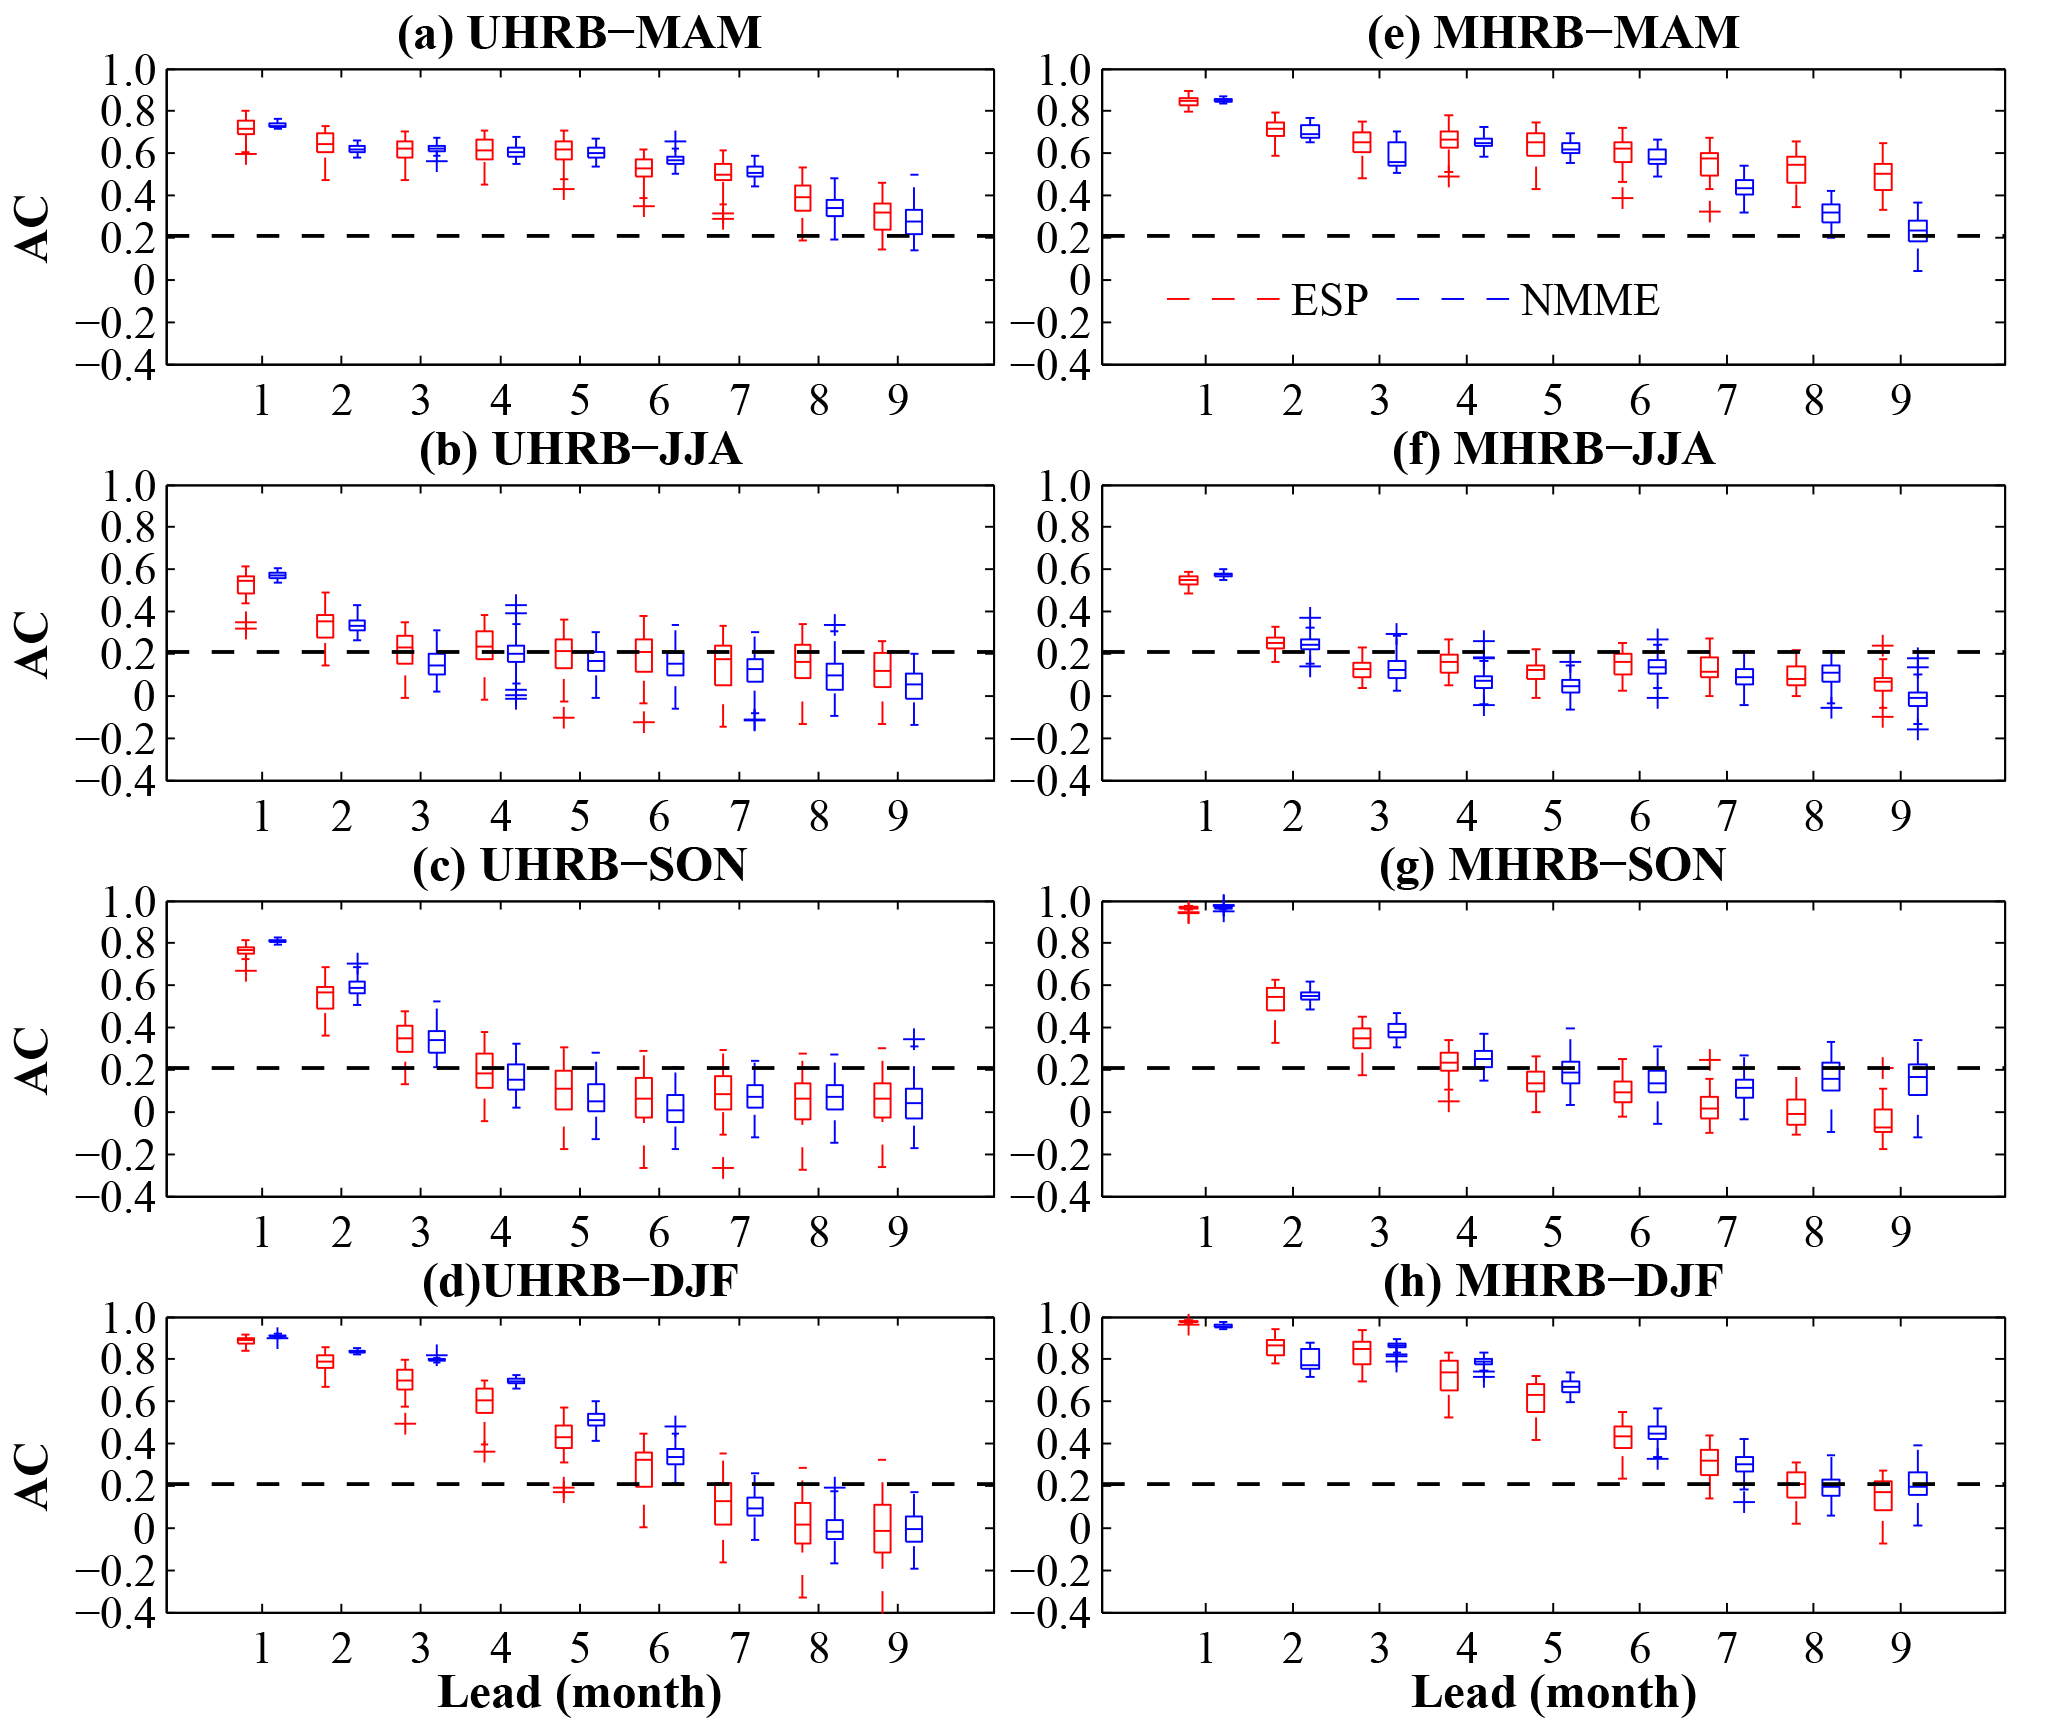
Figure 9Anomaly correlation (AC) of the forecast of seasonal SSI1. The red box plots show the spread of AC of each member from NMME, and the blue box plots show that from ESP. The blue (red) crosses show the outliers for NMME (ESP) forecast skill. The dashed black line indicates the threshold (AC = 0.21) of 95 % confidence intervals calculated from the t test. The predictions and simulations are carried out with the human activities module switched off.
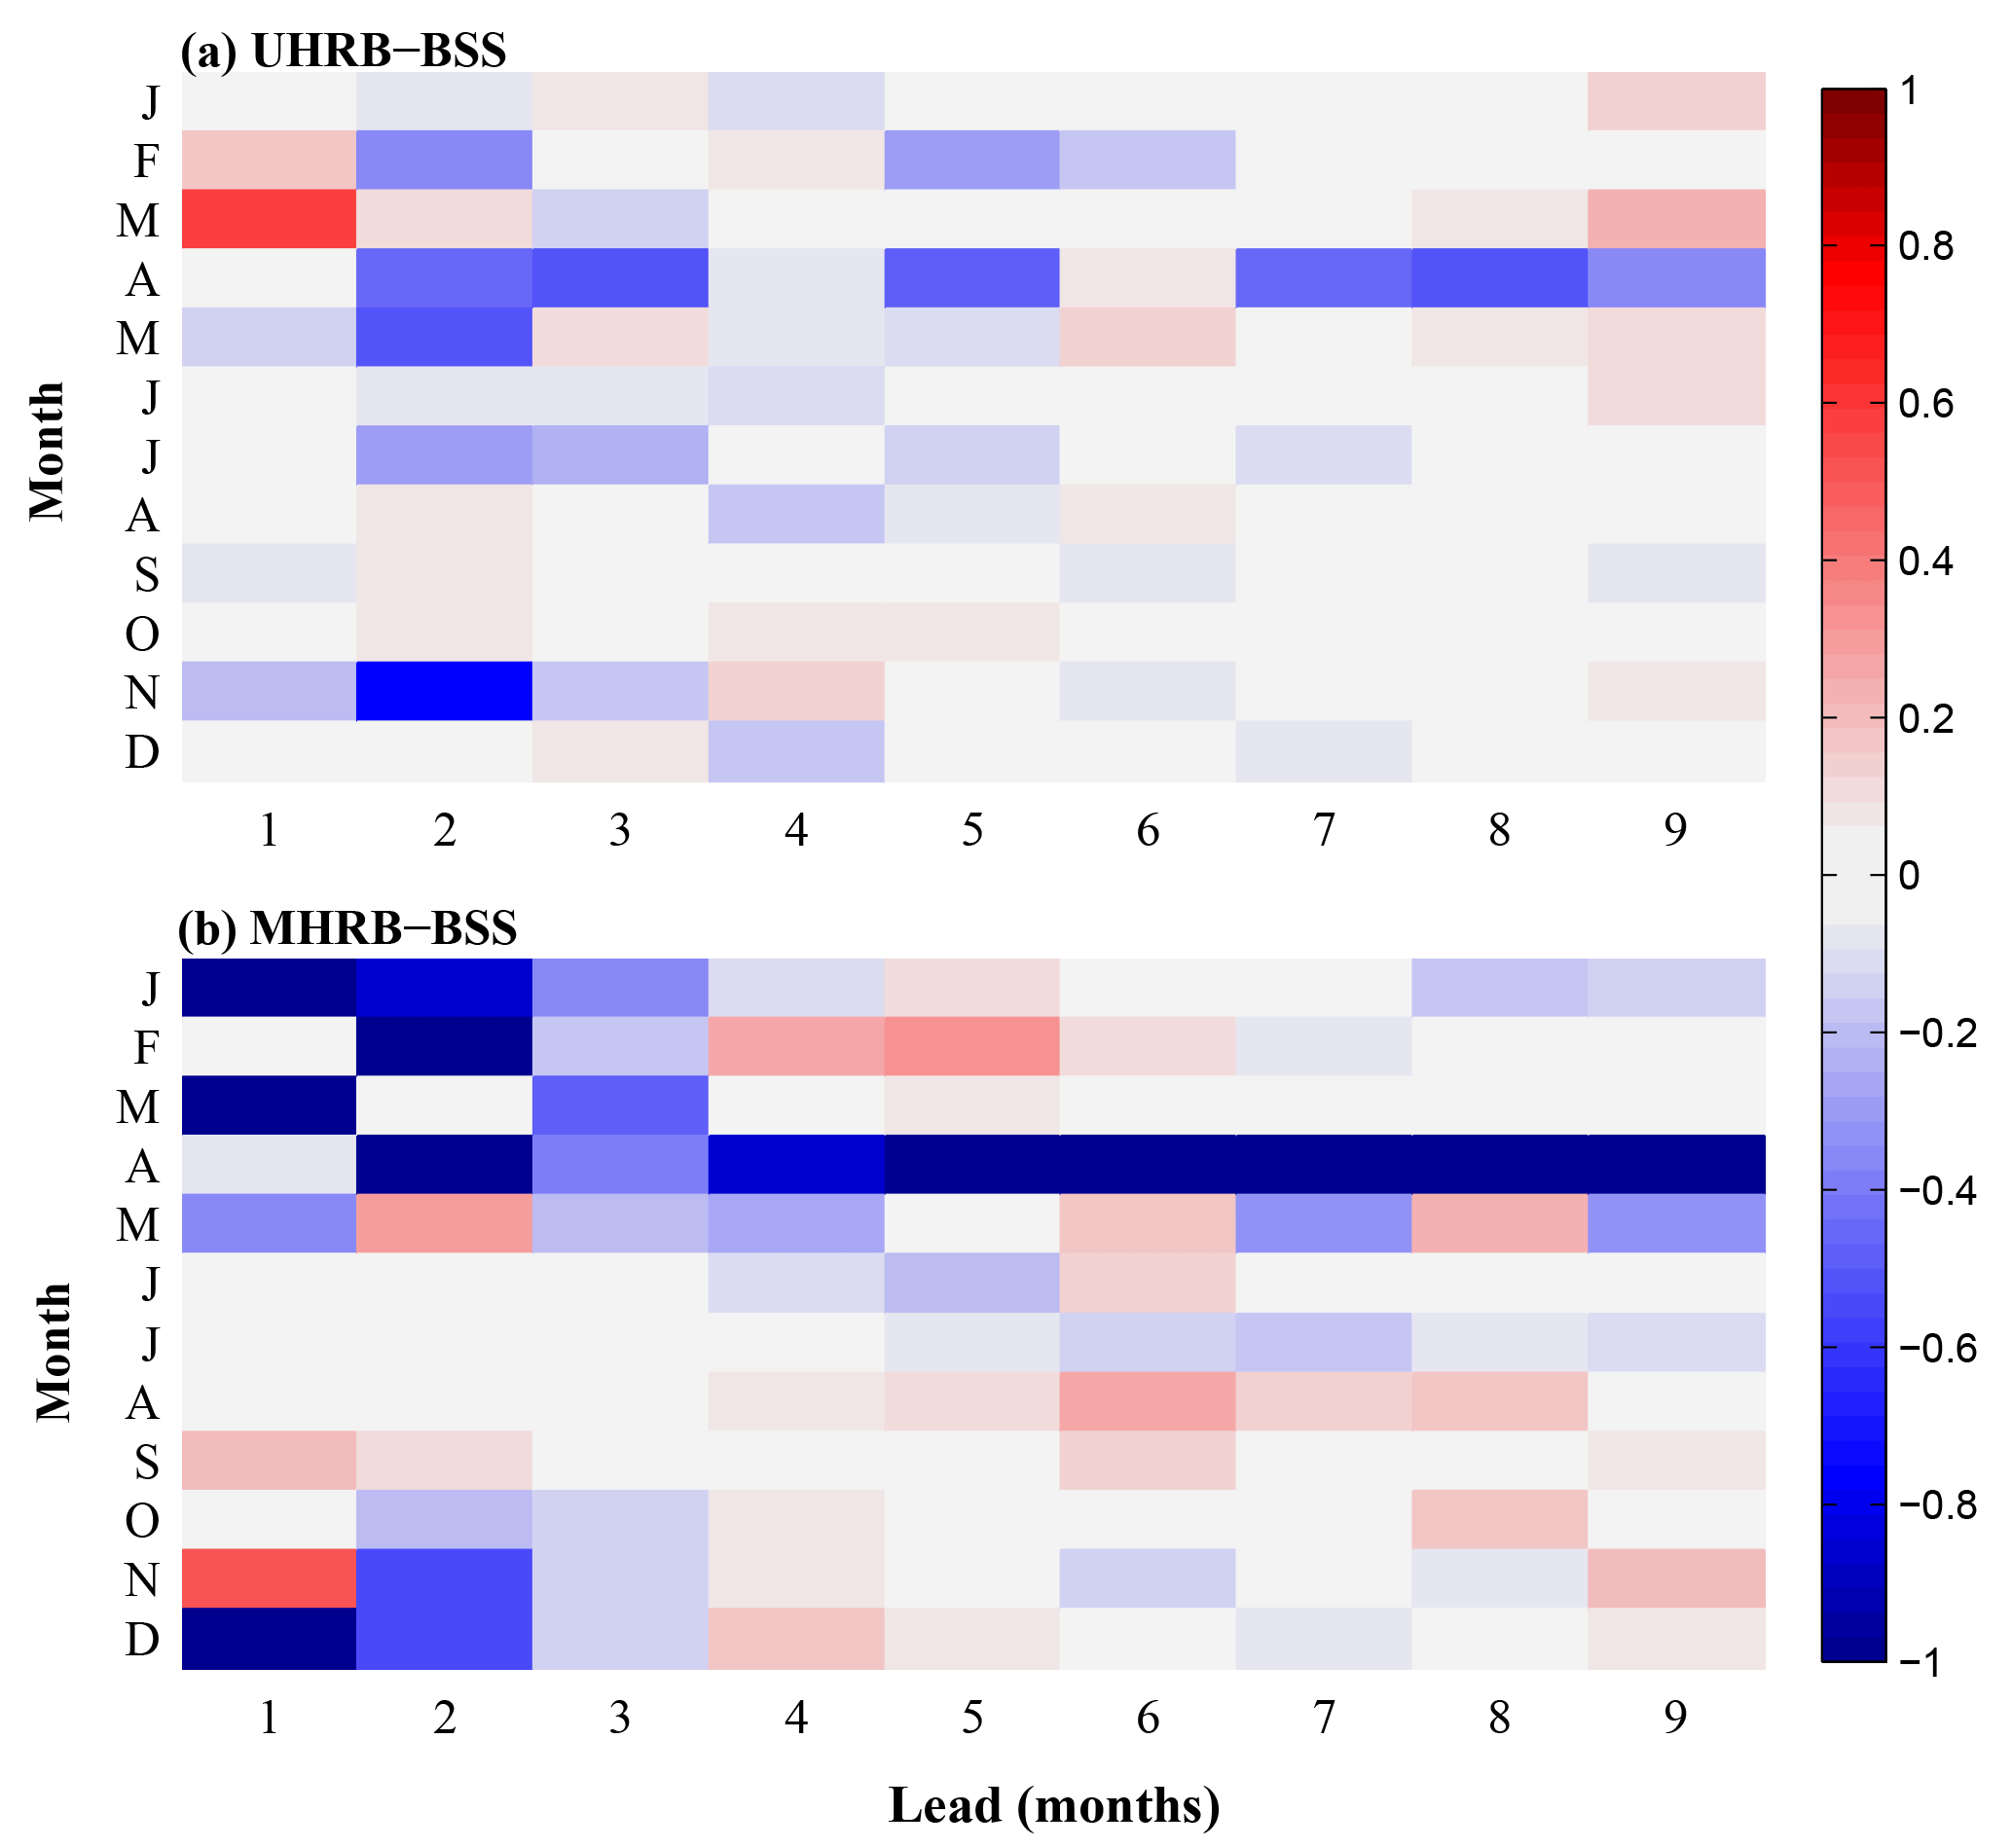
Figure 10Brier skill score (BSS) of NMME forecast for hydrological drought events. Here, a hydrological drought event happens when the SSI1 value is below −1. The reference forecasts are simulations from ESP experiment. The predictions and simulations are carried out with the human activities module switched off.
How do human activities influence hydrological drought forecast skill? Figures 9–10 show NMME-based hydrological drought forecast skill against ESP in terms of AC and BSS, when the human activities module is switched off. The forecast skill for NMME-based and ESP-based hydrological forecasts without influence of human activities (Fig. 9) is higher than that with human intervention (Fig. 5), especially in the midstream. The influence of human activities mainly occurs in the spring and early summer. Comparing Figs. 6 and 10 shows that NMME-based drought predictions have more skill improvement over the ESP-based predictions when human activities are involved. The improvement can be attained at lead times of 1–4 months in the winter, and longer lead times during April–September in the midstream. That means human activities have reduced the influence of ICs on hydrological drought predictions.
Understanding the performance of climate predictions at regional or global scales provides an important basis for the utility and improvement of these products. In recent decades, drought prediction based on climate predictions at seasonal scales has improved significantly due to a range of global climate models (Hao et al., 2018). However, hydroclimatic drought prediction and predictability over an endorheic and arid basin that is affected by complex climate mechanisms remains a great challenge. A breakthrough in predicting hydroclimatic drought over endorheic basins can bring major improvements in the development of reliable drought monitoring and prediction systems at regional and global scales. In this study, the seasonal meteorological and hydrological drought predictability and forecast skill in the Heihe River basin (HRB), a typical endorheic and arid basin with distinctive characteristics from upstream to midstream, were presented in detail. Here, meteorological predictability refers to the upper limit of forecast skill using a perfect model assumption, while hydrological predictability is to quantify the role of initial hydrological conditions (ICs) and meteorological forcings. The meteorological drought forecasting system was based on bias-corrected and downscaled 88-member North American Multimodel Ensemble (NMME) climate hindcasts during 1982–2010, and the hydrological drought forecasting system was established using the Distributed Time-Variant Gain Hydrological Model (DTVGM) driven by the post-processed predictions. The NMME-based hydrological predictions were compared with the ESP-type predictions, verified by offline simulations to ignore hydrological model structural errors. The DTVGM, with human activities modules (i.e., reservoir module and water use module), has been calibrated well over 140 subbasins in the HRB based on observed streamflow at three mainstream gauges and meteorological forcings for the period of 1981–2000. The Nash–Sutcliffe efficiency (NSE) values at a monthly scale were greater than 0.86 in the upstream during the calibration and validation periods. Given extensive irrigation and water diversions in the midstream, the NSE was greater than 0.52, indicating a reasonable human activities module in the DTVGM hydrological model.
For meteorological drought predictions, the upstream and midstream show higher meteorological drought predictability than forecast skill in terms of anomaly correlation (AC) and Brier score (BS). The forecast skill of the overall NMME mean is higher than that of most individual members. The NMME climate predictions show statistically significant predictability and forecast skills for meteorological drought in the first 2 lead months, with higher values in autumn and winter. For the hydrological drought predictions, the upstream shows higher skill than the midstream in terms of AC and Brier skill score (BSS), due to more complex hydrological processes and human activities in the midstream. The highest forecast skill occurs during winter and autumn, while the lowest skill exists during summer. During spring, the NMME-based hydrological predictions outperform ESP-type predictions up to 7 lead months, in spite of poor precipitation predictions. This may be due to more seasonal snowmelt having contributed to the streamflow in spring, which relies on the temperature predictions. The NMME-based hydrological predictions show some improvement against ESP up to 2–3 months lead during autumn. The highest forecast skill in winter could continue up to 6 months, probably due to the long memory of hydrological conditions.
Besides the ESP experiment, the reverse ESP was also conducted to investigate the relative role of initial conditions (ICs) in hydrological forecasting. The role of ICs could be more significant during the cold and dry seasons; for example, ICs prevail over the meteorological forcings up to 5–7 months during October–December and 2–3 months during January–March. However, the meteorological forcings outweigh the ICs in all lead months during warm and wet seasons (April–September). That reasonably explains the season-dependent hydrological forecast skill and inconsistency between meteorology and hydrology. In addition, a comparative experiment was conducted to explore the effect of human activities on hydrological predictability, via removing the human activities module from the DTVGM. Results show that human activities actually reduced the hydrological variability and increased the hydrological predictability during wet seasons (May and July–September) in the midstream. Therefore, the improvement of simulation of human activities could increase the hydrological drought forecast skill over a human-dominant basin.
Although the NMME-based forecasting system shows certain skill for meteorological and hydrological drought predictions, more efforts are needed to tackle issues in the following areas: (1) the physical mechanisms that caused climate anomalies need to be considered to improve climate models and the meteorological forecasting skill, as meteorological forcings play a dominant role in hydrological predictability during wet seasons. (2) The NSE value for the MHRB is greater than 0.52, which is still unsatisfactory. An unrefined human activities module in the hydrology model can lead to some uncertainties in the simulated streamflow and hydrological drought and thus the performance evaluation. For example, inaccurate calculations of irrigation water requirements and groundwater can increase errors in river flow and uncertainties in the influence of human activities on hydrological droughts. Therefore, refining the human activities' processes in the hydrological forecasting system could facilitate the understanding of the hydrological predictions over the regions with vast human activities. (3) Data assimilation and observation need to be improved for initial hydrological conditions (e.g., snow and soil moisture), which could promote the development of high-precision hydrological predictions. This requires more collaborations between scientists from different disciplines, including climate science, hydrology, agriculture, ecology and social economy.
The observed meteorological datasets, including precipitation and temperature, are available at http://data.cma.cn/data/cdcdetail/dataCode/SURF_CLI_CHN_PRE_DAY_GRID_0.5.html and http://data.cma.cn/data/cdcdetail/dataCode/SURF_CLI_CHN_TEM_DAY_GRID_0.5.html. The climate hindcasts from NMME models are available at http://iridl.ldeo.columbia.edu/SOURCES/.Models/.NMME/ (Kirtman et al., 2014).
FM, LL, AY and QD designed the experiments and FM carried them out. AY developed the DTVGM model code and FM performed the simulations. FM prepared the manuscript with contributions from all co-authors.
The authors declare that they have no conflict of interest.
This work was supported by the Strategic Priority Research Program of the
Chinese Academy of Sciences (no. XDA19070104, XDA20060401), the Natural
Science Foundation of China (no. 51879009, 41475093) and the State Key
Laboratory of Earth Surface Processes and Resource Ecology Open Research
Program (no. 2017-KF-17). This work is also supported by the Water Science
Network WaterCube Program at Michigan State University.
Edited by: Lixin Wang
Reviewed by: two
anonymous referees
Barker, L. J., Hannaford, J., Chiverton, A., and Svensson, C.: From meteorological to hydrological drought using standardised indicators, Hydrol. Earth Syst. Sci., 20, 2483–2505, 2016.
Becker, E., Van Den Dool, H., and Zhang, Q.: Predictability and forecast skill in NMME, J. Climate, 27, 5891–5906, 2014.
Below, R., Grover-Kopec, E., and Dilley, M.: Documenting drought-related disasters. A global reassessment, J. Environ. Dev., 16, 328–344, https://doi.org/10.1177/1070496507306222, 2007.
Farahmand, A. and AghaKouchak, A.: A generalized framework for deriving nonparametric standardized drought indicators, Adv. Water Resour., 76, 140–145, https://doi.org/10.1016/j.advwatres.2014.11.012, 2015.
Gringorten, II.: A plotting rule for extreme probability paper, J. Geophys. Res., 68, 813–814, 1963.
Gustard, A., Bullock, A., and Dixon, J. M.: Low flow estimation in the United Kingdom, Institute of Hydrology, Wallingford, 88 pp., 1992.
Hao, Z., Singh, V. P., and Xia, Y.: Seasonal drought prediction: Advances, challenges, and future prospects, Rev. Geophys., 56, 108–141, https://doi.org/10.1002/2016RG000549, 2018.
Huang, J., Ji, M., Xie, Y., Wang, S., He, Y., and Ran, J.: Global semi-arid climate change over last 60 years, Clim. Dynam, 46, 1131–1150, 2016a.
Huang, J., Yu, H., Guan, X., Wang, G., and Guo, R.: Accelerated dryland expansion under climate change, Nat. Clim. Change, 6, 166–171, 2016b.
Huang, S., Li, P., Huang, Q., Leng, G., Hou, B., and Ma, L.: The propagation from meteorological to hydrological drought and its potential influence factors, J. Hydrol., 547, 184–195, 2017.
Hutchinson, M. F.: Interpolation of rainfall data with Thin Plate Smoothing Splines – Part I: two dimensional smoothing of data with short range correlation, J. Geogr. Inform. Decis. Anal., 2, 139–151, 1998a.
Hutchinson, M. F.: Interpolation of rainfall data with Thin Plate Smoothing Splines – Part II: analysis of topographic dependence, J. Geogr. Inform. Decis. Anal., 2, 152–167, 1998b.
Kirtman, B. P., Min, D., Infanti, J. M., Kinter, III, J. L., Paolino, D. A., Zhang, Q., Van den Dool, H., Saha, S., Mendez, M. P., Becker, E., Peng, P., Tripp, P., Huang, J., Dewitt, D. G., Tippett, M. K., Barnston, A. G., Li, S., Rosati, A., Schubert, S. D., Rienecker, M., Suarez, M., Li Z., Marshak, J., Lim, Y. K., Tribbia, J., Pegion K., Merryfield, W. J., Denis, B., and Wood, E. F.: The North American Multimodel Ensemble: Phase-1 Seasonal-to-Interannual Prediction; Phase-2 toward Developing Intraseasonal Prediction, Bull. Am. Meteorol. Soc., 95, 585–601, 2014.
Li, X., Cheng, G., Ge, Y., Li, H., Han, F., Hu, X., Tian, W., Tian Y., Pan X., Nian, Y., Zhang, Y., Ran, Y., Zheng, Y., Gao, B., Yang, D., Zheng, C., Wang X., Liu, S., and Cai, X.: Hydrological Cycle in the Heihe River Basin and Its Implication for Water Resource Management in Endorheic Basins, J. Geophys. Res.-Atmos., 123, 890–914, 2018.
Liu, Y., Ma, K., and Lin, Z.: Potential predictability of monthly precipitation over China, J. Meteor. Res., 14, 316–329, 2000.
Luo, L. and Wood, E. F.: Assessing the idealized predictability of precipitation and temperature in the NCEP Climate Forecast System, Geophys. Res. Lett., 33, L04708, https://doi.org/10.1029/2005GL025292, 2006.
Luo, L. and Wood, E. F.: Monitoring and predicting the 2007 U.S. drought, Geophys. Res. Lett., 34, L22702, https://doi.org/10.1029/2007GL031673, 2007.
Luo, L. and Wood, E. F.: Use of Bayesian Merging Techniques in a Multimodel Seasonal Hydrologic Ensemble Prediction System for the Eastern United States, J. Hydrometeorol., 9, 866–884, 2008.
Luo, L., Sheffield, J., and Wood, E. F.: Towards a global drought monitoring and forecasting predictability, NWS Science & Technology Infusion Climate Bulletin, 2008.
Ma, M. G. and Frank, V.: Interannual variability of vegetation cover in the Chinese Heihe River Basin and itsrelation to meteorological parameters, Int. J. Remote Sens., 27, 3473–3486, 2006.
Ma, F., Yuan, X., and Ye, A.: Seasonal Drought Predictability and Forecast Skill over China, J. Geophys. Res.-Atmos., 120, 8264–8275, 2015.
Ma, F., Ye, A., Deng, X., Zhou, Z., Liu, X., Duan, Q., Xu, J., Miao, C., Di, Z., and Gong, W.: Evaluating the skill of NMME seasonal precipitation ensemble predictions for 17 hydroclimatic regions in continental China, Int. J. Climatol., 36, 132–144, 2016.
Ma, F., Ye, A., and Duan, Q.: Seasonal drought ensemble predictions based on multiple climate models in the upper Han River Basin, China, Clim. Dynam., 1–14, https://doi.org/10.1007/s00382-017-3577-1, 2017.
Ma, F., Luo, L., Ye, A., and Duan, Q.: Drought characteristics and propagation in the semi-arid Heihe River basin in Northwestern China, J. Hydrometeorol., under review, 2018.
Mao, Y., Ye, A., Liu, X., Ma, F., Deng, X., and Zhou, Z.: High-resolution simulation of the spatial pattern of water use in continental China, Hydrolog. Sci. J., 61, 2626–2638, https://doi.org/10.1080/02626667.2016.1153102, 2016.
Mariotti, A., Schubert, S., Mo, K., Peters-Lidard, C., Wood, A., Pulwarty, R., Huang, J., and Barrie, D.: Advancing drought understanding, monitoring, and prediction, B. Am. Meteorol. Soc., 94, ES186–ES188, https://doi.org/10.1175/BAMS-D-12-00248.1, 2013.
McKee, T., Doesken, N., and Kleist, J.: The relationship of drought frequency and duration to time scales, in: Proceedings of the 8th conference of applied climatology on American Meteorological Society, Anaheim, CA, 17–22 January 1993, 179–184, 1993.
Mishra, A. K. and Singh, V. P.: Drought modeling – A review, J. Hydrol., 403, 157—175, https://doi.org/10.1016/j.jhydrol.2011.03.049, 2011.
Mo, K. and Lettenmaier, D. P.: Hydrologic prediction over the conterminous United States using the National Multi-Model Ensemble, J. Hydrometeorol., 15, 1457–1472, 2014.
Mo, K. and Lyon, B.: Global meteorological drought prediction using the North American Multi-Model Ensemble, J. Hydrometeorol., 16, 1409–1424, 2016.
Pan, M., Yuan, X., and Wood, E. F.: A probabilistic framework for assessing drought recovery, Geophys. Res. Lett., 40, 3637–3642, https://doi.org/10.1002/grl.50728, 2013.
Pozzi, W., Sheffield, J., Stefanski, R., Cripe, D., Pulwarty, R., Vogt, J. V., Heim Jr, R. R., Brewer, M. J., Svoboda, M., Westerhoff, R., van Dijk, A. I.J.M., Lloyd-Hughes, B., Pappenberger, F., Werner, M., Dutra, E., Wetterhall, F., Wagner, W., Schubert, S., Mo, K., Nicholson, M., Bettio, L., Nunez, L., van Beek, R., Bierkens, M., Gustavo Goncalves de Goncalves, L., Gerd Zell de Mattos, J., and Lawford, R.: Towards global drought early warning capability: Expanding international cooperation for the development of a framework for global drought monitoring and forecasting, B. Am. Meteorol. Soc., 94, 776–785, https://doi.org/10.1175/BAMS-D-11-00176.1, 2013.
Schepen, A., Wang, Q. J., and Everingham, Y.: Calibration, Bridging, and Merging to Improve GCM Seasonal Temperature Forecasts in Australia, Mon. Weather Rev., 144, 2421–2441, 2016.
Sheffield, J. and Wood, E. F.: Drought: Past Problems and Future Scenarios, Earthscan, London, Washington, D.C., 2012.
Shi, P., Yang, T., Zhang, K., Tang, Q., Yu, Z., and Zhou, X.: Large-scale climate patterns and precipitation in an arid endorheic region: linkage and underlying mechanism, Environ. Res. Lett., 11, 044006, https://doi.org/10.1088/1748-9326/11/4/044006, 2016.
Shukla, S. and Lettenmaier, D. P.: Seasonal hydrologic prediction in the United States: understanding the role of initial hydrologic conditions and seasonal climate forecast skill, Hydrol. Earth Syst. Sci., 15, 3529–3538, https://doi.org/10.5194/hess-15-3529-2011, 2011.
Shukla, S., Sheffield, J., Wood, E. F., and Lettenmaier, D. P.: On the sources of global land surface hydrologic predictability, Hydrol. Earth Syst. Sci., 17, 2781–2796, https://doi.org/10.5194/hess-17-2781-2013, 2013.
Shukla, S., Roberts, J., Hoell, A., Funk, C. C., Robertson, F., and Kirtman, B.: Assessing North American multimodel ensemble (NMME) seasonal forecast skill to assist in the early warning of anomalous hydrometeorological events over East Africa, Clim. Dynam, 1–17, https://doi.org/10.1007/s00382-016-3296-z, 2016.
Smith, A. B. and Katz, R. W.: US billion-dollar weather and climate disasters: Data sources, trends, accuracy and biases, Nat. Hazards, 67, 387–410, https://doi.org/10.1007/s11069-013-0566-5, 2013.
Sun, J., Jiang, H., Wang, K., Xu, J., Li, Z., Zhu, Q., and Luo, X.: The Analysis of Atmospheric Circulation and Water Vapor Conditions of Precipitation over the Heihe River Basin, 2011 International Conference on Computer Distributed Control and Intelligent Environmental Monitoring, Changsha, China, 19–20 February, 2271–2275, 2011.
Thober, S. and Kumar, R.: Seasonal soil moisture drought prediction over Europe using the North American Multi-Model Ensemble (NMME), J. Hydrometeorol., 16, 2329–2344, 2015.
Van Loon, A. F., Gleeson, T., Clark, J., Van Dijk, A. I., Stahl, K., Hannaford, J., Baldassarre G. D., Teuling A. J., Tallaksen, L. M., Uijlenhoet, R., Hannah, D. M., Sheffield, J., Svoboda, M., Verbeiren, B., Wagener, T., Rangecroft, S., Wanders, N., and Van Lanen, H. A. J.: Drought in the Anthropocene, Nat. Geosci., 9, 89–91, https://doi.org/10.1038/ngeo2646, 2016a.
Van Loon, A. F., Stahl, K., Di Baldassarre, G., Clark, J., Rangecroft, S., Wanders, N., Gleeson, T., Van Dijk, A. I. J. M., Tallaksen, L. M., Hannaford, J., Uijlenhoet, R., Teuling, A. J., Hannah, D. M., Sheffield, J., Svoboda, M., Verbeiren, B., Wagener, T., and Van Lanen, H. A. J.: Drought in a human-modified world: reframing drought definitions, understanding, and analysis approaches, Hydrol. Earth Syst. Sci., 20, 3631–3650, https://doi.org/10.5194/hess-20-3631-2016, 2016b.
Vicente-Serrano, S. M., López-Moreno, J. I., Beguería, S., Lorenzo-Lacruz, J., Azorin-Molina, C., and Morán-Tejeda, E.: Accurate computation of a streamflow drought index, J. Hydrol. Eng., 17, 318–332, 2012.
Wang, J. and Li, W.: Establishing simulated model of snowmelt runoff for large scale basin in western China, J. Glaciol. Geocryol., 21, 264–268, 1999.
Wang, S., Kang, S., Zhang, L., and Li, F.: Modelling hydrological response to different land-use and climate change scenarios in the Zamu River basin of northwest China, Hydrol. Proc., 22, 2502–2510, 2008.
Wang, S. and Yuan, X.: Extending seasonal predictability of Yangtze River summer floods, Hydrol. Earth Syst. Sci., 22, 4201–4211, https://doi.org/10.5194/hess-22-4201-2018, 2018.
Wilks, D. S.: Statistical methods in the atmospheric sciences, 3 Edn., International Geophysics Series, Vol. 100, edited by: Dmowaska, R., Hartmann, D., and Rossby, H. T., Academic Press, Kidlington, UK, 704 pp, 2011.
Wood, A. W. and Lettenmaier, D. P.: An ensemble approach for attribution of hydrologic prediction uncertainty, Geophys. Res. Lett., 35, L14401, https://doi.org/10.1029/2008GL034648, 2008.
Wood, A. W., Mauer, E. P., Kumar, A., and Lettenmaier, D. P.: Long-range experimental hydrologic forecasting for the eastern United States, J. Geophys. Res. Atmos., 107, 4429, https://doi.org/10.1029/2001JD000659, 2002.
Ye, A., Duan, Q., Zeng, H., Li, L., and Wang, C.: A Distributed Time-Variant Gain Hydrological Model based on remote sensing, J. Resour. Ecol., 1, 222–230, 2010.
Ye, A., Duan, Q., Zhan, C., Liu, Z., and Mao, Y.: Improving kinematic wave routing scheme in Community Land Model, Hydrol. Res., 44, 886–903, 2013.
Yuan, X.: An experimental seasonal hydrological forecasting system over the Yellow River basin – Part 2: The added value from climate forecast models, Hydrol. Earth Syst. Sci., 20, 2453–2466, https://doi.org/10.5194/hess-20-2453-2016, 2016.
Yuan, X. and Wood, E. F.: Multimodel seasonal forecasting of global drought onset, Geophys. Res. Lett., 40, 4900–4905, 2013.
Yuan, X., Zhang, M., Wang, L., and Zhou, T.: Understanding and seasonal forecasting of hydrological drought in the Anthropocene, Hydrol. Earth Syst. Sci., 21, 5477–5492, https://doi.org/10.5194/hess-21-5477-2017, 2017.
Zhang, A., Liu, W., Yin, Z., Fu, G., and Zheng, C.: How will climate change affect the water availability in the Heihe River Basin, northwest China?, J. Hydrometeorol., 17, 1517–1542, 2016.
Zhang, Y., Fu, G., Sun, B., Zhang, S., and Men, B.: Simulation and classification of the impacts of projected climate change on flow regimes in the arid Hexi Corridor of northwest China, J. Geophys. Res.-Atmos., 120, 7429–7453, 2015.
Zhao, Y. and Zhu, J.: Assessing quality of grid daily precipitation datasets in China in recent 50 years, Plateau Meteorology (in Chinese), 34, 50–58, 2015.