the Creative Commons Attribution 4.0 License.
the Creative Commons Attribution 4.0 License.
 | 13 Nov 2018
Studying catchment storm response using event- and pre-event-water volumes as fractions of precipitation rather than discharge
Jana von Freyberg
Bjørn Studer
Michael Rinderer
James W. Kirchner
Catchment response to precipitation is often investigated using two-component isotope-based hydrograph separation, which quantifies the contribution of precipitation (i.e., event water Qe) or water from storage (i.e., pre-event water Qpe) to total discharge (Q) during storm events. In order to better understand streamflow-generating mechanisms, two-component hydrograph separation studies often seek to relate the event-water fraction Qe∕Q to storm characteristics or antecedent wetness conditions. However, these relationships may be obscured because the same factors that influence Qe also necessarily influence total discharge Q as well. Here we propose that the fractions of event water and pre-event water relative to total precipitation (Qe∕P and Qpe∕P), instead of total discharge, provide useful alternative tools for studying catchment storm responses. These two quantities separate the well-known runoff coefficient (Q∕P, i.e., the ratio between total discharge and precipitation volumes over the event timescale) into its contributions from event water and pre-event water. Whereas the runoff coefficient Q∕P quantifies how strongly precipitation inputs affect streamflow, the fractions Qe∕P and Qpe∕P track the sources of this streamflow response.
We use high-frequency measurements of stable water isotopes for 24 storm events at a steep headwater catchment (Erlenbach, central Switzerland) to compare the storm-to-storm variations in and Qpe∕P. Our analysis explores how storm characteristics and antecedent wetness conditions affect the mobilization of event water and pre-event water at the catchment scale. Isotopic hydrograph separation shows that catchment outflow was typically dominated by pre-event water, although event water exceeded 50 % of discharge for several storms. No clear relationships were found linking either storm characteristics or antecedent wetness conditions with the volumes of event water or pre-event water (Qe, Qpe), or with event water as a fraction of discharge (Qe∕Q), beyond the unsurprising correlation of larger storms with greater Qe and greater total Q. By contrast, event water as a fraction of precipitation (Qe∕P) was strongly correlated with storm volume and intensity but not with antecedent wetness, implying that the volume of event water that is transmitted to streamflow increases more than proportionally with storm size under both wet and dry conditions. Conversely, pre-event water as a fraction of precipitation (Qpe∕P) was strongly correlated with all measures of antecedent wetness but not with storm characteristics, implying that wet conditions primarily facilitate the mobilization of old (pre-event) water, rather than the fast transmission of new (event) water to streamflow, even at a catchment where runoff coefficients can be large.
Thus, expressing event- and pre-event-water volumes as fractions of precipitation rather than discharge was more insightful for investigating the Erlenbach catchment's hydrological behaviour. If Qe∕P and Qpe∕P exhibit similar relationships with storm characteristics and antecedent wetness conditions in other catchments, we suggest that these patterns may potentially be useful as diagnostic “fingerprints” of catchment storm response.
- Article
(6141 KB) -
Supplement
(3294 KB) - BibTeX
- EndNote


Studying catchment hydrological responses to precipitation events can be useful in identifying dominant controls on streamflow generation. For decades, hydrologists have compared the volumes of precipitation (P) and discharge (Q) during storm events using the runoff coefficient Q∕P (e.g., Fischer et al., 2017; Horton, 1933; Jordan, 1994; Litt et al., 2015; McGlynn et al., 2004; Munyaneza et al., 2012; Shanley and Chalmers, 1999; Sidle et al., 1995). Other studies have separated the hydrograph into base flow and quick flow (using graphical methods, low-pass digital filtering or recession curve analysis; Blume et al., 2007; Hall, 1968; Hewlett and Hibbert, 1967; Nathan and McMahon, 1990) and have compared the quick-flow fraction of Q to precipitation. Both the runoff coefficient Q∕P and the ratio of quick flow to precipitation quantify how streamflow responds to precipitation inputs, but neither tracks the source of this streamflow response. In other words, both metrics characterize the celerity or the effect of an event on streamflow, not the velocity of water movement through the catchment (McDonnell and Beven, 2014). Because the runoff coefficient Q∕P and the ratio of quick flow to precipitation can be calculated from hydrometric data alone, they have been estimated for many events and sites. Runoff coefficients Q∕P typically increase with storm size (e.g., Fischer et al., 2017; Jordan, 1994) and antecedent wetness (e.g., Litt et al., 2015; Sidle et al., 1995) and have been found to be unaffected by catchment area (e.g., McGlynn et al., 2004). The ratio of quick flow to precipitation has often been found to increase with storm size and intensity (e.g., Blume et al., 2007; Norbiato et al., 2009), with wetter antecedent conditions (e.g., Detty and McGuire, 2010; Merz et al., 2006; Penna et al., 2011; von Freyberg et al., 2014) and with catchment area (e.g., Brown et al., 1999). However, it remains unclear whether these relationships arise because certain storm characteristics, antecedent wetness conditions, landscape properties, etc., facilitate the more efficient transmission of recent precipitation (“event water”) to the stream or the more effective mobilization of pre-event water from catchment storage. This question cannot be answered with hydrometric data alone; instead it also requires using tracer data to track the flow of water through the catchment and thus to separate the runoff coefficient into its event and pre-event components.
Tracer-based, two-component hydrograph separation uses stable water isotopes (2H, 18O) to estimate the relative “time source components” of catchment outflow, i.e., recent precipitation (event water, Qe∕Q) and catchment storage (pre-event water, Qpe∕Q; Klaus and McDonnell, 2013). Particularly in humid environments, stable water isotopes are considered to be nearly conservative tracers, because isotopic fractionation effects due to evaporation are negligible, so mixing is the major process controlling the isotopic composition of stream waters. Hydrograph separation studies have related the event-water fraction of discharge (Qe∕Q) to storm characteristics (e.g., James and Roulet, 2009; Pellerin et al., 2008), antecedent catchment wetness conditions (e.g., Casper et al., 2003; James and Roulet, 2009; Penna et al., 2015; Shanley et al., 2002; von Freyberg et al., 2017), landscape properties (e.g., Buttle, 1994; Fischer et al., 2017) and catchment size (e.g., Laudon et al., 2007; Shanley et al., 2002). Antecedent wetness has frequently been identified as a major control on the relative contribution of event water to streamflow. Wetter antecedent conditions typically lead to smaller event-water fractions Qe∕Q and, by implication, larger pre-event-water fractions. This suggests that under these conditions, larger volumes of pre-event water are available in more permeable subsurface layers that can be rapidly activated by incoming precipitation (e.g., Casper et al., 2003; Klaus and McDonnell, 2013; Muñoz-Villers and McDonnell, 2012). In contrast, at sites where positive relationships between Qe∕Q and antecedent wetness have been observed, it has been hypothesized that vertical infiltration must first replenish storage deficits before event water can be rapidly transported via lateral flow pathways or surface runoff (Shanley et al., 2002; von Freyberg et al., 2017), or that the expansion of saturated areas in the catchment enhances direct runoff of rainwater (Penna et al., 2016). Still other studies have found no correlation between antecedent wetness and Qe∕Q (Ocampo et al., 2006), which has often been attributed to an insufficient number of sampled events or an insufficient range of antecedent moisture conditions (e.g., Barthold et al., 2017; Fischer et al., 2017; James and Roulet, 2009; Penna et al., 2015).
Although the runoff coefficient Q∕P and the event-water fraction Qe∕Q have commonly been used in catchment studies, the ratio between Qe and P might provide an alternative tool for studying streamflow responses to precipitation events. The ratio Qe∕P has previously been used as a surrogate for the fraction of the catchment area that generates surficial runoff (Buttle and Peters, 1997; Eshleman et al., 1993; Rodhe, 1987; Pellerin et al., 2008), but it has not been widely used to explore how catchment storm response varies with antecedent wetness and storm characteristics (but see Ocampo et al., 2006, for one example).
The conceptual differences between the ratios Qe∕Q and Qe∕P can be explained by analogy, with forward and backward transit times (e.g., Hrachowitz et al., 2016). A stream-water parcel's backward transit time is its age since its entry as precipitation at the time it exits the catchment, whereas a precipitation parcel's forward transit time is the age it will accumulate in the catchment before it eventually exits as streamflow. Analogously, Qe∕Q quantifies the fraction of total storm discharge that comes from recent precipitation (“event water”) – that is, the fraction of streamflow with a short backward transit time. The ratio Qe∕P, on the other hand, quantifies the fraction of total storm precipitation that will be discharged during the same event – that is, the fraction of precipitation with a short forward transit time.
The “backward” event-water fraction Qe∕Q and the “forward” event-water fraction Qe∕P are not the same, for the simple reason that not all precipitation is discharged during the event (otherwise there would be no recharge of storage that supplies base flow between events). Thus at the event timescale, total P is typically greater than total Q, so Qe∕P will be less than Qe∕Q. To use a concrete example, a 60 mm storm event might produce 24 mm of catchment outflow, from which 6 mm is event water (Qe) from precipitation, and the remaining 18 mm of discharge is pre-event water (Qpe) mobilized from catchment storage; the 54 mm of precipitation that does not form event discharge then goes into storage. In this example, the backward event-water fraction Qe∕Q would be 6 mm ∕ 24 mm = 0.25, and the forward event-water fraction Qe∕P would be 6 mm ∕ 60 mm = 0.1.
In addition to the ratio Qe∕P, we can also calculate the ratio of pre-event-water volume to precipitation (Qpe∕P). Whereas the event- and pre-event-water fractions of discharge are mathematically linked through the relationship , the ratios Qe∕P and Qpe∕P instead sum to the runoff coefficient Q∕P. From this perspective, Qe∕P and Qpe∕P represent the contributions of event and pre-event water to the runoff coefficient; thus Qe∕P and Qpe∕P can be viewed as the “event runoff coefficient” and “pre-event runoff coefficient”, respectively.
Care has to be taken with the conceptual definition of Qpe∕P; it quantifies how much pre-event water is mobilized by, not contained in, a unit volume of precipitation (which, by definition, cannot contain pre-event water). This highlights an important distinction between Qpe∕P and the other three ratios (Qe∕Q, Qpe∕Q and Qpe∕P). In the event- and pre-event-water fractions of discharge (Qe∕Q and Qpe∕Q) as well as in the event-water fraction of precipitation (Qe∕P), the numerator is a physical (not just a mathematical) fraction of the denominator. That is, Qe is physically derived from P, and along with Qpe, it is physically part of Q. But Qpe is not physically part of P, and thus Qpe∕P does not represent a physical fraction of a whole.
Whereas Qe∕P has been estimated for several events at several catchments (Buttle and Peters, 1997; Eshleman et al., 1993; Rodhe, 1987; Pellerin et al., 2008), with the exception of a single figure in a single study (Fig. 7 of Ocampo et al., 2006), the behaviour of Qpe∕P has apparently remained entirely unexplored. From the general concepts outlined above, we hypothesize that the event and pre-event runoff coefficients Qe∕P and Qpe∕P may be more informative metrics for studying catchment storm responses, compared to the widely used event-water fraction of discharge Qe∕Q or the runoff coefficient Q∕P. In this paper, we test this hypothesis by comparing runoff coefficients Q∕P and the different ratios Qe∕Q, Qpe∕Q, Qe∕P and Qpe∕P across 24 storm events and analysing their relationships with storm characteristics and antecedent wetness. These relationships shed light on possible streamflow generation processes at our study site and highlight the potential benefits of using Qe∕P and Qpe∕P, rather than Q∕P or Qe∕Q, to characterize catchment storm response. Our source data consist of high-frequency isotope measurements from a steep, partly forested headwater catchment in central Switzerland, collected during snow-free periods between September 2016 and October 2017.

Figure 1The Erlenbach catchment with spatial distribution of (a) saturated soils (FOEN, 2011), mapped wet meadows and (b) vegetation (Fischer et al., 2015).
2.1 Field site
The Erlenbach research catchment is located in the northern Swiss pre-Alps roughly 40 km south of Zurich. The 0.7 km2 catchment spans an elevation range from 1100 to 1655 m a.s.l. (Fig. 1). The bedrock geology consists of alternating layers of conglomerates, clay and marl shales, limestone and calcareous sandstones, with lithological boundaries nearly perpendicular to the main valley axis (Hantke, 1967; Hsü and Briegel, 1991). Due to the layering and the diversity of the bedrock material, the landscape in the upper half of the catchment is divided into a sequence of steep hillslopes and plateaus. On the plateaus, groundwater tables are shallow, and mollic Gleysols with a carbonate-rich topsoil predominate; the hillslopes are mostly covered with macropore-rich Umbric Gleysols (Schleppi et al., 1998). Overall, the soils reach maximum depths of around 2.5 m in depressions on the plateaus, while soils are shallower (0.5–1 m) on steeper slopes (Fischer et al., 2015; Rinderer et al., 2017). Due to the high clay content of the flysch material, the bedrock and soils are generally characterized by low permeabilities and are prone to waterlogging. As a consequence, soil saturation is likely to occur on approximately 30 % of the catchment area (FOEN, 2011). The distribution of these areas agrees well with the mapped locations of numerous wet meadows that cover roughly 22 % of the catchment area (Fig. 1a). The channel network in the Erlenbach catchment is dense (around 20 km km−2), partly due to open drainage ditches in meadows as well as numerous small springs emerging from the bases of hillslopes in the upper part of the catchment. The Erlenbach catchment is mainly covered with coniferous forests (53 %) on the hillslopes, while partially forested areas (22 %) and meadows (25 %) occur largely on the plateaus (Fischer et al., 2015; Fig. 1b).
Annual precipitation at Erlenbach averages roughly 1850 mm yr−1 (over the period 2000–2015), with monthly maxima and minima in June and October, respectively (van Meerveld et al., 2018). In years with cold winters, up to 40 % of annual precipitation falls as snow (Stähli and Gustafsson, 2006), and in summer, frequent thunderstorms generate pronounced peaks in streamflow.
2.2 Data set
A meteorological station is located at 1216 m a.s.l. on a grassland site near the south-western catchment border (Fig. 1). At this station, precipitation is measured at 1.5 m above ground with a heated tipping bucket (Joss-Tognini 15183; Lambrecht meteo GmbH, Göttingen, Germany) and groundwater table depth is measured in a fully screened pipe with a pressure transducer (BTL2-P1-1000-B-S50; Balluff GmbH, Neuhausen a.d.F., Germany). The pressure transducer readings have not been calibrated against manual measurements and thus should be considered only as a relative indication of groundwater table variations. River discharge has been monitored at the catchment outlet with a concrete flume since 1984 (Hegg et al., 2006). All measurements are recorded at 10 min intervals and were aggregated to 30 min or 1 h intervals in the following analysis.
Soil moisture content is measured every 1 min at two locations in the Erlenbach catchment, a grassland site (at the meteorological station, 1216 m a.s.l.) and a forest site (1185 m a.s.l.; Fig. 1). At each site, one ECH2O 10HS and three ECH2O 5TM probes (both probe types from METER Environment, Munich, Germany) were installed at roughly 50 cm depth across an area of 3×4 m. Soil moisture data collection at the forested plot began only in December 2016. Prior to installation, the factory-calibrated soil moisture probes were compared to each other by installing them together in a bucket filled with moist sand. Only those probes that showed similar values were installed in the field. As we were only interested in the temporal variations of soil moisture content over the course of individual events, we considered the factory calibration of the soil moisture probes sufficient for our purposes. The soil moisture measurements from the four probes at each site were averaged to smooth out anomalous variations in soil moisture at the individual sampling locations, and they were subsequently aggregated to 30 min or 1 h intervals.
Recent technological advances allow for on-site high-frequency sampling and analysis of stable water isotopes in stream water and precipitation (von Freyberg et al., 2017). With such a lab in the field, isotopic responses in streamflow can be captured over long periods spanning a wide range of hydro-climatic conditions. A field laboratory was installed just above the Erlenbach outlet to measure stable water isotopes at 30 min intervals. The set-up of the field laboratory is similar to the system described in von Freyberg et al. (2017) and will therefore be described here only briefly.
Stream water was continuously pumped from the stream to the field laboratory. Precipitation was captured in a 45 cm diameter funnel, transmitted into the field lab through a Tygon tube and collected in a 1 L teflon-lined separating funnel. Whenever the sample volume exceeded 50 mL, the field lab alternately analysed precipitation and stream water (thus yielding one precipitation and one stream-water sample every hour). During rainless periods stream water was analysed on a 30 min cycle; a drift correction check-standard was analysed every 4 h.
A new analysis cycle was started every 30 min, with an automated pumping routine that filled a 50 mL collection vessel with either stream water or precipitation. A suction tube with a PE-filter frit (20 µm pore size) led from the collection vessel to two programmable high-precision dosing pumps (800 Dosino, hereafter simply “Dosino”; Metrohm AG, Herisau, Switzerland). These alternatingly took up 30 mL from the collection vessel and injected it at a constant flow rate of 1 mL min−1 into a continuous water sampler module (CWS; Picarro Inc., Santa Clara, CA, USA) connected to a wavelength-scanned cavity ring-down spectrometer (CRDS; Picarro model L2130-i). During the 30 min injection cycle, the 50 mL collection vessel, the other Dosino and all tubing were flushed with Nanopure water and air and then rinsed with approximately 10 mL of the next sample, to minimize sample carryover effects.
Within the CWS, liquid samples flow through a semipermeable membrane tube that is surrounded by a flow of dry air. Thus, water vapour diffuses steadily through the membrane wall and is transported with the dry-air flow to the isotope analyser. The CRDS measures concentrations of 18O and 2H every 6 s, however, we averaged the last 10 min of each 30 min injection period to obtain the final isotope values. The measurement precision of the CWS coupled to the CRDS with the Dosino injection system was estimated from the standard deviations of these 10 min averages (von Freyberg et al., 2017). For δ18O and δ2H, the averages of these standard deviations were 0.09 ‰ and 0.21 ‰, respectively, which are used as estimates of uncertainty in the error propagation calculations (Sect. 2.4). Isotopic abundances are reported in δ18O and δ2H relative to Vienna Standard Mean Ocean Water (VSMOW). The isotope analyser was initially calibrated to VSMOW-SLAP standards before installation in the field laboratory; during the field deployment, instrument drift and carry-over were quantified and corrected by regularly measuring one internal isotope standard every 4 h and two internal standards approximately weekly.
2.3 Event properties: storm characteristics and initial catchment state
The following metrics were used to describe the storm characteristics: total event precipitation (P, mm), cumulative precipitation before peak flow (PuntilQpeak, mm), mean precipitation intensity (Pint, mm h−1), maximum precipitation over 1 h (P1 h, mm h−1) and 4 h (P4 h, mm), maximum cumulative discharge volume over 4 h (Q4 h, mm) and rainfall duration (T, hours). The following metrics were used to quantify antecedent catchment wetness: 3-day and 7-day antecedent precipitation (AP3 and AP7, mm) as well as the 1 h average values of discharge (Qini, mm h−1), groundwater table depth (GWini, cm), and soil moisture at the grassland site (SMini, m3 m−3) before the onset of the storm event.
We compared these metrics of storm characteristics and antecedent wetness conditions with the event- and pre-event-water fractions using Spearman rank correlation. Spearman rank correlation was preferred over Pearson (product-moment) correlation because it is less sensitive to extreme values and thus more suitable for smaller data sets. For our analyses, correlation p values of p < 0.01 were considered statistically significant.
2.4 Two-component hydrograph separation to quantify event- and pre-event-water volumes
We use the isotopic composition (δ2H and δ18O) of stream water and precipitation to separate the streamflow hydrograph into two components, event water and pre-event water. Event water (subscript e) is stream water that entered the catchment as precipitation during a storm event, whereas pre-event water (subscript pe) is stream water derived from pre-event catchment storage. Following Pinder and Jones (1969), tracer-based hydrograph separation is based on a mass balance for water,
and tracer flux,
where qi, and are total, event-water and pre-event-water fluxes at time step i, and ci, and are the tracer concentrations in stream water, event water and pre-event water, respectively.
The instantaneous fraction of event water in discharge for each time step i can thus be obtained by combining Eqs. (1) and (2):
To make the time series continuous, it is linearly interpolated between measurement gaps that occurred whenever check standards or precipitation samples were analysed instead of stream-water samples.
Following general practice, we assume that the tracer concentration of pre-event water is constant over the duration of each event (Sklash and Farvolden, 1979) so that becomes cpe. We calculate cpe as the average isotopic composition of the last five stream-water samples before the beginning of each storm event (i.e., 2.5 h or 3 h, if a check standard was sampled within this period). We estimate the time series of event-water tracer concentration, , as an incremental weighted mean (McDonnell et al., 1990), weighted by precipitation rates over all previous time steps j since the beginning of the storm:
The total event-water volume (Qe) is the cumulative sum of the instantaneous values over the event duration, and the cumulative pre-event-water volume (Qpe) was obtained by subtracting Qe from the total discharge volume Q over the event. The beginning of a storm event was the time of first rainfall, and the end of a storm event was defined as the time that (i) event-water discharge declined to 5 % of its peak value or (ii) another precipitation event began, whichever came first; case (i) prevailed for 18 of 24 events.
The ratios of event and pre-event water relative to precipitation are
and
The standard errors (SE) of and were estimated though Gaussian error propagation (Genereux, 1998):
and
The standard error of cpe is estimated by pooling the uncertainty in the individual measurements and their standard deviation from one another (von Freyberg et al., 2017). Because ci and cpe are independent measurements, their errors and are likely to be uncorrelated with each other. In contrast, errors in the calculated event-water isotope values will be highly correlated with each other over time due to the incremental volume-weighting of tracer concentrations in precipitation. Taking these correlations into account requires first-order, second-moment error propagation (Bevington and Robinson, 2003), which reduces to Gaussian error propagation in the special case of uncorrelated errors. The first-order, second-moment error propagation formula for the event-water fraction Qe∕Q, averaged over all times i in the storm event (Sect. 2.3), is
where the square brackets on the outside of the last summation, rather than the inside, reflect the conservative assumption that the errors in the event-water isotope values are perfectly correlated. The other two pairs of square brackets are inside the summations, reflecting the assumption that the errors in ci and cpe are uncorrelated. For simplicity, and because our main focus is on the event and pre-event fractions of the water fluxes rather than the fluxes themselves, we ignore any measurement errors in qi and P.
Following Eqs. (5) and (6), the standard errors of Qe∕P and Qpe∕P can be estimated with the following:
and
Figure 2 shows the time series of the observed variables for the roughly 8-month study period from 15 September 2016 to 1 November 2017, excluding the winter season influenced by snowfall and snow cover (6 November 2016–7 May 2017). Streamflow responds promptly to precipitation and is strongly synchronized with shallow soil moisture and groundwater table variations. The average soil moisture content at the grassland site was slightly higher and more variable than at the forested site. The values of stable water isotopes in precipitation are highly variable within and across events, ranging between −170.3 ‰ and −31.7 ‰ for δ2H and between −22.5 ‰ and −4.2 ‰ for δ18O for the storms considered here. Stream-water isotopes are strongly damped but also show distinct responses to individual storms (Fig. 2a). For the 24 events, values of δ2H and δ18O in stream water ranged from −56.1 ‰ to −84.3 ‰ and from −8.6 ‰ to −12.2 ‰ , respectively. During the roughly 8-month study period, more than 9400 water samples were measured; missing values due to problems with the automatic sampling cycle or instrument malfunctioning account for roughly 8 % of the data set.
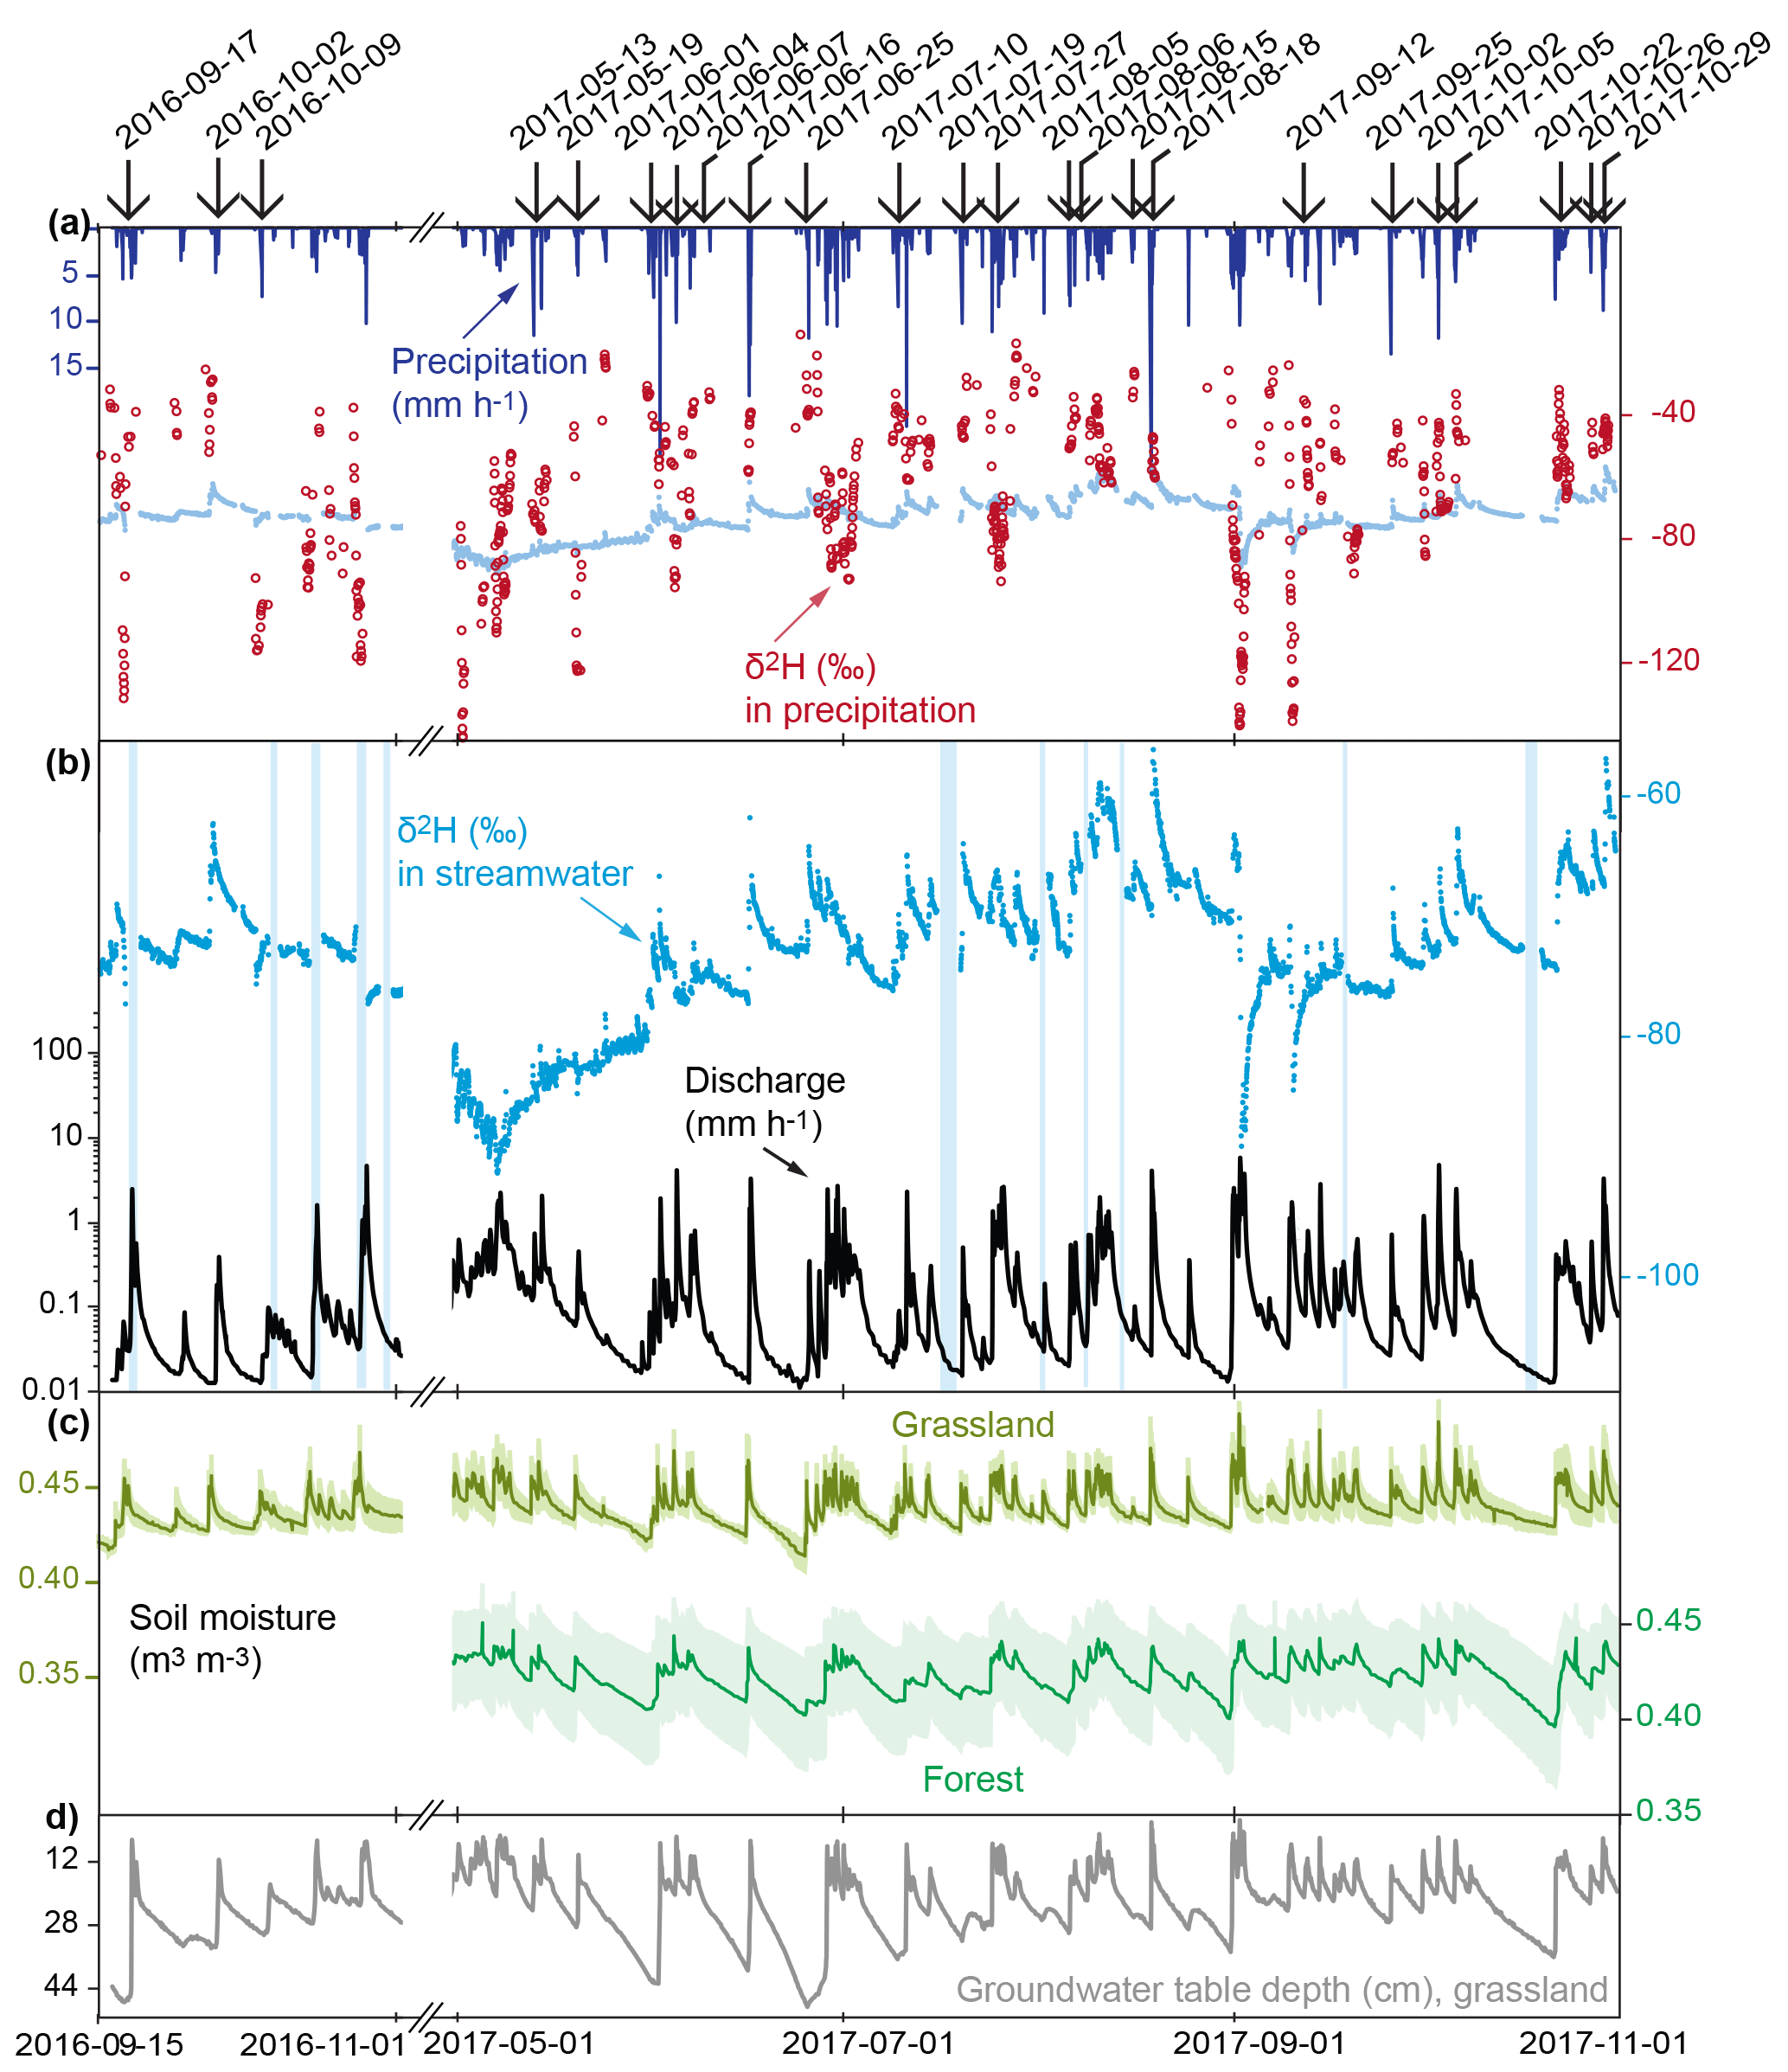
Figure 2Time series of (a) precipitation and δ2H in precipitation (δ2H in stream water is shown for comparison), (b) discharge (on log axis) and δ2H in stream water (vertical bars indicate gaps in the isotope data), (c) soil moisture measured at 50 cm depth at the grassland and forest sites (Fig. 1a), with shaded areas showing the standard error from averaging the measurements from the four probes at each plot, and (d) groundwater levels at the grassland site. The winter period with snow cover (6 November 2016–7 May 2017) was not considered in this analysis, since the individual contributions of rainfall and snowmelt to river discharge could not be distinguished sufficiently. Vertical arrows indicate the events analysed in this paper.
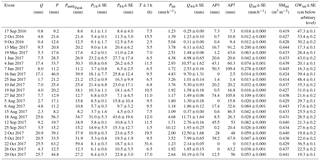
Table 1Properties of the storm events: total discharge (Q), total precipitation (P), cumulative precipitation before peak flow (PuntilQpeak), mean precipitation intensity (Pint), maximum precipitation over 1 h (P1 h) and 4 h (P4 h), event duration (T), and 4 h peak discharge volume (Q4 h). The initial catchment wetness state was quantified using 3-day and 7-day antecedent precipitation (AP3 and AP7) as well as the 1 h average values of discharge (Qini), groundwater table depth (GWini) and soil moisture (SMini) before the onset of the storm event.
3.1 General properties of the events
Table 1 provides an overview of the storm characteristics and antecedent wetness conditions for the individual storm events. Total storm rainfall P ranged between 8.2 and 63.2 mm (25.1±3.1 mm, mean ± SE), and total discharge Q ranged between 0.4 and 25.7 mm (9.8±1.7). During the individual storm events, the 4 h peak discharge Q4 h reached values between 0.11 and 12.5 mm. Figure 3 shows that the 24 storm events used for our analysis span a wide range of flow regimes.

Figure 3Flow duration curve of Erlenbach for the combined study periods 15 September to 6 November 2016 and 7 May to 1 November 2017. Blue data points indicate the hourly peak flow rates of 16 storm events analysed in this study, showing that widely varying flow conditions were captured in our data set. For the sake of readability, the remaining eight events are not included in the graph, because they share very similar hourly peak flow rates to those events depicted here.
The various metrics of catchment antecedent wetness conditions were highly correlated with each other. Spearman rank correlation coefficients were ρ > 0.60 (p < 0.002) for all combinations of metrics except for AP3 and GWini (ρ=0.50, p=0.011). Initial soil moisture SMini, initial groundwater levels GWini, and 7-day antecedent precipitation (AP7) correlate strongly (ρ > 0.83 and p < 0.0001 in all cases) with initial discharge (Qini), suggesting that these measures are representative relative indicators of antecedent moisture at the catchment scale.
3.1.1 Both isotopes yield similar hydrograph separation results
Figure 4a shows that δ18O and δ2H yield instantaneous event-water fractions of discharge () at peak flow that do not differ significantly from one another (that is, by more than twice their pooled standard errors). For Qe∕Q we also observe a good agreement between both isotopes, except for the events on 25 June, 25 September, 26 and 29 October 2017, for which the differences are 178 %, 4 %, 2 % and 2 % greater than twice their pooled uncertainties, respectively (Fig. 4b, Table S1 in the Supplement). We thus assume that inferences derived from the two isotopes will be consistent with each other. Measurements of δ2H were less noisy than those of δ18O relative to their respective ranges of variability, so values such as and Qe∕Q will be more precise when derived from δ2H rather than δ18O. Therefore, the following analysis is performed based on δ2H; δ18O would yield similar results but with larger uncertainties.
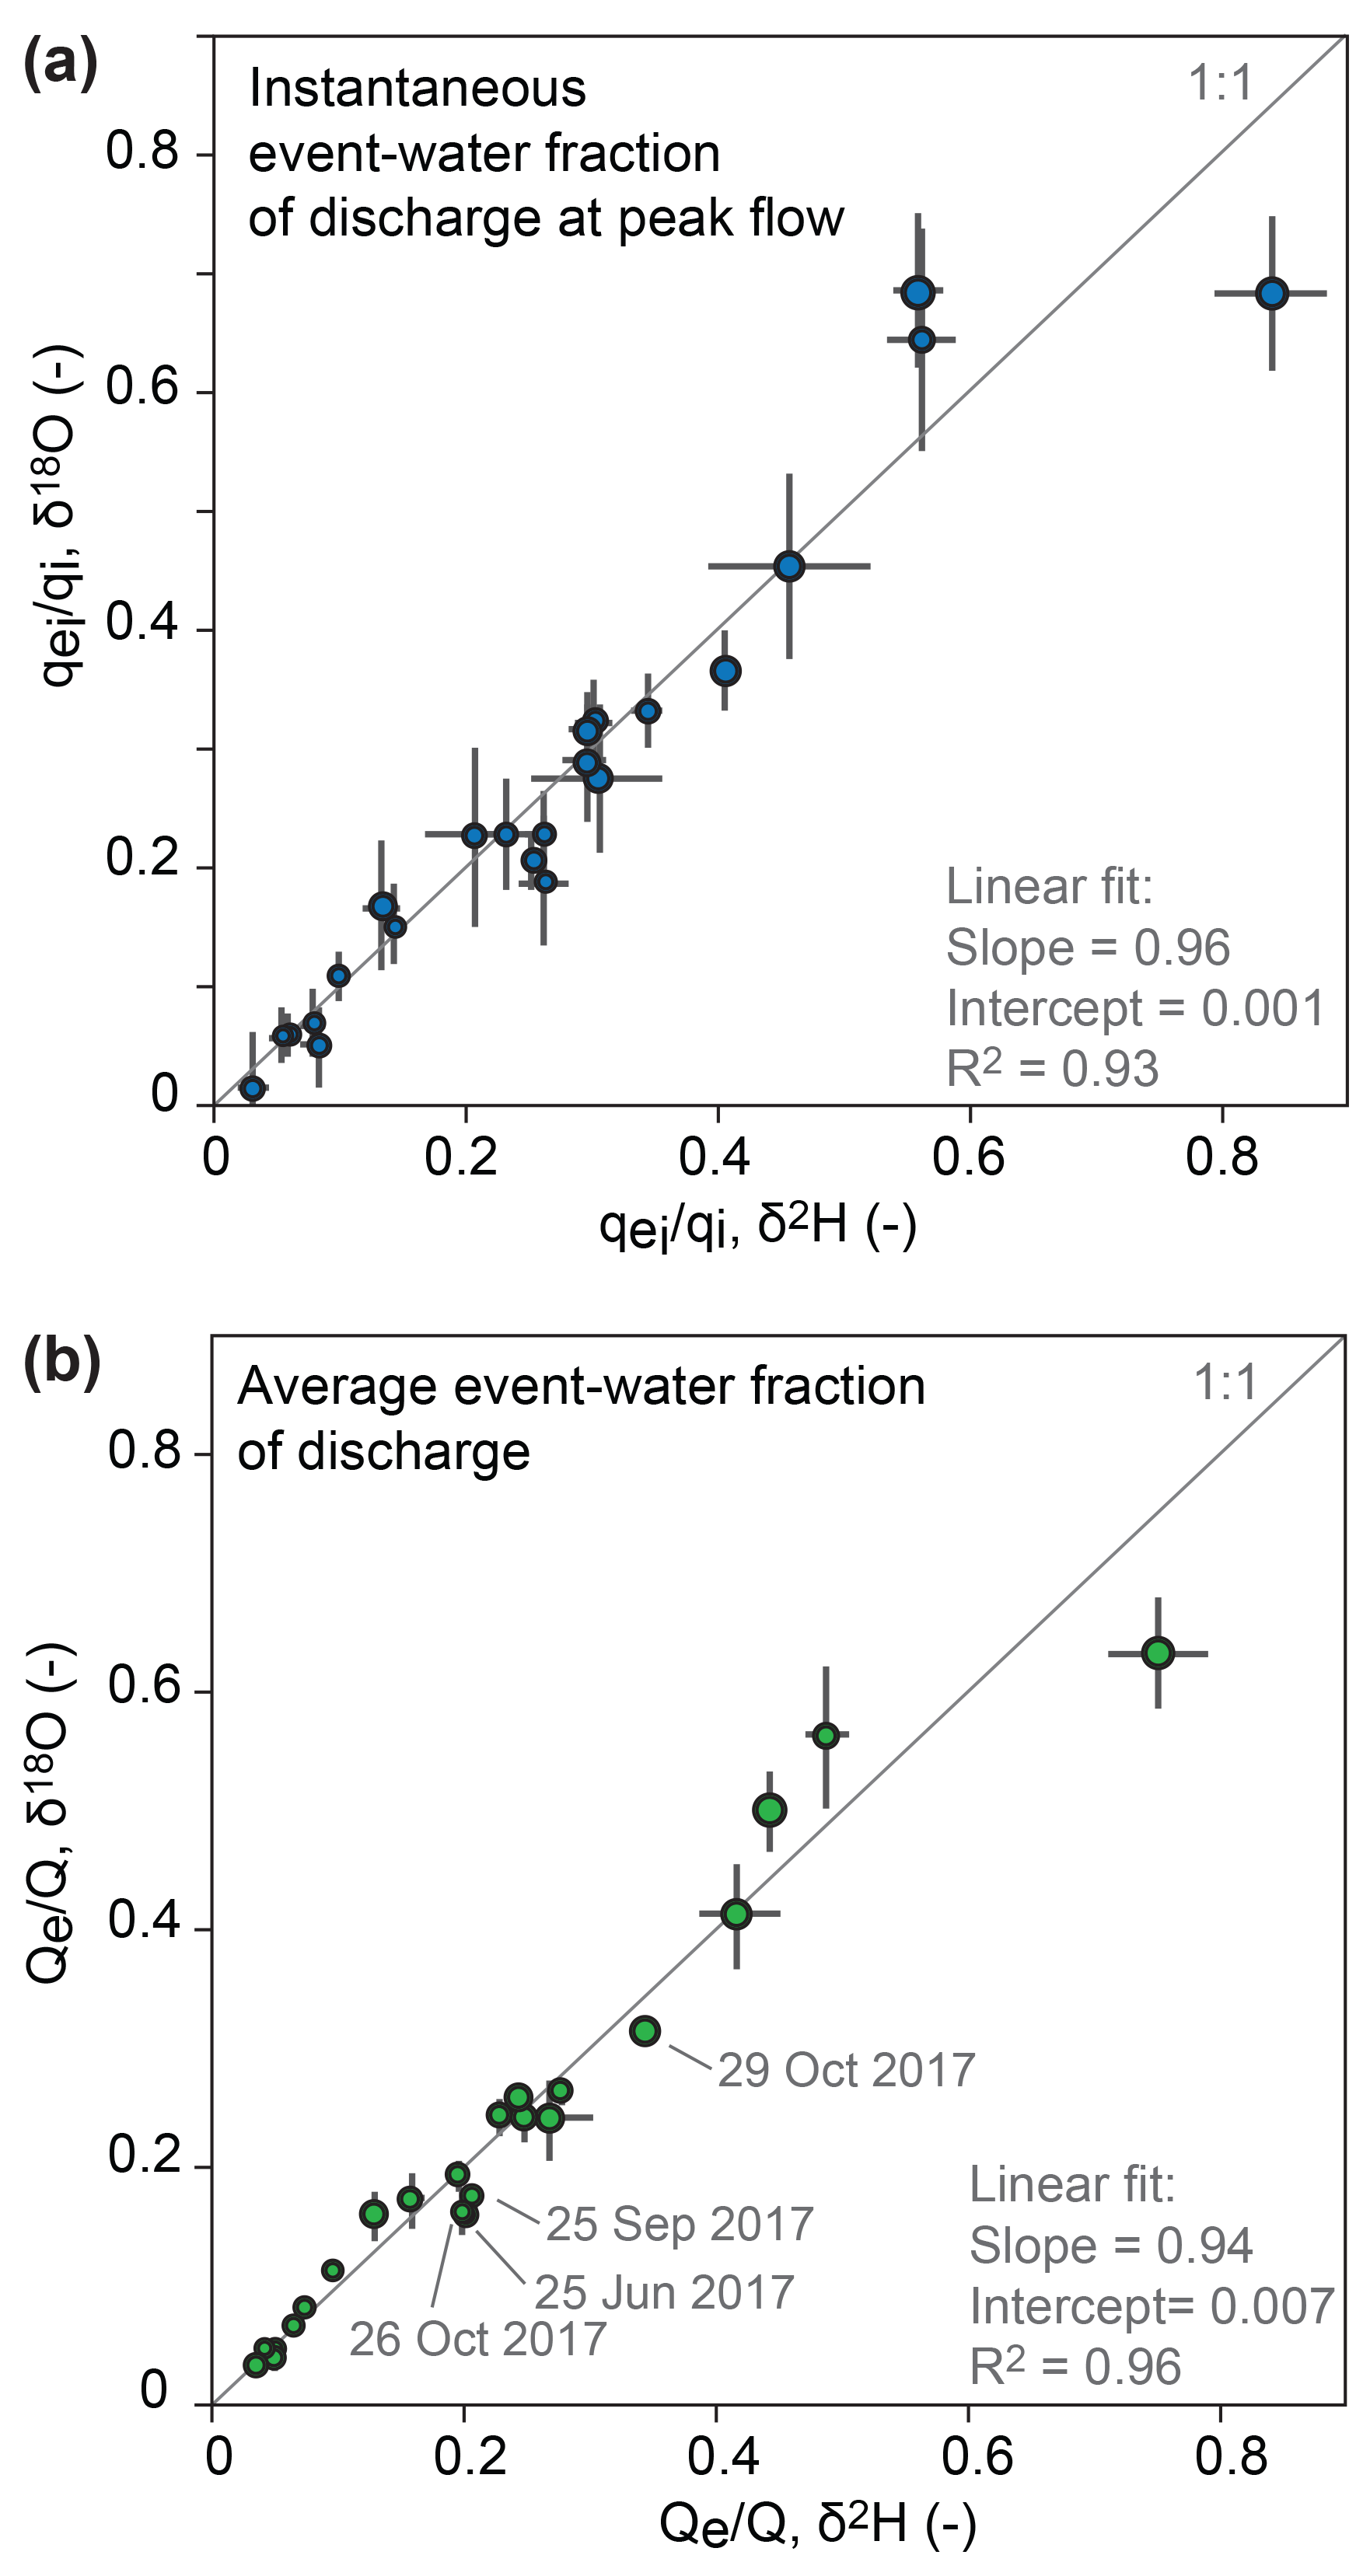
Figure 4(a) Instantaneous event-water fractions of discharge at peak flow () as well as (b) whole-storm event-water fractions of discharge (Qe∕Q) obtained from either δ2H or δ18O. The sizes of the data points reflect the precipitation totals of the storm events, and error bars show ±1 SE. For the 17 September 2017 storm, unrealistic results were obtained for Qe when δ18O was used as a tracer; therefore this data point is excluded from the comparison analysis. Hydrograph separation results for δ18O are provided Table S1.
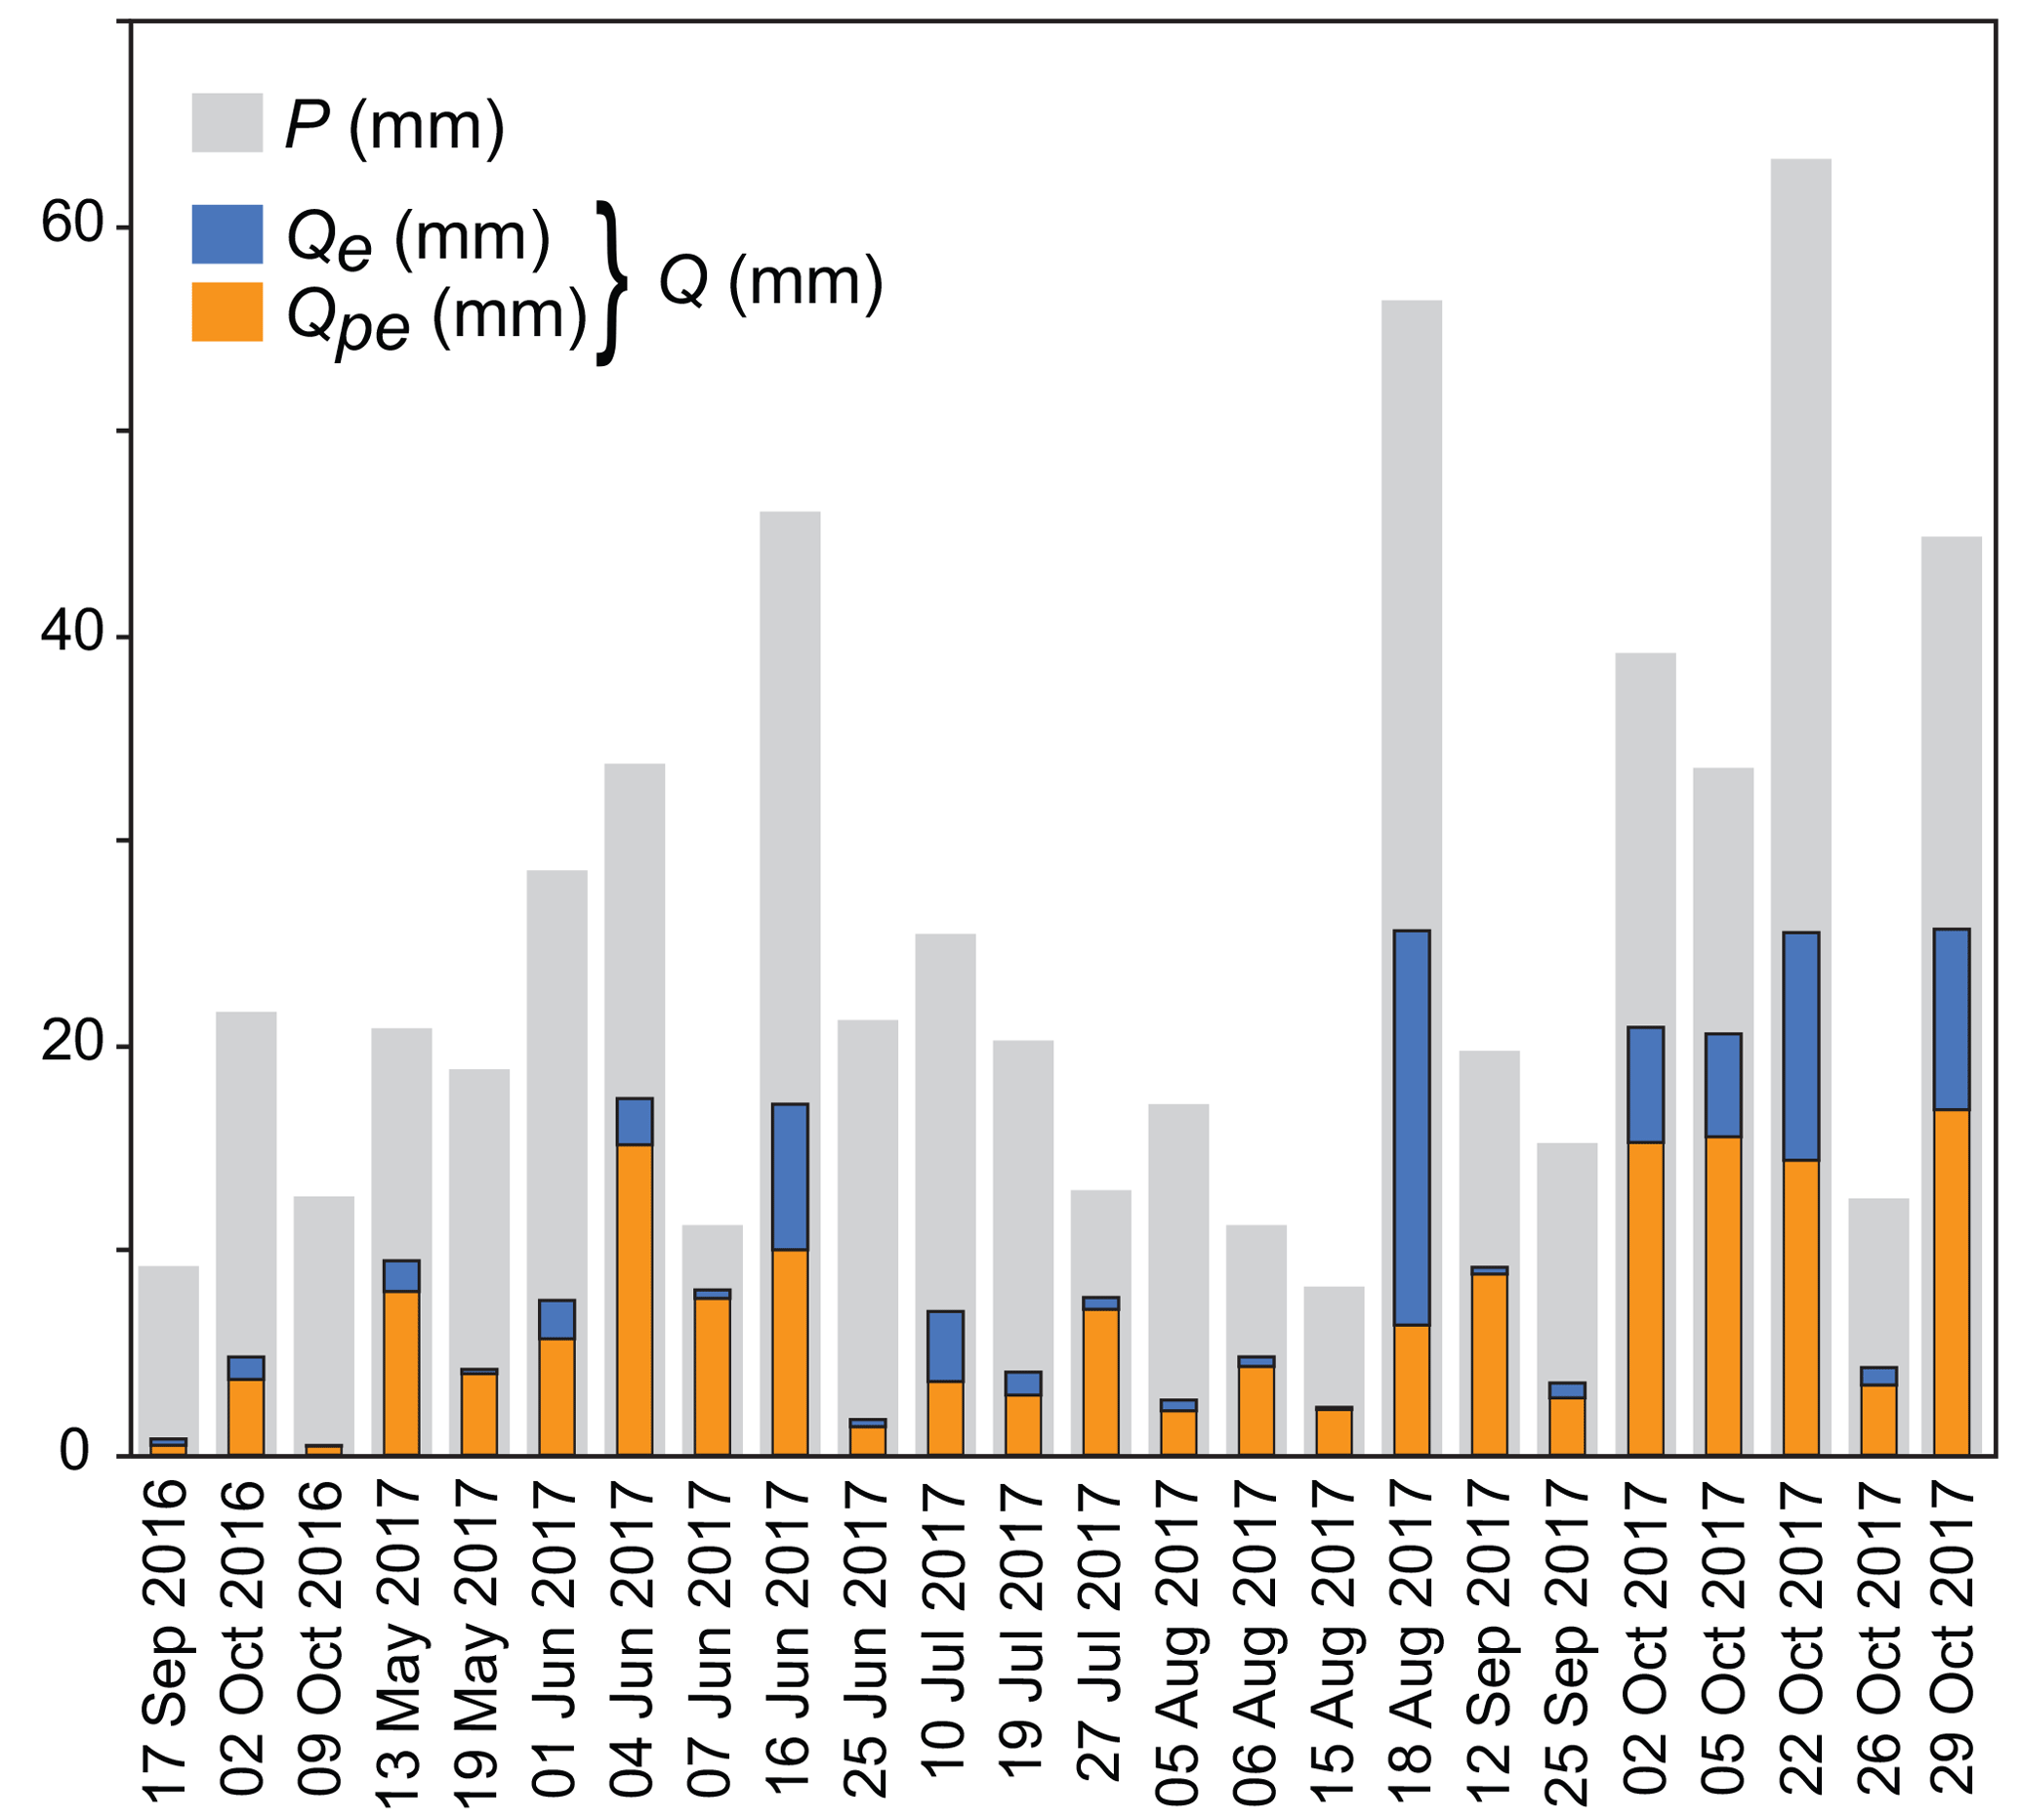
Figure 5Volumes of precipitation (P, grey), compared to event water (Qe, blue) and pre-event water (Qpe, orange) in discharge across 24 storm events. Total discharge (Q) is the sum of event and pre-event water; relative standard errors for Qe were between 1 % and 12 %, and they were between 0.1 % and 13 % for Qpe (Table 2). For most of the storms, pre-event water comprised the major fraction of streamflow. Event water dominated streamflow only during two storms (10 July and 18 August 2017).
Table 2Results of hydrograph separations based on δ2H (results for δ18O are provided in Table S1). Columns are the runoff coefficient (Q∕P), event and pre-event discharge as whole-storm totals (Qe and Qpe), the maximum instantaneous event-water fraction and its value at peak flow, the event-water fractions (Qe∕Q), as well as the event and pre-event runoff coefficients (Qe∕P and Qpe∕P).
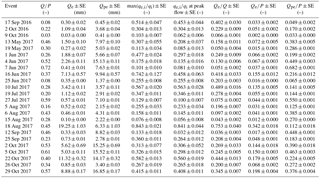
3.1.2 Two-component hydrograph separation results for 24 storm events
Figure 5 and Table 2 compare the storm events' runoff coefficients Q∕P and show that total storm discharge is typically less than half of total storm precipitation and, in some cases, is much less. On average, runoff coefficients are 0.34±0.04 (mean ± SE), but their storm-to-storm variability is large (0.03 to 0.72), suggesting that the effectiveness with which precipitation signals are converted to streamflow responses varies considerably at Erlenbach.
The relative fractions of event water in discharge (Qe∕Q) are highly variable across the 24 storm events, ranging from 0.04 to 0.75, with a mean value of 0.23±0.04. The relative contribution of event water to discharge exceeded 50 % for only two storms (Fig. 5), and on average, discharge at Erlenbach was comprised of roughly 77 % pre-event water. Similarly high pre-event-water fractions relative to discharge have been observed at other humid forested headwater catchments (e.g., Brown et al., 1999; Buttle, 1994; Jones et al., 2006; McGlynn and McDonnell, 2003).
For all 24 storms, the event-water fractions of precipitation Qe∕P are smaller than the corresponding event-water fractions of discharge, for the simple reason that P exceeds Q (Table 2). The values of Qe∕P range from 0.002 to 0.34 (mean ± SE 0.08±0.02), while the pre-event-water volume relative to precipitation (Qpe∕P) ranges from 0.03 to 0.68 (mean ± SE 0.28±0.03). This suggests that, on average, each precipitation event at Erlenbach activated pre-event water equal to roughly a third of the rainfall volume, while the event-water contribution to discharge accounted for less than 10 % of the rainfall volume. Thus, precipitation had a nearly 3-fold larger effect on the activation of pre-event water than on the transmission of event water to the stream.
Relatively few stable isotope studies have analysed numerous events at high temporal resolution (e.g., Birkel et al., 2012; Fischer et al., 2017; Ocampo et al., 2006; von Freyberg et al., 2017), revealing large variations in the relative amounts of event and pre-event water from storm to storm. At Erlenbach, we find that the event-water fraction of discharge Qe∕Q is much more variable, relative to its mean, than the pre-event-water fraction Qpe∕Q (coefficients of variation CV = 0.74 and CV = 0.23, respectively). This follows as a direct consequence of Qe∕Q being smaller, on average, than Qpe∕Q and of these two quantities being complements of one another (), implying that their standard deviations must be equal. Event- and pre-event-water volumes relative to precipitation are more variable across storms, (Qe∕P CV = 0.96 and Qpe∕P CV = 0.61), suggesting that the event- and pre-event runoff coefficients (Qe∕P, Qpe∕P) might be more informative, for instance when used for correlation analyses, compared to the less variable event- and pre-event-water fractions of discharge (Qe∕Q, Qpe∕Q). More fundamentally, Qpe∕Q and Qe∕Q contain completely redundant information, because they sum to 1. By contrast, Qe∕P and Qpe∕P do not sum to a constant (instead they sum to the runoff coefficient), so they each contain distinct information.
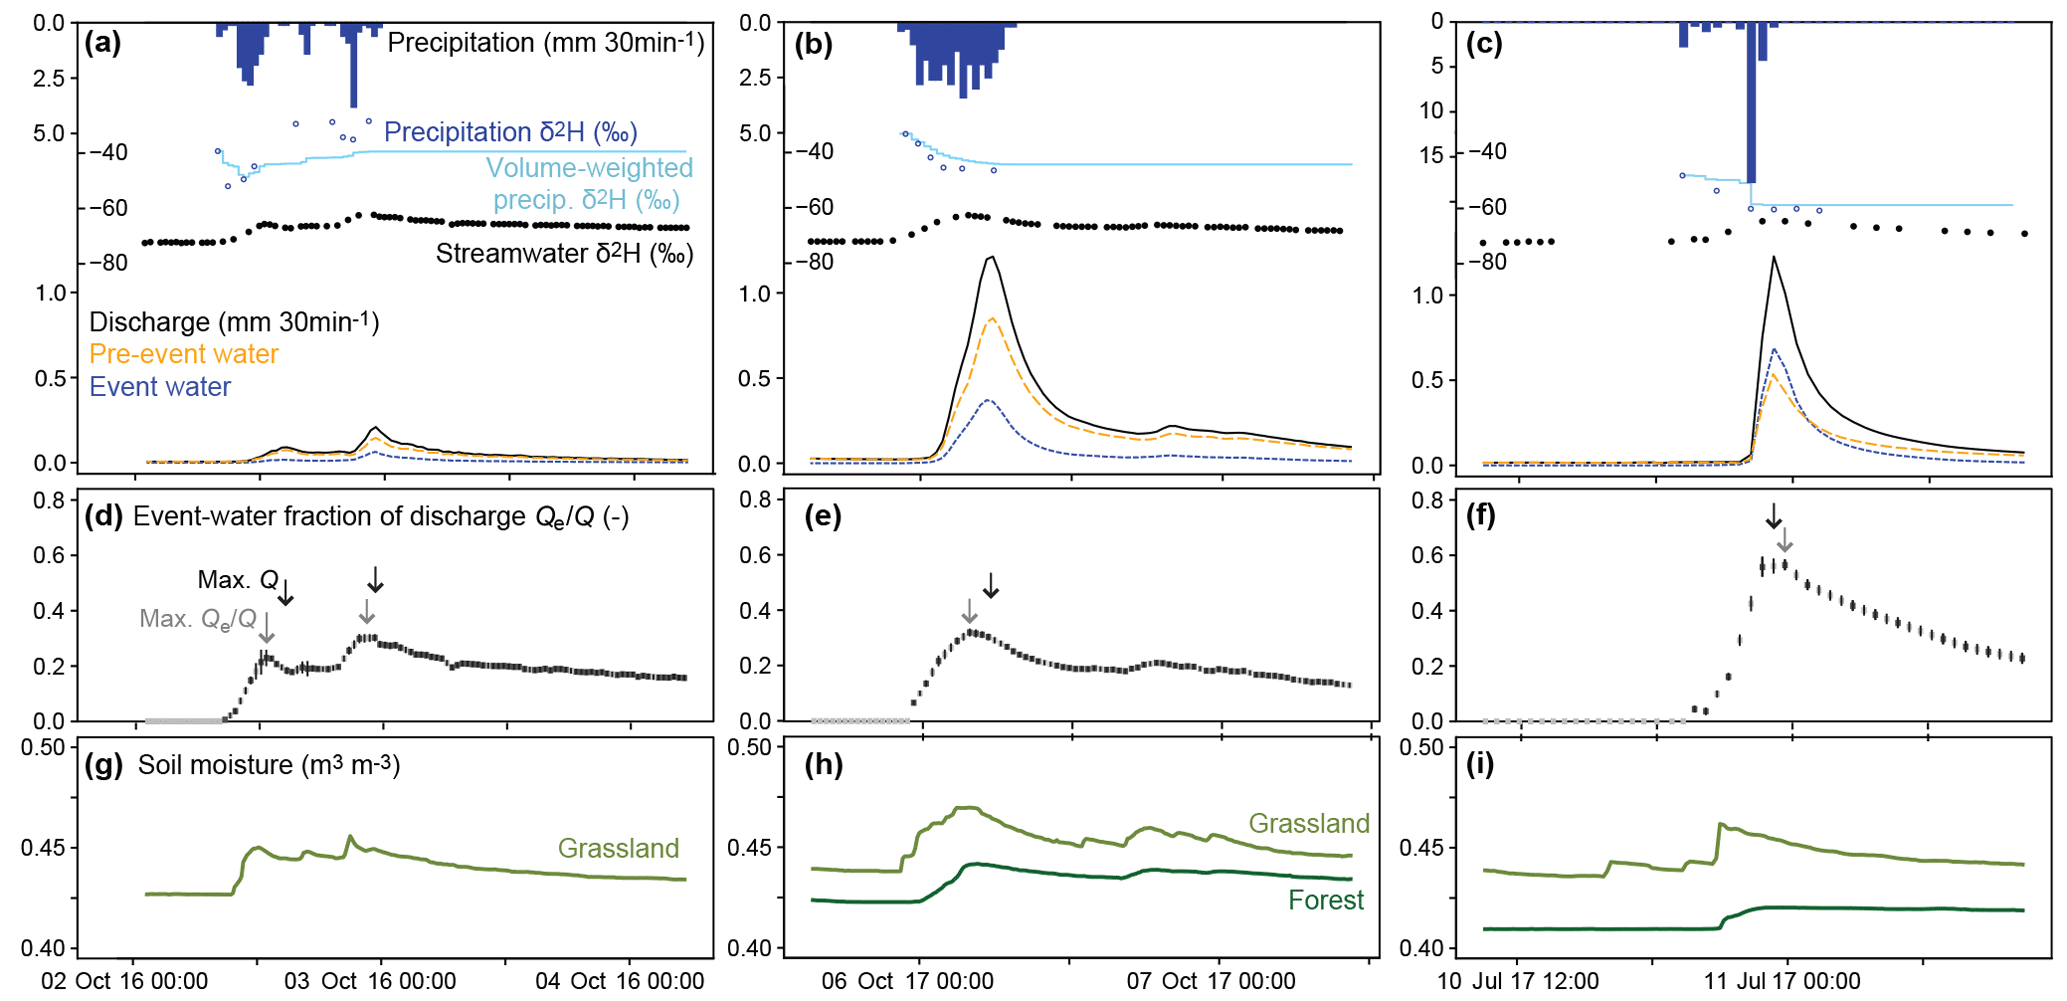
Figure 6Time series of the storm events of 2 October 2016, 5 October and 10 July 2017. (a–c) precipitation hyetographs and deuterium abundance (δ2H) in precipitation (with individual measurements in dark blue and incremental weighted means in light blue), and stream water (black) as well as discharge hydrograph separated into event and pre-event water. (d–f) event-water fraction of discharge; error bars indicate ±1 SE, and open bars indicate linearly interpolated event-water fractions when discharge isotope measurements are missing. (g–i) soil moisture at the grassland site (light green) and forest site (dark green, no data in 2016). Despite great differences in total event rainfall and antecedent wetness conditions between the two storms in the two left columns, their event-water fractions of discharge are very similar. In most cases, peaks in instantaneous event-water fractions precede peak flows (times of peak values indicated by grey and black vertical arrows in panels (a) to (f).
3.1.3 Detailed description of three contrasting events
To investigate the conceptual differences of the ratios Qpe∕Q, Qe∕P and Qpe∕P in more detail, Fig. 6 shows the hydrograph separation results for three storm events, 2 October 2016, 5 October and 10 July 2017, along with the time series of precipitation, discharge, soil moisture, and δ2H values in precipitation and stream water. During the 2 October 2016 storm, antecedent wetness conditions were dry (AP7 = 11 mm), and total precipitation (P) and discharge (Q) were 21.6 and 4.8 mm, respectively, resulting in a runoff coefficient Q∕P of 0.22 (Fig. 6a). During the 5 October 2017 storm, antecedent conditions were wetter (AP7 = 69 mm), and consequently 33.5 mm of rain produced 20.5 mm of discharge, yielding a runoff coefficient of 0.61; roughly 50 % more rain generated roughly 300 % more discharge, relative to the earlier event (Fig. 6b). The response times of streamflow to incoming rainfall, measured here as the time it takes for qi to increase by more than 30 % relative to Qini, were similar for both storm events (2 vs. 2.5 h), as were the changes in soil moisture recorded at the grassland site. The instantaneous event-water fractions of discharge peaked at similar values in the two events (0.30±0.01 and 0.33±0.01, respectively), and the aggregated event-water volumes relative to discharge (Qe∕Q) were likewise similar (0.23±0.01 and 0.24±0.01). Thus, river discharge was predominantly pre-event water during both events, and despite the great differences in total event rainfall and antecedent wetness conditions, both storms resulted in similar event-water fractions of discharge (Table 2). In contrast, the event and pre-event runoff coefficients were roughly 3 times higher in the second storm ( vs. 0.15, and vs. 0.46; Table 2), suggesting that Qe∕P and Qpe∕P might more clearly reflect how catchments respond to variations in antecedent wetness conditions and total event rainfall.
During the 10 July 2017 storm, antecedent conditions were slightly wetter (AP7 = 20.2 mm) than on 2 October 2016, whereas the total rainfall volume and the runoff coefficient were intermediate to those of the two October events (P=25.4 mm, ). However, because the maximum 1 h rainfall intensity during the 10 July 2017 storm was nearly 4 times larger compared to the two October events, peak flow rates during the 10 July 2017 storm were similar to the much larger 5 October 2017 storm (Fig. 6b, c). In contrast to both the 2 October 2016 and 5 October 2017 storms, event water comprised nearly 50 % of discharge during the 10 July 2017 storm. Similarly, the event and pre-event runoff coefficients ( and , respectively) indicate that the 10 July 2017 storm event mobilized equivalent volumes of event and pre-event water. This suggests that infiltration excess during the high-intensity precipitation period enhanced the direct contribution of event water to the stream.
Across all 24 events, there is a general tendency for the instantaneous event-water fraction to peak on the rising limb, ahead of the flow peak (Figs. S1–S4 in the Supplement; for the three storms, 2 October 2016, 5 October 2017 and 10 July 2017, the peak times are indicated by grey and black vertical arrows in Fig. 6a–f). Thus the event-water fraction at the time of peak flow was typically somewhat smaller than the peak event-water fraction. This observation shows the importance of evaluating event-water fractions over the entire hydrograph rather than just at peak flow (von Freyberg et al., 2017). It also suggests that peak flows are primarily generated by mobilizing pre-event water, which dilutes the event water that is more prominent on the rising limb of the hydrograph.
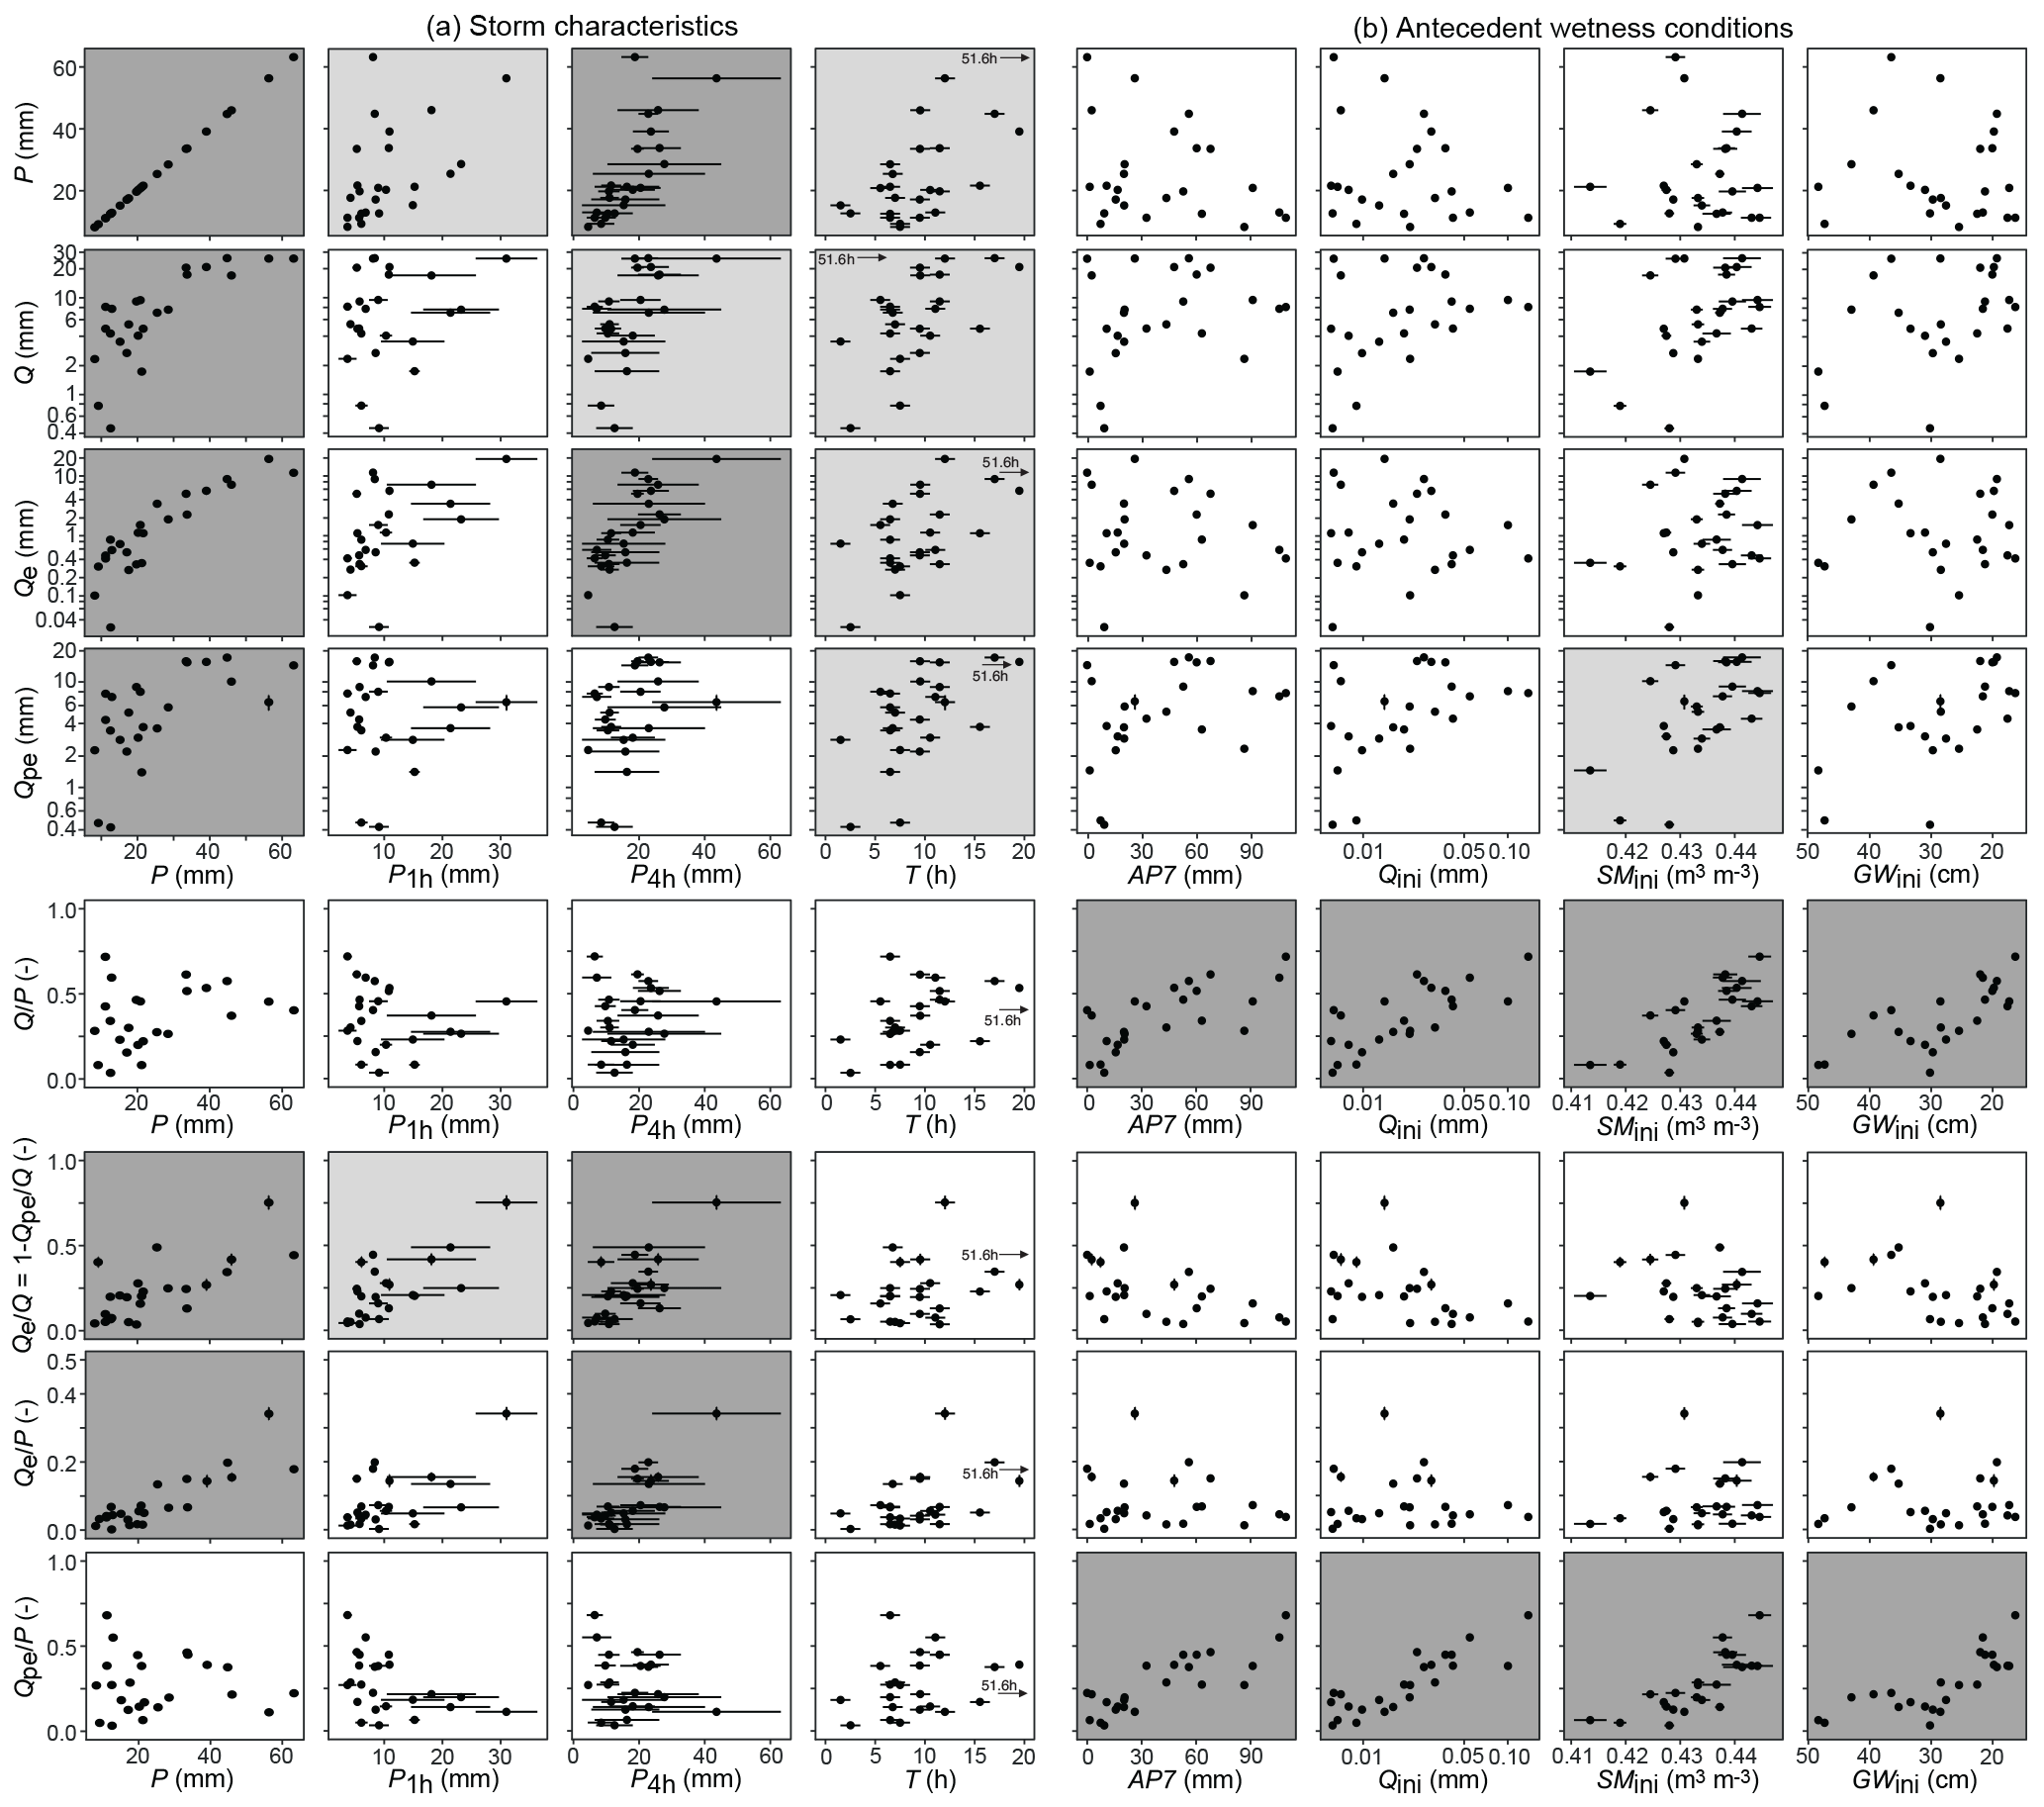
Figure 7Total volumes of storm precipitation, discharge, event and pre-event water (Qe, Qpe), event-water fractions (Qe∕Q; please note that , and thus all relationships for Qpe∕Q, are the inverse of those for Qe∕Q) and event- and pre-event runoff coefficients (Qe∕P, Qpe∕P) of the 24 storm events, plotted against metrics of storm characteristics and catchment antecedent wetness conditions. Measures of storm characteristics (a) are total precipitation, peak 1 h precipitation, peak 4 h precipitation (P, P1 h, P4 h) and total event duration (T). Measures of antecedent wetness (b) are 7-day antecedent precipitation (AP7) and the 1 h average values of discharge (Qini), soil moisture (SMini), and groundwater table depth (GWini) before the onset of the storm event. Panels with light grey backgrounds indicate correlations that are statistically significant at p < 0.01; panels with dark grey backgrounds indicate correlations that are statistically significant at p < 0.0001. Because the rainfall duration (T) of storm 22 October 2017 was 51.6 h, it is off the scale and is thus indicated with vertical arrows.
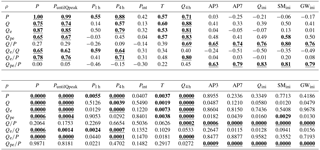
Table 3Spearman rank correlation coefficients (ρ) and p values for measures of storm characteristics, antecedent wetness and catchment storm response. Bolded, underlined values represent statistically significant correlations with p < 0.0001, and bolded values represent statistically significant correlations with p < 0.01. Measures of storm characteristics (left-hand columns in table) are total event precipitation (P), cumulative precipitation before peak flow (PuntilQpeak), mean precipitation intensity (Pint), maximum precipitation over 1 h (P1 h) and 4 h (P4 h), event duration (T), and 4 h peak discharge volume (Q4 h). Measures of initial catchment wetness state (right-hand columns in table) are 3-day and 7-day antecedent precipitation (AP3 and AP7) as well as the 1 h average values of discharge (Qini), groundwater table depth (GWini), and soil moisture (SMini) before the onset of the storm event. Measures of catchment storm response (rows of table) are precipitation (P), discharge (Q), event discharge (Qe) and pre-event discharge (Qpe), all defined as totals over the event and ratios among them. Correlations are not shown for Qpe∕Q, because they are just the negative of the corresponding correlations for Qe∕Q (since ).
3.2 Catchment responses to storm characteristics and antecedent wetness
3.2.1 Runoff coefficients Q∕P depend on antecedent wetness, not storm size
To identify the main controls on the relative contribution of event and pre-event water to catchment outflow, we analyse their correlations with storm characteristics and catchment antecedent wetness conditions (Fig. 7, Table 3). Larger, longer and more intense storms result in larger discharges Q, whereas there is no strong effect of antecedent precipitation (AP3, AP7), antecedent discharge (Qini), antecedent soil moisture (SMini) or antecedent groundwater table depth (GWini) on Q (Table 3). In contrast, although the runoff coefficient Q∕P does not seem to be affected by storm size, it is strongly positively correlated with all metrics of catchment antecedent wetness conditions. This indicates that wetter conditions enhance the efficiency with which precipitation inputs trigger increases in streamflow. Clarifying the mechanisms behind this phenomenon requires not only hydrometric measurements but also tracers that track the water flow paths through the catchment.
3.2.2 Event-water discharge is controlled by storm characteristics, not antecedent wetness
Event-water fractions of discharge and precipitation (Qe∕Q and Qe∕P) at Erlenbach show statistically significant positive correlations with most storm characteristics, i.e., P, PuntilQpeak, P1 h and P4 h (Table 3). These relationships suggest that event-water discharge increases more than proportionally with storm size. Similar results have been reported for Qe∕Q in forested and urban catchments (James and Roulet, 2009; Pellerin et al., 2008; Penna et al., 2015), and it has been hypothesized that more incoming rainfall eventually triggers saturation or infiltration excess, which leads to more surface runoff. Rainfall intensity has also been reported to affect Qe∕Q (Eshleman et al., 1993; Waddington et al., 1993), and at Erlenbach we find strong positive correlations of Qe∕Q and Qe∕P with 1 h and 4 h peak precipitation intensity (P1 h and P4 h). We do not identify a strong relationship with the average rainfall intensity Pint, probably because its definition (total volume divided by total storm duration) makes it strongly dependent on the duration of low-intensity rainfall that contributes little to Qe or Q.
Perhaps surprisingly, the event-water fraction of discharge is lower, not higher, under wetter antecedent conditions; correlations between Qe∕Q and the antecedent wetness metrics range from −0.24 to −0.51, but they are not statistically significant (p > 0.01; Table 3). Indeed, even the volume of event water Qe by itself (not as a fraction of total Q) does not become systematically larger under wetter conditions; the correlations between Qe and the antecedent wetness metrics range from 0.01 to 0.13 (Table 3). Thus, wetter antecedent conditions do not lead to systematically higher event-water discharges in either absolute or relative terms. The negative correlation between antecedent wetness and Qe∕Q arises for the simple reason that wetter antecedent conditions increase total discharge (primarily by mobilizing more pre-event water), while Qe remains largely unchanged.
3.2.3 Pre-event contributions relative to discharge correlate weakly with antecedent wetness
Because the pre-event-water fraction of discharge (Qpe∕Q) is defined as the complement to the event-water fraction (), its correlations with storm properties and antecedent wetness will be the opposite to those of Qe∕Q. At Erlenbach, Qe∕Q is weakly negatively correlated (and thus Qpe∕Q is weakly positively correlated) with our metrics of antecedent wetness. The positive correlation between antecedent wetness and Qpe∕Q suggests that a greater volume of pre-event water is available under wet conditions. However, the relationships between Qpe∕Q or Qe∕Q and antecedent wetness are highly scattered, consistent with other studies (Fischer et al., 2017; James and Roulet, 2009; Ocampo et al., 2006). Thus, these relationships are not much help in explaining why runoff coefficients at Erlenbach are strongly correlated with antecedent wetness and not with storm size and intensity.
3.2.4 Ratio of pre-event water to precipitation correlates strongly with antecedent wetness
In contrast to the event- and pre-event-water fractions of discharge (Qe∕Q, Qpe∕Q), the event runoff coefficient (Qe∕P) correlates strongly with metrics of storm characteristics (but not antecedent wetness), and the pre-event runoff coefficient (Qpe∕P) correlates strongly with the metrics of antecedent wetness conditions (but not storm characteristics; Fig. 7, Table 3). We find positive relationships between Qe∕P and most metrics of storm characteristics, such as P, and P4 h, similar to the relationships found for Qe∕Q. We also find that Qpe∕P, but not Qe∕P, is strongly (positively) correlated with all of our metrics of antecedent wetness conditions (Qini, GWini, SMini, AP3 and AP7). The correlations between Qpe∕P and storm characteristics are much weaker, suggesting that the activation of pre-event water by precipitation is primarily controlled by pre-storm wetness conditions and not by storm size.
The runoff coefficient's sensitivity to antecedent wetness, and its insensitivity to storm characteristics, can be understood through the behaviour of Qe∕P and Qpe∕P, which sum to the runoff coefficient itself: . Because Qpe∕P is larger and more variable than Qe∕P (with one exception, all values of Qe∕P are less than 0.2, whereas Qpe∕P spans a range roughly 3 times as large), variations in the runoff coefficient Q∕P will be dominated by variations in Qpe∕P. Thus, because Qpe∕P is sensitive to antecedent wetness, so is the runoff coefficient. For example, 7-day antecedent wetness AP7 is much more strongly correlated with Qpe∕P (ρ=0.79) than with Qe∕P (ρ=0.03), and because the variability of Qpe∕P is much greater than that of Qe∕P, it dominates the correlation between AP7 and the runoff coefficient Q∕P (ρ=0.74; Table 3). The same line of argument explains why the runoff coefficient is relatively insensitive to storm size and intensity. For example, the correlation between 4 h storm intensity P4 h and Qe∕P is 0.71, but the correlation with Qpe∕P is −0.15, and because the range of variation in Qpe∕P is roughly 3 times larger, the resulting correlation between P4 h and the runoff coefficient Q∕P is only 0.09.
Storm characteristics and antecedent wetness generally exhibit stronger correlations with Qe∕P and Qpe∕P than with Qe∕Q and Qpe∕Q (Fig. 7, Table 3). For this reason, and because they are both components of the runoff coefficient itself, Qe∕P and Qpe∕P are more informative than Qe∕Q or Qpe∕Q in explaining how the runoff coefficient is controlled by event properties. One reason for the weaker correlations between storm characteristics and Qe∕Q or Qpe∕Q is that larger and more intense storms increase not only Qe and Qpe but also Q; thus the ratios Qe∕Q and Qpe∕Q will change less than one might expect from the effects on Qe and Qpe themselves. This points to an important limitation when using Qe∕Q or Qpe∕Q as descriptors of catchment response during storm events and might explain why the relationships between Qe∕Q or Qpe∕Q and metrics of event properties often do not yield clear inferences about controlling factors for streamflow generation under different boundary conditions.
Our results provide important context for previous studies that have used the ratio between graphically estimated quick flow and precipitation as a proxy for how efficiently precipitation is translated into streamflow (e.g., Detty and McGuire, 2010; James and Roulet, 2007; Merz et al., 2006; Norbiato et al., 2009; Penna et al., 2011; Taylor and Pearce, 1982; Sidle et al., 1995). Many of these studies have shown that the ratio between quick flow and precipitation increases with antecedent wetness, suggesting that wetter conditions lead to the activation of rapid flow pathways, as groundwater levels rise to shallower, more permeable layers, or as hydrologic connectivity increases due to expansion of the river network and connection of wetlands and hillslopes to the stream (e.g., Dunne and Black, 1970; Godsey and Kirchner, 2014; McGuire and McDonnell, 2010). It should be stressed, however, that separating the hydrograph into base flow and quick flow with graphical or digital filter methods is a highly subjective process (Blume et al., 2007) that cannot resolve whether quick flow is primarily event water or pre-event water. Simply put, wetter conditions lead to more quick flow, but is this because more rainfall reaches the stream, or because more pre-event water is mobilized from catchment storage? Our results show that even at the highly dynamic Erlenbach catchment, antecedent wetness correlates with Qpe∕P but not Qe∕P; that is, wetter conditions lead primarily to more efficient mobilization of pre-event water, rather than to more efficient transmission of rainfall to the stream.
3.3 Controls on the event and pre-event water at Erlenbach
Previous research in the Erlenbach catchment has identified two possible sources of base flow: springs in the uppermost part of the catchment and groundwater outflow from a shallow aquifer on top of the low-permeability bedrock (van Meerveld et al., 2018). However, conceptual models of streamflow generation at Erlenbach have not considered antecedent wetness conditions as a major control on the discharge of pre-event water, possibly because tracer-based estimates of Qpe∕Q did not correlate with various metrics of antecedent wetness (Fischer et al., 2017 and results presented here). By contrast, when Qpe∕P is considered instead of Qpe∕Q, our data clearly show that high antecedent wetness triggers the mobilization of pre-event water. Because pre-event water comprises a large fraction of catchment outflow, even during events, antecedent wetness conditions are thus an important control on the streamflow regime at Erlenbach (along with storm size and intensity).
The several-fold increase of Qpe∕P with antecedent wetness implies that pre-event water is more efficiently mobilized under wetter conditions. The rapid activation of this stored pre-event water at Erlenbach (even during small storms) can be explained with generally shallow perched groundwater tables in the aquifer overlying the low-permeability bedrock. In a neighbouring catchment, groundwater tables are usually less than 0.4 m below the ground surface in low-permeability soils on plateaus and at the bottoms of the hillslopes, and they are not much deeper in the more permeable hillslope soils (Rinderer et al., 2014; Schleppi et al., 1998). Earlier studies at the Erlenbach and neighbouring catchments showed that the low-permeability soils on the plateaus saturate first during events, and as a consequence, a mixture of event and pre-event water flows off as shallow subsurface storm flow and surface runoff (Rinderer et al., 2016; van Meerveld et al., 2018).
Our isotope-based, two-component hydrograph separation results show that the relative contribution of event water to discharge plays only a minor role in the streamflow regime of the Erlenbach, despite the runoff coefficients Q∕P being > 0.4 for more than half of all storm events. Only for two storms with dry antecedent conditions and high-intensity rainfall did the event-water fraction of discharge Qe∕Q exceed 0.5. While wetter antecedent conditions clearly facilitated the mobilization of more pre-event water, they did not significantly enhance bypass flow of event water via surface runoff on saturated areas.
3.3.1 Source areas of event water
Several studies have used the ratio Qe∕P as a proxy for the relative catchment area that generates event water (e.g., Buttle and Peters, 1997; Ocampo et al., 2006) or have shown that Qe∕P predicts the mapped extent of saturated or impermeable areas (e.g., Eshleman et al., 1993; Rodhe, 1987; Pellerin et al., 2008). Direct runoff of event rainfall can occur on impermeable and low-permeability surfaces, on saturated areas, and through preferential flow pathways (Beven and Germann, 1982; Dunne and Black, 1970). At Erlenbach, the channel network itself and an asphalt road account for roughly 1.2 % of the total catchment area; this is a plausible lower bound for the area that can generate surface runoff. In addition, surface runoff may also occur on the saturated low-permeability soils of the plateaus as well as in locations where the water table is close to the surface (depressions, bottoms of hillslopes and river banks; Rinderer et al., 2014). Mapped wet meadows occur on approximately 22 % of the catchment area, and geostatistical analyses suggest that around 30 % of the total catchment area is prone to saturation (FOEN, 2011; Fig. 1a); 30 % is thus a plausible upper bound for the area that can generate surface runoff. The range between these upper and lower bounds is spanned across the 24 storms that we analysed, whose Qe∕P varied between 0.002 and 0.34 (mean ± SE 0.08±0.02). This suggests that the variability of Qe∕P across storms may reflect the contraction and expansion of these source areas and changes in their hydrological connectivity to the channel network.
3.3.2 Precipitation primarily mobilizes pre-event water instead of running off to the stream
For most of the analysed storms, event water is a much smaller contributor to streamflow than pre-event water. This observation makes sense if we assume that most precipitation lands directly on the more permeable hillslope soils (which constitute most of the catchment) or reaches these soils by flowing down gradient from low-permeability or saturated areas on the plateaus located above these hillslopes (Rinderer et al., 2014). Water infiltrating into the hillslope soils presumably raises the groundwater table into more permeable soil layers, facilitating the rapid downslope transport of groundwater and resulting in a mixture of event and pre-event water in the stream. However, during particularly large storms, such as those on 10 July and 18 August 2017, it is likely that event-water generating areas hydrologically connect to the channel network, and event water becomes a much larger fraction of the streamflow hydrograph.
3.3.3 Sources of pre-event water and link to antecedent wetness
Temporal and spatial variations in subsurface hydrological connectivity have been studied in a 20 ha catchment adjacent to Erlenbach, using a dense network of groundwater observation wells (Rinderer et al., 2018). That study showed that catchment areas with a subsurface hydrological connection to the channel network expand and contract during storm events. It seems likely that similar processes occur at Erlenbach, as it shares similar landscape properties with Rinderer et al.'s (2018) study site. Following this line of thought, one can speculatively infer that the infiltration of precipitation into the hillslopes and the mobilization of hillslope pre-event water significantly increase subsurface hydrologic connectivity. The amount of hillslope pre-event water that is mobilized will therefore largely depend on the pre-storm storage deficit in the hillslopes and not so much on the pre-storm storage deficit in the event-water source areas (where the storage deficit is always small). This would explain our observation that direct runoff of event water to the stream is mainly controlled by storm characteristics (and not by antecedent wetness), whereas the mobilization of pre-event water is strongly controlled by antecedent wetness (and much less by storm characteristics). However, no spatially distributed measurements of groundwater table dynamics are available to further investigate this hypothesis at Erlenbach.
3.4 Fingerprints of catchment response
Our analysis, spanning 24 storm events with contrasting characteristics, reveals at least four patterns of behaviour that could potentially be useful as “fingerprints” of catchment response if they are found to also hold in other catchments. First, the runoff coefficient Q∕P is a roughly linear function of the logarithm of antecedent discharge Qini (Fig. 7). If similar linear relationships are also observed elsewhere, their slopes (which are dimensionless) could be used as indices of catchment response for catchment comparison purposes. Second, the event-water runoff coefficient Qe∕P is a roughly linear function of P itself (Fig. 7), and its slope can be considered as an index of how storm size alters the fraction of the catchment area that is connected to the stream by fast flow paths. One could even consider the hypothetical point where this linear relationship crosses the line (which would not be reached in practice) as an indicator of how much precipitation would be required to establish fast flow paths connecting the entire catchment to the stream. Third, the pre-event runoff coefficient Qpe∕P is a roughly linear function of antecedent precipitation AP7. Under the assumption that AP7 is a reliable surrogate for catchment antecedent wetness, the slope of the AP7–Qpe∕P relationship could be considered as an index of how antecedent wetness alters the fraction of the catchment in which stored, pre-event water can be efficiently mobilized during events. Fourth, the pre-event runoff coefficient Qpe∕P is a roughly linear function of the logarithm of antecedent discharge Qini (Fig. 7). The slope of this relationship, which is dimensionless, contains information on how antecedent discharge reflects antecedent wetness and how antecedent wetness determines the mobility of pre-event water. We emphasize that these fingerprints of catchment behaviour are necessarily speculative, unless and until they are confirmed by cross-catchment comparisons. We also note that these four ratios are logically constrained to be ≤1, and thus they must become asymptotic at some point.
Tracer-based estimates of event-water and pre-event-water fractions of discharge () are often compared to catchment properties, storm characteristics and antecedent wetness conditions to identify controls on streamflow generation mechanisms. However, these relationships may be obscured, because the same factors that influence event discharge Qe and pre-event discharge Qpe also necessarily influence total discharge Q as well. We thus propose that the fractions of event water and pre-event water relative to precipitation (Qe∕P and Qpe∕P) provide an alternative and more insightful approach to study catchment storm responses. Here, we use 30 min stable water isotope data, collected over a period of roughly 8 months at the pre-Alpine Erlenbach catchment, to obtain robust estimates of Qe and Qpe. In total, we analysed 24 rainfall events spanning a wide range of hydro-climatic conditions. Our findings are summarized below:
-
Pre-event water dominates the streamflow hydrograph for the majority of the storms. The event-water fraction Qe∕Q correlates strongly (positively) with storm size and intensity but weakly with antecedent wetness conditions. Because Q is the sum of Qe and Qpe, Q itself is affected by storm size and antecedent wetness conditions in similar ways as Qe and Qpe, hampering the use of Qe∕Q and Qpe∕Q to identify major controls on streamflow generation.
-
By relating event-water and pre-event-water volumes to event precipitation P instead (i.e., ), we find that the event-water fraction of precipitation (Qe∕P) correlates strongly with metrics of storm characteristics (but not antecedent wetness), and the ratio of pre-event water to precipitation (Qpe∕P) correlates strongly with metrics of antecedent wetness (but not storm characteristics). Thus, Qe∕P and Qpe∕P more clearly reflect the influence of major controls on streamflow generation compared to Qe∕Q (or Qpe∕Q).
-
Although numerous studies have used runoff coefficients or tracer-based event-water fractions Qe∕Q to study catchment hydrological behaviour during storm events (e.g., Klaus and McDonnell, 2013), the additional information provided by Qe∕P and Qpe∕P has yet not been exploited. Together, Qe∕P and Qpe∕P separate the runoff coefficient Q∕P into its contributions from event water and pre-event water, providing a straightforward way to quantify both of these components of streamflow response.
-
At Erlenbach, Q∕P, Qe∕P and Qpe∕P exhibit roughly linear relationships with several measures of storm size and antecedent wetness, suggesting that these relationships, particularly their slopes, may be diagnostic fingerprints that may be useful for characterizing hydrologic response across diverse catchments.
-
Looking toward the future, we anticipate that hydrograph separation studies will increasingly seek to quantify many different sources of streamflow, beyond the traditional separation of the two components Qe and Qpe. We note that if other components can be identified (e.g., streamflow originating from throughfall, soil water, deep bedrock water, etc.), studying their volumes relative to precipitation, rather than discharge, may shed important light on how they are mobilized during storm events.
The isotope data are available from Jana von Freyberg upon request.
The supplement related to this article is available online at: https://doi.org/10.5194/hess-22-5847-2018-supplement.
JF and BS collected the data set. JF analysed the data set. JF prepared the paper with contributions from JK and MR.
The authors declare that they have no conflict of interest.
We thank Leonie Kiewiet for providing information of groundwater table variations
in a catchment neighbouring our study site. The comments of Daniele Penna and
two anonymous reviewers helped to improve the paper.
Edited by: Mariano Moreno de las Heras
Reviewed by: Daniele Penna and two anonymous referees
Barthold, F. K., Turner, B. L., Elsenbeer, H., and Zimmermann, A.: A hydrochemical approach to quantify the role of return flow in a surface flow-dominated catchment, Hydrol. Process., 31, 1018–1033, https://doi.org/10.1002/hyp.11083, 2017.
Beven, K. and Germann, P.: Macropores and water flow in soils, Water Resour. Res., 18, 1311–1325, https://doi.org/10.1029/WR018i005p01311, 1982.
Bevington, P. R. and Robinson, D. K.: Data reduction and error analysis for the physical sciences, 3rd Edn., McGraw-Hill, Boston, 320 pp., 2003.
Birkel, C., Soulsby, C., Tetzlaff, D., Dunn, S., and Spezia, L.: High-frequency storm event isotope sampling reveals time-variant transit time distributions and influence of diurnal cycles, Hydrol. Process., 26, 308–316, https://doi.org/10.1002/hyp.8210, 2012.
Blume, T., Zehe, E., and Bronstert, A.: Rainfall-runoff response, event-based runoff coefficients and hydrograph separation, Hydrolog. Sci. J., 52, 843–862, https://doi.org/10.1623/hysj.52.5.843, 2007.
Brown, V. A., McDonnell, J. J., Burns, D. A., and Kendall, C.: The role of event water, a rapid shallow flow component, and catchment size in summer stormflow, J. Hydrol., 217, 171–190, 1999.
Buttle, J. M.: Isotope hydrograph separations and rapid delivery of pre-event water from drainage basins, Prog. Phys. Geog., 18, 16–41, https://doi.org/10.1177/030913339401800102, 1994.
Buttle, J. M. and Peters, D. L.: Inferring hydrological processes in a temperate basin using isotopic and geochemical hydrograph separation: A re-evaluation, Hydrol. Process., 11, 557–573, https://doi.org/10.1002/(SICI)1099-1085(199705)11:6<557::AID-HYP477>3.0.CO;2-Y, 1997.
Casper, M. C., Volkmann, H. N., Waldenmeyer, G., and Plate, E. J.: The separation of flow pathways in a sandstone catchment of the Northern Black Forest using DOC and a nested Approach, Phys. Chem. Earth, 28, 269–275, 2003.
Detty, J. M. and McGuire, K. J.: Threshold changes in storm runoff generation at a till-mantled headwater catchment, Water Resour. Res., 46, W07525, https://doi.org/10.1029/2009wr008102, 2010.
Dunne, T. and Black, R. D.: Partial Area Contributions to Storm Runoff in a Small New-England Watershed, Water Resour. Res., 6, 1296–1311, https://doi.org/10.1029/Wr006i005p01296, 1970.
Eshleman, K. N., Pollard, J. S., and Obrien, A. K.: Determination of Contributing Areas for Saturation Overland-Flow from Chemical Hydrograph Separations, Water Resour. Res., 29, 3577–3587, https://doi.org/10.1029/93WR01811, 1993.
Fischer, B. M. C., Rinderer, M., Schneider, P., Ewen, T., and Seibert, J.: Contributing sources to baseflow in pre-alpine headwaters using spatial snapshot sampling, Hydrol. Process., 29, 5321–5336, https://doi.org/10.1002/hyp.10529, 2015.
Fischer, B. M. C., Stähli, M., and Seibert, J.: Pre-event water contributions to runoff events of different magnitude in pre-alpine headwaters, Hydrol. Res., 48, 28–47, https://doi.org/10.2166/nh.2016.176, 2017.
FOEN: National Ecological Network (REN), Swiss Federal Office for the Environment (FOEN), Berne, Switzerland, 2011.
Genereux, D.: Quantifying uncertainty in tracer-based hydrograph separations, Water Resour. Res., 34, 915–919, 1998.
Godsey, S. E. and Kirchner, J. W.: Dynamic, discontinuous stream networks: Hydrologically driven variations in active drainage density, flowing channels and stream order, Hydrol. Process., 28, 5791–5803, https://doi.org/10.1002/hyp.10310, 2014.
Hall, F. R.: Base-Flow Recessions – a Review, Water Resour. Res., 4, 973–983, https://doi.org/10.1029/Wr004i005p00973, 1968.
Hantke, R.: Die neue geologische Karte des Kantons Zürich und seiner Nachbargebiete, in: Vierteljahrsschrift der Naturforschenden Gesellschaft in Zürich, Vol. 88, Zurich, Switzerland, 618–620, 1967.
Hegg, C., McArdell, B. W., and Badoux, A.: One hundred years of mountain hydrology in Switzerland by the WSL, Hydrol. Process., 20, 371–376, https://doi.org/10.1002/hyp.6055, 2006.
Hewlett, J. D. and Hibbert, A. R.: Factors affecting the response of small watersheds to precipitation in humid areas, in: Proceedings of the International Symposium on Forest Hydrology, edited by: Sopper, W. E. and Lull, H. W., Pergamon Press, New York, 275–290, 1967.
Horton, R. E.: The role of infiltration in the hydrologic cycle, Eos T. Am. Geophys. Un., 14, 446–460, 1933.
Hrachowitz, M., Benettin, P., van Breukelen, B. M., Fovet, O., Howden, N. J. K., Ruiz, L., van der Velde, Y., and Wade, A. J.: Transit timesthe link between hydrology and water quality at the catchment scale, Wiley Interdisciplinary Reviews-Water, 3, 629–657, https://doi.org/10.1002/wat2.1155, 2016.
Hsü , K. J. and Briegel, U.: The Flysch, in: Geology of Switzerland SE – 6, Birkhäuser, Basel, 65–82, 1991.
James, A. L. and Roulet, N. T.: Investigating hydrologic connectivity and its association with threshold change in runoff response in a temperate forested watershed, Hydrol. Process., 21, 3391–3408, https://doi.org/10.1002/hyp.6554, 2007.
James, A. L. and Roulet, N. T.: Antecedent moisture conditions and catchment morphology as controls on spatial patterns of runoff generation in small forest catchments, J. Hydrol., 377, 351–366, https://doi.org/10.1016/j.jhydrol.2009.08.039, 2009.
Jones, J. P., Sudicky, E. A., Brookfield, A. E., and Park, Y.-J.: An assessment of the tracer-based approach to quantifying groundwater contributions to streamflow, Water Resour. Res., 42, W02407, https://doi.org/10.1029/2005WR004130, 2006.
Jordan, J. P.: Spatial and temporal variability of stormflow generation processes on a Swiss catchment, J. Hydrol., 153, 357–382, https://doi.org/10.1016/0022-1694(94)90199-6, 1994.
Klaus, J. and McDonnell, J. J.: Hydrograph separation using stable isotopes: Review and evaluation, J. Hydrol., 505, 47–64, https://doi.org/10.1016/j.jhydrol.2013.09.006, 2013.
Laudon, H., Sjöblom, V., Buffam, I., Seibert, J., and Mörth, M.: The role of catchment scale and landscape characteristics for runoff generation of boreal streams, J. Hydrol., 344, 198–209, https://doi.org/10.1016/j.jhydrol.2007.07.010, 2007.
Litt, G. F., Gardner, C. B., Ogden, F. L., and Lyons, W. B.: Hydrologic tracers and thresholds: A comparison of geochemical techniques for event-based stream hydrograph separation and flowpath interpretation across multiple land covers in the Panama Canal Watershed, Appl. Geochem., 63, 507–518, https://doi.org/10.1016/j.apgeochem.2015.04.003, 2015.
McDonnell, J. J. and Beven, K.: Debates – The future of hydrological sciences: A (common) path forward? A call to action aimed at understanding velocities, celerities and residence time distributions of the headwater hydrograph, Water Resour. Res., 50, 5342–5350, https://doi.org/10.1002/2013WR015141, 2014.
McDonnell, J. J., Bonell, M., Stewart, M. K., and Pearce, A. J.: Deuterium Variations in Storm Rainfall – Implications for Stream Hydrograph Separation, Water Resour. Res., 26, 455–458, https://doi.org/10.1029/WR026i003p00455, 1990.
McGlynn, B. L. and McDonnell, J. J.: Quantifying the relative contributions of riparian and hillslope zones to catchment runoff, Water Resour. Res., 39, 1310, https://doi.org/10.1029/2003wr002091, 2003.
McGlynn, B. L., McDonnell, J. J., Seibert, J., and Kendall, C.: Scale effects on headwater catchment runoff timing, flow sources, and groundwater-streamflow relations, Water Resour. Res., 40, W07504, https://doi.org/10.1029/2003wr002494, 2004.
McGuire, K. J. and McDonnell, J. J.: Hydrological connectivity of hillslopes and streams: Characteristic time scales and nonlinearities, Water Resour. Res., 46, W10543, https://doi.org/10.1029/2010wr009341, 2010.
Merz, R., Bloschl, G., and Parajka, J.: Spatio-temporal variability of event runoff coefficients, J. Hydrol., 331, 591–604, https://doi.org/10.1016/j.jhydrol.2006.06.008, 2006.
Muñoz-Villers, L. E. and McDonnell, J. J.: Runoff generation in a steep, tropical montane cloud forest catchment on permeable volcanic substrate, Water Resour. Res., 48, W09528, https://doi.org/10.1029/2011WR011316, 2012.
Munyaneza, O., Wenninger, J., and Uhlenbrook, S.: Identification of runoff generation processes using hydrometric and tracer methods in a meso-scale catchment in Rwanda, Hydrol. Earth Syst. Sci., 16, 1991–2004, https://doi.org/10.5194/hess-16-1991-2012, 2012.
Nathan, R. J. and McMahon, T. A.: Evaluation of Automated Techniques for Base-Flow and Recession Analyses, Water Resour. Res., 26, 1465–1473, https://doi.org/10.1029/Wr026i007p01465, 1990.
Norbiato, D., Borga, M., Merz, R., Blöschl, G., and Carton, A.: Controls on event runoff coefficients in the eastern Italian Alps, J. Hydrol., 375, 312–325, https://doi.org/10.1016/j.jhydrol.2009.06.044, 2009.
Ocampo, C. J., Oldham, C. E., Sivapalan, M., and Turner, J. V.: Hydrological versus biogeochemical controls on catchment nitrate export: a test of the flushing mechanism, Hydrol. Process., 20, 4269–4286, https://doi.org/10.1002/hyp.6311, 2006.
Pellerin, B. A., Wollheim, W. M., Feng, X., and Vörörsmarty, C. J.: The application of electrical conductivity as a tracer for hydrograph separation in urban catchments, Hydrol. Process., 22, 1810–1818, https://doi.org/10.1002/hyp.6786, 2008.
Penna, D., Tromp-van Meerveld, H. J., Gobbi, A., Borga, M., and Dalla Fontana, G.: The influence of soil moisture on threshold runoff generation processes in an alpine headwater catchment, Hydrol. Earth Syst. Sci., 15, 689–702, https://doi.org/10.5194/hess-15-689-2011, 2011.
Penna, D., van Meerveld, H. J., Oliviero, O., Zuecco, G., Assendelft, R. S., Dalla Fontana, G., and Borga, M.: Seasonal changes in runoff generation in a small forested mountain catchment, Hydrol. Process., 29, 2027–2042, https://doi.org/10.1002/hyp.10347, 2015.
Penna, D., van Meerveld, H. J., Zuecco, G., Fontana, G. D., and Borga, M.: Hydrological response of an Alpine catchment to rainfall and snowmelt events, J. Hydrol., 537, 382–397, https://doi.org/10.1016/j.jhydrol.2016.03.040, 2016.
Pinder, G. F. and Jones, J. F.: Determination of the ground-water component of peak discharge from the chemistry of total runoff, Water Resour. Res., 5, 438–445, https://doi.org/10.1029/WR005i002p00438, 1969.
Rinderer, M., van Meerveld, H. J., and Seibert, J.: Topographic controls on shallow groundwater levels in a steep, prealpine catchment: When are the TWI assumptions valid?, Water Resour. Res., 50, 6067–6080, https://doi.org/10.1002/2013wr015009, 2014.
Rinderer, M., van Meerveld, I., Stähli, M., and Seibert, J.: Is groundwater response timing in a pre-alpine catchment controlled more by topography or by rainfall?, Hydrol. Process., 30, 1036–1051, https://doi.org/10.1002/hyp.10634, 2016.
Rinderer, M., McGlynn, B. L., and van Meerveld, H. J.: Groundwater similarity across a watershed derived from time-warped and flow-corrected time series, Water Resour. Res., 53, 3921–3940, https://doi.org/10.1002/2016WR019856, 2017.
Rinderer, M., Meerveld, H. J., and McGlynn, B.: From points to patterns: using groundwater time series clustering to investigate subsurface hydrological connectivity and runoff source area dynamics, Hydrol. Process., submitted, 2018.
Rodhe, A.: The origin of streamwater traced by oxygen-18, Ph.D., Dept. Phys. Geogr. Div. Hydrol., Uppsala Univ., 290 pp., 1987.
Schleppi, P., Muller, N., Feyen, H., Papritz, A., Bucher, J. B., and Fluehler, H.: Nitrogen budgets of two small experimental forested catchments at Alptal, Switzerland, Forest Ecol. Manag., 101, 177–185, https://doi.org/10.1016/S0378-1127(97)00134-5, 1998.
Shanley, J. B. and Chalmers, A.: The effect of frozen soil on snowmelt runoff at Sleepers River, Vermont, Hydrol. Process., 13, 1843–1857, https://doi.org/10.1002/(SICI)1099-1085(199909)13:12/13<1843::AID-HYP879>3.0.CO;2-G, 1999.
Shanley, J. B., Kendall, C., Smith, T. E., Wolock, D. M., and McDonnell, J. J.: Controls on old and new water contributions to stream flow at some nested catchments in Vermont, USA, Hydrol. Process., 16, 589–609, https://doi.org/10.1002/hyp.312, 2002.
Sidle, R. C., Tsuboyama, Y., Noguchi, S., Hosoda, I., Fujieda, M., and Shimizu, T.: Seasonal hydrologic response at various spatial scales in a small forested catchment, Hitachi-Ohta, Jpn. J. Hydrol., 168, 227–250, https://doi.org/10.1016/0022-1694(94)02639-s, 1995.
Sklash, M. G. and Farvolden, R. N.: The role of groundwater in storm runoff, J. Hydrol., 43, 45–65, https://doi.org/10.1016/0022-1694(79)90164-1, 1979.
Stähli, M. and Gustafsson, D.: Long-term investigations of the snow cover in a subalpine semi-forested catchment, Hydrol. Process., 20, 411–428, https://doi.org/10.1002/hyp.6058, 2006.
Taylor, C. H. and Pearce, A. J.: Storm runoff processes and subcatchment characteristics in a new zealand hill country catchment, Earth Surf. Proc. Land, 7, 439–447, https://doi.org/10.1002/esp.3290070505, 1982.
van Meerveld, H. J. I., Fischer, B. M. C., Rinderer, M., Stähli, M., and Seibert, J.: Runoff generation in a pre-Alpine catchment: A discussion between a tracer and a shallow groundwater hydrologist, Cuadernos de Investigación Geográfica, 44, 429–452, https://doi.org/10.18172/cig.3349, 2018.
von Freyberg, J., Radny, D., Gall, H. E., and Schirmer, M.: Implications of hydrologic connectivity between hillslopes and riparian zones on streamflow composition, J. Contam. Hydrol., 169, 62–74, https://doi.org/10.1016/j.jconhyd.2014.07.005, 2014.
von Freyberg, J., Studer, B., and Kirchner, J. W.: A lab in the field: high-frequency analysis of water quality and stable isotopes in stream water and precipitation, Hydrol. Earth Syst. Sci., 21, 1721–1739, https://doi.org/10.5194/hess-21-1721-2017, 2017.
Waddington, J. M., Roulet, N. T., and Hill, A. R.: Runoff Mechanisms in a Forested Groundwater Discharge Wetland, J. Hydrol., 147, 37–60, https://doi.org/10.1016/0022-1694(93)90074-J, 1993.