the Creative Commons Attribution 4.0 License.
the Creative Commons Attribution 4.0 License.
 | 14 Nov 2018
Do users benefit from additional information in support of operational drought management decisions in the Ebro basin?
Clara Linés
Ana Iglesias
Luis Garrote
Vicente Sotés
Micha Werner
We follow a user-based approach to examine how information supports operational drought management decisions in the Ebro basin and how these can benefit from additional information such as from remote sensing data. First we consulted decision-makers at basin, irrigation district and farmer scale to investigate the drought-related decisions they make and the information they use to support their decisions. This allowed us to identify the courses of action available to the farmers and water managers, and to analyse their choices as a function of the information they have available to them. Based on the findings of the consultation, a decision model representing the interrelated decisions of the irrigation association and the farmers was built. The purpose of the model is to quantify the effect of additional information on the decisions made. The modelled decisions, which consider the allocation of water, are determined by the expected availability of water during the irrigation season. This is currently informed primarily by observed reservoir level data. The decision model was then extended to include additional information on snow cover from remote sensing. The additional information was found to contribute to better decisions in the simulation and ultimately higher benefits for the farmers. However, the ratio between the cost of planting and the market value of the crop proved to be a critical aspect in determining the best course of action to be taken and the value of the (additional) information. Risk-averse farmers were found to benefit least from the additional information, while less risk-averse farmers stand to benefit most as the additional information helps them take better informed decisions when weighing their options.
- Article
(9669 KB) -
Supplement
(431 KB) - BibTeX
- EndNote


Water managers and farmers regularly make decisions on how to make the most of the available water resources. Information on the availability and variability of the resource is essential to allow these decision-makers to choose among the actions available to them, especially as water becomes scarce, for example during drought events. Improved information on the availability of water can then potentially lead to a more effective management and can therefore contribute to the mitigation of the impacts of drought events.
In situ meteorological and hydrological measurement networks have long served to inform these decisions, often providing accurate water resources observations at high temporal resolution. In addition, the potential of Earth observation (EO) from satellites to support water management has also been widely recognised (Famiglietti et al., 2015; Fernandez-Prieto et al., 2012). The availability and quality of EO datasets has continuously improved during recent decades, providing an increasingly relevant source of globally consistent data that can be used to complement in situ data.
However, the increased quality and availability of information does not necessarily translate directly into benefits due to better decisions. How the information is used and distributed also plays a critical role (Williamson et al., 2002). It is the capacity of the user of information to change the course of action as a result of new information being available to them that largely determines the value of that new information (Macauley, 2006).
A good understanding of the role that information plays or could play in supporting decisions, as well as the resulting benefits, is useful both for the users and the data providers and helps improve the connection between these two groups. Onoda and Young (2017) present a series of analyses on the contribution of EO datasets in addressing environmental problems from a policy point of view and conclude recommending more stakeholder-oriented studies of the value of these data and the quantification of the benefits of this data through comparisons with current tools. The assessment of the role and impacts of remote sensing products is expected to help in fully achieving the potential of the products, maximising the socio-economic and environmental benefits, and contributing to justify the investment in developing and improving the products.
An example of a stakeholder-oriented approach to assess the value of satellite-based information in support of water management is presented by Bouma et al. (2009). They develop a framework to measure the benefits of satellite-based observations. The framework, which is based on Bayesian decision theory and expert consultation, is applied to water quality management in the North Sea (Bouma et al., 2009) and to coral reef protection (Bouma et al., 2011).
Macauley (2006) reviews studies on the value of information in Earth science applications, classifying the techniques that are used or that are potentially useful into three groups: studies that measure the value by gains in output or productivity; studies based on hedonic pricing, in which the value is inferred from models based on wages and housing prices; and studies that consider the willingness to pay. The main example of the first group of techniques are the studies that relate farm profits and weather information, especially in relation to weather forecasts. Early studies explore simplified cases of decisions such as whether to plant or to leave cultivable land fallow (Brown et al., 1986), or on what crop to plant (Wilks and Murphy, 1986).
From the user's perspectives, the optimal choice for a decision to be made is to take the course of action that results in the highest expected utility, which is defined as the weighted sum of the outcomes of the possible actions and the probability of a given state of nature such as a reduction in the available water resource. Clearly this includes undesirable outcomes, where an action is taken based on an expected state of nature that does not materialise. Additional information is then considered to have value if it can improve the advance knowledge on the probabilities of the different possible states of nature occurring, thus allowing the user to make a better informed decision. A commonly used approach to evaluate the value of advance information, such as information provided through advanced warning, is the cost–loss framework (Mylne, 2002; Roulin, 2007; Verkade and Werner, 2011; Zhu et al., 2002). Often used to evaluate the potential benefit of (flood) warnings, this is the ratio of the costs of taking protective action to the losses incurred if that action is not taken. This framework has also been extended to water resources management decisions, such as in Quiroga et al. (2011), who analyse the value of climate projections to decisions on applying measures to reduce water demand in the Ebro basin. The cost–loss framework does assume a strictly rational behaviour of users in weighing the costs and probability of losses, which is a limitation as different users may make different decisions depending on their levels of risk averseness. This can, however, be incorporated through a function of risk aversion (Matte et al., 2017; Quiroga et al., 2011).
The aim of our paper is to explore the value of information to drought management decisions through a stakeholder-oriented analysis. We examine the operational decisions that stakeholders such as farmers and reservoir operators take within the context of water resources allocation during droughts. The proposed framework first uses interviews to identify the decisions stakeholders make, as well as the information they use to inform those decisions. A decision model is then established and applied to emulate the decision process and how additional information contributes to improving the decisions made. Our work contributes to the developing field of socio-hydrology (Sivapalan et al., 2012) in that it explores the co-evolution of the availability of water and the decisions made by humans (in this case farmer and irrigation operators). While the emerging field of socio-hydrology is broad (McMillan et al., 2016), we consider our work to be related most to that of the working group on drought in the Anthropocene (Van Loon et al., 2016), which explicitly addresses the inefficiency of drought management due to poorly understood feedback between people (and the decisions they make) and drought conditions.
2.1 The Ebro basin
We explore the role of information in drought-related decisions in the Ebro basin. The Ebro Basin is the largest in Spain (85 600 km2) and is a highly regulated basin with 125 reservoirs (>1 Mm3) and a total storage capacity of approximately 8000 Mm3. These reservoirs are used primarily to supply water to more than 900 000 ha of irrigated agriculture and 360 hydro-electrical plants (CHE, 2015).
The larger irrigation districts are located in the north-east of the basin (Figure 1). We have selected one of these, the irrigation district supplied by the Aragón and Cataluña channel (Canal de Aragón y Cataluña, CAyC), to examine the decisions made at the sub-basin scale.
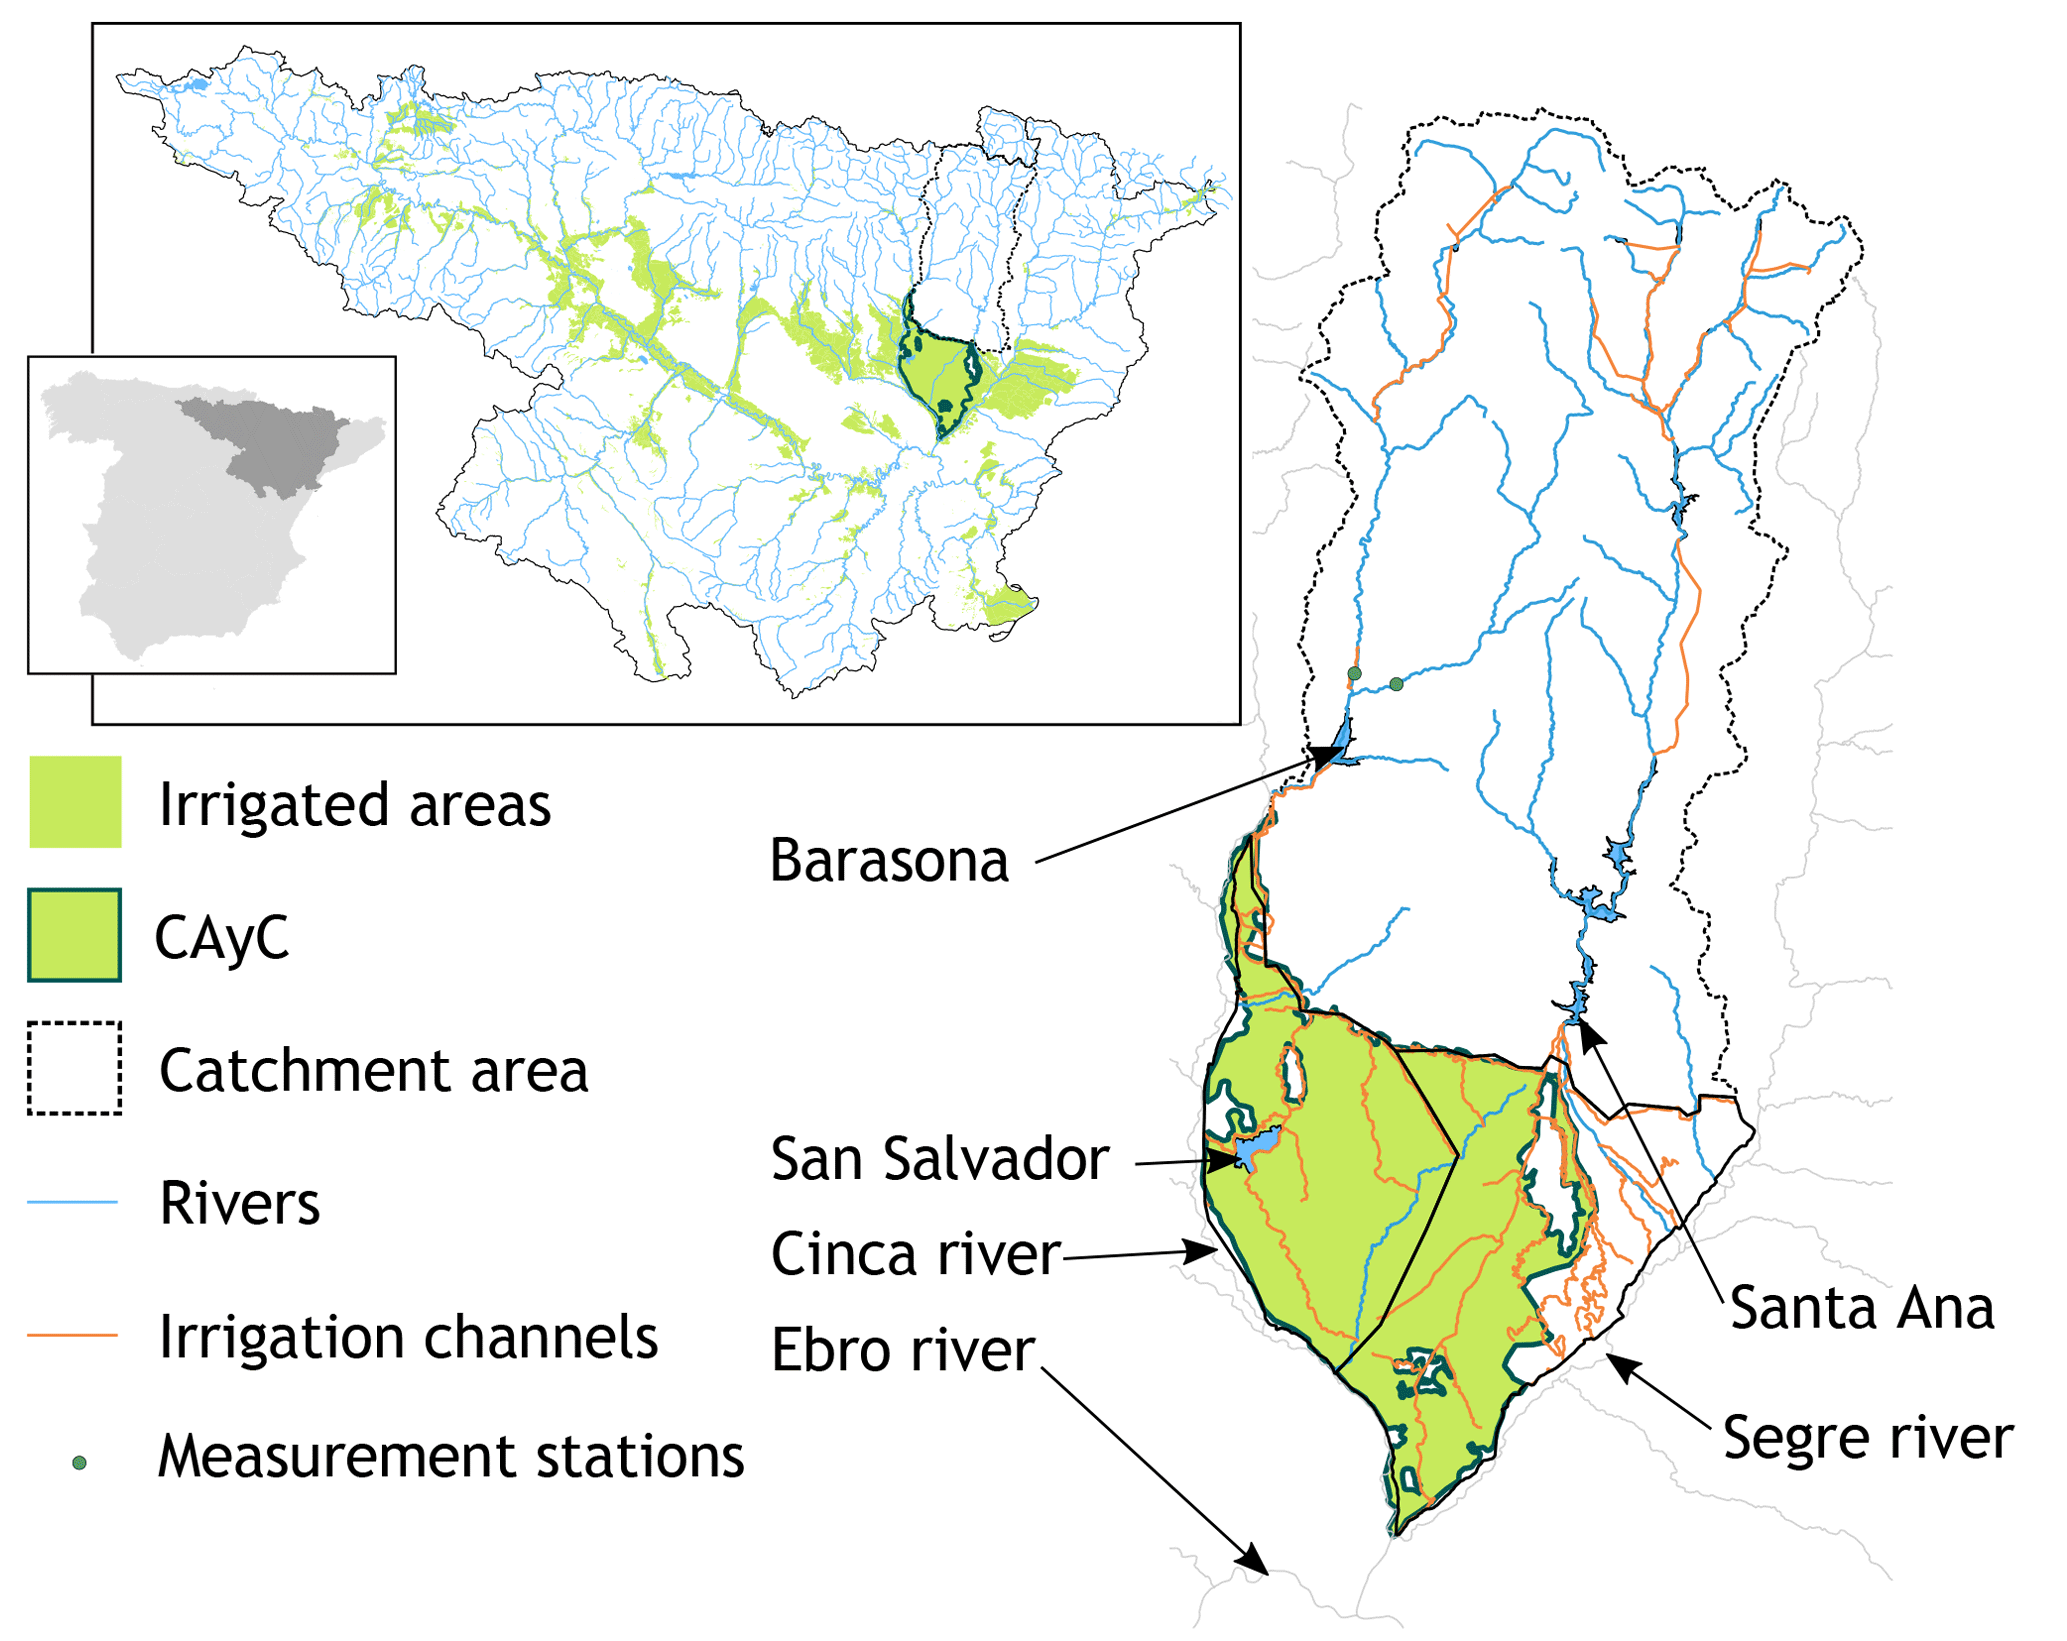
Over 90 % of the water provided by CAyC is used for irrigation. The water it supplies is sourced from three reservoirs (Barasona, San Salvador and Santa Ana), and it is supplied to an irrigated area of around 98 000 ha. Two zones can be distinguished in the irrigated area: an upstream zone that can only be supplied from the Barasona reservoir as well as from the recently inaugurated San Salvador reservoir, and a downstream zone that can be supplied from all three reservoirs. These zones are 54 000 and 44 000 ha in size, respectively. The main crops grown in the area are fruit orchard (apple, pear, peach and nectarine) and extensive herbaceous crops, mainly maize, alfalfa and barley. The area cropped with wine vine surface is increasing, though it is still somewhat localised (CHE, 2018).
Three drought events that resulted in impacts to agriculture and other sectors have been recorded for the 2000–2014 period: a short drought spell in 2002, a multi-year event that lasted from the winter of 2004–2005 to the spring of 2008, and another during the years 2011 and 2012 (Linés et al., 2017). The impacts of the multi-year drought of 2004–2008 in the Ebro basin have been widely studied. The north-eastern part of the basin was the most impacted (Hernández-Mora et al., 2013) and agriculture was the most affected sector, with 540 million Euros of estimated losses to crop production during the hydrological year 2004–2005 and further losses of 272 million in related industries (Pérez y Pérez and Barreiro-Hurlé, 2009).
2.2 Approach
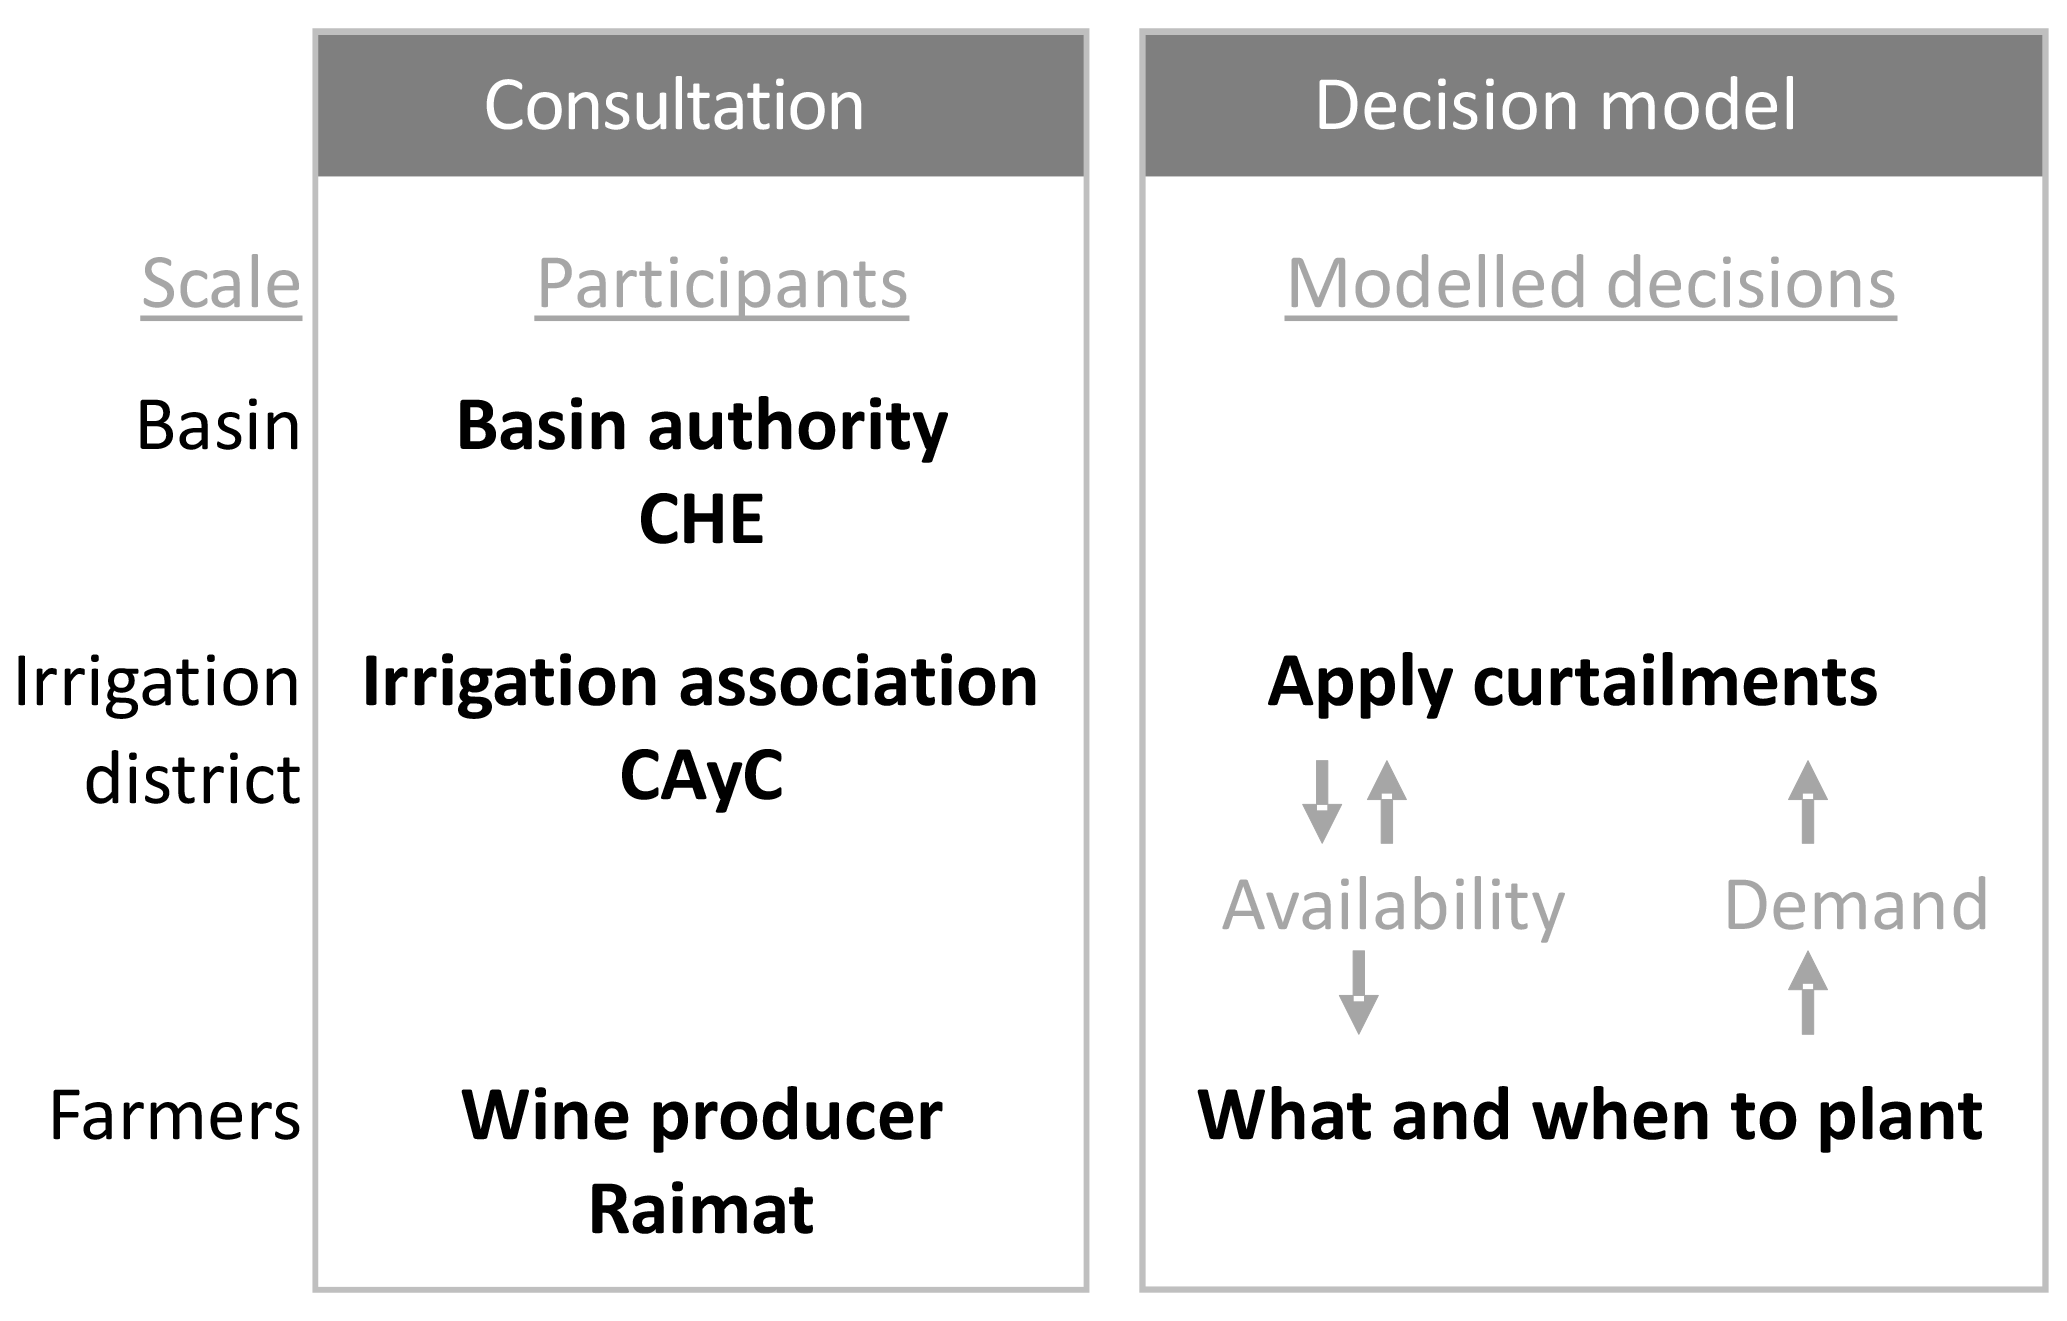
As the utility of information strongly depends on the particular details of the decisions and how information is used to support these, we first consulted decision-makers at the basin (Confederación Hidrográfica del Ebro, CHE), irrigation district (Comunidad de Regantes del Canal de Aragón y Cataluña) and farmer scale to better understand their decision processes, their information needs, and how they use information to support the decisions they make. For this analysis we focused on decisions regarding the allocation of water resources, in particular during drought, when curtailments may be applied (Fig. 2). The methods followed for the consultation and a summary of the outputs of the interviews at each of the locations are provided in Sect. 3.
The findings of the consultation phase were used to build a model of the decisions at irrigation district scale. The design of the model from these findings is described in Sects. 4.1 (farmer decisions) and 4.2 (reservoir operator decisions). The outputs of these components are the areas of different crops that are planted during the irrigation season and the curtailments applied. The crop yield is then calculated using the area of each crop and observed meteorological data in open-source crop models (introduced in Sect. 4.3).
In order to test and quantify the effect that additional information has on the operational drought management decisions analysed, the decision model was run for two scenarios with different input information. The input data and specific parameters used in these two runs are described in Sect. 5.
The expected final results of the analysis are the relative values of information in each of the tested scenarios. We calculate this based on the total net benefit obtained by farmers during the whole period of analysis. This benefit depends on the decisions made during each season, which in turn depend on the information used to inform them. The results are described in Sect. 6 and followed by discussion and conclusions.
3.1 Method
The stakeholders we consider are the different groups that have the capacity to modify the amount of water to be used for irrigation either by deciding on the volume of water to be supplied, or by deciding on the area and type of crops planted. This decision effectively also determines the irrigation demand. We use semi-structured interviews to develop our understanding of the decisions these stakeholders make in managing water resources and the possible adjustments to those decisions that they may make in view of water shortages. This method provides the possibility to discuss additional topics not originally envisioned by the research team in the interview guideline (Harrell and Bradley, 2009). O'Keeffe et al. (2016) and Carr et al. (2011) similarly apply semi-structured interviews to understand water use and management practices. Participants were asked to describe their own practices, as well as the practices of the groups they deal with in relation to drought management. A set of questions had been previously prepared, but was only used to guide the interviews and ensure that topics not mentioned were addressed and that all required details about the decision processes were collected.
One interview session was held at each of the locations (the basin authority, the irrigation association and the farm) with two or three people participating in each. In the interview that was held at the basin authority, the participants included the head of one of the basin's management units and two members of the hydrological planning office, both with expertise in drought management in the basin. In the interview at the Irrigation Association, the participants were the head of the Irrigation Association and the engineer in charge of the information service about current and expected water availability. And in the interview at the farm level, two people participated: the head of viticulture and the engineer responsible for the information service.
The information about the practices and attitudes of farmers in the study area was to a great extent obtained from the interview with the staff at the Irrigation Association who work in close collaboration with all the farmers in the area and therefore have a wider view than individual farmers. We acknowledge that the sample of interviews we held is small. Although important to the assumptions made in the development of the decision model that we constructed, we would readily agree that our representation of the farmer behaviour and the diversity of responses across farmers may be over-simplified. A larger sample of interviews would reveal more information, but we feel that is outside the scope of this paper.
3.2 Confederación Hidrográfica del Ebro
The main operational decisions that the Ebro river basin authority (CHE) takes regarding drought are the declaration of drought conditions and the allocation of water in emergency situations. To guide these decisions, CHE defined a drought management plan in 2007 (CHE, 2007), which was the first of its kind in Europe. It is a very comprehensive plan and links hydro-meteorological indicators to drought severity levels. The decision to declare drought is informed by a set of indicators, derived from measurements from a dense network of in situ automatic stations. The plan establishes the main indicator to be used for each of the areas of the basin. Where applicable, water stored in the reservoir is used as the main indicator, since it is considered the most robust option. Otherwise 3-month discharge or groundwater levels are used as indicators.
In the opinion of those interviewed at CHE, the declaration of drought is currently well informed and therefore they consider that additional information would be more useful after the declaration, when conditions must be monitored closely and decisions such as selecting the most cost-effective alternative sources of water or how to secure sufficient water to guarantee environmental flows must be taken. For these decisions timing is critical and they point out that information should be available with a maximum delay of 1 week to be useful for decisions. In addition, they showed particular interest in remote sensing derived snow data to support the quantification of water availability in the basin.
3.3 Canal de Aragón y Cataluña (CAyC)
General Irrigation Associations such as Canal de Aragón y Cataluña (CAyC) are responsible for the distribution of water from the reservoir to the users. In drought situations they can decide to introduce restrictions to irrigation water quotas. The decisions they make on the application of these restrictions are informed by the availability of water in the reservoirs that feed the irrigation canal system.
The main decisions that CAyC make in relation to drought is to apply restrictions (curtailments) to the maximum amount of water that irrigators can request. They make this decision when they consider that the available water resource is insufficient to reach the end of the irrigation season if full irrigation supply to meet demand is maintained. They can also decide to move water among the three reservoirs in the area. When restrictions are necessary, these are applied to all users independently of the reservoirs that they can be supplied from to ensure curtailments are applied equitably across the district. However, when water is scarce, priority is given to perennial crops such as fruit orchards and vines to ensure their survival.
To make their decisions, the reservoir operators need information both on water availability and the expected demand until the end of the season. In the interviews, they indicated that they consider that they are well informed on the availability of water given the levels in the reservoir. However, the information on water demand is limited. The difficulty of knowing the demand is due to the fact that they lack information on what crops farmers are planning on cultivating that year, and especially if the farmers will decide to plant a second crop, thus increasing the demand towards the end of the season. Currently they use historic data to estimate the demand. They are also conducting studies on the feasibility of obtaining this information from remotely sensed NDVI data (Casterad Seral, 2015; Quintilla et al., 2014), and although this will provide useful information on the current crops, it will not provide information on the future plans of the farmers.
Unlike the managers at the basin scale, CAyC indicated that they consider additional data on the snow cover in the headwaters to be of little use in quantifying the available resource. They argue that they tend to be cautious when accounting for snow in the estimation of total availability, since the reservoir capacity is rather small and therefore the possibility to store snowmelt runoff depends very much on the melt rate.
3.4 Farmers in the Canal de Aragón y Cataluña irrigated area
During the consultation, CAyC also provided details on the types of farmers present in their supply area as well as on the decisions these farmers make on what to plant. Typically, the proportion of crops planted is fruit orchards and vines for roughly a third of the area, alfalfa for another third, and annual crops for the remaining third. These annual crops are mostly winter cereals and maize. The cropping schedule adopted by farmers is mostly either a single crop of long-cycle maize or a winter cereal, or a double crop in which a winter cereal is followed by short cycle maize. The selection of one or the other by the farmers depends on the expected water availability, and is currently mainly informed by the water level in the reservoir. CAyC shares this information with them in the form of biweekly reports. Conversely, the decisions farmers make in terms of what crop to plant, and if they plan to plant a double crop, determine the demand for the season, and will therefore also have an impact on the decision to apply curtailments that are taken by the CAyC.
A prominent farmer in the supply area of CAyC is the Raimat wine producer, who also participated in the consultation process. They provided details of their information use for water resources management. Their parcels extend over 3200 ha and are highly technified, with extensive use of detailed information. In addition to in situ measurements and meteorological station data, they use Landsat satellite data and perform flight campaigns to acquire spatial NDVI and thermal data. The thermal data are used to estimate the leaf water potential and, together with temperature data, calculate a crop water stress index. This information on crop condition is used to detect spatial differences in the crops to make the most of the limited water, select the optimal moment for irrigation and prevent plagues, as well as to ensure the production is as uniform and controlled as possible.
The decisions they make are already based on high-resolution data, and therefore additional medium-resolution global data are not likely to be a valuable contribution to this type of user. However, this extensive use of information is not representative of all the farmers in the basin and other farmers may indeed benefit from additional information.
Two of the drought-related operational decisions described by the stakeholders were selected to be modelled. These are the decisions of the farmers on what to plant and the decision of the reservoir operators (part of the irrigation association, CAyC) to apply curtailments to the amount of water that farmers can request when this is considered necessary to avoid depleting the supply before the end of the irrigation season. The model represents both decisions as well as the interaction between the two. In the year-to-year planning of water allocation and crops to plant, the basin authority is of lesser relevance to the decision model as they are responsible for the longer-term planning through the basin hydrological plan. They are also in charge of developing the drought management plan, and although this plan provides guidelines on the measures to be taken during drought, it does not go into detail on the operational decisions to be taken on water allocation.
The decision model was built in R (R Core Team, 2016).
4.1 Farmer decision: crop areas
The farmers have a number of possible crop alternatives for each irrigation season. In this part of the model we simulate the decision of the farmers to follow one of the possible courses of action available to them. The result of the decision is the planted area of the selected crops. Since fruit orchards, vines and alfalfa crops are perennial crops and are typically planted for several years, their approximate areal extent is known and is considered to be constant in the model. The farmer decision model therefore focuses on determining the variable areal extent of maize and winter cereal, as well as the decision as to whether to plant a single crop or also a second crop. In the model, barley is selected to represent the winter cereal crop since it is the most common winter cereal crop in the area.
The courses of action represented in the model consist of a series of decisions made during the irrigation season. The possible actions are depicted in Fig. 3, which shows the choices that can be made at each decision stage in the calendar. At each of these decision points, the option that farmers would prefer to take if they perceive there are sufficient water resources available is indicated by a blue A. The preferred decision(s) if there are insufficient resources is marked with a red A. The choices and the calendar are based on the information provided by the stakeholders we interviewed, supported by literature sources (Espluga Trenc, 2016; Gil Martínez, 2013; Lloveras et al., 2014). We consider two types of farmers in the model, with different options available to them: technified farmers managing large plots and smaller-scale farmers. In the model, technified farmers (marked with T1 in Fig. 3) can support a double crop, and this is always their preferred option because of its higher productivity. However, in years of low water availability (red A in the figure) they may decide to leave the land fallow instead of planting a second crop. Smaller-scale farmers (T2) can only manage a single crop and in this case long-cycle maize is the most productive option. In years of low water availability, their decision will depend on the level of risk they are willing to take. We consider three levels of risk aversion (R1, R2 and R3 in the figure). The safest option to secure a crop is to plant long-cycle barley at the beginning of the season (R1), but they can also decide to wait for conditions to improve, taking the risk of having to leave the land fallow if there is no improvement (R>1). If, however, water availability increases by February, they can decide to plant long-cycle maize. If availability is still low, they can secure a crop by planting a short-cycle barley (a less productive option than the long-cycle version) (R2), or they can decide to wait longer (R3). In April, they can still plant a long-cycle maize crop if availability has improved, but, if it has not, then it is too late to plant barley and they have no other option than to leave the land fallow.
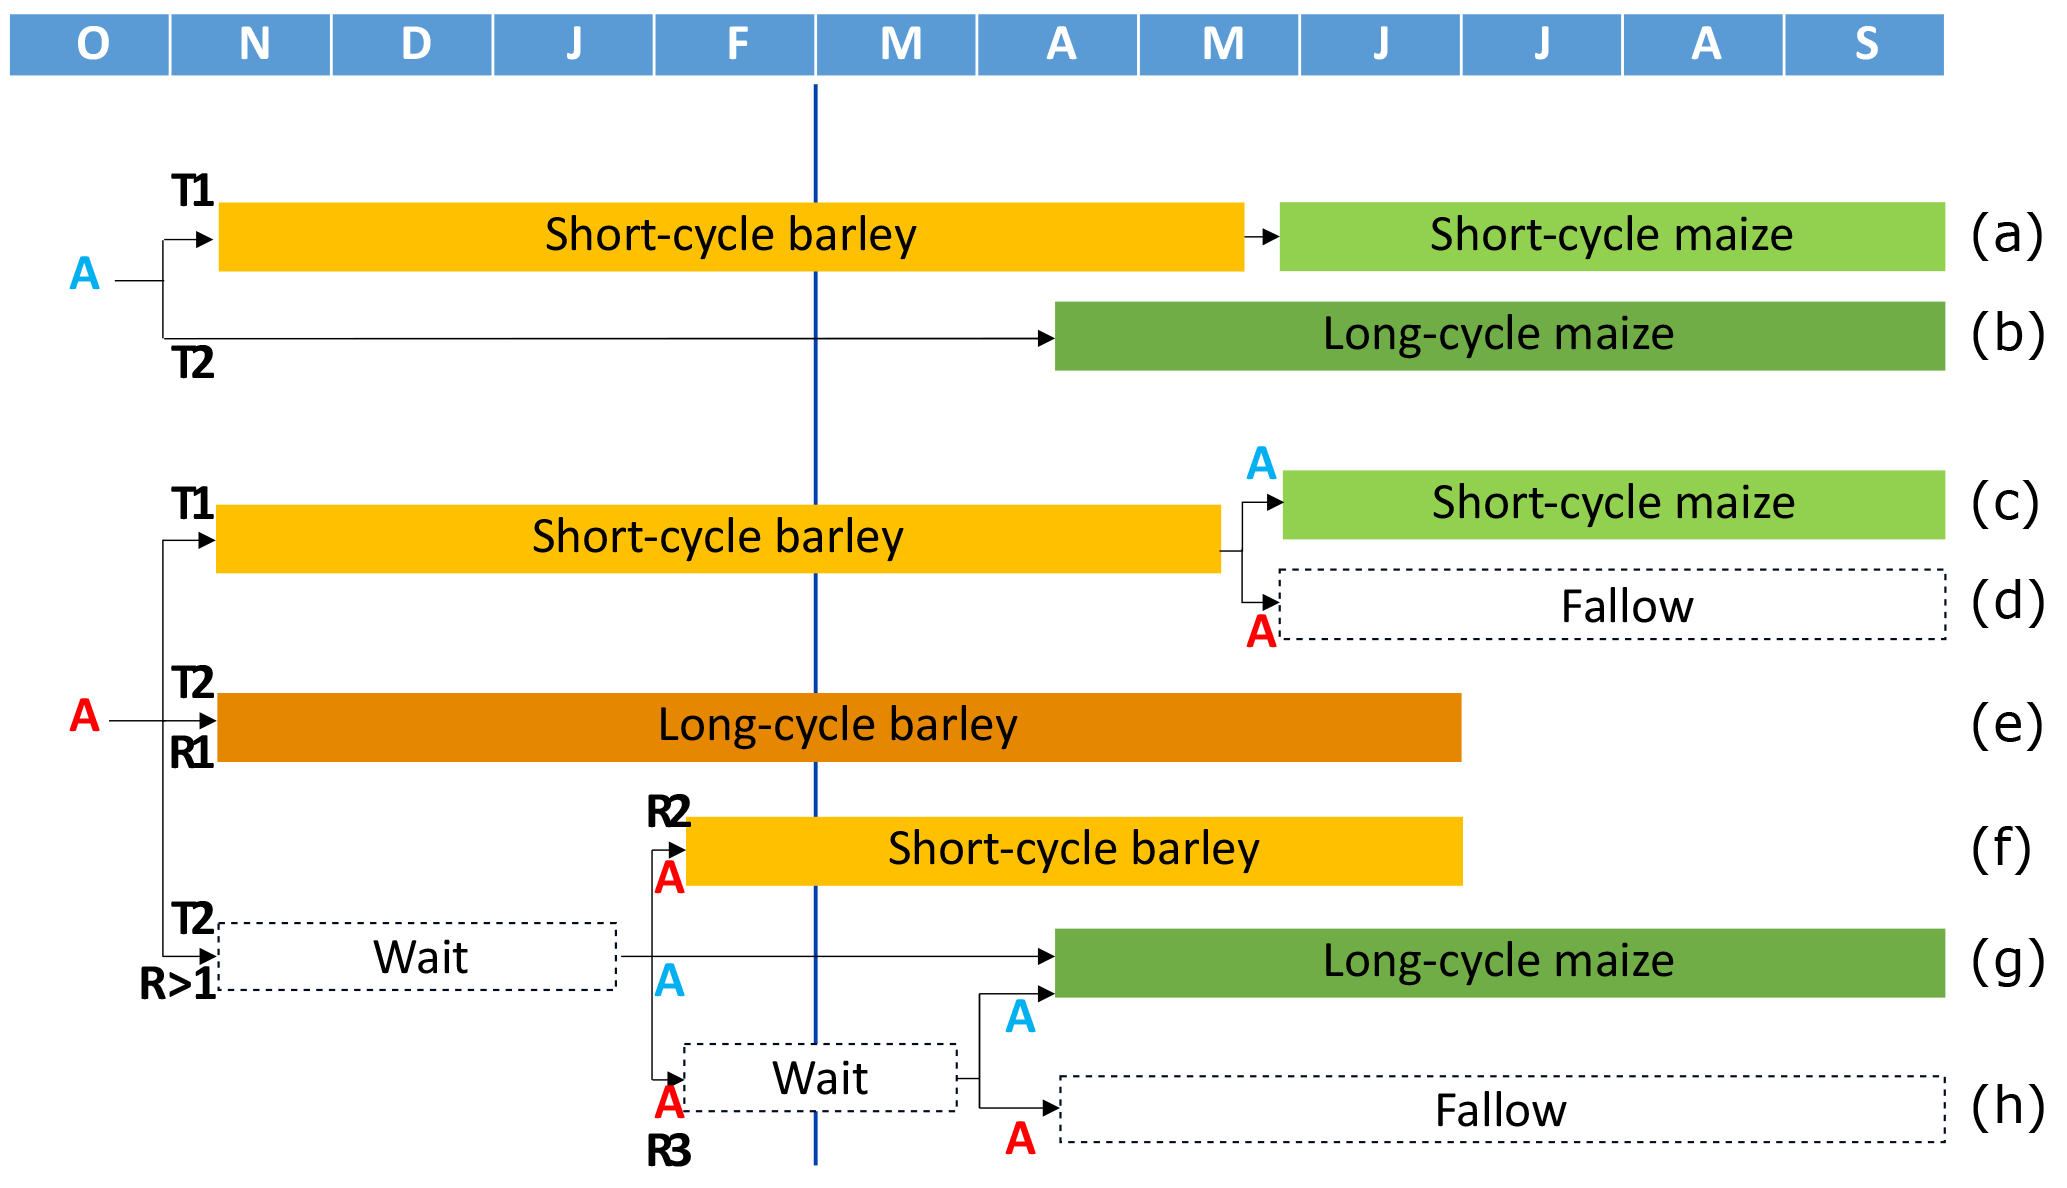
Figure 3Crop options considered in the model for farmers. Blue and red As represent respectively good and poor water availability at the moment of the decision. R1, R2 and R3 mark the different courses of action that farmers can follow depending on the risk they are willing to take, with R1 being the most risk averse and R3 the least risk averse. The lower case letters a–h indicate the end points of the possible decision paths. The blue vertical line marks the start of the irrigation season.
The choice of a particular course of action in the model is based on the water availability at the moment of the decision and is used as an indicator of the expected availability of water during the remaining season. For the decisions made before the start of the irrigation season (November and February), the availability is based on the observed volume in the reservoir since these decisions have no influence on the level of the reservoir until the actual start of the irrigation season. For the decisions after the start of the irrigation season (decision points in April and May) a simulated volume is used (Fig. 4). The simulated volume is based on the observed volume at the beginning of the irrigation season and the accumulated inflow from the beginning of the irrigation season until the decision date. From the start of the irrigation season the decisions made will have an influence on the level of the reservoir and therefore observed levels are not representative as an input for further decisions. Note that the barley crop is not irrigated and therefore does not pose a demand on the available water resource. However, as can be seen in Fig. 3 the choice for planting a barley crop will have implications for the available options later in the season and therefore indirectly influences the irrigation demand.
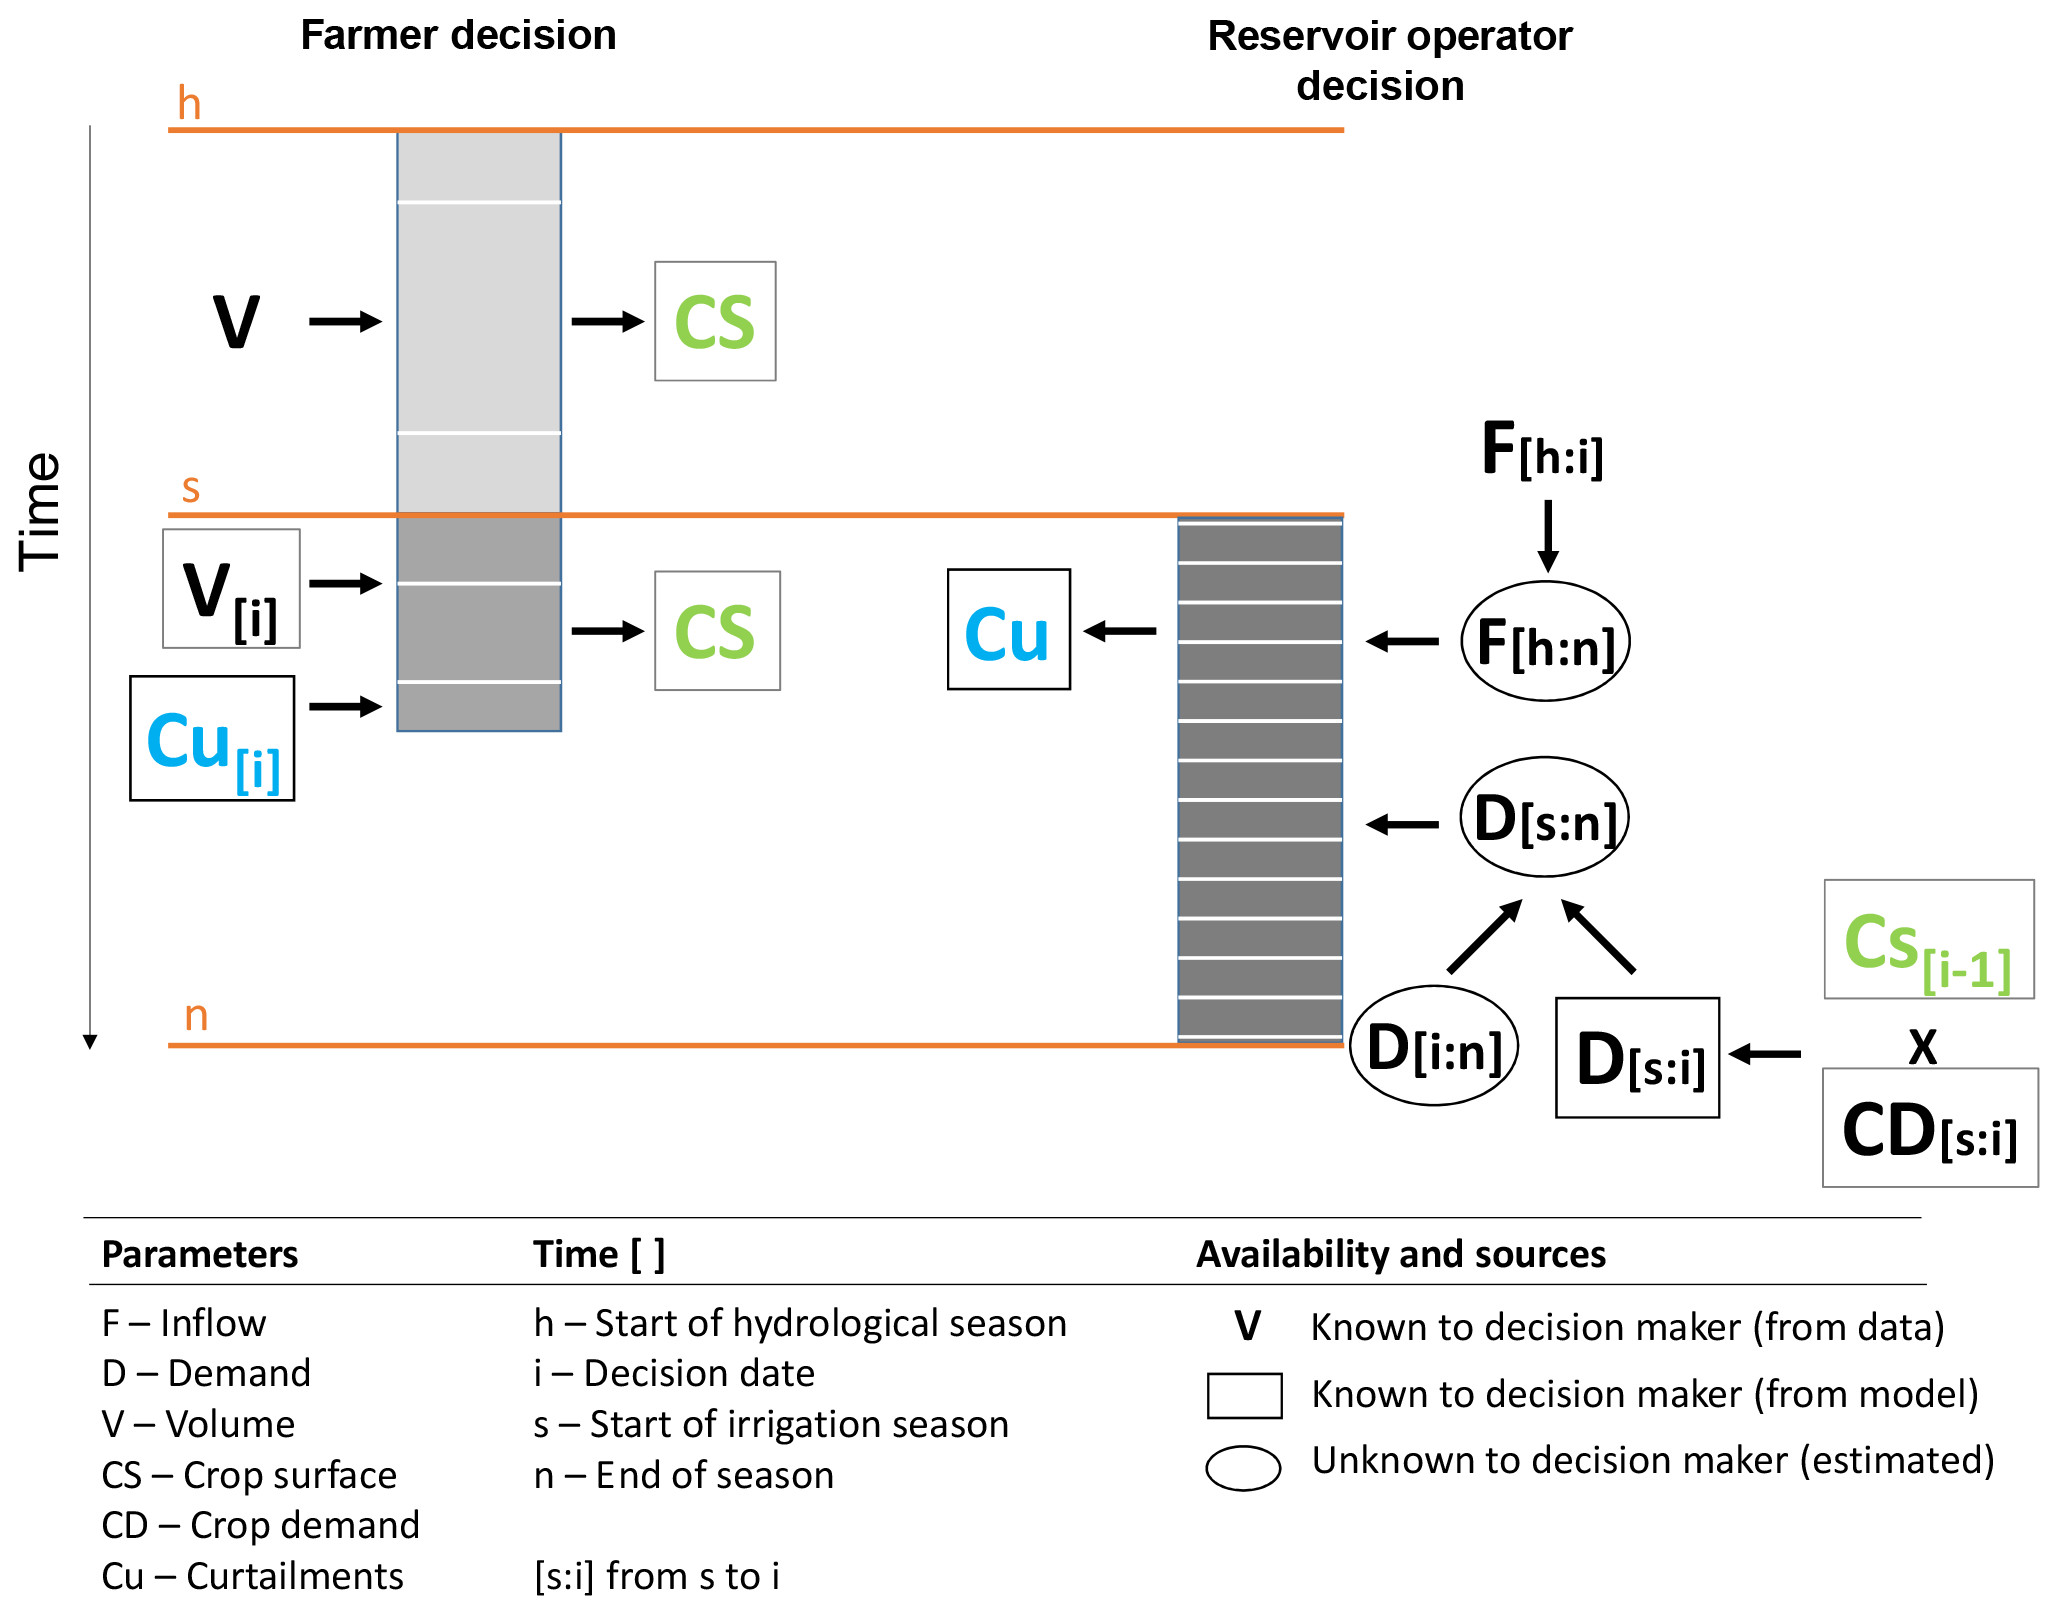
Figure 4Model decisions, parameters that inform them and decision outputs. A description of the abbreviations is included below. The period considered for each parameter is given in between square brackets. The shapes indicate the availability and source of the information. The parameters representing the information that is exchanged between the two decision models are coloured in green (crop surface, CS) and blue (curtailments, Cu). The grey boxes represent different blocks of the decision models. The reservoir operation decision has the same kind of input and output for each decision date, while the farmer's decision has different inputs before and after the start of the irrigation season. The white lines within the blocks represent the moments at which decisions are made (time i).
4.2 Reservoir operation decision: water restrictions
Every 2 weeks during the irrigation season (March–October), the decision on whether to apply curtailments to the maximum amount of water that irrigators can request is re-examined. This decision requires an estimate of the total amount of available water during the season and the total water demand. To estimate the total amount of water that will be available during the season, the inflow into the reservoir from the beginning of the hydrological year in October up to the week of the decision (represented as F[h:i] in Fig. 4) is compared with the percentiles of historic data. Data of accumulated inflow in the reservoir are preferred to reservoir levels as input information for the reservoir operator decision model to avoid the influence of the actual decisions of the managers and simulate them independently. The percentile curve in which the value of the current year is positioned is then used to sample from the climatological record a projection of the inflow series into the reservoir until the end of the season.
The total water demand for irrigation until the end of the season (D[s:n]) is calculated as the sum of the demand until the decision day (D[s:i]) and the expected demand from the decision day until the end of the season (D[i:n]). The first is the product of the crop surfaces already planted (Cs[i−1]), which is the output of the farmer decision model, and the resulting crop demand (CD[s:i]) obtained from the crop models using observed meteorological data. The latter (D[i:n]) is unknown to the managers. In the model, an average demand per unit area of crop calculated with the crop model data for the period 2000–2014 is used as an estimate to inform their decision. This is a simplification, as the demand to the end of season will depend on the expected climatological conditions and the crop surfaces planted. The actual demand up to the decision day could be used as an estimate of the expected demand until the end of the season. However, while that could provide an indication of the climatological conditions, the decisions made by farmers on which crops to plant at future decision moments are unknown.
When the estimated total amount of available water during the season is insufficient to fulfil the total demand, curtailments are applied. Conversely, if in a later week the expected total available water is found to be enough to fulfil the total demand, restrictions are lifted.
The output of the farmer model are the areas of each of the crops planted each year by the farmers. These crop areas determine the demand in the reservoir operator decision model. The outputs of the operator decision model on the other hand are the curtailments posed on the water supplied to the farmers until the end of the season, which is determined every 2 weeks. These curtailments may reduce the yield of the crops if these are already planted and the demand cannot be satisfied, but will also influence the farmer decisions within the irrigation season. If curtailments are in force when the farmers are deciding what to plant (April and May), then the model assumes that the farmers do not consider water availability to be good, leading to decisions commensurate with low water availability being made. These decisions will consequently influence the demand.
4.3 Crop water demand and benefit
AquaCrop-OS (Foster et al., 2017) was used to simulate barley and maize yields. These crops are the main focus of the analysis and they require a more detailed and flexible simulation to differentiate the different growing cycles and planting dates. Default parameters for maize and barley were adapted for the diverse cycles using data from Lloveras et al. (2014), Gil Martínez (2013) and Gutiérrez López (2011).
CropWat 8.0 (FAO, 2000) was used for alfalfa and fruit orchards, the crops that are considered to have a constant crop surface in the analysis. Default parameters were used but were adapted to the cropping calendar in the Ebro basin. Peach tree was selected as the representative fruit orchard crop. An irrigation calendar of 14 days was selected to match the reservoir operators' decision.
The percentage of reduction in crop yield was calculated as the maximum percentage of unsatisfied demand during the season. The reason for this is that, when there is insufficient water, farmers prefer to stop watering a part of the area, rather than apply insufficient water to the whole area. These percentages were calculated using the same 2-week time step of the operator decision. The areas in which irrigation was stopped were considered to have no yield and their contribution was subtracted from the full supply yield values derived from the crop models to obtain the final yield for each crop and year. Priority is given to the perennial crops, with the curtailments then being applied to the maize crops.
Expected availability of water during the irrigation season is the main variable used by both the reservoir operators and the farmers to inform their decisions. Information on that availability can, however, be obtained from different sources. Currently the main source of information that is used is the volume stored in the reservoirs, obtained through observations of the reservoir levels. Stakeholders indicated that they may also consider the available water resource in the snowpack in the headwaters upstream of the reservoirs, though there are currently no systematic observations of this resource that are formally included in their decision processes. Satellite images can, however, routinely provide estimates of this resource. Two information scenarios were therefore simulated: the expected water resource availability as informed by the reservoir levels alone, and the expected availability based on the reservoir levels with the addition of satellite-based data on snow cover in the headwaters.
Output benefit values using either of the two information scenarios were evaluated against the value (Val) of uninformed decisions and decisions under perfect information following the usual form of skill scores (Stanski et al., 1989):
The relative value (RV) is therefore a score between −∞ and 1, with RV =1 meaning that the information is perfect and RV ≤0 meaning that the information does not contribute to improving the decisions made.
The value of perfect information and uninformed decisions was calculated by running the model for all possible courses of action represented in Fig. 3. The value of perfect information was then obtained by selecting for each season the best performing course of action, while the value of the uninformed decisions was defined as the result of selecting the course of action that performs best on average for all years.
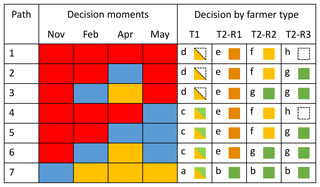
Analysing the pathways in Fig. 3 results in seven possible courses of action. These are summarised in Table 1, where the columns represent the four decision points and the colours the course that is followed. Blue and red indicate that the good or the poor water availability option is followed, respectively. The points at which no decision is required are marked in yellow. This happens when previous decisions already determine the course of action for later months. Option 7 corresponds to the situation in which the availability of water is good at the beginning of the hydrological year so farmers already select to plant the most productive crops in November and no further decisions are required in the following months. The other six options correspond to situations in which the availability of water is not considered to be good at the beginning of the hydrological year. In options 3 and 6, the situation improves by February, so small-scale farmers decide to plant the preferred option (long-cycle maize) at this point and do not require further decisions. The difference between these two options results from the decision taken by technified farmers on whether or not to plant a second crop in May. They will do this if they consider the availability of water to be good (option 6), otherwise they will leave the land fallow (option 3).
Table 1Possible paths for farmers. The paths are the result of the water availability (red – poor availability, blue – good availability, yellow – indifferent) at the four decision moments. The letters and coloured boxes in the last four columns correspond to the courses of action in Fig. 3 for each of the farmer types given good or poor availability at the four decision moments. The crops planted when following each of the paths are indicated using the same colours as in Fig. 3.
5.1 Input data
5.1.1 Reservoir and meteorological data
In situ data on reservoir levels were obtained from the automatic measurement stations (SAIH, Automatic Hydrologic Information System). These data are available from http://sig.mapama.es/redes-seguimiento/ (last access: 12 November 2018).
Reservoir volume data for Barasona reservoir and river flow data from the stations at the upstream tributaries (stations located at Graus on the Ésera river and at Capella on Isábena river, Fig. 1) were used to estimate the availability of water during the season. We focus on the Barasona reservoir as it is the levels in this reservoir that trigger the restrictions in the area supplied by CAyC. SAIH provides data for the Barasona reservoir from 1931 to September 2014, though there are some data gaps in the first few decades. The reservoir was enlarged in 1972 to a capacity of 84.71 hm3 and we therefore consider only the values after that year.
In addition, daily precipitation and temperature data, as well as monthly relative humidity data from the meteorological station located just outside the basin at the University of Lleida (station 9771C), were used to provide meteorological inputs to the crop model. Data from this station are available from 1983 through 2014 and can be obtained from https://opendata.aemet.es/centrodedescargas/productosAEMET (last access: 12 November 2018).
5.1.2 Snow cover data
MODIS 8-day snow cover 500 m grid data (MOD10A2; Hall, Salomonson, and Riggs 2006) were used to calculate the percentage of snow cover in the headwaters of the reservoirs (Fig. 1) as an additional source of water availability information. This dataset covers the period from 26 February 2000 to the end of 2016 and was downloaded from the EartH2Observe Water Cycle Integrator (http://wci.earth2observe.eu, last access: 12 November 2018).
5.2 Model options
5.2.1 Availability thresholds
Thresholds are needed to define at what reservoir level, or at what combination of reservoir level and snow cover, the water availability is regarded by the farmers as good. This judgement is made at each of the decision points. If the availability is above the threshold, then the farmer would follow the decision path associated with good expected availability of water (this corresponds to following the paths marked with a blue A in Fig. 3), while if it is below the threshold then the alternative, poor expected availability path will be followed. These thresholds are currently not formally defined, and may also differ between farmers as individual farmers will assess water availability differently, depending on how risk averse they are.
In the first test we identified the thresholds that maximise the sensitivity (rate of true positives) for all years analysed and for each of the farmers decision moments (November, February, April, May). This is a measure of the goodness of a binary classification that in this case refers to the points correctly classified as having good availability of water. To assess the performance of the classification the decisions made with perfect information are used as a reference. This results in a set of four optimised thresholds, which may be different for each of the decision points. The optimised threshold values at each decision point are kept the same for all years analysed.
In addition to the optimised set of thresholds, the model is run with 10 extra sets of thresholds to explore the sensitivity to these thresholds. In this case, the thresholds are kept the same at each decision point, and the values range from low (35 hm3) to almost full capacity (80 hm3).
The effect of the additional snow cover information on the expected available water resource is incorporated in the decision model by considering the expected contribution of snowmelt to the available water resource. When the snow cover is below a certain threshold, indicating lower than normal expected runoff from snowmelt, the farmers would require the reservoir level threshold to be higher to regard water availability as being good and thus follow the higher water demanding path. The snow cover thresholds used for this test are again determined using a goodness-of-fit measure of the binary classification of the decision points correctly identified as having good or poor availability. For the decisions made in May the snow information was not considered since snow cover is already very limited in that period.
5.2.2 Allocation factor
An allocation factor is applied to the accumulated inflow in the reservoir to obtain the proportion of the available resources that effectively reaches the crops. This factor accounts for water supplied to other uses, water losses due to evaporation, efficiency of the distribution network and releases from the reservoir to the downstream river. The allocation factor determines the amount of water that is available for irrigation and therefore has significant influence on the decisions made by the farmers and operators. As the true allocation factor is not known for the area, the sensitivity to this factor is tested by running the model with different allocation factors, considering perfect knowledge of the expected availability of water.
The most profitable choices for farmers were identified for different allocation factors under perfect information and are shown in Table 2. The first row (AF =1) represents the hypothetical situation in which all the water that enters the reservoir is available to the farmers to irrigate the crops. The following rows represent different levels of allocation of water for irrigation. The results show that when more water is available, farmers already choose to plant the most productive option in November or February (options 7 and 6 respectively). When there is less water they select to plant less maize or nothing at all (option 1). In years of water scarcity, such as 2005, we can see in the table that this is the case even if 80 % of the total water is used for irrigation.
Table 2Most profitable choice for the farmers for each of the years of the period 2001–2014 (represented in the columns) in function of the available water determined by the allocation factor (AF). The numbers of the options refer to the alternatives included in Table 1. The colours for the years represent the SPI-12 for the month of September for the catchment area of Barasona and Santa Ana reservoirs, calculated with CHIRPS precipitation data for the period 1981–2015.
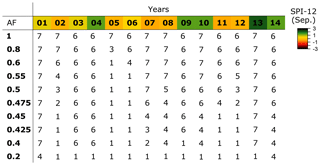
An allocation factor of 0.55 was selected for the following tests, since it is found to be a tipping point between good and poor availability for many of the years in the tested period and therefore allows for a higher range of represented situations. With this level of allocation, the area receives an amount of water that would be able to satisfy the full demand of the most productive alternative of crops in 10 out of the 14 years, with 4 years experiencing water shortages, which reflects the number of drought events in the 2000–2014 period.
To calculate the crop demand an irrigation efficiency of 80 % is considered.
5.2.3 Farmer types
The distribution of the types of farmer was kept constant for all the years and runs. The proportions of technified and smaller-scale farmers was established as the mid-range of the yearly ratio between farmers sowing transgenic maize (considered to be technified) and farmers sowing conventional maize (considered to be small-scale farmers) observed in the area for the period 2010–2015 (Espluga Trenc, 2016; Gutiérrez López, 2016). This resulted in 65 % of the area being exploited by farmers considered to be technified, and 35 % by small-scale farmers. The proportion of risk aversion used in the model is R1 = 0.4, R2 = 0.3, R3 = 0.3, with R1 being the most risk averse and R3 the most risk acceptant.
Different distributions of farmer types would result in different levels of demand and therefore different optimal paths. The proportion between technified farmers and smaller-scale farmers also gives more weight to different decision moments. For example, the decision in May on whether to plant a second crop is only relevant to the technified farmers.
5.2.4 Costs and benefits
Planting costs and selling prices were used to calculate the value of the yield for the variable crops. The planting costs considered are 496 EUR ha−1 for barley and 1807 EUR ha−1 for maize (MAGRAMA, 2015) and the selling prices are EUR 159 per 1000 kg for barley and EUR 171.3 per 1000 kg for maize (Aragon Statistics Institute, 2015). Average yields are 2349.75 kg ha−1 for rainfed barley and 12 179.34 kg ha−1 for irrigated maize (MAGRAMA, 2015). No differences in price or cost between the varieties of a same crop type were considered, although the higher productivity of long-cycle varieties results in these varieties being more profitable in the model.
6.1 Selection of optimal thresholds
We first ran all possible decisions paths and identified the decisions that result in the highest benefits to the farmers for each season. These decisions are represented in Fig. 5 by the coloured points, with the volume of the reservoir on the y axis. If the point is red, then the best decision is for the farmer to follow the path marked with a red A in Fig. 3. If it is blue, then it is best to follow the blue A path. If the point is yellow, then it does not matter which of the paths is followed.
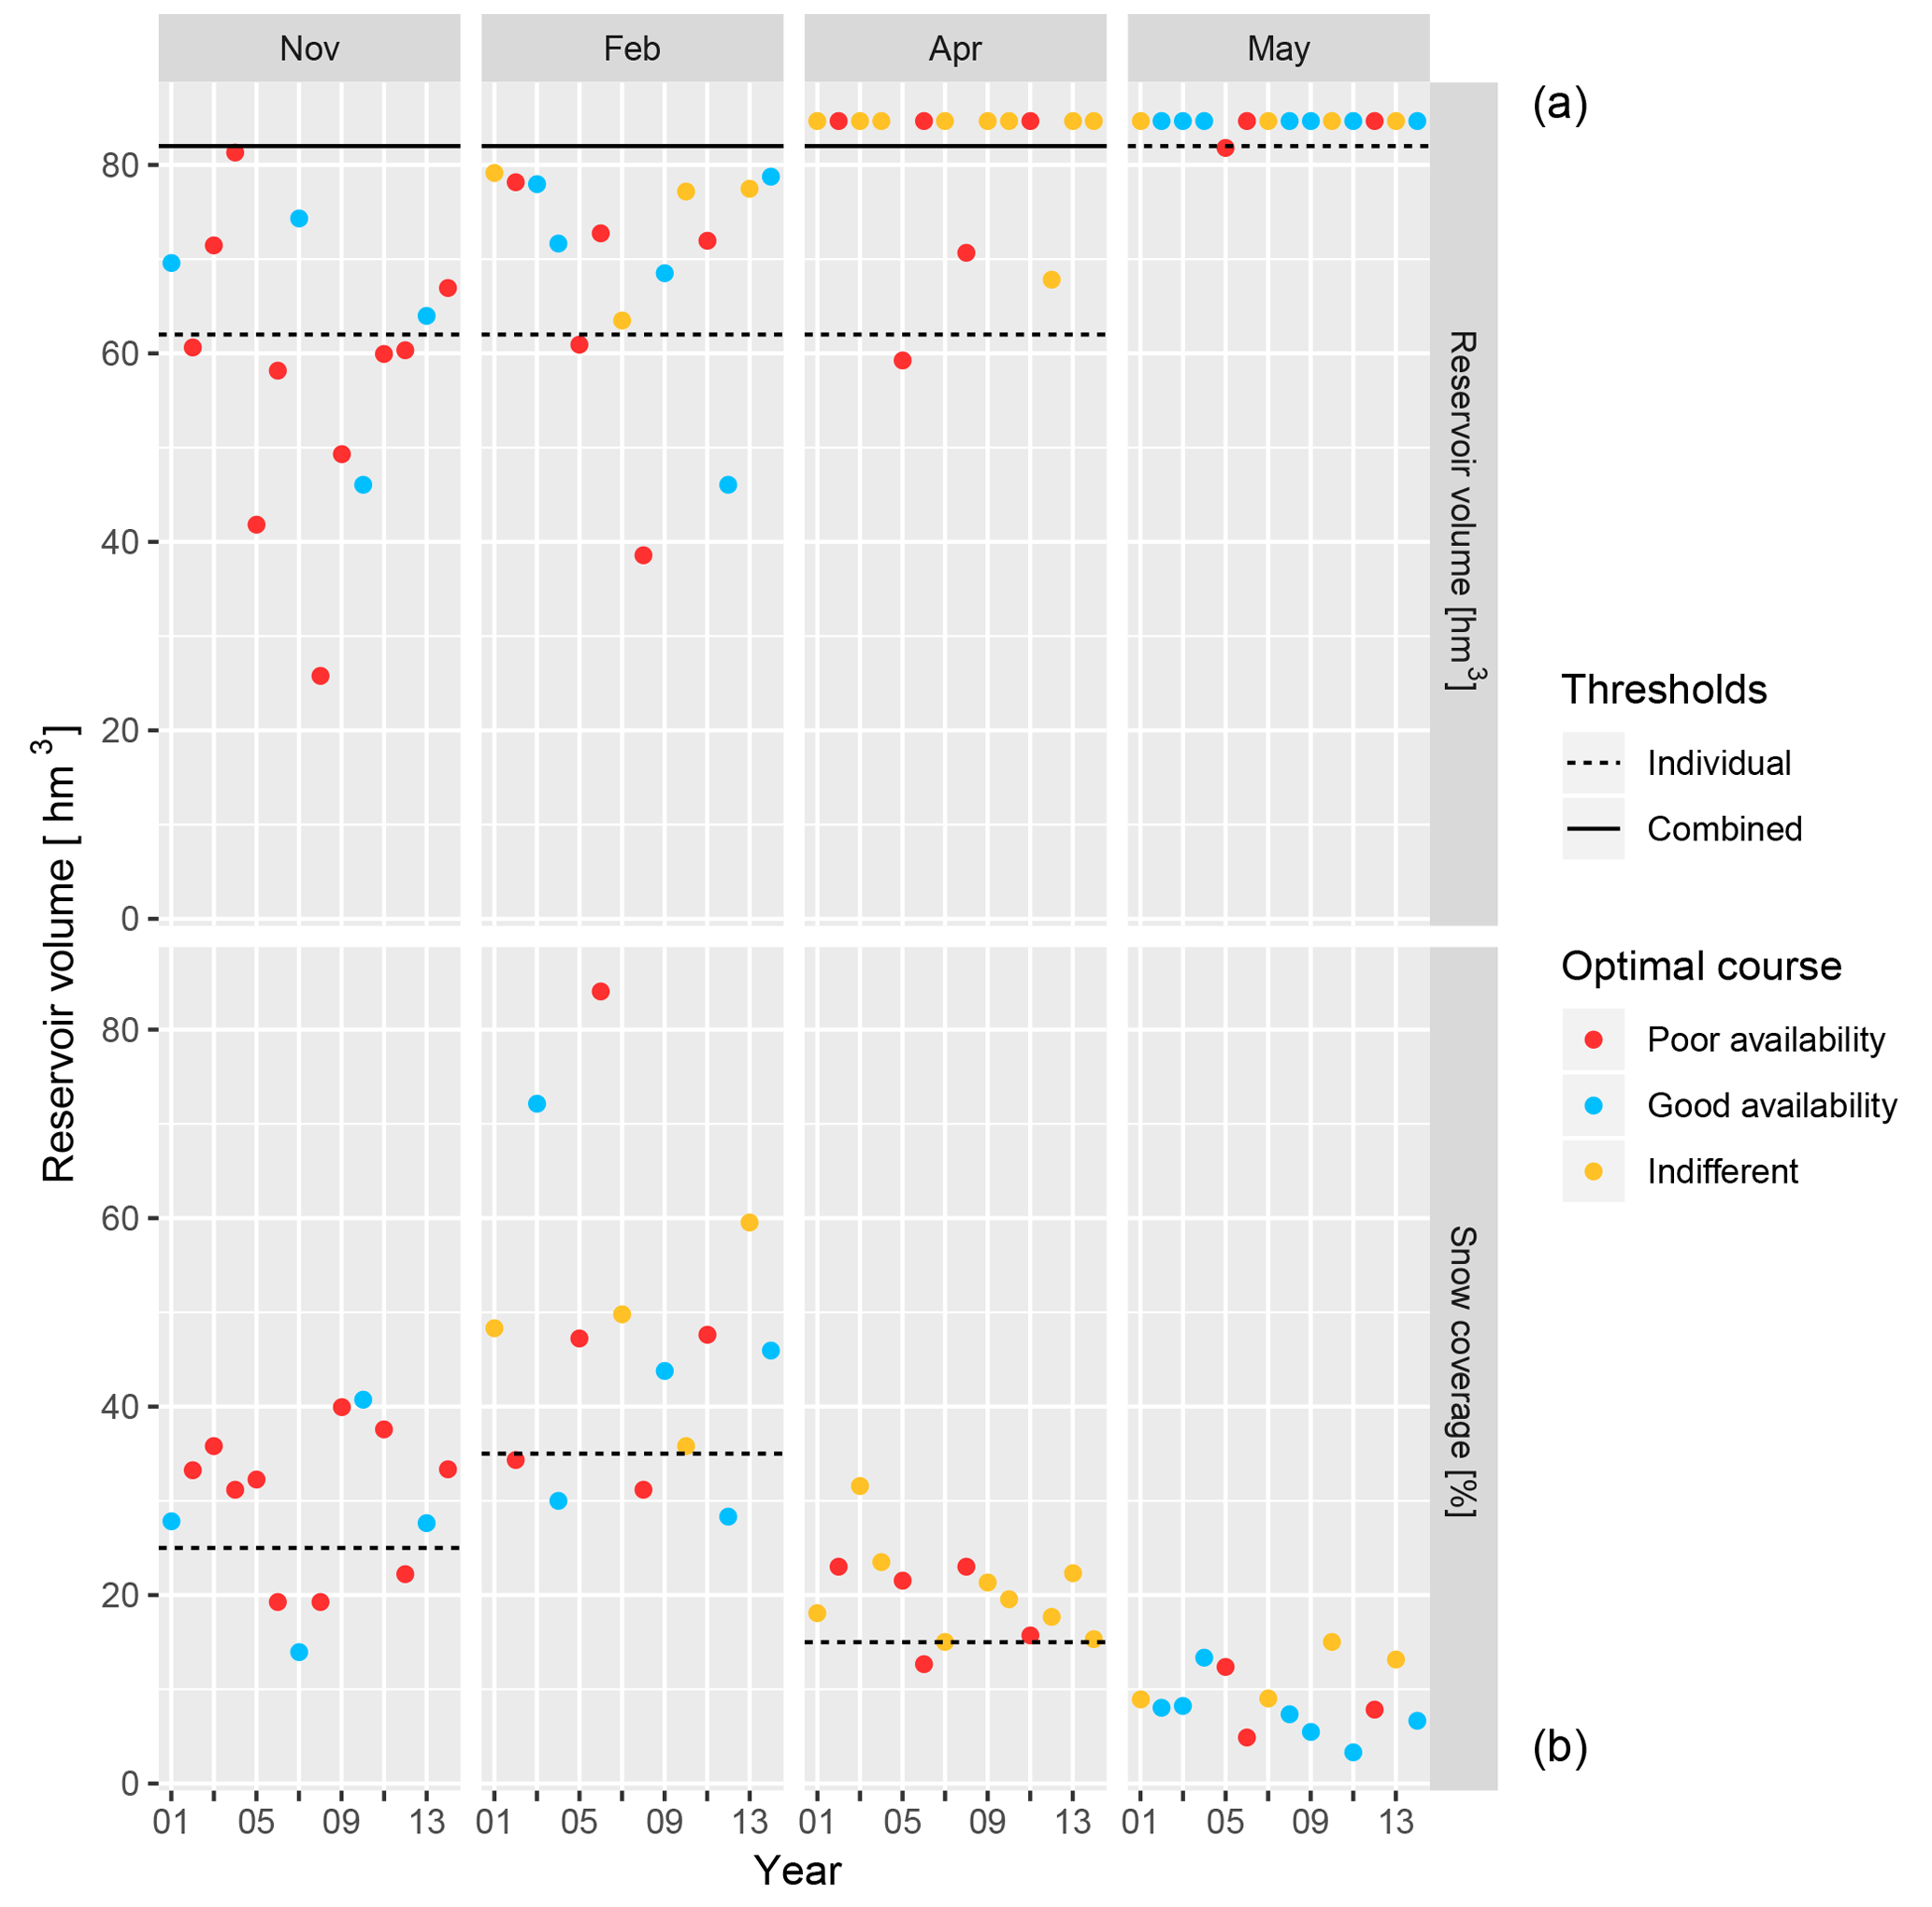
Figure 5The position of the points represents reservoir levels (a) and snow cover (b) for the period 2001–2014. The points are coloured according to the decisions made with perfect information at those decision points, which are considered to be the “optimal course”, and refer to the paths illustrated in Fig. 3. The individual thresholds mark the threshold for reservoir level or snow cover when considered independently, while the combined thresholds are the modified thresholds for reservoir level for years in which the snow cover threshold is not reached.
We use the optimal decisions based on perfect information to establish a threshold for the reservoir level to divide between good and poor water availability. A perfect threshold would be selected such that all the red points are below and all the blue points are above the threshold. This perfect threshold would always allow the farmer to make the decision that results in a higher benefit at the end of the season.
However, as can be seen in Fig. 5, it is not possible to obtain a perfect classification of the reservoir levels with a single threshold. The dashed lines mark the thresholds that maximise the points correctly classified. The fact that the classification cannot be perfect means that the reservoir level alone does not provide enough information on what is the best decision to make. Additional information will be valuable if it contributes to improving the classification and, therefore, results in the decision that maximises the benefits being made more often. In this case the additional information we consider is the snow cover data. This is shown in the lower part of the figure. The coloured points again indicate the decision path that would be taken based on perfect information. Again the figure shows that it is not possible to select a threshold value (dashed lines) where all the red points are below the threshold, and all blue points are above the threshold. This again indicates that this information alone does not lead to a perfect classification either.
This is different when the combined information of reservoir level and snow cover extent is used to inform the expectation of water availability. We incorporate this additional information by amending the threshold of the reservoir level. This is the solid line in the figure for the months November, February and April. Snow cover is not considered in May as that is too late in the season for snow to be of significance. When snow covers an area larger than the threshold coverage (dashed line in the lower plot), then the original threshold for the reservoir level is used. However, when the snow cover is smaller than the identified threshold, and therefore the future contribution to the reservoir volume from snowmelt is expected to be low, a second, more conservative threshold for the reservoir level is used (solid line). With the second threshold some of the red points incorrectly classified above the original threshold are now classified below the threshold.
The optimised thresholds for the reservoir level were established at 62 hm3 for November, February and April, and 82 hm3 for May; the thresholds for snow cover were set at 25 %, 35 % and 15 % for November, February and April respectively, while the increase in the reservoir level threshold for the years that are below the snow threshold was set at 20 hm3.
6.1.1 Value of additional information for the decisions
The value of information is assessed here in terms of the total and relative benefit for the farmers during the whole period of analysis in each of the information scenarios. Figure 6 shows the total benefits obtained considering the two information scenarios with each of the 10 sets of thresholds. The benefits obtained using the optimised set identified in the previous step is also included (labelled as 62 in the figure). The columns are coloured to show the net benefit in terms of total gain (above 0) or loss (below 0) of each of the years in the period. The black dot represents the net benefit taken over the whole period.
The two reference scenarios are included in the first two columns. These show the net benefits using the uninformed decision and decisions made using perfect information, which are independent of the thresholds.
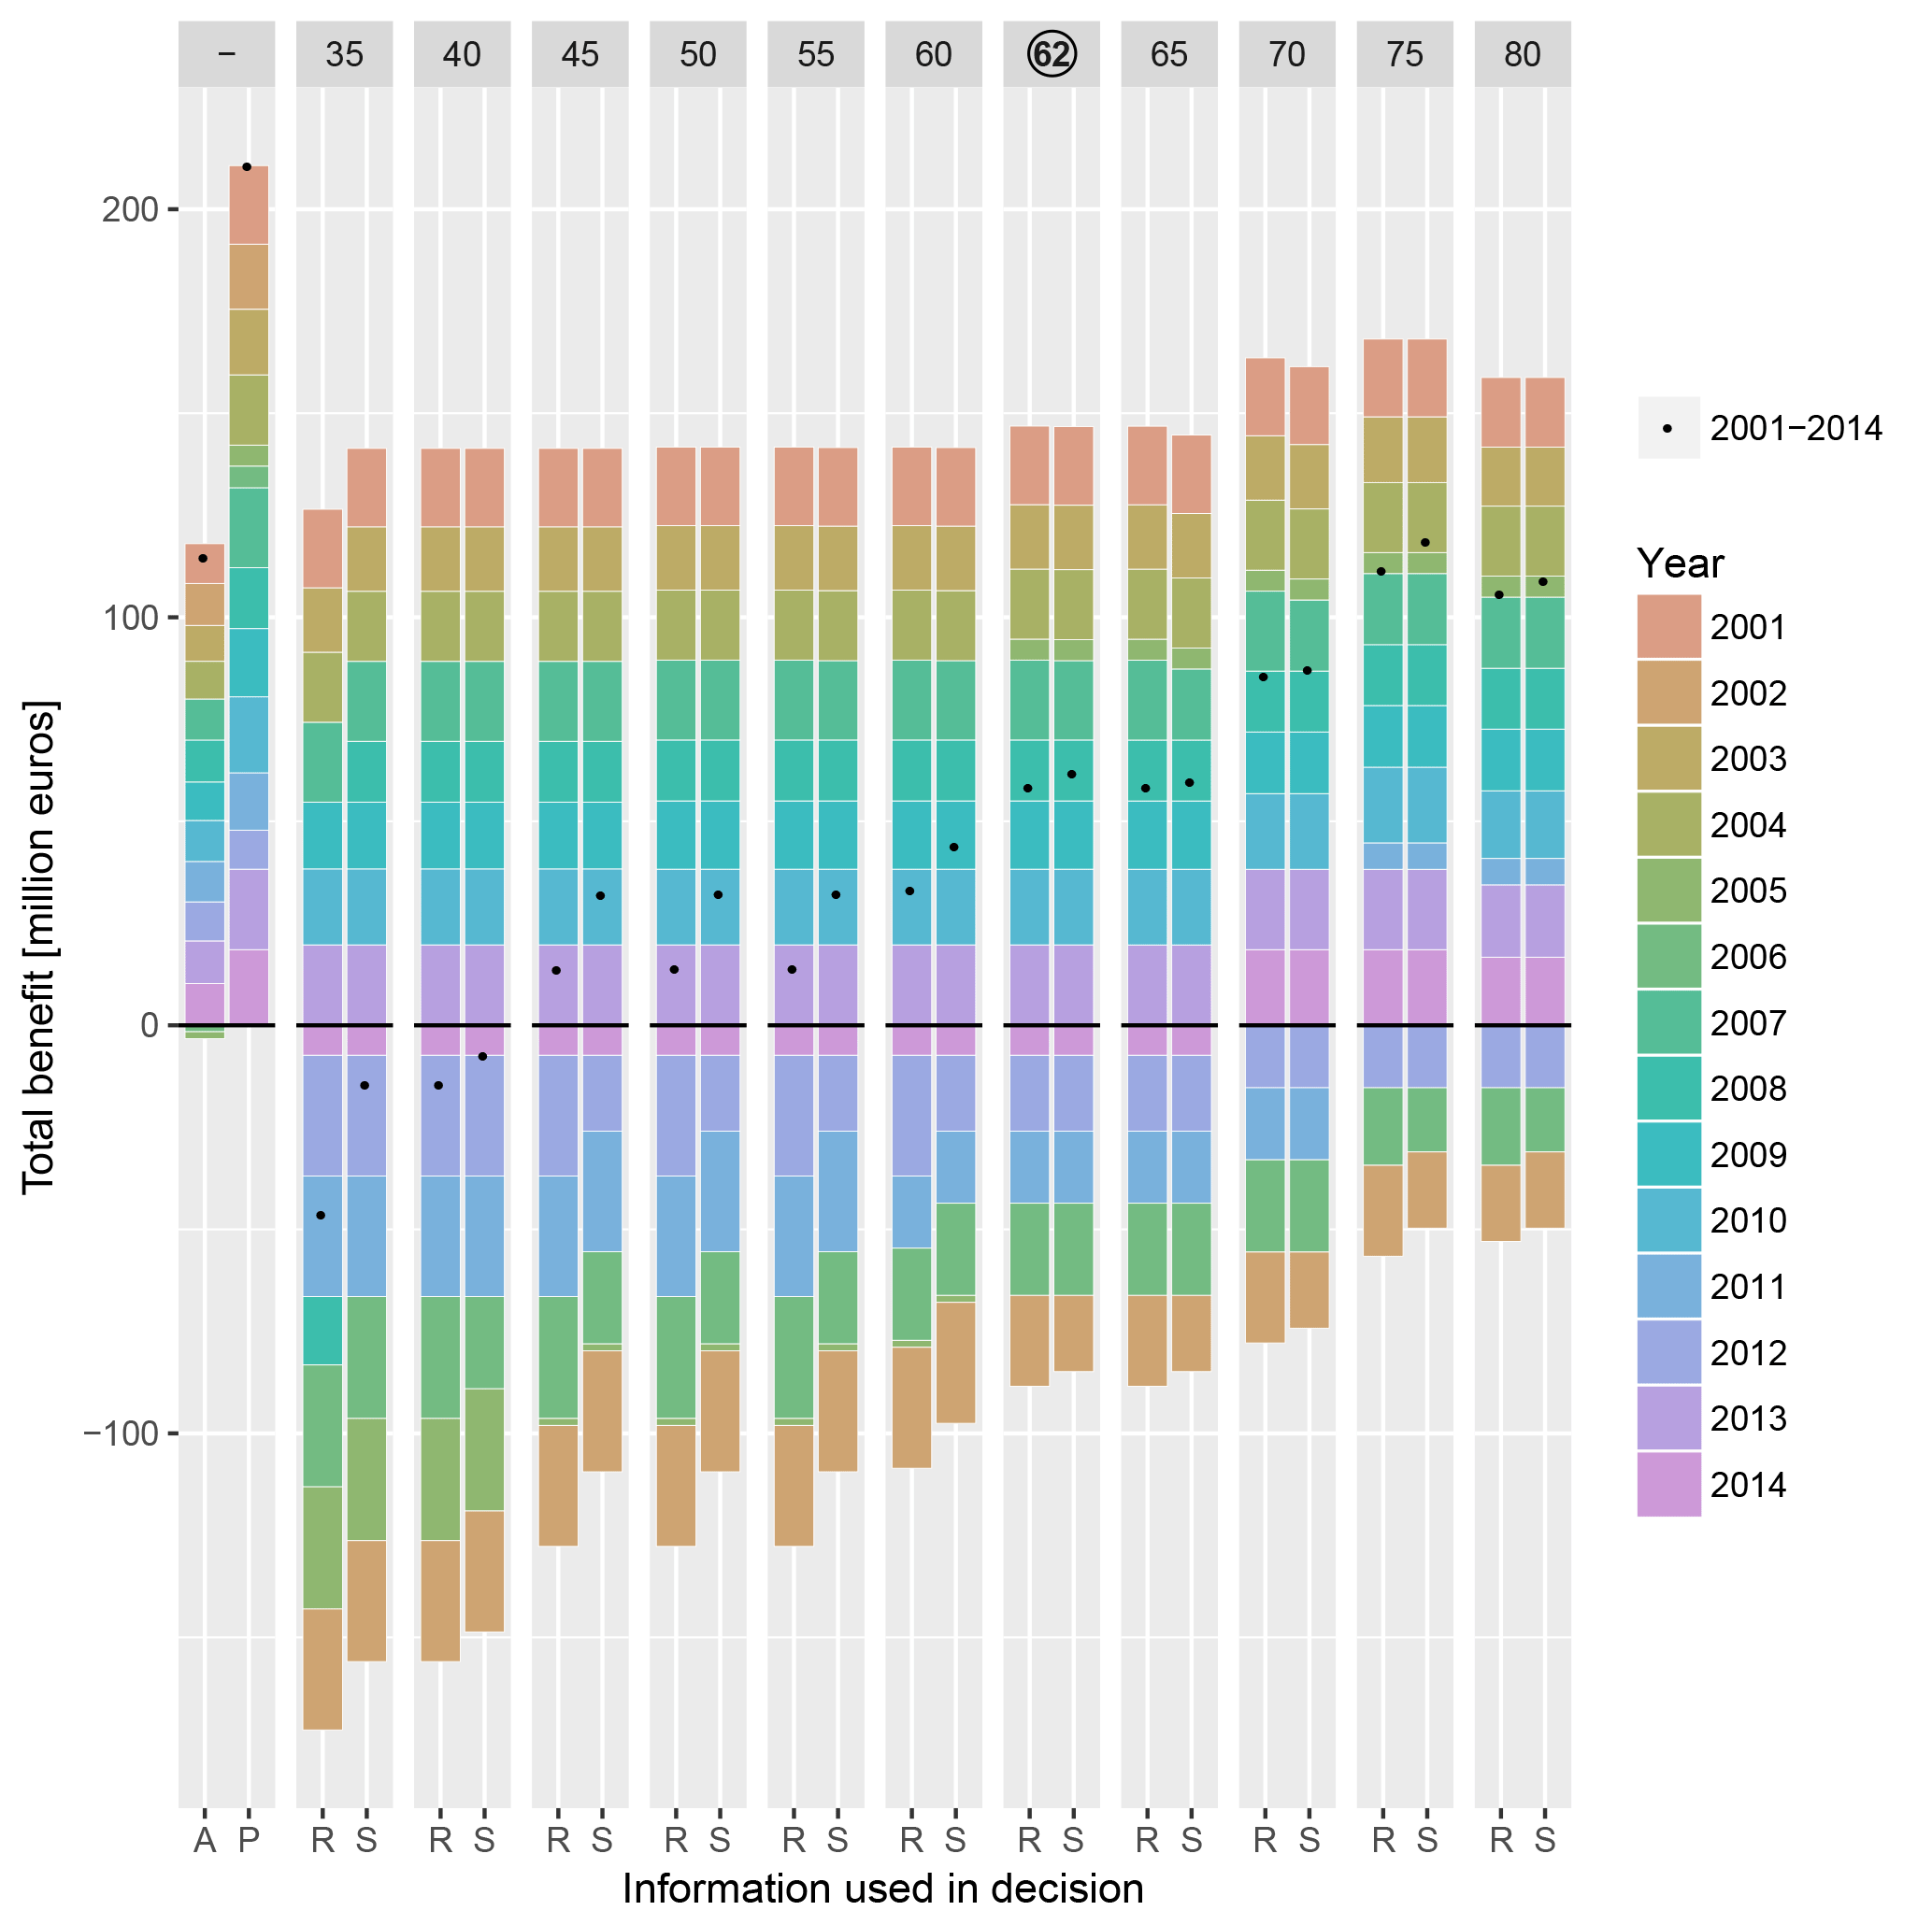
Figure 6Total benefit for decisions informed by reservoir level alone (R) and with the addition of snow information (S) for the 10 sets of thresholds and the optimized thresholds (labelled as 62). The total benefit for uninformed decisions (A) and perfect information (P) is included as a reference. The colours indicate the yearly benefit while the points represent the total benefit for the period (total gains – total losses).
The difference between the perfect information (column labelled P) and the no information (labelled A) reference scenarios shows the potential value of using information, as the use of uncertain information is expected to scale between these two extreme situations. However, as can be seen in the following columns that represent the net benefits of the informed scenarios as a function of the threshold (labelled R for information from reservoir levels only and S for information from both reservoir levels and snow cover), the use of non-perfect information in this case results in losses for some of the years. This is particularly so for the lower thresholds, as water availability is often judged to be good when in fact it is poor.
Figure 7 presents the relative value of the decisions using each of the two tested sources of information with respect to the decisions informed by perfect information and the uninformed decisions (Eq. 1). This shows that the relative values for the total benefits are negative for almost all thresholds, both when using only reservoir levels as well as when also using additional information on snow cover. This means that, for the period as a whole, selecting a course of action based on the expected availability informed by these datasets does not result in higher benefits than when following the path that performs best on average every year. The reason for this lies in the large losses incurred when failing to recognise a poor-availability year and as a consequence planting more than what can be irrigated. This is the case for the years with a negative benefit represented in Fig. 6. These high losses also result in higher thresholds showing a better relative value, since these thresholds lead to more years being regarded as poor-availability years, thus leading to lower areas being planted.

Figure 7Total Relative Value for the period 2001–2014 for decisions informed by reservoir level alone (R) and with the addition of snow information (S) for the 10 sets of thresholds and the optimized thresholds (labelled as 62).
Still, the results show that the additional information does help to reduce the losses in some of the years and for all thresholds a better relative value is obtained when using the additional dataset on snow cover. This can be seen by the net benefit for the period 2001–2014 (represented by black dots in Fig. 6) being higher for all thresholds when the snow-cover information is used.
6.2 Quantifying the effect of additional information
The high losses in some of the years are the result of the limited profit margin between the cost of planting and the selling price of the products. To illustrate further the effect of the profit margin in the decision and the value of information, we have run a series of additional simulations where the costs of planting are reduced by 50 %, 75 % and 100 % (which is the same as zero cost). The relative value of information for these simulations (shown in Fig. 8) indicates there is a gradual increase in the relative value of the informed decisions as the ratio of the benefits from the crop yield to the cost of planting increases. The fully detailed gains and losses for these simulations can be found in the Supplement (Fig. S1). Relative values are still low, however, even when there is no cost for planting. This is because the uninformed decision used as a reference also improves with the reduction in the cost of planting. The course of action that performs better on average, in which the uninformed decision is based, is path 3 for the full reported cost, path 4 for the reduced costs and path 5 when no cost is considered. This means that with lower or no investment costs for planting it is better on average to plant the more water-demanding crops. These results also show that as the ratio between the profit made from the crop yield and the costs of planting increases, the relative value of the informed decisions for the years in which the optimal path is followed is also reduced.
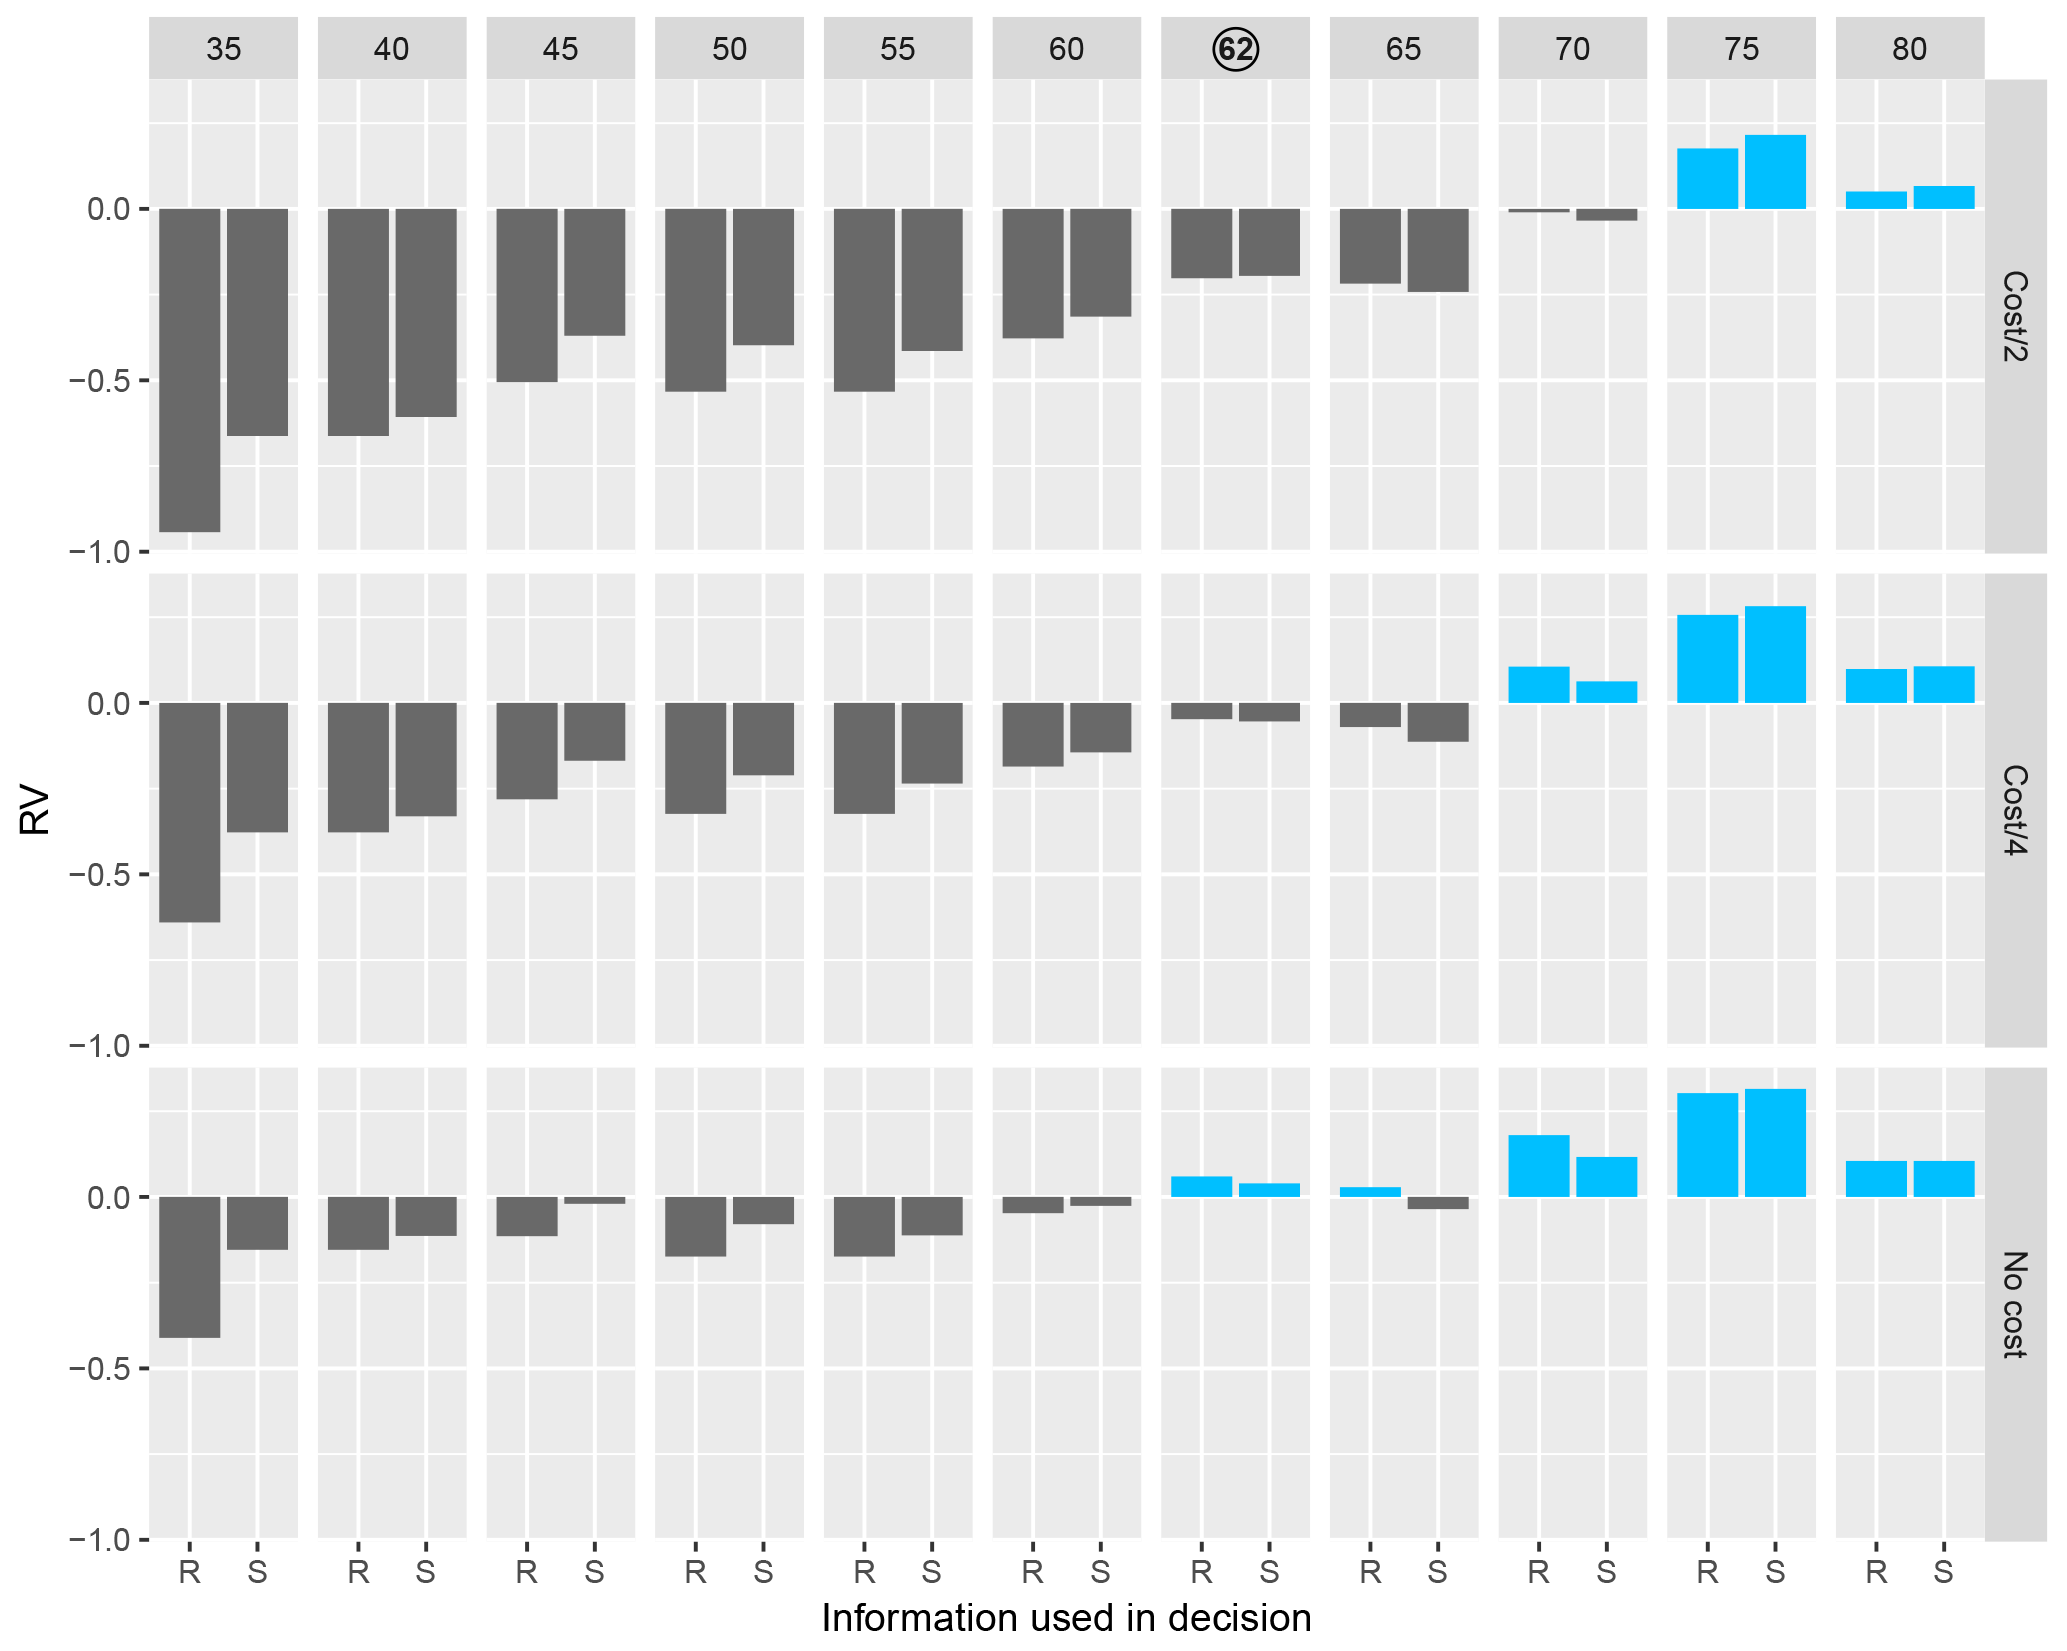
Figure 8Relative value (RV) with different levels of cost for planting for decisions informed by reservoir level alone (R) and with the addition of snow information (S) for the 10 sets of thresholds and the optimized thresholds (labelled as 62).
At the reduced costs it also appears that the added value of the information from snow cover reduces and in some cases is even detrimental, particularly at the higher reservoir level thresholds. This is likely caused by the uncertainty in the relationship between snow cover and available water resources, which will be elaborated further in the discussion.
To answer the question posed in the title on whether users would benefit from additional information on available water resources in drought conditions, we adopt an approach that starts with a stakeholder consultation to be able to understand the decisions users make and how they use information to support those decisions. This is followed by a model of the decisions to quantify how additional information can be used to inform and influence the decision process.
The consultation was performed by semi-structured interviews with key stakeholders. The advantage of this method is that it encourages discussion (Iglesias et al., 2017), although the main limitations are the small sample size, which means that only a partial view is obtained of the plurality of the stakeholders that make these decisions. Despite this limitation, the responses of the interviews provided a detailed description of the possible choices to deal with water shortages in the Ebro basin, and the interaction and feedbacks between water management strategies at basin, irrigation district and local farmer scales. This knowledge was used to build a model of the interrelated decisions of farmers and water managers at the irrigation district scale. The decisions modelled are informed by the expected water availability during the irrigation season, which is currently derived mainly from the reservoir levels. In this case we test the use of additional information of remotely sensed snow cover, as this is information users currently may consider, but further research on the value of different datasets that inform the expectation of the available water resource could be conducted using the model.
7.1 Potential value of additional information
Decisions made with perfect or no information were used as reference cases. The difference in the net benefit between these two cases reveals the potential improvements that information can bring with respect to the uninformed decisions. With perfect information, losses can be avoided in seasons of water scarcity and benefits maximised when enough water is available. It should be noted that the paths for perfect information in the model maximise the benefit of the whole group of farmers, rather than that of individual farmers. In reality, the benefits and losses are not shared by the group, and individual farmers would try to optimise their individual benefit instead, though community collaboration in the form of the established user associations in the basin ensures that to an extent farmers do make decisions that contribute to a common good and the tragedy of the commons does not arise.
The uninformed case follows a conservative approach considering that for every year the available water will be limited. Although this results in high losses being avoided, the benefits are well below the potential. Using additional information to inform decisions is expected to help the decision-makers in characterising each season in terms of the water availability and selecting what and when to plant, and accordingly increasing their benefits. As additional information we test a medium-resolution snow cover product derived through remote sensing. Gascoin et al. (2015) show the value of this product in providing snow cover information at the Pyrenees range scale. Our analysis shows that the information from this product also has value at the basin headwater scale, showing improvements in the decisions made when compared to decisions informed by reservoir levels alone.
Detailed analysis of the years where there is benefit in using the additional information shows that this arises mainly from the reduction in the losses in those years in which the optimal decision to make is more uncertain. In these the years the classification of the water resource as being good or bad is difficult, and the additional information on the snow cover adds value by making it more difficult for a bad year to look good. Losses occur in 2002, 2006, 2011 and 2012 (see Fig. S2 for yearly relative value plots), which match the years for which drought impacts in irrigation agriculture have been reported (Linés et al., 2017). They are the consequence of an inappropriate course of action being chosen, as a result of the expected availability of water being too high, compounded by the high cost of planting relative to the return on investment of the crops planted.
To test the robustness of the observed effect of the additional information, the model was run 10 times with randomly sampled values of snow cover at each of the decision points. The results of these runs (included in Fig. S3) show that the improvement then also follows a more random pattern and in some cases the additional information is detrimental, thus supporting the hypothesis that the improvements in the decisions are indeed caused by the additional information on snow cover.
However, the results of the model indicate that selecting the option that performs better on average, as is done in the uninformed case, leads to higher benefits than when using the information on reservoir levels (either alone or supported by the MODIS snow cover information). This is in contradiction with the current practice, in which the reservoir-level information is used to support the decision and different choices are made each year. One reason that farmers do not follow this strategy may lie in the fact that not all the losses are assumed by the farmers, since there are subsidies for certain crops or for losses incurred in disastrous years. These subsidies are often based on planted surface and influence the ratio between the return from the crop yield and the investment costs incurred when planting. Additionally, the actual farmer decision on what to plant is influenced not only by water availability, but also by the market prices of the crops. Maize has a high cost of production and therefore, when its selling price is low, farmers tend to select other crops with lower production cost (Espluga Trenc, 2016). In the model, however, the planting costs and selling prices were kept constant for all the years to better observe the effect of information on the selection of the crops.
7.2 Effect of the cost of planting on the value of information
The effect of the cost of planting and the profit margins on the usefulness of the information was explored by running the model for different planting costs. Changing the cost of planting modified the course of action both for the informed and uninformed decisions. The reduction in the costs results in higher relative values for the informed decisions for the period as a whole, caused again by the reduction in the net losses. The ratio between the cost of planting and the return on investment on the crop is similar to the cost–loss ratio used in evaluating the benefit of flood warnings (Verkade and Werner, 2011). Where the cost–loss ratio is high, the cost of taking an action in vain (false alarm) is also high, and significant losses may be incurred. This may even result in the information being detrimental, since it does contain uncertainty and may therefore lead to wrong choices being made. Larger losses than if that information is simply ignored and the business-as-usual action is taken may then be incurred. For users with a lower cost–loss ratio, explored here by lowering the cost of planting, additional (uncertain) information becomes increasingly valuable as these users become more tolerant of making a wrong decision. The role of uncertainty in the link between the information used (reservoirs levels and snow) and the realisation of the available water resource is not directly explored in this study through for example a hydrological model, though explicitly considering the uncertainty can add further value to the information. Several authors (Roulin, 2007; Verkade and Werner, 2011) have shown that the value of information from forecasts is always higher when these are probabilistic. In the application presented here, the relation between the reservoir levels and the available water resources is more certain than the relation between the snow cover and the available water. This may also explain the poorer performance when using snow cover information than when using only reservoir levels. This occurs in 2006. In this year the snow cover at the start of the year (February) was exceptionally high, leading to an expectation of good water resource conditions. However, this was due to widespread snowfall at the end of January just before the decision point in February. This snow melted rapidly and the snow cover in April was anomalously low, with low water resource availability for the rest of the season.
7.3 Value of the information for the different types of farmers
The value of the additional information is not equal to each of the different types of farmers identified. The additional information on the expected water resource provided by the snow cover is found to be relevant only to the decisions that are made in February. For the technified farmers the information is therefore of little value, as the main decisions made by them fall in November and in May, respectively, before the snow accumulation period and after the snowmelt period.
For the small-scale farmers, the additional information can be relevant for the decisions that are made when there is snow cover, primarily those made in February, but also those made in April. These small-scale farmers have only one crop. Once a decision is made to plant a crop, there is no further value to information as there is no further decision to be made. However, the benefit is again not evenly distributed. Small-scale farmers were divided here into three groups of decreasing risk averseness (R1, R2 and R3). We find that the additional information benefits the group of farmers that is willing to take more risk most. These are the farmers that decide to take the risk to wait for a possible improvement when the water availability is classified as not being good at the decision point, instead of taking the safe bet and securing a crop by planting a barley crop, which does not depend on irrigation and possible curtailments. The most risk-averse small-scale farmers (R1) do not even wait for any information on water availability and already plant barley in November. For them there is no value in the additional information. For the slightly less risk-averse farmers (R2) there is limited value in the additional information. If in January the water resource situation is expected to be good, then they will choose to plant maize, but at the first sign of it being bad they will forfeit the possible higher profits from maize and opt to take the safe bet by planting barley. The most risk-acceptant small-scale farmers benefit the most from the additional information, as it will help them make the choice between taking the gamble of waiting for the water resource availability to become better so that they can plant maize, or plant a cereal to avoid the risk of having to leave the land fallow if it does not. In this case these results show that the additional information may be beneficial to improved equity across the farmers in the irrigation district as it is most beneficial to small-scale farmers, provided they are willing to take a gamble to improve their benefits.
In this paper we model the distribution of risk averseness using only a simple percentile distribution. A more realistic distribution of risk averseness can be developed using for example the constant absolute risk aversion utility function (Matte et al., 2017; Quiroga et al., 2011), though this will require extensive survey data to determine how risk averseness is distributed among farmers.
An approach that combines stakeholder consultation and decision modelling was followed, allowing a comprehensive analysis of the role of information on drought management decisions in the area. Consultation with the different decision-makers in the Ebro basin provided useful insight into the operational decisions they make in managing water resources when scarce, and their information needs and use. This allowed us to identify the courses of action available to the farmers and water managers, and to analyse their choices as a function of the information they have available to them. Feedbacks between the decisions made by farmers and the reservoir operators at irrigation district level were identified: curtailments imposed at irrigation district level as a result of water scarcity influences the decision farmers make on the planting of crops, which in turn influence demand and consequently water scarcity.
Based on the findings of the consultation, a decision model representing these interrelated decisions was built with the aim of quantifying the effect of additional information on the decisions. The modelled decisions, which consider the allocation of water, are taken based on the expected availability of water during the irrigation season. This is currently informed primarily by observed reservoir-level data. When levels are above a defined threshold at the time of the decision, water resources availability is classified as good, whereas when levels are below the threshold and expected demand is high it is classified as poor and curtailments to water allocations are applied. Farmers decide on the crop to be planted based on their expectation of water resources availability, and whether curtailments are in force. The decision model was then extended from considering only reservoir levels to include additional information on snow cover in the basin headwaters obtained from MODIS remote sensing data to inform the expectation of water resources availability.
Our simulations with the decision model show the additional information can contribute to better decisions and ultimately to higher benefits for the farmers. However, the ratio between the cost of planting and the market value of the crop proved to be a critical aspect in determining the best course of action to be taken and the value of the (additional) information. When there is little room for error due to small margins, then any information used to inform the decision may even be detrimental to any benefits being made. However, even in this case the additional information on snow cover can provide benefit over using the reservoir levels alone. Tests with reduced planting costs, and thus increasing margins, does lead to a higher benefit when using the additional information from snow cover. Nevertheless uncertainty in the relationship between good snow cover and water resource availability may lead to overestimation of the expected resources and consequent losses.
A key finding of our research is that farmers can benefit when the operational decisions they make consider the additional information. To what extent they benefit does, however, depend to a great extent to their level of risk averseness. Risk-averse farmers will decide to take the safe option early on, with information on the available water resource then having no value. Farmers that are less risk averse do benefit as the information helps them weigh the options between planting a crop with a higher return or having to leave the land fallow.
All in situ and remote sensing data used in this research are openly available. The sources are mentioned in Sect. 5.1. The crop models, Aquacrop-OS and Cropwat, are open-source and available from http://aquacropos.com/download-2/ (last access: 12 November 2018) and http://www.fao.org/land-water/databases-and-software/cropwat/en/ (last access: 12 November 2018) respectively. The code for the decision model may be made available by request to the corresponding author.
The supplement related to this article is available online at: https://doi.org/10.5194/hess-22-5901-2018-supplement.
CL, AI, LG and MW conceived the idea and designed the analysis. CL, AI, LG and VS performed the interviews. CL developed the model, performed the analysis and prepared the paper with advice and contributions from all authors.
The authors declare that they have no conflict of interest.
The authors would like to thank CHE, CAyC and Raimat for their collaboration in the consultation phase of this research.
This research received funding from the European Union Seventh Framework
Programme (FP7/2007–2013) under grant agreement no. 603608, “Global Earth
Observation for integrated water resource assessment”: eartH2Observe. This
work is a contribution to the Hymex Drought and Water Resources Science
Team.
Edited by: Hilary McMillan
Reviewed by: two anonymous referees
Aragon Statistics Institute: Precios anuales promedio percibidos en la venta de productos agrarios, por los agricultores y ganaderos, C.A. Aragón. Años 1990–2013 (Mean annual prices received for the sale of agricultural products by farmers. Aragon 1990–2013), available at: http://www.aragon.es/DepartamentosOrganismosPublicos/Institut% os/InstitutoAragonesEstadistica/AreasTematicas/10_Precios/ci.08_Precios_agrari% os.detalleDepartamento (last access: 12 November 2018), 2015. a
Bouma, J. A., van der Woerd, H. J., and Kuik, O. J.: Assessing the value of information for water quality management in the North Sea, J. Environ. Manag., 90, 1280–1288, https://doi.org/10.1016/j.jenvman.2008.07.016, 2009. a, b
Bouma, J. A., Kuik, O., and Dekker, A. G.: Assessing the value of Earth Observation for managing coral reefs: An example from the Great Barrier Reef, Sci. Total Environ., 409, 4497–4503, https://doi.org/10.1016/j.scitotenv.2011.07.023, 2011. a
Brown, B. G., Katz, R. W., and Murphy, A. H.: On the economic value of seasonal-precipitation forecasts: The fallowing/planting problem, B. Am. Meteorol. Soc., 67, 833–841, 1986. a
Carr, G., Potter, R. B., and Nortcliff, S.: Water reuse for irrigation in Jordan: Perceptions of water quality among farmers, Agr. Water Manage., 98, 847–854, https://doi.org/10.1016/j.agwat.2010.12.011, 2011. a
Casterad Seral, M.: Aplicaciones basadas en tecnologías de la información geográfica para ayudar a gestionar el agua de riego en comunidades de regantes (Applications based on geographic information technologies to support irrigation water management by irrigation associations), in: Análisis espacial y representación geográfica: innovación y aplicación, edited by: de la Riva, J., Ibarra, P., Montorio, R., and Rodrigues, M., Universidad de Zaragoza-AGE, Zaragoza, 571–580, 2015. a
CHE: Plan Especial de Actuación en Situaciones de Alerta y Eventual Sequía en la Cuenca Hidrográfica del Ebro (Special plan for alert conditions and potential drought in the Ebro basin), Tech. rep., Confederación Hidrográfica del Ebro, 2007. a
CHE: Plan Hidrológico de la parte española de la demarcación hidrográfica del Ebro 2015–2021 (Hidrological Plan for the Spanish part of the Ebro hydrographical demarcation 2015–2021), Tech. rep., Confederación Hidrográfica del Ebro, 2015. a
CHE: Portal de CHEbro, available at: http://www.chebro.es/, last access: 13 November 2018. a
Espluga Trenc, J.: What is happening with transgenic maize? (Qué está pasando con el cultivo de maíz transgénico?), Soberanía alimentaria, 26, 34–38, 2016. a, b, c
Famiglietti, J., Cazenave, A., Eicker, A., Reager, J., Rodell, M., Velicogna, I., Fekete, B. M., Robarts, R. D., Kumagai, M., Nachnebel, H.-P., Odada, E., and Zhulidov, A. V.: Watching water: From sky or stream?, Science, 349, 684–686, https://doi.org/10.1126/science.349.6249.684-a, 2015. a
FAO: CROPWAT 8.0, available at: http://www.fao.org/land-water/databases-and-software/cropwat/en/ (last access: 12 November 2018), 2000. a
Fernández-Prieto, D., van Oevelen, P., Su, Z., and Wagner, W.: Editorial “Advances in Earth observation for water cycle science”, Hydrol. Earth Syst. Sci., 16, 543–549, https://doi.org/10.5194/hess-16-543-2012, 2012. a
Foster, T., Brozović, N., Butles, A., Neale, C., Raes, D., Steduto, P., Fereres, E., and Hsiao, T. C.: AquaCrop-OS: An open source version of FAO's crop water productivity model, Agr. Water Manage., 181, 18–22, https://doi.org/doi.org/10.1016/j.agwat.2016.11.015, 2017. a
Gascoin, S., Hagolle, O., Huc, M., Jarlan, L., Dejoux, J.-F., Szczypta, C., Marti, R., and Sánchez, R.: A snow cover climatology for the Pyrenees from MODIS snow products, Hydrol. Earth Syst. Sci., 19, 2337–2351, https://doi.org/10.5194/hess-19-2337-2015, 2015. a
Gil Martínez, M.: Cebada y maíz rastrojero. Productividad económico-ambiental de la fertilización con purín (Barley and maize. Economic and environmental productivity of fertilisation with liquid manure), Informaciones técnicas 245, Gobierno de Aragón. Departamento de Agricultura, Ganadería y Medio Ambiente. Dirección General de Alimentación y Fomento Agroalimentario. Servicio de Recursos Agrícolas, Zaragoza (Spain), 2013. a, b
Gutiérrez López, M.: Orientaciones varietales para las siembras de cereales en Aragón. Resultado de los ensayos. Cosecha 2011 (Guidance on crop varieties for cereal cultivation in Aragón. Trial results. Season 2011), Informaciones Técnicas 230, Diputación General de Aragón. Departamento de Agricultura y Alimentación. Dirección General de Desarrollo Rural, Servicio de Programas Rurales, Zaragoza (Spain), 2011. a
Gutiérrez López, M.: Transferencia de resultados de la red de ensayos de maíz y girasol en Aragón. Campaña 2015. (Transfer of results from the maize and sunflower trial network in Aragón. Season 2015), Informaciones Técnicas 259, Gobierno de Aragón. Departamento de Desarrollo Rural y Sostenibilidad. Dirección General de Desarrollo Rural. Servicio de Innovación y Transferenca Agroalimentaria, Zaragoza (Spain), 2016. a
Harrell, M. C. and Bradley, M. A.: Data collection methods. Semi-structured Interviews and focus groups, Tech. rep., RAND, Santa Monica, CA (US), 2009. a
Hernández-Mora, N., Gil, M., Garrido, A., and Rodríguez-Casado, R.: La sequía 2005–2008 en la cuenca del Ebro. Vulnerabilidad, Impactos y Medidas de Gestión, Tech. rep., Universidad Politécnica de Madrid – Centro de Estudios e Investigación para la Gestión de Riesgos Agrarios y Medioambientales – CEIGRAM, 2013. a
Iglesias, A., Sánchez, B., Garrote, L., and López, I.: Towards Adaptation to Climate Change: Water for Rice in the Coastal Wetlands of Doñana, Southern Spain, Water Resour. Manag., 31, 629–653, https://doi.org/10.1007/s11269-015-0995-x, 2017. a
Linés, C., Werner, M., and Bastiaanssen, W.: The predictability of reported drought events and impacts in the Ebro Basin using six different remote sensing data sets, Hydrol. Earth Syst. Sci., 21, 4747–4765, https://doi.org/10.5194/hess-21-4747-2017, 2017. a, b
Lloveras, J., Martínez, E., and Santiveri, P.: Influencia de la fecha de siembra en el maíz en los regadíos del Valle del Ebro (Influence planting date on maize crops in the irrigated areas of the Ebro Valley), Tech. Rep. 36, Agrotecnio. Universidad de Lleida, Lleida (Spain), 2014. a, b
Macauley, M. K.: The value of information: Measuring the contribution of space-derived earth science data to resource management, Space Policy, 22, 274–282, https://doi.org/10.1016/j.spacepol.2006.08.003, 2006. a, b
MAGRAMA: Resultados técnico-económicos de Cultivos Herbáceos 2014 (Tecnichal-economical results of herbaceous crops 2014), Tech. rep., Subdirección General de Análisis, Prospectiva y Coordinación, Subsecretaría, Ministerio de Agricultura, Alimentación y Medio Ambiente, Spain, 2015. a, b
Matte, S., Boucher, M.-A., Boucher, V., and Fortier Filion, T.-C.: Moving beyond the cost-loss ratio: economic assessment of streamflow forecasts for a risk-averse decision maker, Hydrol. Earth Syst. Sci., 21, 2967–2986, https://doi.org/10.5194/hess-21-2967-2017, 2017. a, b
McMillan, H., Montanari, A., Cudennec, C., Savenije, H., Kreibich, H., Krueger, T., Liu, J., Mejia, A., Van Loon, A., Aksoy, H., Di Baldassarre, G., Huang, Y., Mazvimavi, D., Rogger, M., Sivakumar, B., Bibikova, T., Castellarin, A., Chen, Y., Finger, D., Gelfan, A., Hannah, D. M., Hoekstra, A. Y., Li, H., Maskey, S., Mathevet, T., Mijic, A., Pedrozo Acuña, A., Polo, M. J., Rosales, V., Smith, P., Viglione, A., Srinivasan, V., Toth, E., van Nooyen, R., and Xia, J.: Panta Rhei 2013–2015: global perspectives on hydrology, society and change, Hydrolog. Sci. J., 61, 1174–1191, https://doi.org/10.1080/02626667.2016.1159308, 2016. a
Mylne, K. R.: Decision-making from probability forecasts based on forecast value, Meteor. Appl., 9, 307–315, 2002. a
O'Keeffe, J., Buytaert, W., Mijic, A., Brozović, N., and Sinha, R.: The use of semi-structured interviews for the characterisation of farmer irrigation practices, Hydrol. Earth Syst. Sci., 20, 1911–1924, https://doi.org/10.5194/hess-20-1911-2016, 2016. a
Onoda, M. and Young, O. R. (Eds).: Satellite Earth Observations and their impact on society and policy, Springer Open, Singapore, 2017. a
Pérez y Pérez, L. and Barreiro-Hurlé, J.: Assessing the socio-economic impacts of drought in the Ebro River Basin, Span. J. Agric. Res., 7, 269–280, 2009. a
Quintilla, R., Portero, C., and Casterad, M.: Apoyo a la gestión del agua en alta en la zona regable del Canal de Aragón y Cataluña con teledetección (Remote sensing support to reservoir water management in Canal de Aragón y Cataluña irrigated area), in: Proceedings of the XXXII Congreso Nacional de Riegos, Madrid, p. 9, 2014. a
Quiroga, S., Garrote, L., Iglesias, A., Fernández-Haddad, Z., Schlickenrieder, J., de Lama, B., Mosso, C., and Sánchez-Arcilla, A.: The economic value of drought information for water management under climate change: a case study in the Ebro basin, Nat. Hazards Earth Syst. Sci., 11, 643–657, https://doi.org/10.5194/nhess-11-643-2011, 2011. a, b, c
R Core Team: R: A language and environment for statistical computing, available at: https://www.R-project.org/ (last access: 12 November 2018), 2016. a
Roulin, E.: Skill and relative economic value of medium-range hydrological ensemble predictions, Hydrol. Earth Syst. Sci., 11, 725–737, https://doi.org/10.5194/hess-11-725-2007, 2007. a, b
Sivapalan, M., Savenije, H. H. G., and Blöschl, G.: Socio-hydrology: A new science of people and water, Hydrol. Process., 26, 1270–1276, https://doi.org/10.1002/hyp.8426, 2012. a
Stanski, H. R., Wilson, L. J., and Burrows, W. R.: Survey of common verification methods in meteorology, Research report MSRB 89-5, Atmospheric Environment Service, Downsview, Ontario (Canada), 1989. a
Van Loon, A. F., Gleeson, T., Clark, J., Van Dijk, A. I., Stahl, K., Hannaford, J., Di Baldassarre, G., Teuling, A. J., Tallaksen, L. M., Uijlenhoet, R., Hannah, D. M., Sheffield, J., Svoboda, M., Verbeiren, B., Wagener, T., Rangecroft, S., Wanders, N., and van Lanen, H. A. J.: Drought in the Anthropocene, Nat. Geosci., 9, 89–91, 2016. a
Verkade, J. S. and Werner, M. G. F.: Estimating the benefits of single value and probability forecasting for flood warning, Hydrol. Earth Syst. Sci., 15, 3751–3765, https://doi.org/10.5194/hess-15-3751-2011, 2011. a, b, c
Wilks, D. S. and Murphy, A. H.: A decision-analytic study of the joint value of seasonal precipitation and temperature forecasts in a choice-of-crop-problem, Atmos. Ocean, 24, 353–368, https://doi.org/10.1080/07055900.1986.9649257, 1986. a
Williamson, R. A., Hertzfeld, H. R., Cordes, J., and Logsdon, J. M.: The socioeconomic benefits of Earth science and applications research: reducing the risks and costs of natural disasters in the USA, Space Policy, 18, 57–65, 2002. a
Zhu, Y., Toth, Z., Wobus, R., Richardson, D., and Mylne, K.: The economic value of ensemble-based weather forecasts, B. Am. Meteorol. Soc., 83, 73–83, 2002. a