the Creative Commons Attribution 3.0 License.
the Creative Commons Attribution 3.0 License.
Evaluation of uncertainties in mean and extreme precipitation under climate change for northwestern Mediterranean watersheds from high-resolution Med and Euro-CORDEX ensembles
Antoine Colmet-Daage
Emilia Sanchez-Gomez
Sophie Ricci
Cécile Llovel
Valérie Borrell Estupina
Pere Quintana-Seguí
Maria Carmen Llasat
Eric Servat
The climate change impact on mean and extreme precipitation events in the northern Mediterranean region is assessed using high-resolution EuroCORDEX and MedCORDEX simulations. The focus is made on three regions, Lez and Aude located in France, and Muga located in northeastern Spain, and eight pairs of global and regional climate models are analyzed with respect to the SAFRAN product. First the model skills are evaluated in terms of bias for the precipitation annual cycle over historical period. Then future changes in extreme precipitation, under two emission scenarios, are estimated through the computation of past/future change coefficients of quantile-ranked model precipitation outputs. Over the 1981–2010 period, the cumulative precipitation is overestimated for most models over the mountainous regions and underestimated over the coastal regions in autumn and higher-order quantile. The ensemble mean and the spread for future period remain unchanged under RCP4.5 scenario and decrease under RCP8.5 scenario. Extreme precipitation events are intensified over the three catchments with a smaller ensemble spread under RCP8.5 revealing more evident changes, especially in the later part of the 21st century.


The IPCC SRES report (IPCC, 2012) concludes with an increase in the frequency of heavy precipitation episodes over most areas of the globe at the end of 21st century. In particular, northwestern Mediterranean regions are often affected by extreme precipitation events that generate flash floods and cause serious damage (Ricard et al., 2012; Gaume et al., 2016). This climatically homogeneous region (Metzger et al., 2005) has been identified as a hotspot of climate change (CC) in the form of possible amplification of extreme precipitation associated with a decrease in total precipitation (Gao et al., 2006; Giorgi, 2006; Giorgi and Lionello, 2008; Milano et al., 2013). Assessing the impacts of regional climate change on precipitation is necessary in order to help and support policy makers develop strategies for future hydrological vulnerabilities like flash floods, but it constitutes a major challenge.
Global climate models (GCMs) are powerful tools to assess global-scale climate variability and change. GCMs have allowed for better understanding of interactions between the different components of the climate system (e.g., atmosphere, ocean, sea ice, continents). However GCMs generally operate at coarse horizontal resolutions (100–250 km in the atmospheric component); hence, they are not appropriate for investigating the hydrological impacts of future extreme precipitation events at local scale, such as over hydrological watersheds that are as small as hundreds of kilometers.
Interest in better representing climate variability and change at local scales has driven the development of regional climate models (RCMs), which are currently able to perform dynamical downscaling of GCM at very high horizontal resolutions (∼ 10 km). RCMs run on limited area domains thereby allowing increased spatial resolution, and thus enabling better representation of surface heterogeneities and mesoscale atmospheric processes like convection (Fowler et al., 2007a). At European scale, collaborative research projects such as MERCURE (Hagemann et al., 2004), PRUDENCE (Christensen et al., 2007), NARCCAP (Paulsen et al., 2009) and ENSEMBLES (van der Linden and Mitchell, 2009) have contributed to further development and improvement of regional modeling. More recently, the international CORDEX (Coordinated Regional Climate Downscaling Experiment) initiative (Giorgi et al., 2009) has provided multi-model regional climate simulations at very high spatial resolution over different regions in the world. In particular, for the northwestern Mediterranean region, the EuroCORDEX and MedCORDEX sub-projects (EMCORDEX hereinafter) have produced present and future climate simulations at 12 km resolution.
The merits of increased spatial resolution in RCMs have largely been assessed in the literature. Comprehensive evaluations of RCMs have been undertaken over the Euro-Mediterranean region by applying evaluation metrics to mean values of precipitation (Déqué and Somot, 2010; Fisher et al., 2012; Jacob et al., 2007; Kjellström et al., 2010; Kotlarski et al., 2005) as well as focusing on extreme precipitation associated with hydrological floods (Frei et al., 2006; Fowler et al., 2007b; Herrera et al., 2010; Kyselỳ et al., 2012; Maraun et al., 2012). For recent EMCORDEX models, initial evaluations over past periods have been conducted over Europe (Drobinski et al., 2016; Katragkou et al., 2015; Kotlarski et al., 2014). The latter evaluations mainly focused on mean and extreme precipitation over the whole EMCORDEX domain or in large regional boxes (e.g., France, the Alps, Mediterranean coastal regions, Morocco) using sparse observation data sets. Prein et al. (2016) highlighted that the added value of high-resolution models (12.5 km versus 50 km) for the simulated mean and extreme precipitation due to improved representation of orography and large-scale convection. Indeed, Drobinski et al. (2016) show the higher ability of high-resolution RCMs to reproduce the Clausius–Clapeyron relation and thus precipitation-related processes. In the context of climate change, Jacob et al. (2013) show that future climate projections performed by high-resolution (12.5 km) scenario under the Representative Concentration Pathways 4.5 and 8.5 (RCP4.5 and RCP8.5, respectively) project higher daily precipitation intensities than GCMs, in particular for RCP8.5. These results are consistent with the conclusions of Giorgi et al. (2016) over the Alps. Even though both GCM and RCM scenario experiments project a reduction of summer precipitation over the Alps, increased convective rainfall due to enhanced potential instability related to a finer representation of the orography over the Alps is found in RCMs.
Together with increasing model resolution, high-resolution observation-based products have also been recently developed over different Mediterranean countries. Moving from CRU product at 50 km resolution (Harris et al., 2014) to E-OBS product at 25 km resolution (Haylock et al., 2008), reanalysis such as SAFRAN (Système d'Analyse Fournissant des Renseignements Atmosphériques à la Neige; Durand et al., 1993; Quintana-Seguí et al., 2008) or interpolated products such as SPAIN02 (Herrera et al., 2012, 2016) now provide precipitation products at a resolution comparable to those of the RCMs. In particular, the SAFRAN data set available over France (Quintana-Seguí et al., 2008; Vidal et al., 2010) and Spain (Quintana-Seguí et al., 2016a, b) comprises a much larger observed data network than E-Obs or ERA-Interim (Dee et al., 2011), which were previously used for EMCORDEX model assessment (Cavicchia et al., 2016; Kotlarski et al., 2014). The SAFRAN-France data set was used together with downscaled products issued from CMIP5 (Coupled Model Intercomparison Phase 5) to assess future hydrological changes over France (Dayon, 2015; Quintana-Seguí et al., 2010, 2011). Themeßl et al. (2011) provide a review of downscaling methods. This implies systematic bias correction of model precipitation before being used as input for hydrological models, for instance in the framework of future flash flood simulation. Harader (2015) used the regional model ALADIN5.2 outputs at 12 km resolution from CORDEX as well as SAFRAN-France product to describe future flash flood events over the Lez catchment using a “futurization” method described in the following.
The present study focuses on extreme precipitation over mesoscale northwestern Mediterranean watersheds with complex orography. Three watersheds of various sizes are investigated here: Lez and Aude located in southern France, and Muga, located in northeastern Spain. The goals of this study are as follows:
-
to assess RCM skills from the EMCORDEX multi-model ensemble in terms of mean and extreme precipitation values over past periods;
-
to assess the influence of GCMs' lateral boundaries condition on the RCMs' skills;
-
to evaluate future changes in precipitation extremes for further simulations of flash floods with an event-based hydrological model over future periods.
For this purpose, the futurization approach proposed by Harader (2015) is used. This method utilizes the computation of a past/future change coefficients of quantile-ranked RCM precipitation outputs. Each multiplicative coefficient is then applied to each quantile-ranked short-term observed precipitation event. It should be noted that the quantile-ranked observed precipitation is computed from SAFRAN daily precipitation that have generated flash floods. The futurization method is applied for each RCM in the EMCORDEX ensembles, forced by two emission scenarios (RCP4.5 and RCP8.5). We thus explicitly take into account climate model-related uncertainty. In further work, the “futurized” precipitation events will be used with different hydrological models, so that we explicitly take into account hydrology model-related uncertainty.
The paper is organized as follows, Sect. 2 includes a brief presentation of the EMCORDEX simulations, the reference data sets and the statistical metrics applied to seasonal mean and extreme precipitation values. Section 3 presents the RCM evaluation in terms of mean and extreme precipitation values over the present period when the global scale is prescribed by ERA-Interim. Section 4 analyzes present climate simulations to understand the role of the GCMs in driving the RCMs. The impacts of climate change on precipitation are then examined in Sect. 5. Conclusions and perspectives are finally given in Sect. 6.
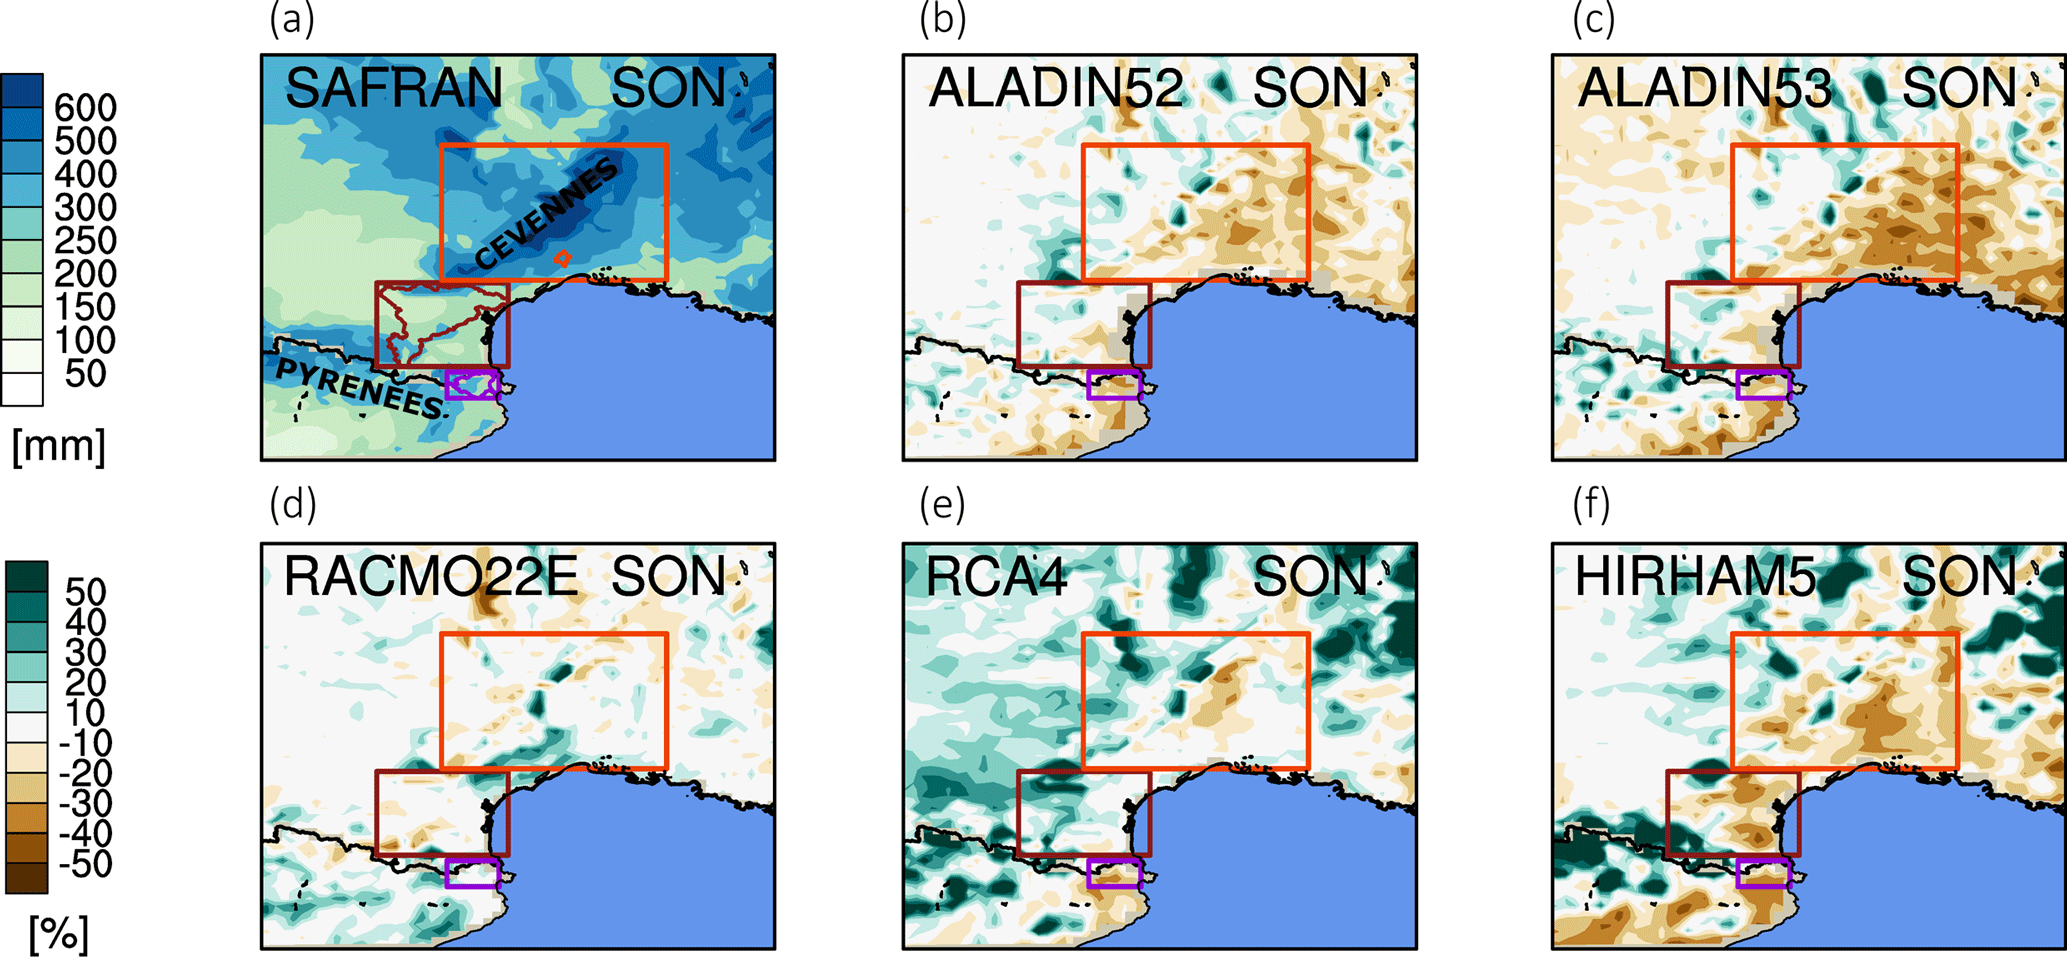
Figure 1Mean relative seasonal precipitation bias (%) in all the RCMs forced with ERA-Interim for the period 1981–2010. The top left panel shows the horizontal pattern of seasonal precipitation provided by the SAFRAN reference data set (mm season −1). Only the September–October–November (SON) season is shown here. On the SAFRAN map (a), the colored rectangles represent the regional boxes, while the outline represents the hydrological catchment. The Cevennes box and the Lez catchment are in red, the Aude box and catchment in brown, and the Muga box and catchment in purple.
2.1 The river catchments
In the current study, the futurization approach is applied over three Mediterranean watersheds with different characteristics and external influences. The Lez, Aude and Muga catchments displayed in Fig. 1 are frequently subject to flash floods that cause considerable damage to surrounding areas and cities.
The upstream part of the Lez watershed, shown in red in Fig. 1, is located 15 km north of the city of Montpellier and covers 114 km2. The landscape is dominated by garrigue vegetation, very common in the Mediterranean countries. The spring of the Lez River is the resurgence of a karstic aquifer of about 380 km2. The karst aquifer plays an important role in water resources in the basin, and the karst outcrops actively participate in flash flood dynamics (Raynaud et al., 2016). Cumulative annual rainfall is around 909 mm, which, on average, falls 60 days per year (Coustau, 2011; Harader, 2015). The Lez catchment is frequently subject to flash floods caused by extreme precipitation episodes regionally known as the “Cévenols” events (Ducrocq et al., 2008; Nuissier et al., 2008, 2011). Cumulative extreme precipitation can locally reach 600 mm in 24 h within the river catchment (Boudevillain et al., 2011).
The Aude watershed, shown in brown in Fig. 1, covers more than 5000 km2 upstream the nearby city of Narbonne. The Aude River springs at the Pyrenees and flows along the catchment for 223 km before entering the Mediterranean Sea. The Orbieu and the Fresquel are its major tributaries. The Aude catchment is surrounded by several mountain chains such as the Cevennes massif to the north and the Pyrenees to the south. The catchment is mainly dominated by a Mediterranean climate, but large climate contrasts can be found over its sub-watersheds. A severe flash flood episode occurred in November 1999 (more than 200 mm of rain in 24 h over a major part of the catchment) and caused severe damage over an extended region (Aude, Tarn, Pyrénées Orientales, Hérault; Estupina, 2004; Bechtold and Bazille, 2001; Ducrocq et al., 2003; Gaume et al., 2004).
Finally, the Muga catchment (shown in purple in Fig. 1) located in northeastern Spain over Catalonia covers 854 km2. The Muga River is about 58 km long, between the Pyrenees (maximum altitude of the catchment, 1214 m) and the Gulf of Roses. This catchment is usually affected by heavy precipitation associated with convective events, with annual precipitation average between 700 mm in the upper part and 530 mm at the mouth, and daily precipitation of 200 mm for return period of 10 years (Llasat et al., 2009, 2014). The previously mentioned November 1999 flash flood event led to a historical peak discharge recorded near the mouth of the Muga River, with 925 m3 s−1 compared to an average value of 3.34 m3 s−1. The Muga catchment was affected by 26 severe flood events between 1982 and 2010 (Llasat et al., 2014).
It should be noted that, in this paper, statistical analysis is carried out over the Lez, Aude and Muga catchment areas as well as over more extended regional boxes also displayed in Fig. 1.
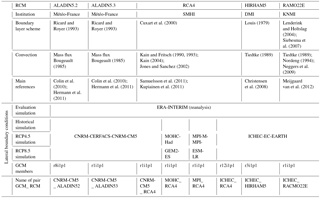
Table 1The parameterization and physics scheme related to the RCM (0.11∘) used in the present study are presented in the five first lines. The lateral boundary conditions (LBCs) for each type of simulations are presented with four different GCMs of CMIP5. The last row lists the name used for each GCM–RCM pair throughout this study.
2.2 RCM Euro-Mediterranean CORDEX simulations
The set of EMCORDEX simulations used in this study are summarized in Table 1. The five RCMs used are presented with the main reference papers (in particular with respect to boundary layer and convection schemes). The EMCORDEX community has provided three types of RCM simulations with driving conditions (also detailed in Table 1) issued from either ERA-Interim or GCMs simulations over past and future periods:
-
The evaluation simulations (EVAL hereinafter). The lateral boundary conditions (LBCs) are driven by ERA-Interim reanalysis (Dee et al., 2011) over 1981–2010. These simulations are used to evaluate the RCM intrinsic biases.
-
The historical simulations (HIST hereinafter). The LBCs are issued from numerical experiments performed with four different GCMs and extracted from the CMIP5 historical archive. These historical simulations represent the climate conditions over 1976–2005.
-
The future climate scenario simulations (RCP hereinafter). In this case, the LBCs correspond to four future climate scenarios (from four different GCMs from CMIP5) under RCP4.5 and RCP8.5 (Clarke et al., 2007; Riahi et al., 2007; Meinshausen et al., 2011; van Vuuren et al., 2011) over 2011–2040, 2041–2070 and 2071–2100. These simulations cover 30-year time slice periods like the HIST simulation. Thus they can be statistically compared to assess future changes.
This results in eight pairs of RCM–GCM simulations analyzed in this study, for HIST and RCP as indicated in the last row of Table 1. Only simulations at 12 km for which EVAL, HIST and both RCP experiments were available at the beginning of the study were considered.
2.3 The reference data set: SAFRAN
SAFRAN reanalysis provides daily precipitation data for the period 1958–2008 over France and Spain on an 8 and 5 km grid, respectively (Vidal et al., 2010, Quintana-Seguí et al., 2016a, b). SAFRAN-France was built by using data from 3675 selected rain gauges that were gridded through an optimal interpolation algorithm described in Quintana-Seguí et al. (2008). The great number of rain gauges considered in SAFRAN and its high spatial resolution produce more accurate precipitation analyses over France and Spain than those proposed by other products commonly used for model assessments, such as CRU (Harris et al., 2014) and E-OBS (Haylock et al., 2008). A recent study shows that, for precipitation, the performance of SAFRAN is very similar to that of Spain02 (Quintana-Seguí et al., 2016b). SAFRAN data set has been evaluated using the Météo-France and Spanish State Meteorological Agency (AEMET) gauging station network as well as independent data (Quintana-Seguí et al., 2008, 2016a, b; Vidal et al., 2010).
SAFRAN product is used here as a reference data set to evaluate the simulated precipitation from EVAL and HIST ensembles. For that purpose, the 12 km RCM outputs and also SAFRAN Spain were regridded on the 8 km SAFRAN-France grid using the ESMF (Earth System Modeling Framework) bilinear regridding method. The impact of interpolation has been largely investigated in the literature, for instance in Diaconescu et al. (2015), and it should be quantified before interpretation of interpolated fields. In the present study, the impact of a bilinear scheme for the interpolation of precipitation fields from 12 km simulation grid to 8 km SAFRAN grid was assessed from an analytical test case based on the cosine function of longitude and latitude. The comparison is achieved by mapping the analytical field onto the 12 km fields and interpolated it onto an 8 km grid with the analytical field mapped onto the 8 km. The quadratic error reaches 5.10−5; the impact of interpolation was thus neglected in the following.
2.4 Statistical metrics to evaluate RCM performance
Given the small size of the Lez, Aude and Muga catchments (3, 84 and 11 SAFRAN grid points, respectively), and in order to allow for proper statistical analysis, the evaluation of mean precipitation (seasonal and annual cycle) was achieved on larger regional boxes (excluding sea grid points) shown in Fig. 1. These regional boxes have been selected according to regions of homogeneous climate conditions. In the particular case of the Lez catchment, the RCM precipitation is evaluated over the entire Cevennes region. However for all three catchments, extreme precipitation metrics are computed over grid points that are strictly inside the catchments. The precipitation extremes are analyzed with respect to the 90th to 99.9th quantiles of the daily precipitation distribution discretized as follows:
-
one point per 1 quantile rank from 90 to 95th;
-
one point per 0.5 quantile rank from 95 to 98th;
-
one point per 0.2 quantile rank from 98 to 99th;
-
one point per 0.1 quantile rank from 99 to 99.9th.
Short-term observed precipitation events are thereby completely covered and evenly distributed with this quantile discretization (not shown). Quantiles are computed considering all the days (rainy days and dry days), thus allowing for a comparison of precipitation quantiles between the different RCM–GCM pairs (Giorgi et al., 2016; Schär et al., 2016). However, it should be noted that when precipitation is below 0.1 mm day−1, the precipitation is set to 0 so that the cumulative precipitation is not affected by overrepresentation of light rainy days in the models (Harader et al., 2015; Tramblay et al., 2013, Paxian et al., 2015).
In addition to the classical metrics (spatial bias, annual cycle bias, quantile–quantile plot), two original metrics are used in this study. First, assuming additivity between GCM and RCM errors, the impact of the GCM bias on the RCM solution can be diagnosed by computing the difference ΔB between the HIST and the EVAL precipitation bias with respect to SAFRAN:
The ΔB criteria corresponds to the bias in the annual cycle of precipitation simulated with the RCMs that is strictly related to the influence of the lateral boundary condition imposed by the GCM. A high positive value indicates overestimation of the total monthly precipitation, and a negative value indicates underestimation of the total monthly precipitation.
Secondly, in the present study, change coefficients between the past (HIST) and future precipitation (RCP) quantile distributions are computed. For that purpose, precipitation from HIST and RCPs is quantile-ranked, and for each quantile rank “qi”, a change coefficient “Aqi” for precipitation intensities between HIST and RCP is computed as follows:
where Pqi(RCP) and Pqi(HIST) represent the values of the quantiles for HIST and RCP, respectively.
All metrics are computed on a seasonal basis, considering hereinafter four seasons: autumn (September, October and November), winter (December, January and February), spring (March, April and May) and summer (June, July and August). Only autumn and spring results are presented in the following section.
In this section the RCM precipitation biases are diagnosed through the comparison between the EVAL simulations and SAFRAN. The spatial pattern for the mean cumulative precipitation, the annual cycle and the extreme values are investigated.
3.1 Spatial bias pattern
Figure 1 shows the spatial distribution of the cumulative precipitation normalized difference between each RCM from the EVAL ensemble and SAFRAN, averaged over the previous 30 years in autumn. The top-left panel in Fig. 1a displays the mean cumulative precipitation for SAFRAN-France and SAFRAN-Spain reference data sets. Large values of the cumulative precipitation (greater than 400 mm season−1) are observed over mountainous regions, in particular the Cevennes and the Pyrenees chains. Lower cumulative precipitation values are observed in the valleys (Garonne, Aude) and over the coastal regions.
In general, the cumulative precipitation is overestimated for most RCMs over the mountainous regions (+30 %) and underestimated over the Mediterranean coastal region (−30 %), as shown in Fig. 1b to f, most likely because of imperfect representation of the orography as well as the parameterization of the convection scheme. Note that the RACMO22E pattern of precipitation bias differs from the other RCM patterns. Indeed, slight overestimation is observed over the south of the Pyrenees and the Cevennes (+20 %), and almost no bias is observed over the valleys.
We focus now on the precipitation bias over river catchments that are analyzed in the present study: for Cevennes, the cumulative precipitation is overestimated by 20 % in the southwest mountainous region and underestimated by 30 % in the northeast valley region for all RCMs (Fig. 1b, c, e, f) except for RACMO22E (Fig. 1d).
For the Aude region, no relevant bias is presented by ALADIN52 (Fig. 1b), ALADIN53 (Fig. 1c) and RACMO22E (Fig. 1d). A positive bias (+40 %) is presented by RCA4 (Fig. 1e) in the western region under continental influence, while no relevant bias is presented in the eastern region under Mediterranean influence. HIRHAM5 (Fig. 1f) displays a strong positive bias (+50 %) in the high-elevation areas (Pyrenees in the southwest, and Black mountain in the northwest) and a strong negative bias elsewhere.
The mean cumulative precipitation is underestimated (−30 %) by all RCMs over the Muga region, except for RACMO22E.
For other seasons, the mean cumulative precipitation pattern tends to be overestimated over all three regions in spring (not shown), and a strong positive bias (+50 %) is presented by ALADIN52 and ALADIN53 over the Pyrenees in summer (not shown).
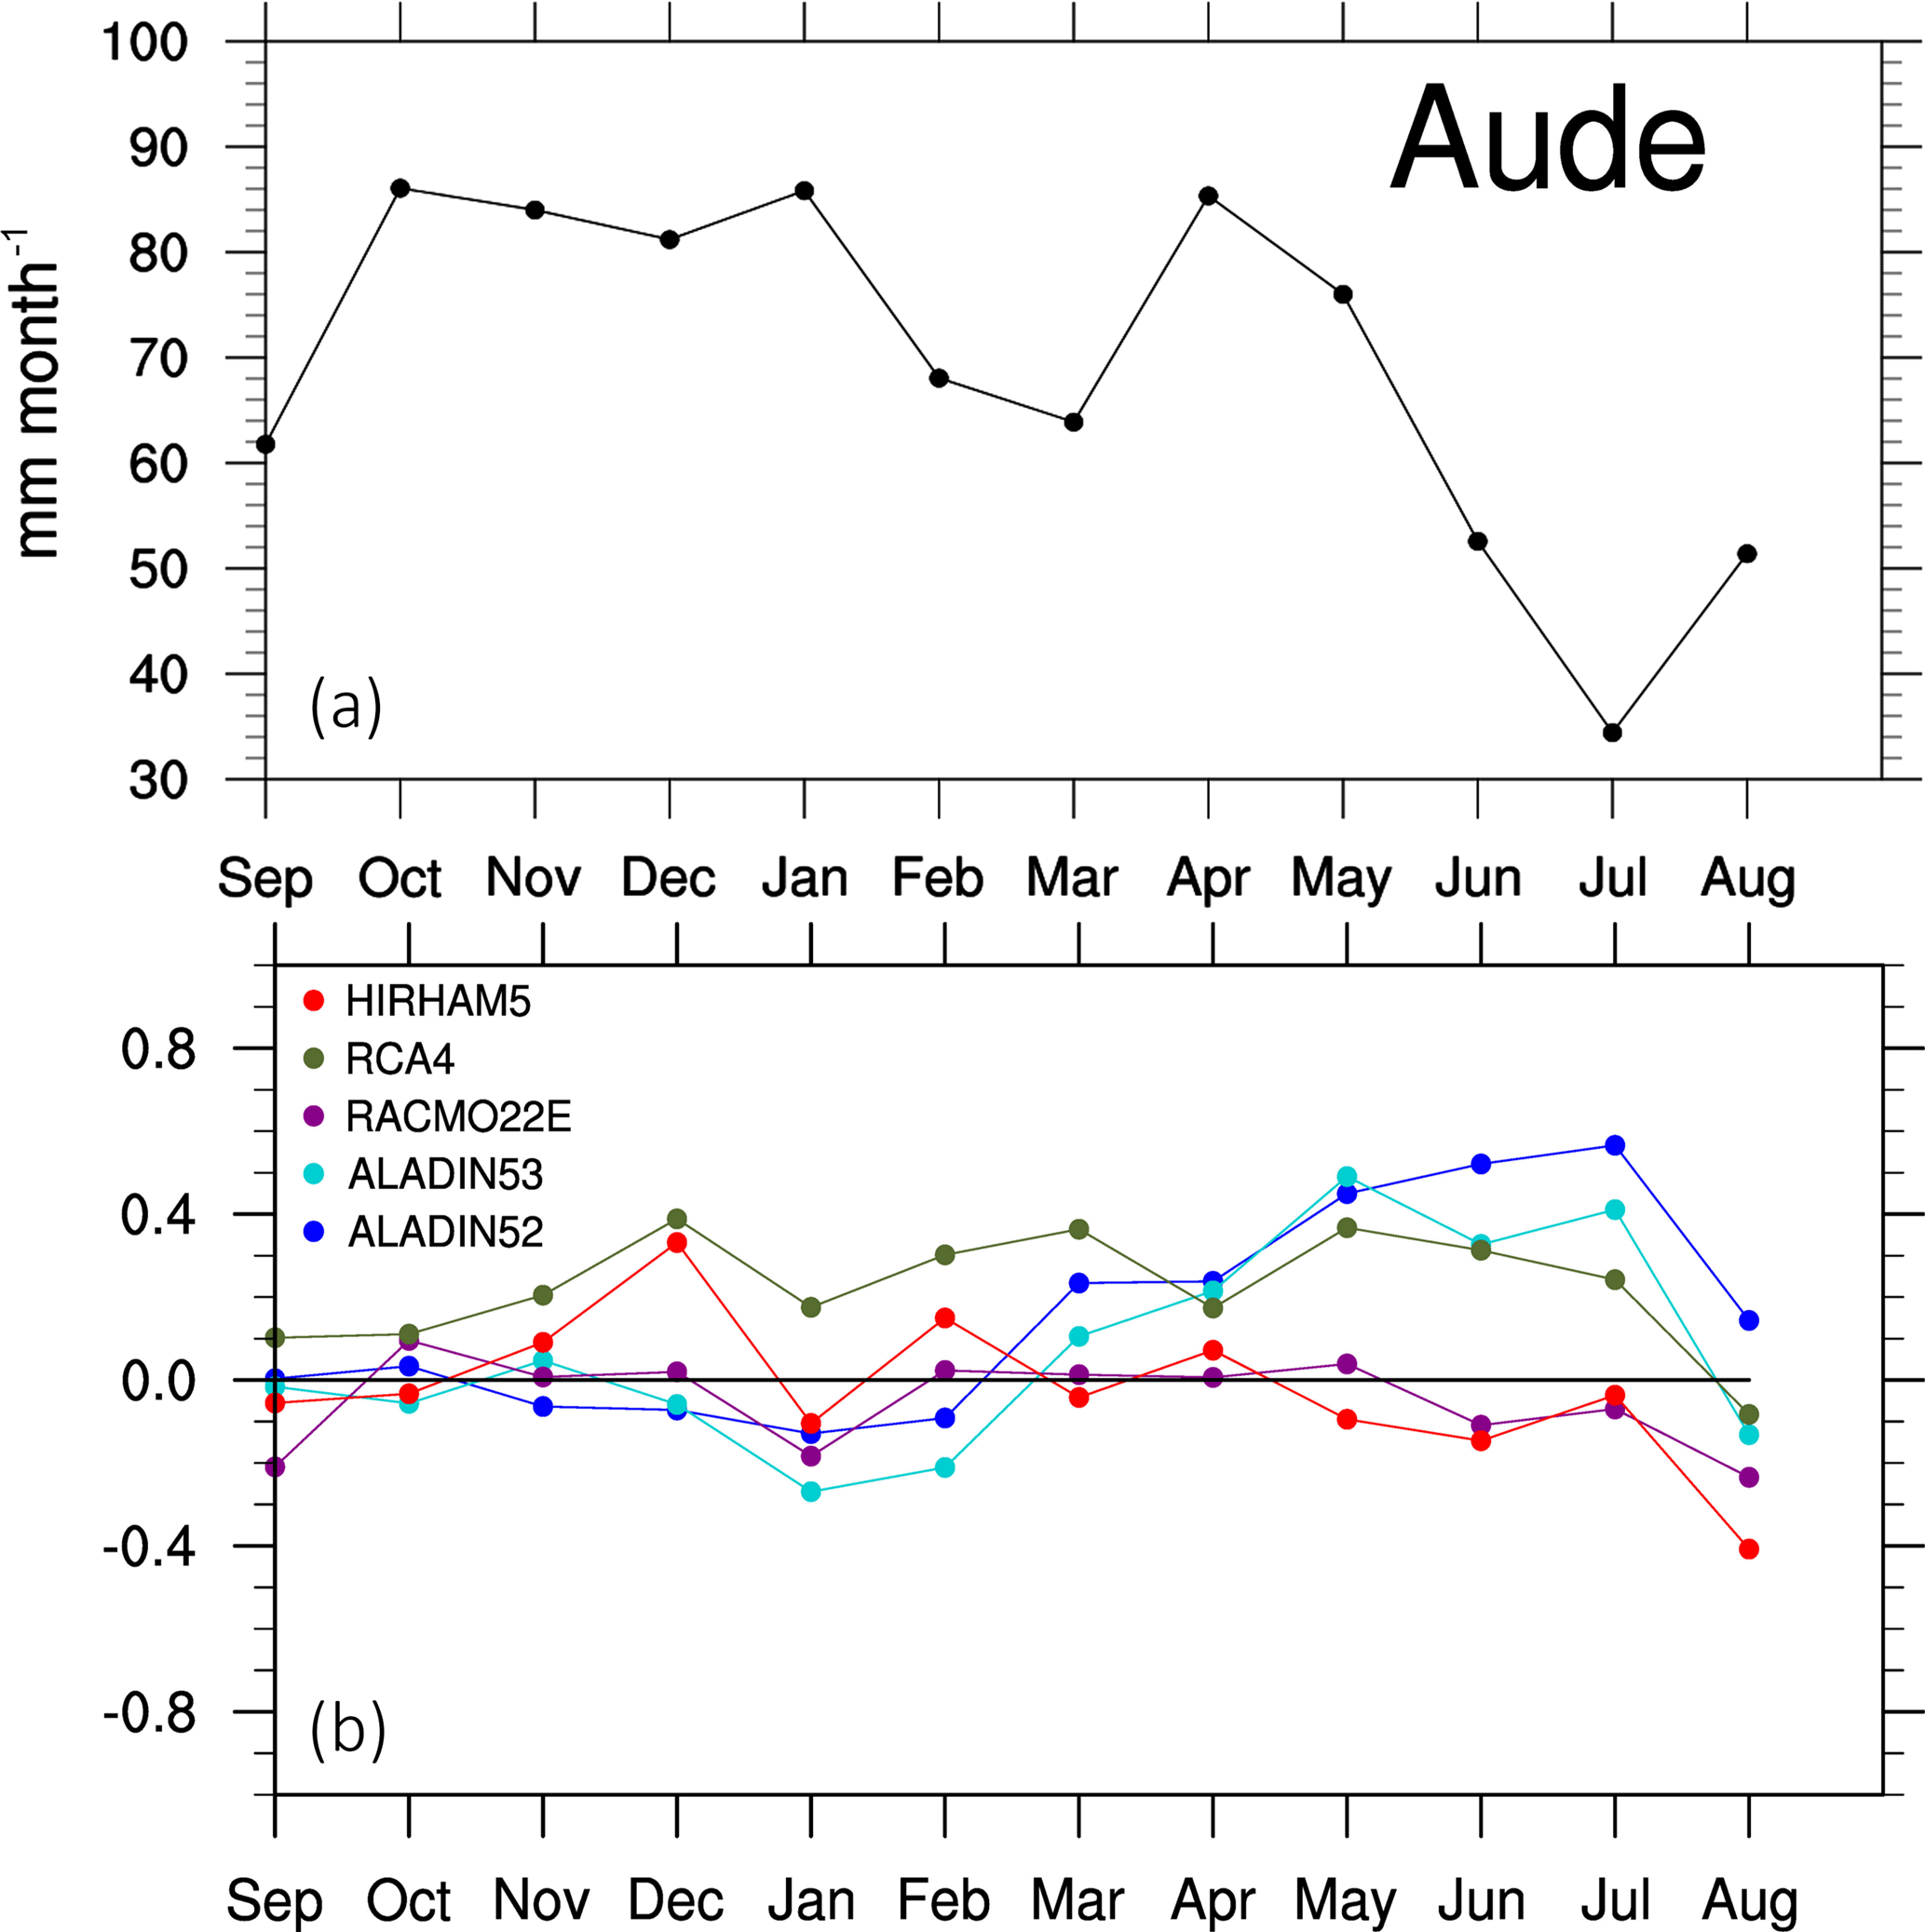
Figure 2(a) Annual cycle of precipitation over Aude box with SAFRAN data set (b). Bias of the annual cycle of precipitation simulated by the five RCMs with respect to SAFRAN's annual cycle of precipitation for the period 1981–2010 (no units), over the Aude box. The colored lines with different markers represent the biases of RCM-simulated precipitation with respect to SAFRAN data set (black line).
3.2 Annual cycle of precipitation bias
The 30-year climatology for the monthly cumulative precipitation is spatially averaged over each region of interest and normalized by the SAFRAN monthly climatology. Figure 2a displays the annual cycle of precipitation over the Aude box for SAFRAN data set. Figure 2b displays the bias of the annual cycle over the Aude region for each RCM. Globally speaking, the RCM bias and the inter-model spread are smaller in autumn than in summer. This can be explained by the influence of the large-scale atmospheric circulation being weaker in summer, the control exerted by the LBCs on the RCM is reduced in this season and the RCM solution has more degrees of freedom to deviate from the large-scale forcing (Déqué et al., 2012; Lucas-Picher et al., 2008).
ALADIN52 and ALADIN53 clearly overestimate the cumulative monthly precipitation in late spring and summer. This is likely due to a large presence of low precipitation days in the RCM precipitation distribution (0 to 10 mm day−1) compared to SAFRAN distribution (not shown). This behavior is also observed over the Cevennes and Muga regions (not shown). Consistent with Fig. 1d, RACMO22E displays a low bias in the annual cycle. Similar behavior is observed for HIRHAM5, suggesting an error compensation between positive and negative spatial biases displayed in Fig. 1f. For the Muga and the Cevennes boxes (not shown), HIRHAM5 presents a negative bias. Finally, RCA4 simulates a large positive bias (+30 %) for the entire annual cycle that tends to intensify over the Alps and the western Pyrenees.
3.3 Extreme precipitation bias
The ability of the EVAL simulations to represent the extreme of precipitation is investigated through a quantile–quantile analysis with respect to SAFRAN. This analysis is performed for each grid point within the Lez, Aude and Muga catchments. The highest-order quantiles (95 to 99th) are displayed in Fig. 3 for each RCM and SAFRAN in autumn.
For the Lez, Aude and Muga catchments, the RCMs underestimate the higher-order quantiles. This underestimation is more important for the Muga catchment, where the extreme precipitation intensities are stronger.
ALADIN52 underestimates the upper precipitation quantiles; for instance, the intensity of the 99th quantiles only reaches 70 mm day−1 compared to 140 mm day−1 for SAFRAN. ALADIN53 performance is slightly improved with respect to ALADIN52, especially for the Aude and Muga catchments. RACMO22E and RCA4 underestimate the extreme precipitation above the 99.5th quantiles. HIRHAM5 provides a satisfactory description of all extreme quantiles for the three catchments.
3.4 Summary of means and extremes analysis
The mean and extreme precipitation is investigated over the Aude, Lez and Muga catchments. Largest biases in mean precipitation simulated by the regional climate models are located over the mountainous (positive bias) and coastal (negative bias) regions. These biases are stronger during the summer season, when the control exerted by the LBCs on the RCM is weaker, due to a reduction of the large-scale circulation and North Atlantic inflow. Overall, while the climate variability is covered by the spread of EMCORDEX ensemble of RCMs, each RCM simulates plausible precipitation.
These results are coherent with specific studies for mean and extreme precipitation as cited hereafter. ALADIN52 precipitation biases are consistent with those obtained by Harader (2015), and slightly reduced in ALADIN53. The RCA4 overestimation of mean precipitation is in accordance with the results showed in Prein et al. (2016). The underestimation of extreme precipitation diagnosed in our study is possibly even more severe than our reference, SAFRAN, found to underestimate observed extreme precipitation (Quintana-Seguí et al., 2008a). This last point was confirmed through a comparison between pluviometer data and SAFRAN over our catchments of interest.
Parameterization and physical processes that are involved in the generation of low precipitation differ from those involved in stronger precipitation events. Thus the precipitation bias varies according to the precipitation intensity. Quantile classification is thereby relevant for the determination of past/future precipitation change.
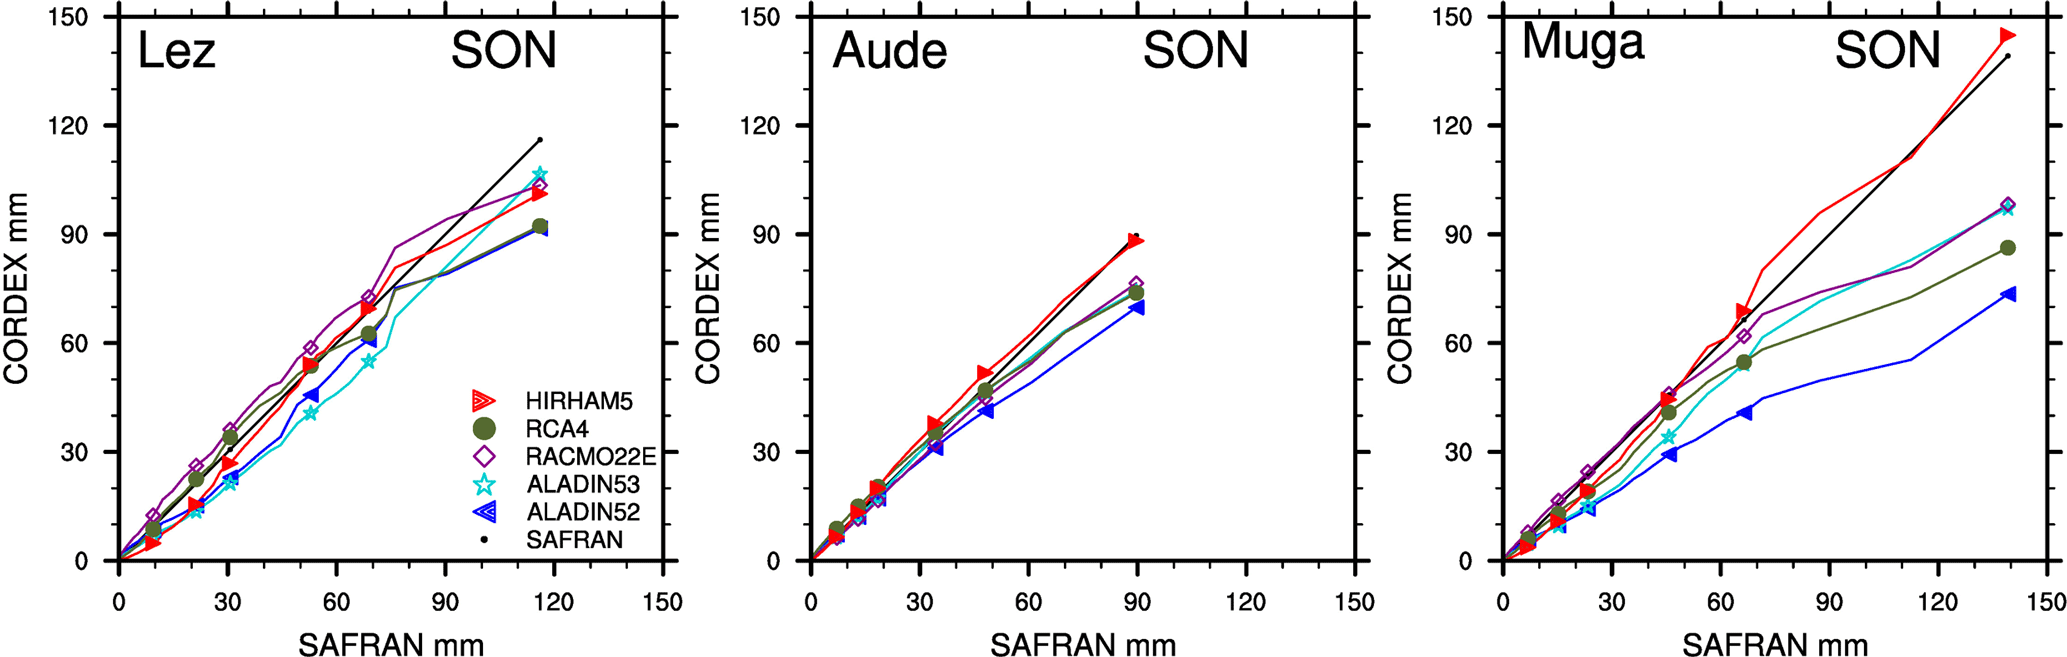
Figure 3Quantile–quantile diagram of daily precipitation in the cells of the three catchments for the period 1981–2010. EVAL-simulated precipitation (colored lines with different markers) is compared to SAFRAN (black line). The x axis represents the precipitation quantile values with respect to the SAFRAN reference data. The y axis represents the precipitation intensity simulated by the EMCORDEX models for the same quantiles. If a colored line is above/below the black line, the corresponding RCM over/underestimates quantile intensities with respect to SAFRAN. Units are in mm day−1. The colored dots represent, from left to right, the 90, 95, 97, 99, 99.5 and 99.9th quantiles.
RCM intrinsic biases, determined from the EVAL ensemble, have been characterized and described in the previous section. Here we analyze the historical simulations (HIST), performed with the GCM–RCM pairs, as described in Sect. 2.2. In this case, GCM biases are expected to affect the RCM simulation. A difficult challenge is to understand how GCM and RCM biases are interacting (Dequé et al., 2012). In this study we make the assumption of additivity between the impact of the GCM biases and the RCM intrinsic biases. In this study, four different GCM forcings are considered: CNRM-CM5, ICHEC, MOHC and MPI (see Table 1).
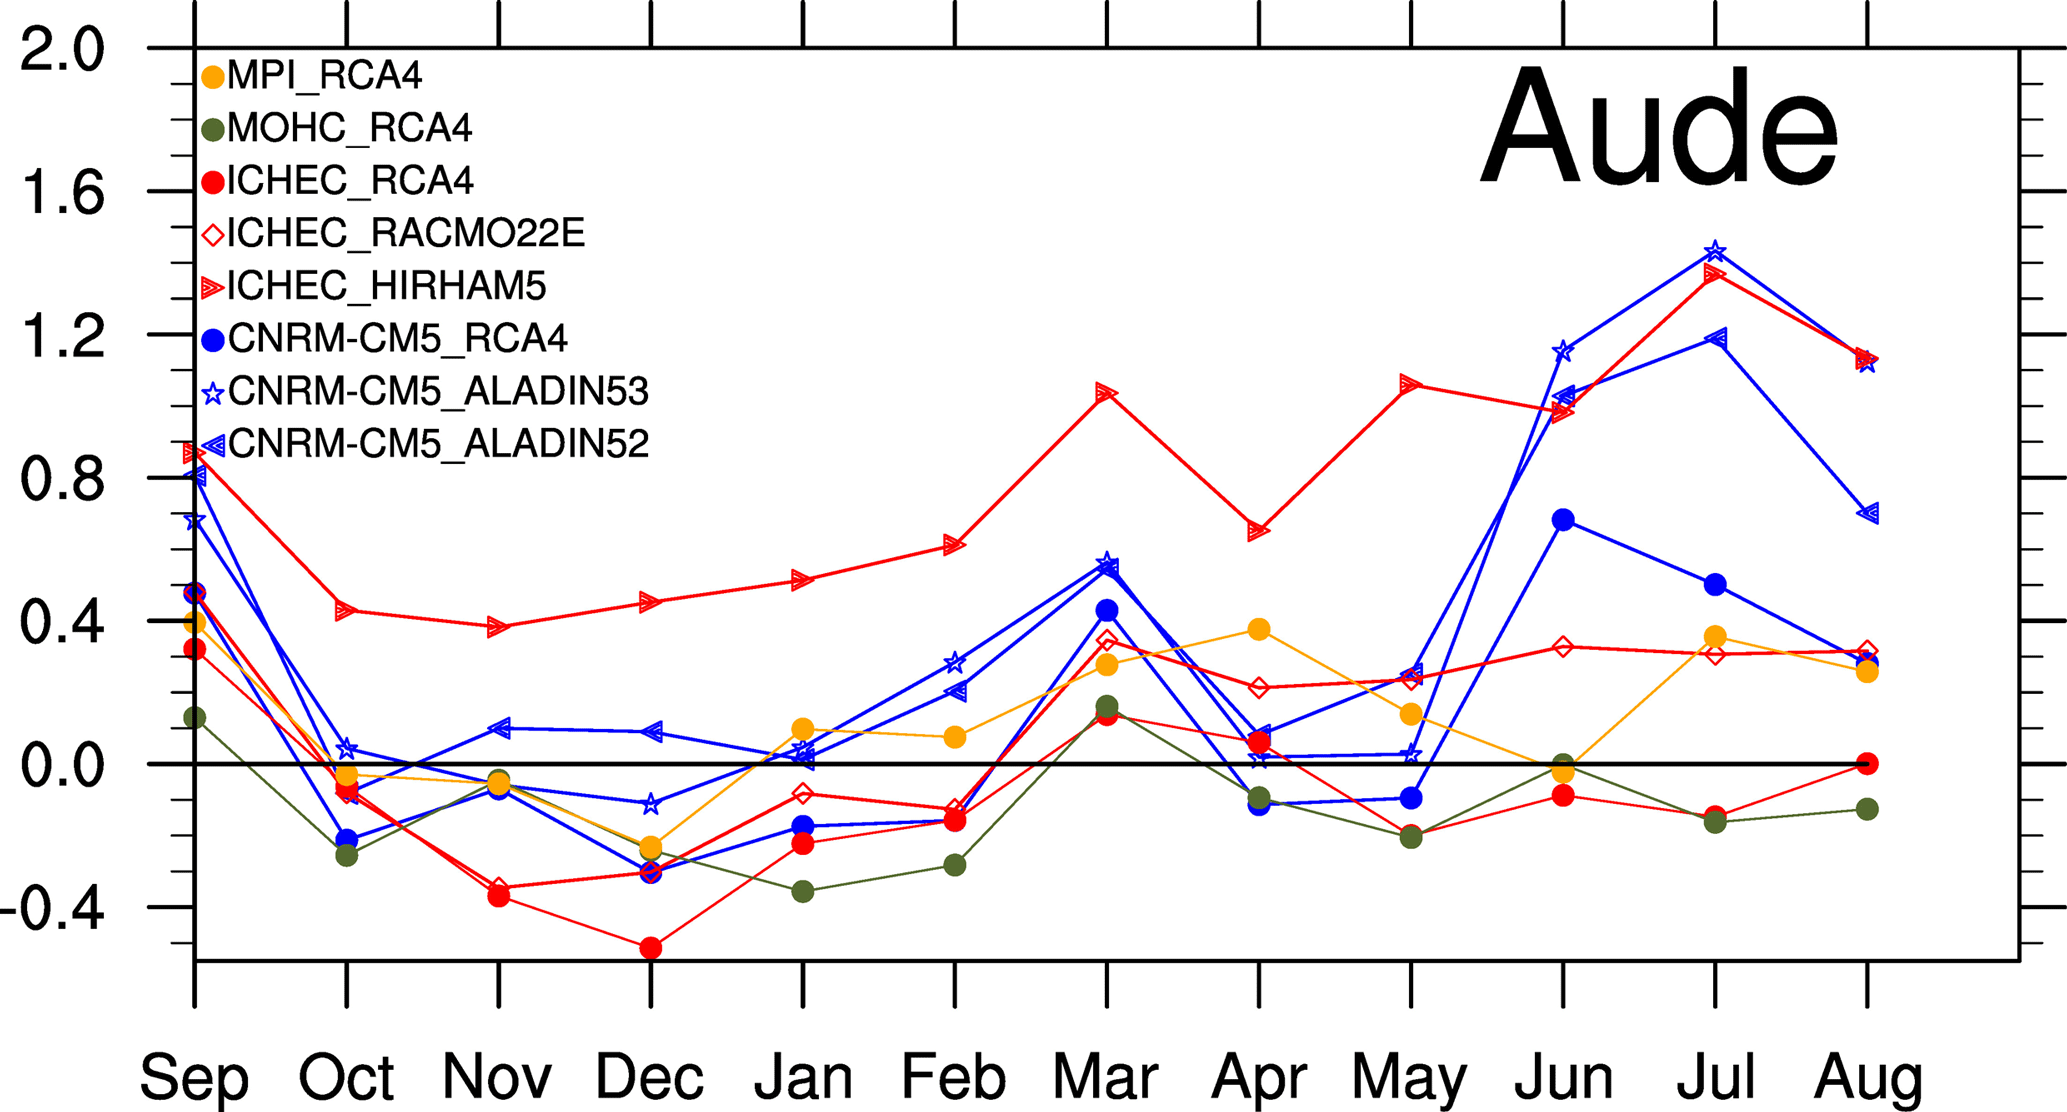
Figure 4Bias on the annual cycle RCM-simulated precipitation induced by GCMs lateral boundary conditions. Aude regional box is shown here for the period 1976–2005. This bias is estimated through the computation of the difference between HIST and EVAL simulated precipitation with respect to SAFRAN. ΔB (no units) represent this bias with . Colored lines refer to the GCMs, and the markers refer to the RCMs driven. If a colored line is above (below) the black line, the corresponding GCM induce overestimation (underestimation) of the precipitation simulated by the RCM.
4.1 Annual cycle of precipitation bias
Figure 4 displays the annual cycle of ΔB over the Aude watershed for each GCM–RCM pairs. The color code refers to the GCM (for instance for CNRM-CM5 forcing), while the markers refer to the RCM (for instance star for ALADIN53). From Fig. 4 it is evident that CNRM-CM5 forcing leads to systematic overestimation of summer precipitation, hence proving that the positive precipitation bias identified in EVAL (Sect. 3, Fig. 2 for ALADIN52, ALADIN53 and RCA4) is enhanced in HIST simulations.
ICHEC large-scale conditions induce no significant changes on RACMO22E and RCA4 errors, while they lead to strong overestimation of the HIRHAM5 precipitation. Except when forced by CNRM-CM5, the bias of GCM–RCA4 pairs is similar to the intrinsic bias of RCA4, as displayed for all three, MPI, MOHC and HIRHAM5. Illustration is provided for the Aude box in Fig. 4, but similar results are obtained for the Cevennes and the Muga boxes.
It should be noted that previous results might also be explained by bias compensation between GCM impacts and RCM intrinsic bias. Despite the GCM–RCM deficiencies shown here, all the GCM–RCM pairs display plausible precipitation and are then considered in the following for future change analysis over mean precipitation annual cycle.
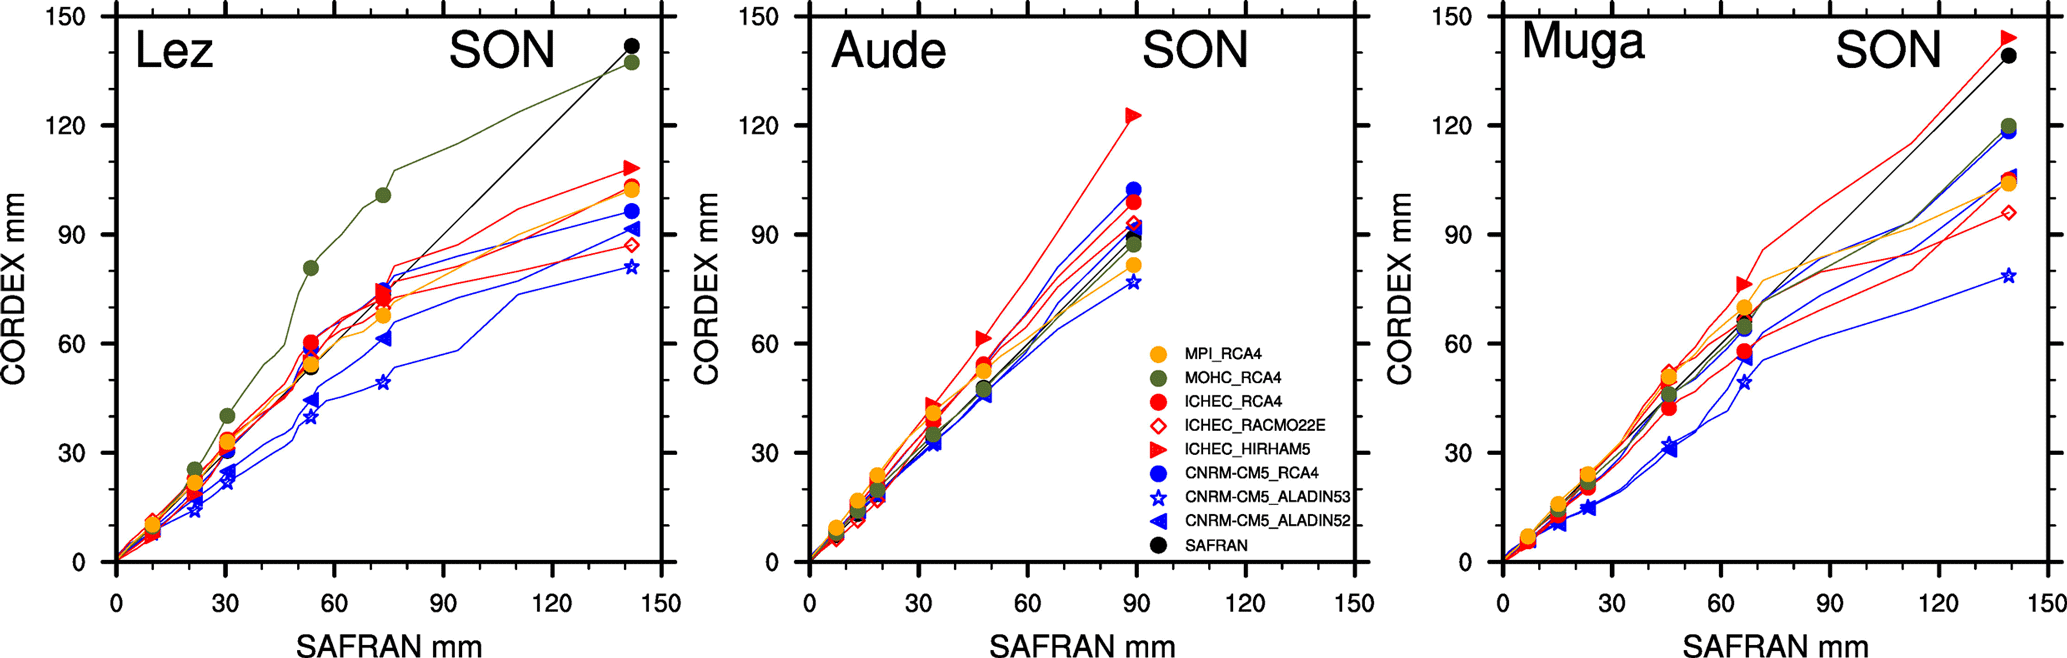
Figure 5Quantile–quantile diagram of daily precipitation in the cells of the three catchments for the period 1981–2010. HIST-simulated precipitation (colored lines) is compared to SAFRAN (black line). The x axis represents the precipitation quantile values with respect to the SAFRAN reference data. The y axis represents the precipitation intensity simulated by the EMCORDEX models for the same quantiles. If a colored line is above/below the black line, the corresponding RCM over/underestimates quantile intensities with respect to SAFRAN. Units are in mm day−1. The colored dots represent, from left to right, the 90th, 95th, 97th, 99th, 99.5th and 99.9th quantiles.
4.2 Extreme precipitation bias
Figure 5 is the counterpart of Fig. 3; it displays quantile–quantile diagrams of precipitation in autumn for the HIST ensemble over the Lez, Aude and Muga catchments. First, the spread amongst the HIST simulations displayed in Fig. 5 is larger, except for the Muga catchment, larger than the one generated by the EVAL ensemble (Fig. 3) that the EVAL ones (Fig. 3), and extreme quantiles tend to be systematically underestimated over all three catchments of interest.
Generally, CNRM-CM5 forcing leads to underestimation of SAFRAN quantiles, thus enhancing the RCMs' intrinsic biases displayed in Fig. 3. MPI and ICHEC provide good quantile distribution for all RCMs except beyond 99.5th quantile. In more detail, ICHEC-RCA4 extreme quantiles are slightly overestimated over the Aude catchment, and in good agreement with SAFRAN over the Muga catchment. MOHC-RCA4 provides good statistics over Aude and Muga catchments, while it overestimates all quantiles over the Lez catchment.
To conclude, the impact of the GCM on RCMs tends to systematically intensify the underestimation of extreme precipitation values. However, the HIST ensemble remains consistent with SAFRAN statistics and thus will be used in the following step, in order to estimate future changes over extreme precipitation over the different catchments.
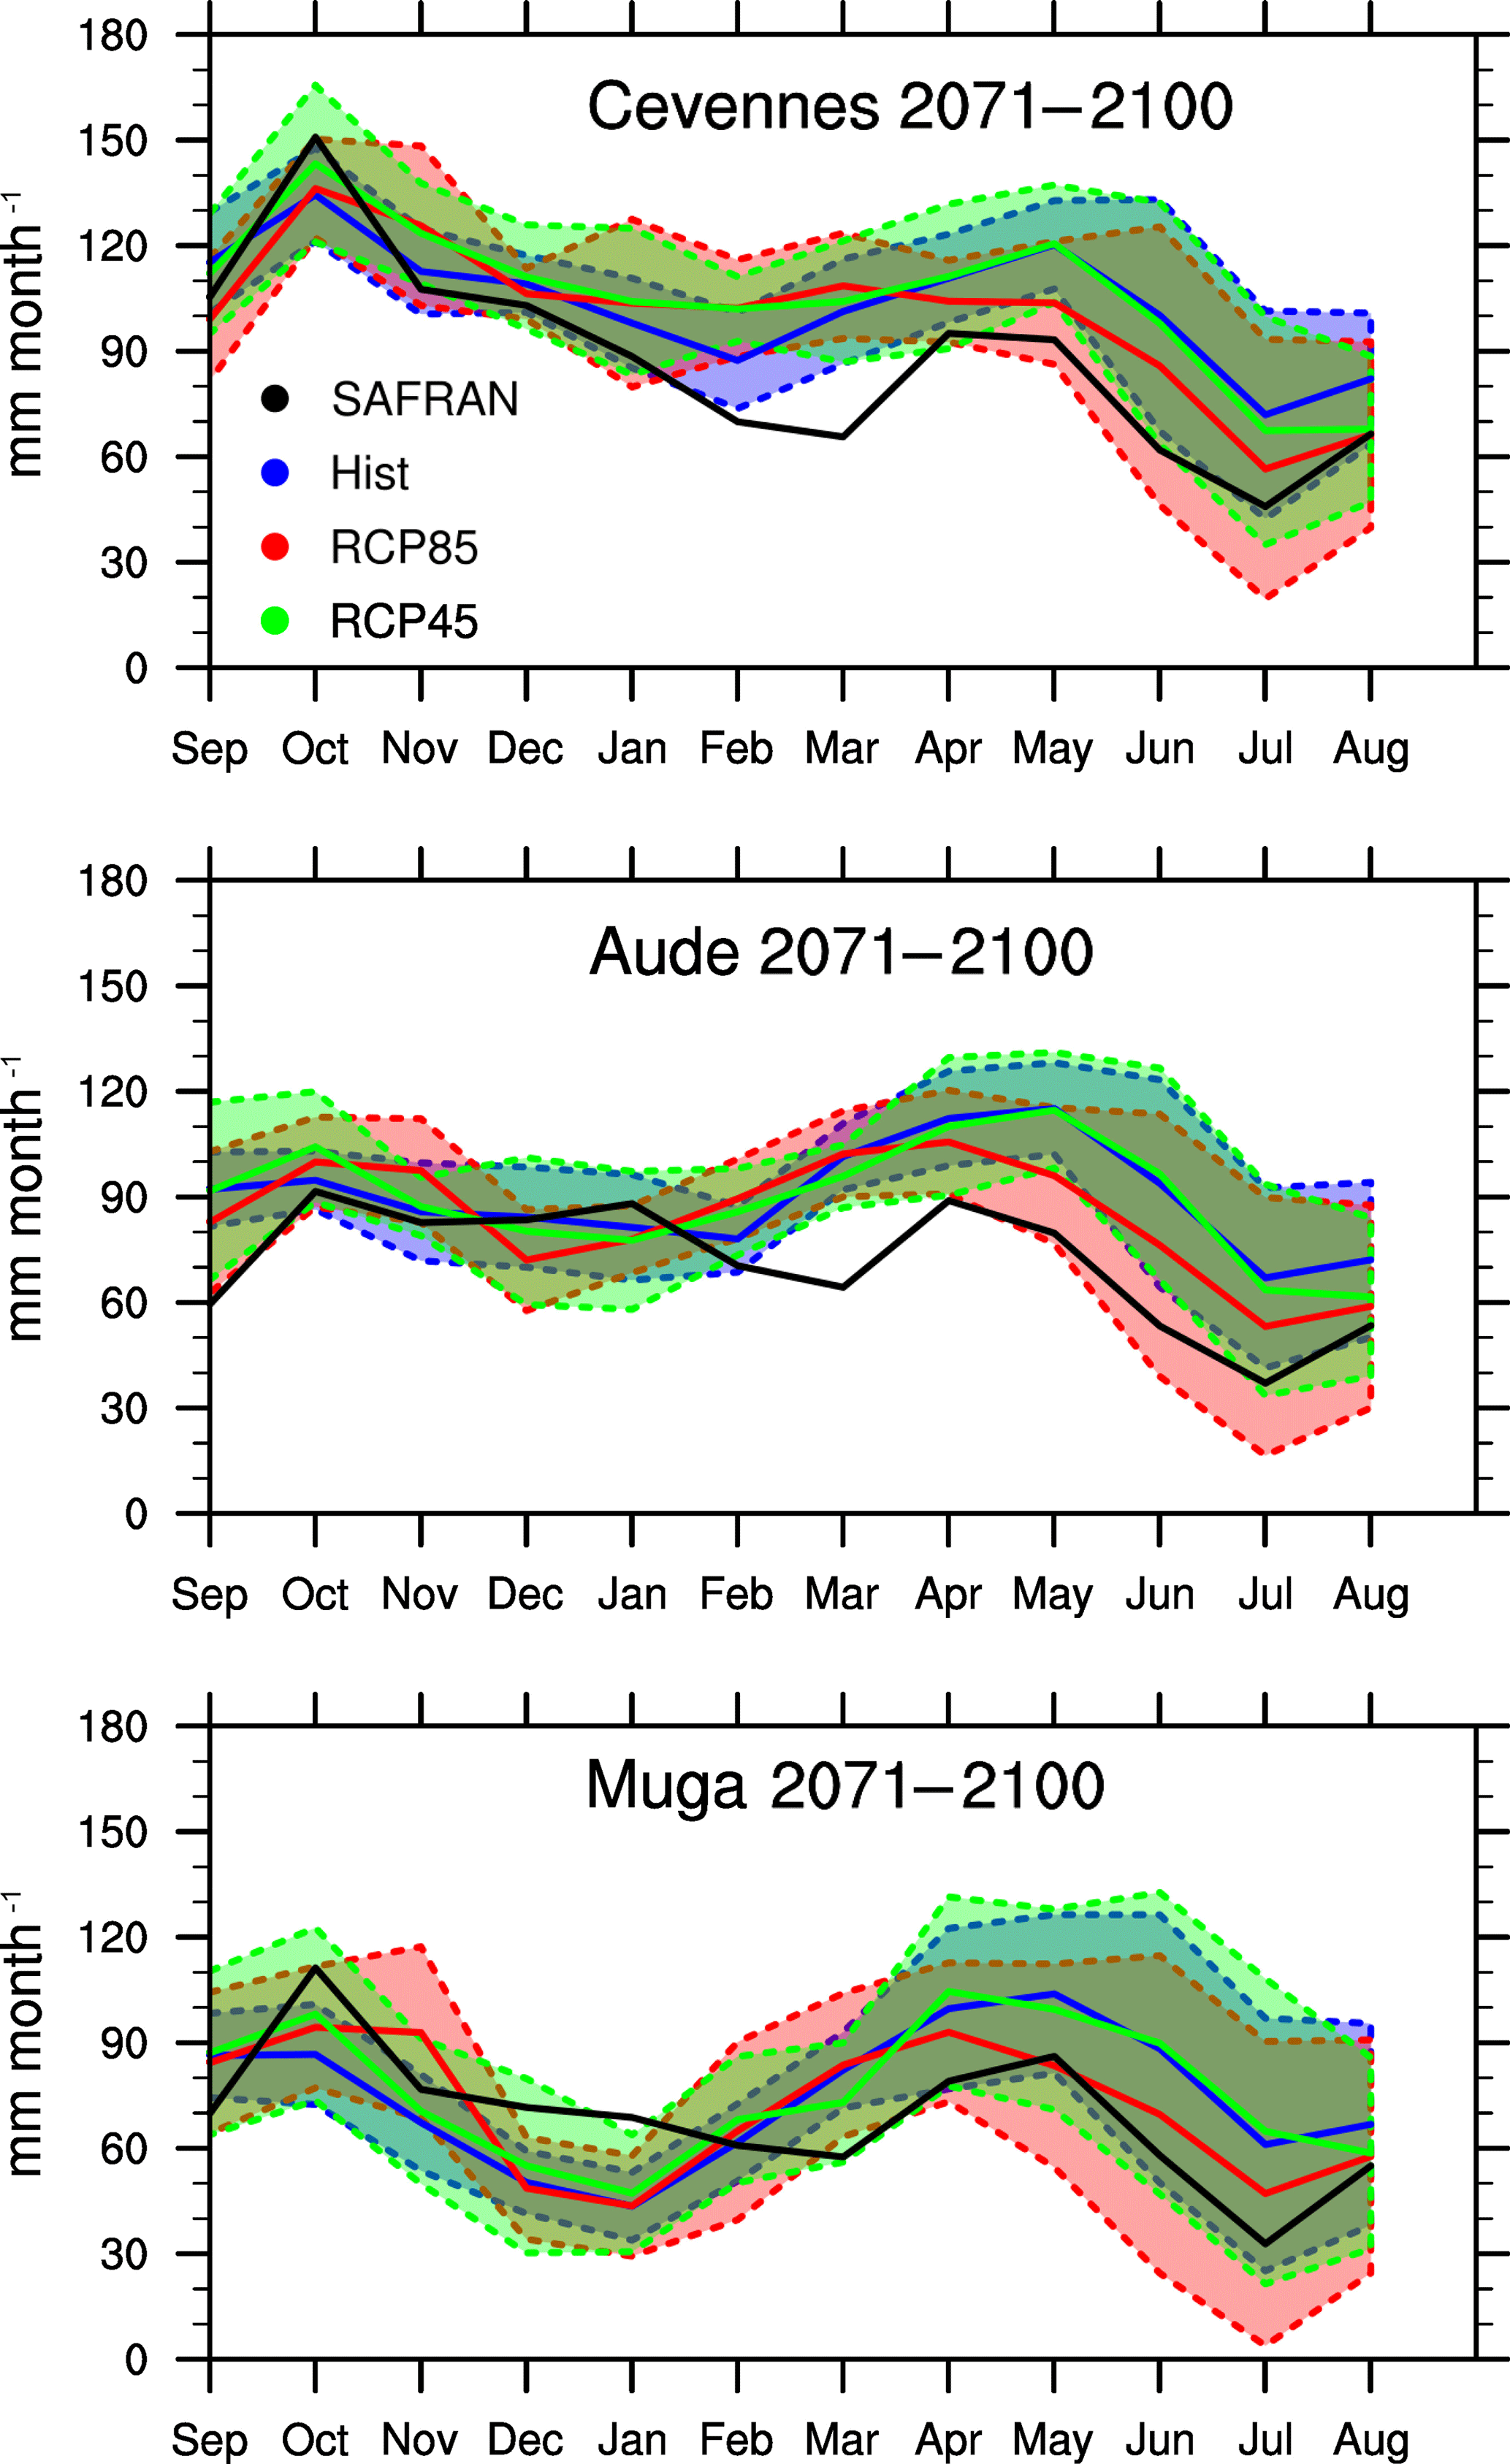
Figure 6Annual cycle of mean precipitation (mm month−1) simulated in the three regional boxes (Cevennes, Aude, Muga; see Fig. 1). Solid lines represent the ensemble means computed amongst the eight GCM–RCM pairs. The shaded areas represent the ensemble spreads characterized by the standard deviation. HIST ensemble mean (1976–2005) is plotted in blue. RCP4.5 and RCP8.5 ensemble means (2071–2100) are respectively plotted in green and red. SAFRAN annual cycle computed over 1981–2010 is plotted in black.
5.1 Annual cycle of precipitation
Figure 6 presents the precipitation annual cycle simulated for HIST computed over 1976–2005 period and the scenario RCP4.5 and RCP8.5 computed over 2071–2100 period, for the Cevennes, Aude and Muga boxes.
The results reveal stronger mean precipitation change between RCP4.5 and RCP8.5 than for the 2011–2040 and 2041–2070 periods. The annual cycle of the RCP4.5 ensemble is similar to HIST one in terms of mean and spread, suggesting that radiative forcing in RCP45 seems to have a weak impact on monthly averaged precipitation. In contrast, the annual cycle of the RCP8.5 ensemble displays a general decrease in mean precipitation from April to October for the three river catchments. These results are consistent with the conclusions from the study of Jacob et al. 2013 over EMCORDEX domain. As previously mentioned the spread of the ensemble is larger in summer when the LBCs exert a weaker control in the RCM domain. It should be noted that these results hold for the three boxes of interest that are of significantly different sizes. This suggests that the high-resolution EMCORDEX simulations can be confidently used to investigate precipitation at local scale.
As mentioned in the previous section, the analysis of the annual cycle of HIST simulations emphasized that the association of GCM and RCM models induces a different precipitation bias that the intrinsic RCM biases (comparison between black and blue curve in Fig. 6). Nevertheless, the precipitation field issued from HIST is not bias corrected here. They are used, together with the RCP simulations, to estimate the change coefficient between past and future values of the quantile of the precipitation distribution.
5.2 Change coefficients for extreme precipitation
The change coefficients between quantile-ranked precipitation presented in Eq. (2) are displayed in Fig. 7. They allow the estimation of the changes between the past (HIST) and future precipitation (RCP) quantile distributions
Following Eq. (2), a change/transfer coefficient greater than 1 for a given quantile indicates an increase of the future precipitation value associated with this quantile. On the other hand, Aqi <1 means a decrease in RCP precipitation with respect to HIST.
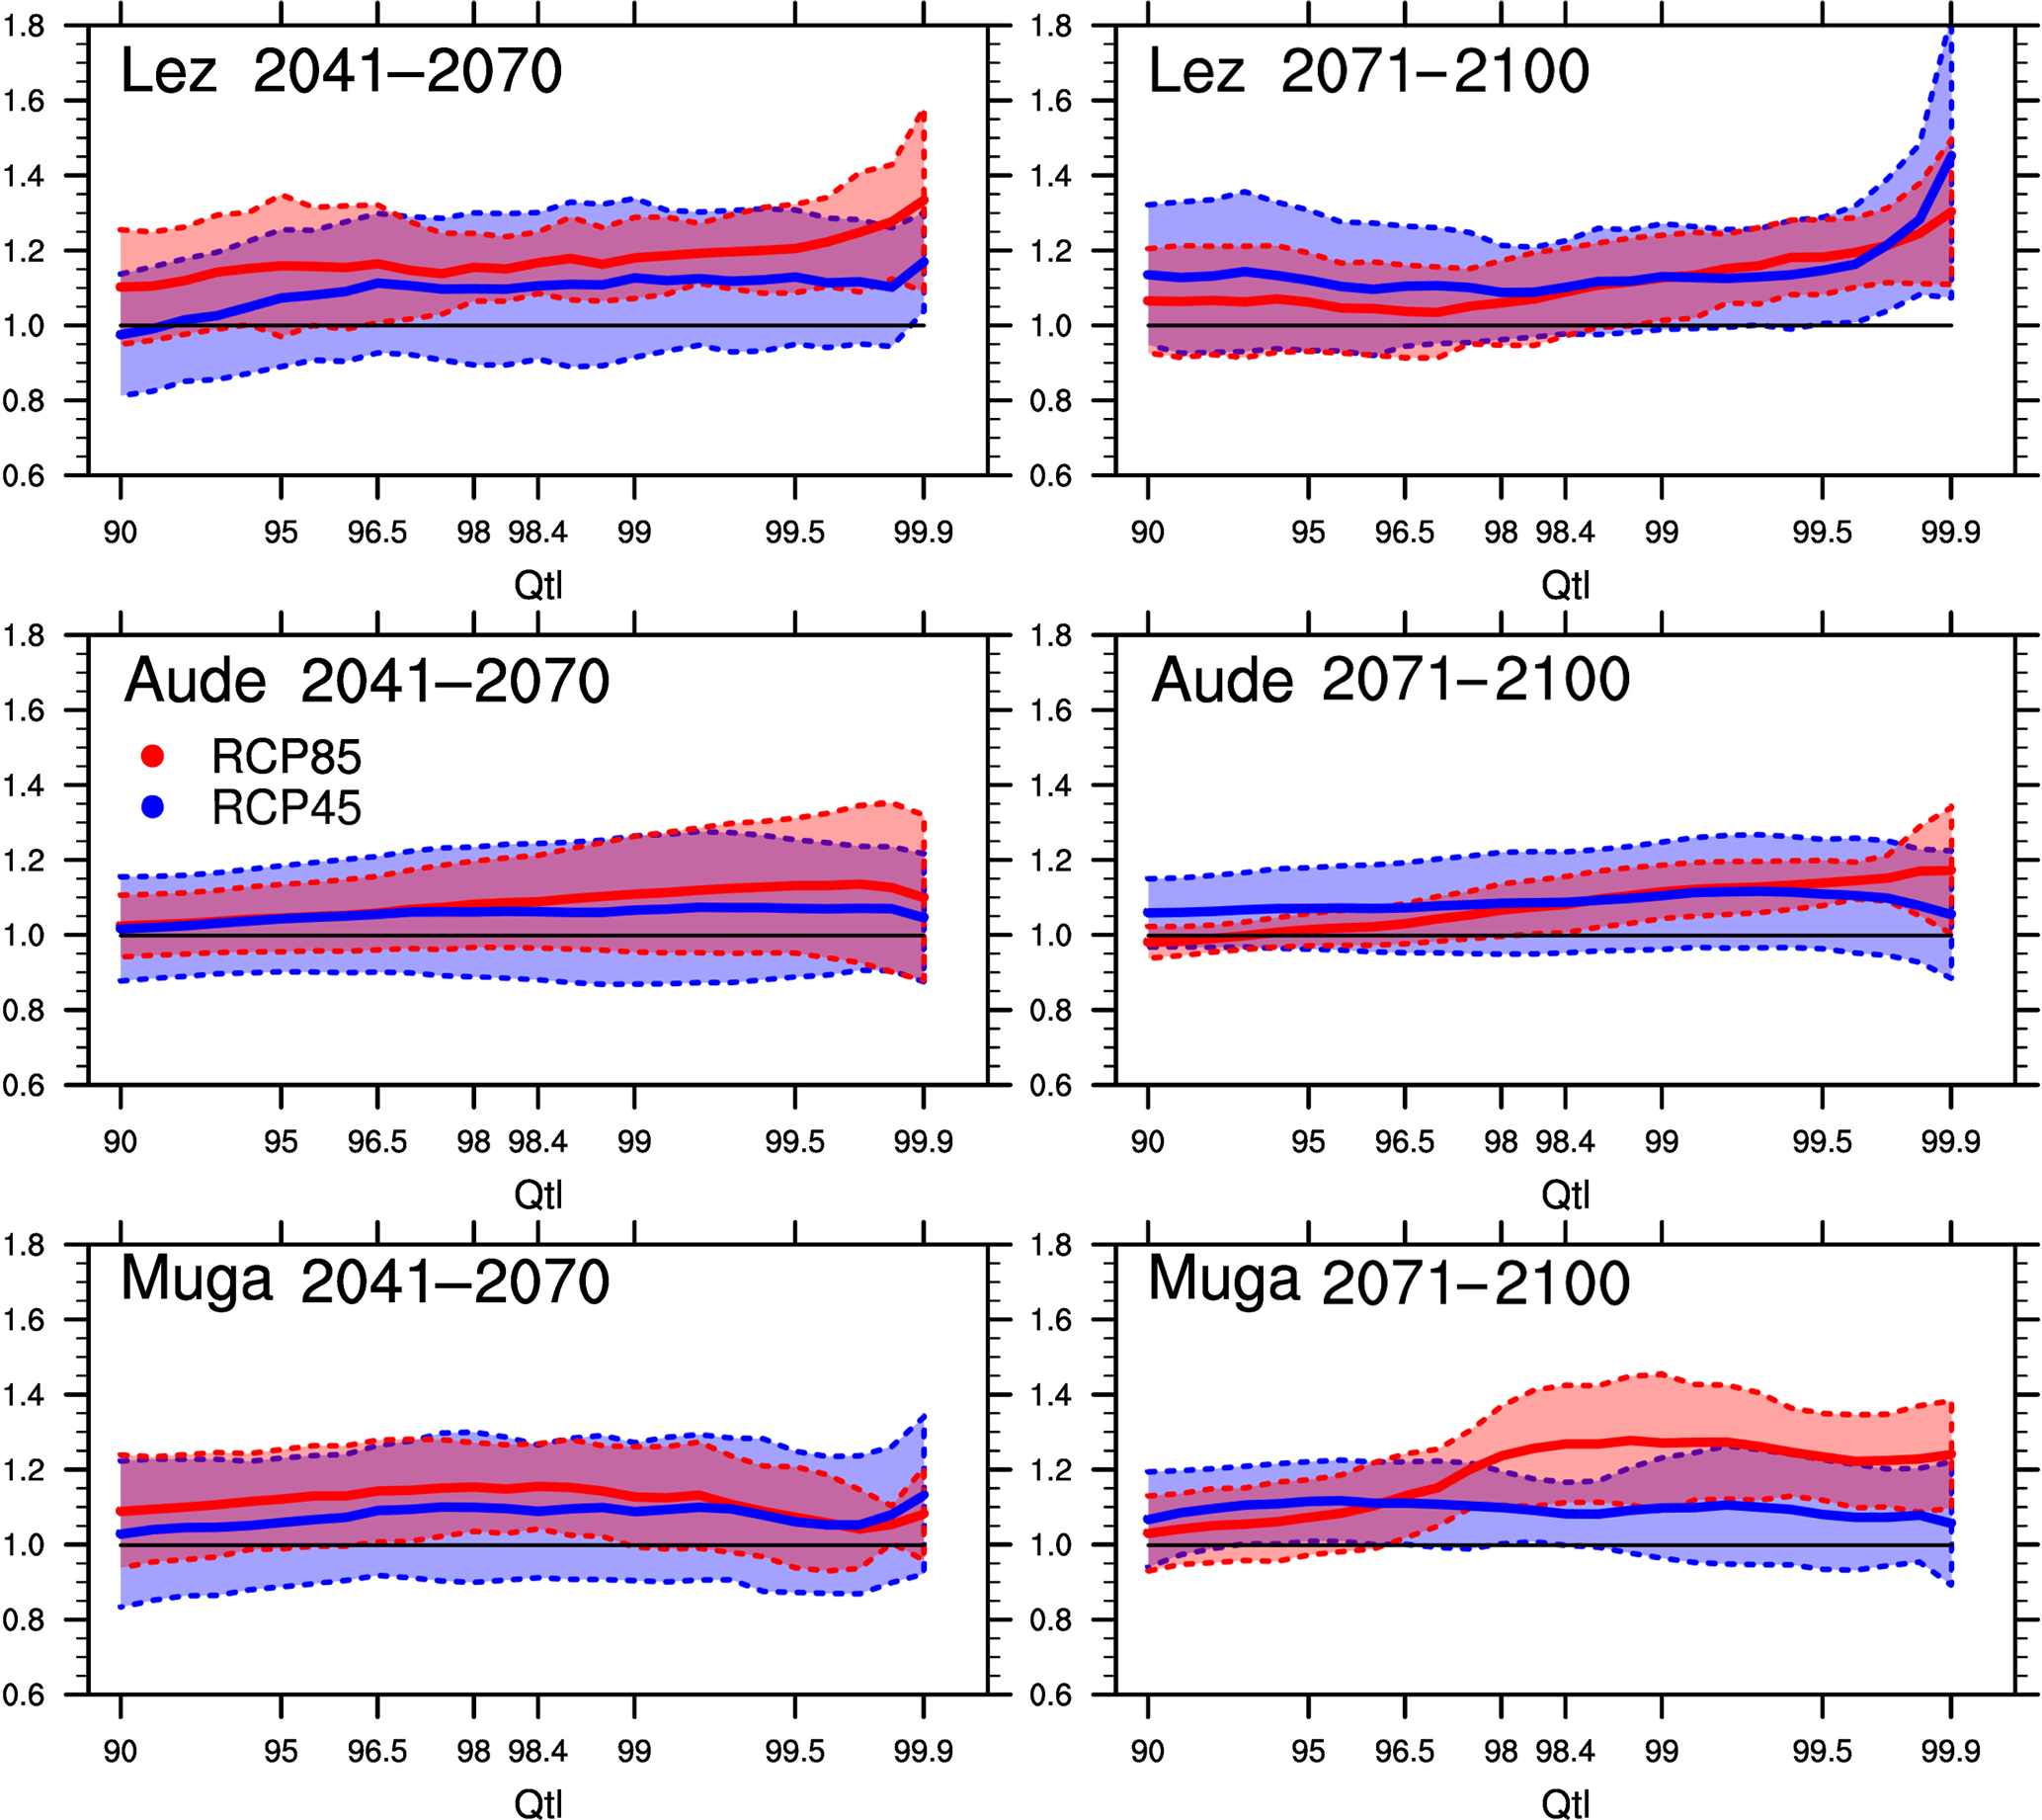
Figure 7Change coefficients (Aqi) over the 90–99.9 quantile range computed for each GCM–RCM pairs over the Lez, Aude and Muga catchments during the autumn season (SON). The no change line (ai = 1) is also displayed in solid black. The thick solid lines represent the ensemble mean for (Aqi), and the associated ensemble spread is presented by the shaded areas (standard deviation). RCP4.5 and RCP8.5 are respectively plotted in blue and red. For clarity purposes, the scale of the x axis was distorted according to the quantile discretization.
The Aqi coefficients are computed for each GCM–RCM pair over the Lez, Aude and Muga catchments. The multi-model approach adopted here allows for estimating an uncertainty in the values of the change coefficients. The Aqi coefficients are represented in Fig. 7 over the upper level quantile range (90–99.9) for RCP4.5 and RCP8.5 in autumn for the three river catchments and for 2041–2070 and 2071–2100 future time periods. The ensemble mean for Aqi computed amongst the GCM–RCM pairs is compared to the associated ensemble spread (standard deviation) in Fig. 7.
The interesting result here is that while RCP simulations tend to decrease mean precipitation with respect to HIST simulation (Fig. 6), extreme precipitation events are intensified for both time periods over the three catchments. Globally speaking, the mean change coefficient for RCP4.5 and RCP8.5 is similar except for the Lez (2041–2070) and the Muga (2071–2100) catchments, where RCP8.5 displays biggest changes. The ensemble spread from RCP8.5 is smaller than the one from RCP4.5, meaning that the change in extreme precipitation displays higher level of certainty under RCP8.5 scenario, which can be explained by stronger radiative forcing in RCP85 compared to RCP45. Few models indicate a decrease in extreme precipitation for RCP4.5 over 2041–2070 period. In contrast, for 2071–2100, all the GCM–RCM members agree on an increase in extreme precipitation for both RCP4.5 and RCP8.5 scenarios. For instance, the mean change coefficient over 2071–2100 reaches 1.15 for the 99.5th quantile over the Aude catchment for both RCPs, while RCP4.5 spread is about 0.3, versus 0.1 for RCP8.5. In terms of precipitation, a change coefficient of 1.35 over the Lez catchment for the 99.9th quantile of RCP8.5 represents an increase from 140 to 189 mm day−1.
The present study assessed the intensification of extreme precipitation events under climate change on small Mediterranean catchments using high-resolution RCM simulations (∼ 12 km) from the EMCORDEX exercise. It was shown that over the past period (1976–2005), EVAL simulations (RCM driven by ERAI) and HIST simulations (RCM is driven by a GCM) underestimate extreme events with respect to SAFRAN data set.
Despite SAFRAN being the best gridded observation data set available covering the region of interest as explained in Sect. 2.3, the underestimation highlighted here is potentially more severe as SAFRAN is itself deemed to underestimate observed extreme precipitation events (Quintana-Seguí et al., 2008a). Indeed, complementary analysis (not shown here) on the Aude and Lez catchments highlighted that SAFRAN underestimates precipitation quantiles beyond the 95th quantile by up to 30 % with respect to pluviometer data from the Météo-France network. It should be noted that comparison between the SAFRAN gridded product and the pluviometer sparse product is challenging and that these products are not independent. However, more representative computation of observed quantiles from pluviometer data set in place of SAFRAN ones is one potential gain from the present study. This paves the way towards a time-varying quantile classification with an intra-daily cycle, for instance by using 3 h pluviometer data. Such an intra-daily cycle could also be represented in the past/future change coefficients using 3 h EMCORDEX precipitation outputs. Working on higher temporal resolution data (observation and simulation) would lead to a futurization method more consistent with flash flood timescales than the daily current method.
Future changes in precipitation are assessed through a multi-model approach focusing on the mean and standard deviations of the EMCORDEX ensemble. In order to reduce the model uncertainty, different classifications and clustering methods, based on advanced ensemble statistics, have been tested to exclude the outlier models from a specific ensemble, or to apply weightings procedures in the ensemble mean computation (Boberg and Christensen, 2012). However, as discussed in Reifen and Toumi (2009) and Knutti et al. (2010), model performances in the past do not necessarily relate to model performances in the future and the choice of the criteria for multi-model studies should be further investigated.
As previously explained in Fig. 6, the monthly averaged precipitation simulated by the RCP8.5 ensemble decreases with respect to the HIST monthly averaged precipitation over the past period, especially from April to October for the Lez, Aude and Muga catchments. For the Aude and Muga boxes, there is a shift in the annual cycle; the peak occurs earlier in spring (in April instead of May). This suggests that a change in precipitation amplitude and in temporal seasonality should be expected. Llasat and Puigcerver (1997) explained that intense precipitation events are mostly due to convective rainfall in autumn and to global circulation in spring. The maximum number of convective days and ratio between convective and total precipitation is recorded between August and September in la Boadella, and a positive trend (5 % error level) in the annual number of convective days has been founded in the Muga catchment (Llasat et al., 2016). The change in spring precipitation is thus most likely due to changes in global fluxes that have different impacts on western coastal regions (Aude and Muga) and on southern coastal regions (Cevennes). Indeed, Nuissier et al. (2011) explained that strong precipitation events over the west coast of the Mediterranean are mostly correlated with easterly fluxes, while strong precipitation events in the northern coastal region are correlated with south to southeasterly fluxes. Cassou et al. (2016) reported that climate change will have a greater impact on easterly fluxes; this could explain the change in the annual cycle observed in Aude and Muga regions only. This hypothesis should be validated with an analysis of changes in geopotential fields.
A futurization approach is presented in this article; it consists of the computation of a past/future change coefficients applied to quantile-ranked RCM precipitation outputs. We use the EMCORDEX ensemble to estimate the model and scenario uncertainty. The study focuses over the Lez, Aude and Muga Mediterranean catchments. As a first step, EMCORDEX models' skills are evaluated in terms of mean and extreme precipitation over the present climate period 1976–2005. This analysis legitimizes the use of the EMCORDEX models for past/future changes assessment.
It has been shown that cumulative precipitation is overestimated over the mountainous regions and underestimated over the coastal regions in autumn. Extreme events beyond 95th quantiles are underestimated. GCM forcing tends to enhance RCM underestimation of extreme precipitation events over the three catchments. Climate change impact is investigated from the RCP4.5 and RCP8.5 EMCORDEX simulations. In comparison with the present period, the monthly averaged precipitation decreases in spring and summer for RCP8.5. Past/future change coefficients computed from the EMCORDEX ensemble display an increase in extreme precipitation event intensity (beyond 90th quantile). This result is stronger over the end of 21st century, for RCP8.5, for all catchments of interest: all models within the ensemble agree on change coefficients larger than 1. The multi-model approach developed here allows for quantifying the uncertainty related to the past/future change coefficients. As a major conclusion of this study, we have shown with a high degree of confidence that all RCM models in EMCORDEX ensemble forecast an increase in extreme precipitation events.
In the future, change coefficients could be used to provide a kind of futurized extreme precipitation event that occurred in the past. In further studies, the hydrological impact of this futurized precipitation will be assessed using rainfall–runoff models over the Lez, Aude and Muga catchments. This generic method could also be applied to other catchments.
The raw data corresponding to the precipitation simulated by the 8 RCMs from EMCORDEX can be accessed on the CORDEX or the ESGF websites. The postreated data are conserved by the CECI-CERFACS and WSP France. To consult it, please contact the authors.
The authors declare that they have no conflict of interest.
This work is an initiative of WSP-France. The financial support for this work
has been provided by WSP-France under the CIFRE contract 2015/005. This
paper was written under the framework of the International HYMEX project and
the Spanish HOPE (CGL2014-52571-R) project. We acknowledge the World Climate
Research Programme's Working Group on Regional Climate, and the Working
Group on Coupled Modelling, former coordinating body of CORDEX and
responsible panel for CMIP5. We also thank the climate modeling groups
(listed in Table 1 of this paper) for producing and making available their
model output. We also acknowledge the Earth System Grid Federation
infrastructure an international effort led by the U.S. Department of
Energy's Program for Climate Model Diagnosis and Intercomparison, the
European Network for Earth System Modelling and other partners in the Global
Organisation for Earth System Science Portals (GO-ESSP). The authors wish to
especially acknowledge Samuel Somot (CNRM) for his fruitful discussions about
regional modeling and the MedCORDEX database. Thanks are given to Elisabeth
Harader for some methodological ideas examined in their PhD thesis. Special
thanks are also given to Jean-Marc Lacave and Gwenaëlle Hello from
Météo-France for providing the daily and 3 h pluviometer data,
and to Céline Vargel for her useful work on the comparison between
SAFRAN and pluviometer data.
Edited by: Shraddhanand Shukla
Reviewed by: two anonymous referees
Bechtold, P. and Bazile, E.: The 12–13 November 1999 flash flood in southern France, Atmos. Res., 56, 171–189, https://doi.org/10.1016/S0169-8095(00)00097-1, 2001.
Boberg, F. and Christensen, J. H.: Overestimation of Mediterranean summer temperature projections due to model deficiencies, Nat. Clim. Change, 2, 433, https://doi.org/10.1038/NCLIMATE1454, 2012.
Boudevillain, B., Delrieu, G., Galabertier, B., Bonnifait, L., Bouilloud, L., Kirstetter, P.-E., and Mosini, M.-L.: The Cévennes-Vivarais Mediterranean Hydrometeorological Observatory database, Water Resour. Res., 47, doi:10.1029/2010WR010353, 2011.
Bougeault, P.: A simple parameterization of the large-scale effects of cumulus convection, Mon. Weather Rev., 113, 2108–2121, https://doi.org/10.1175/1520-0493(1985)113<2108:ASPOTL>2.0.CO;2, 1985.
Cassou, C. and Cattiaux, J.: Disruption of the European climate seasonal clock in a warming world, Nat. Clim. Change, https://doi.org/10.1038/NCLIMATE2969, 2016.
Cavicchia, L., Scoccimarro, E., Gualdi, S., Marson, P., Ahrens, B., Berthou, S., Conte, D., Dell'Aquila, A., Drobinski, P., Djurdjevic, V., Dubois, C., Gallardo, C., Li, L., Oddo, P., Sanna, A., and Torma, C.: Mediterranean extreme precipitation: a multi-model assessment, Clim. Dynam., 1–13, https://doi.org/10.1007/s00382-016-3245-x, 2016.
Christensen, J. H., Carter, T. R., Rummukainen, M., and Amanatidis, G.: Evaluating the performance and utility of regional climate models: the PRUDENCE project, Clim. Change, 81, 1–6, https://doi.org/10.1007/s10584-006-9211-6, 2007.
Clarke, L., Edmonds, J., Jacoby, H., Pitcher, H., Reilly, J., and Richels, R.: CCSP synthesis and assessment product 2.1, Part A: scenarios of greenhouse gas emissions and atmospheric concentrations, US Government Printing Office, Washington DC, 2007.
Coustau, M.: Contribution à la prévision des crues sur le bassin du Lez: modélisation de la relation pluie-débit en zone karstique et impact de l'assimilation de débits, Université de Montpellier II, 2011.
Dayon, G.: Evolution du cycle hydrologique continental en France au cours des prochaines décennies, Université de Toulouse, Université Toulouse III-Paul Sabatier, 2015.
Dee, D. P., Uppala, S. M., Simmons, A. J., Berrisford, P., Poli, P., Kobayashi, S., Andrae, U., Balmaseda, M. A., Balsamo, G., Bauer, P., Bechtold, P., Beljaars, A. C. M., van de Berg, L., Bidlot, J., Bormann, N., Delsol, C., Dragani, R., Fuentes, M., Geer, A. J., Haimberger, L., Healy, S. B., Hersbach, H., Hólm, E. V., Isaksen, L., Kållberg, P., Köhler, M., Matricardi, M., McNally, A. P., Monge-Sanz, B. M., Morcrette, J.-J., Park, B.-K., Peubey, C., de Rosnay, P., Tavolato, C., Thépaut, J.-N., and Vitart, F.: The ERA-Interim reanalysis: configuration and performance of the data assimilation system, Q. J. R. Meteorol. Soc., 137, 553–597, https://doi.org/10.1002/qj.828, 2011.
Déqué, M. and Somot, S.: Weighted frequency distributions express modelling uncertainties in the ENSEMBLES regional climate experiments, Clim. Res., 44, 195–209, https://doi.org/10.3354/cr00866, 2010.
Déqué, M., Somot, S., Sanchez-Gomez, E., Goodess, C. M., Jacob, D., Lenderink, G., and Christensen, O. B.: The spread amongst ENSEMBLES regional scenarios: regional climate models, driving general circulation models and interannual variability, Clim. Dynam., 38, 951–964, https://doi.org/10.1007/s00382-011-1053-x, 2012.
Diaconescu, E. P., Gachon, P., and Laprise, R.: On the remapping procedure of daily precipitation statistics and indices used in regional climate model evaluation, J. Hydrometeorol., 16, 2301–2310, https://doi.org/10.1175/JHM-D-15-0025.1, 2015.
Drobinski, P., Da Silva, N., Panthou, G., Bastin, S., Muller, C., Ahrens, B., Borga, M., Conte, D., Fosser, G., Giorgi, F., Güttler, I., Kotroni, V., Li, L., Morin, E., Önol, B., Quintana-Segui, P., Romera, R., and Torma, C. Z.: Scaling precipitation extremes with temperature in the Mediterranean: past climate assessment and projection in anthropogenic scenarios, Clim. Dynam., 1–21, https://doi.org/10.1007/s00382-016-3083-x, 2016.
Ducrocq, V., Aullo, G., and Santurette, P.: Les précipitations intenses et les inondations des 12 et 13 novembre 1999 sur le sud de la France, https://doi.org/10.4267/2042/36293, 2003.
Ducrocq, V., Nuissier, O., Ricard, D., Lebeaupin, C., and Thouvenin, T.: A numerical study of three catastrophic precipitating events over southern France, II: Mesoscale triggering and stationarity factors, Q. J. Roy. Meteorol. Soc., 134, 131–145, https://doi.org/10.1002/qj.199, 2008.
Durand, Y., Brun, E., Mérindol, L., Guyomarc'h, G., Lesaffre, B., and Martin, E.: A meteorological estimation of relevant parameters for snow models, Ann. Glaciol., 18, 65–71, https://doi.org/10.3198/1993AoG18-1-65-71, 1993.
Estupina, V.: Vers une modélisation hydrologique adaptée à la prévision opérationnelle des crues éclair: application à de petits bassins versants du sud de la France, Toulouse, INPT, 2004.
Fowler, H. J., Ekström, M., Blenkinsop, S., and Smith, A. P.: Estimating change in extreme European precipitation using a multimodel ensemble, J. Geophys. Res., 112, D18104, https://doi.org/10.1029/2007JD008619, 2007a.
Fowler, H. J., Blenkinsop, S., and Tebaldi, C.: Linking climate change modelling to impacts studies: recent advances in downscaling techniques for hydrological modelling, Int. J. Climatol., 27, 1547–1578, https://doi.org/10.1002/joc.1556, 2007b.
Frei, C., Schöll, R., Fukutome, S., Schmidli, J., and Vidale, P. L.: Future change of precipitation extremes in Europe: Intercomparison of scenarios from regional climate models, J. Geophys. Res.-Atmos., (1984–2012), 111, https://doi.org/10.1029/2007JD008619, 2006.
Gao, X., Pal, J. S., and Giorgi, F.: Projected changes in mean and extreme precipitation over the Mediterranean region from a high resolution double nested RCM simulation, Geophys. Res. Lett., 33, https://doi.org/10.1029/2005GL024954, 2006.
Gaume, E., Livet, M., Desbordes, M., and Villeneuve, J.-P.: Hydrological analysis of the river Aude, France, flash flood on 12 and 13 November 1999, J. Hydrol., 286, 135–154, https://doi.org/10.1016/j.jhydrol.2003.09.015, 2004.
Gaume, E., Borga, M., Llasat, M. C., Maouche, S., Lang, M., and Diakakis, M.: Mediterranean extreme floods and flash floods. Into Hydro-meteorological extremes, chapter 3, The Mediterranean Region under Climate Change, A Scientific Update (coordinated by All Envi), 133–144, 2016.
Giorgi, F.: Climate change hot-spots, Geophys. Res. Lett., 33, https://doi.org/10.1029/2006GL025734, 2006.
Giorgi, F. and Lionello, P.: Climate change projections for the Mediterranean region, Glob. Planet. Change, 63, 90–104, https://doi.org/10.1016/j.gloplacha.2007.09.005, 2008.
Giorgi, F., Jones, C., Asrar, G. R.: Addressing climate information needs at the regional level: the CORDEX framework, World Meteorological Organization (WMO) Bulletin, 58, 175, 2009.
Giorgi, F., Torma, C., Coppola, E., Ban, N., Schär, C., and Somot, S.: Enhanced summer convective rainfall at Alpine high elevations in response to climate warming, Nat. Geosci., 9, 584–589, https://doi.org/10.1038/ngeo2761, 2016.
Hagemann, S., Machenhauer, B., Jones, R., Christensen, O. B., Déqué, M., Jacob, D., and Vidale, P. L.: Evaluation of water and energy budgets in regional climate models applied over Europe, Clim. Dynam., 23, 547–567, https://doi.org/10.1007/s00382-004-0444-7, 2004.
Harader, E.: L'impact du changement climatique sur les événements hydrologiques extrêmes des petits bassins versants méditerranéens: le cas du bassin versant du Lez, Université de Toulouse, Université Toulouse III-Paul Sabatier, 2015.
Harris, I., Jones, P. D., Osborn, T. J., and Lister, D. H.: Updated high-resolution grids of monthly climatic observations – the CRU TS3. 10 Dataset, Int. J. Climatol., 34, 623–642, https://doi.org/10.1002/joc.3711, 2014.
Haylock, M. R., Hofstra, N., Klein Tank, A. M. G., Klok, E. J., Jones, P. D., and New, M.: A European daily high-resolution gridded data set of surface temperature and precipitation for 1950–2006, J. Geophys. Res.-Atmos., 113, https://doi.org/10.1029/2008JD010201, 2008.
Herrera, S., Gutiérrez, J. M., Ancell, R., Pons, M. R., Frías, M. D., and Fernández, J.: Development and analysis of a 50-year high-resolution daily gridded precipitation dataset over Spain (Spain02), Int. J. Climatol., 32, 74–85, https://doi.org/10.1002/joc.2256, 2012.
Herrera, S., Fernández, J., and Gutiérrez, J. M.: Update of the Spain02 gridded observational dataset for EURO-CORDEX evaluation: assessing the effect of the interpolation methodology, Int. J. Climatol., 36, 900–908, https://doi.org/10.1002/joc.4391, 2016.
Jacob, D., Bärring, L., Christensen, O. B., Christensen, J. H., de Castro, M., Deque, M., Giorgi, F., Hagemann, S., Hirschi, M., Jones, R., Kjellström, E., Lenderink, G., Rockel, B., Sánchez, E., Schär, C., Seneviratne, S. I., Somot, S., van Ulden, A., and van den Hurk, B.: An inter-comparison of regional climate models for Europe: model performance in present-day climate, Clim. Change, 81, 31–52, https://doi.org/10.1007/s10584-006-9213-4, 2007.
Jacob, D., Petersen, J., Eggert, B., Alias, A., Christensen, O. B., Bouwer, L. M., Braun, A., Colette, A., Déqué, M., Georgievski, G., Georgopoulou, E., Gobiet, A., Menut, L., Nikulin, G., Haensler, A., Hempelmann, N., Jones, C., Keuler, K., Kovats, S., Kröner, N., Kotlarski, S., Kriegsmann, A., Martin, E., Meijgaard, E. van, Moseley, C., Pfeifer, S., Preuschmann, S., Radermacher, C., Radtke, K., Rechid, D., Rounsevell, M., Samuelsson, P., Somot, S., Soussana, J.-F., Teichmann, C., Valentini, R., Vautard, R., Weber, B., and Yiou, P.: EURO-CORDEX: new high-resolution climate change projections for European impact research, Reg. Environ. Change, 14, 563–578, https://doi.org/10.1007/s10113-013-0499-2, 2013.
Katragkou, E., García-Díez, M., Vautard, R., Sobolowski, S., Zanis, P., Alexandri, G., Cardoso, R. M., Colette, A., Fernandez, J., Gobiet, A., Goergen, K., Karacostas, T., Knist, S., Mayer, S., Soares, P. M. M., Pytharoulis, I., Tegoulias, I., Tsikerdekis, A., and Jacob, D.: Regional climate hindcast simulations within EURO-CORDEX: evaluation of a WRF multi-physics ensemble, Geosci. Model Dev., 8, 603–618, https://doi.org/10.5194/gmd-8-603-2015, 2015.
Kjellström, E., Boberg, F., Castro, M., Christensen, J. H., Nikulin, G., and Sánchez, E.: Daily and monthly temperature and precipitation statistics as performance indicators for regional climate models, Climate research (Open Access for articles 4 years old and older), 44, 135, https://doi.org/10.3354/cr00932, 2010.
Knutti, R., Furrer, R., Tebaldi, C., Cermak, J., and Meehl, G. A.: Challenges in combining projections from multiple climate models, Journal of Climate, 23(10), 2739–2758, https://doi.org/10.1175/2009JCLI3361.1, 2010.
Kotlarski, S., Block, A., Böhm, U., Jacob, D., Keuler, K., Knoche, R., Rechid, D., and Walter, A.: Regional climate model simulations as input for hydrological applications: evaluation of uncertainties, Adv. Geosci., 5, 119–125, 2005.
Kotlarski, S., Keuler, K., Christensen, O. B., Colette, A., Déqué, M., Gobiet, A., Goergen, K., Jacob, D., Lüthi, D., van Meijgaard, E., Nikulin, G., Schär, C., Teichmann, C., Vautard, R., Warrach-Sagi, K., and Wulfmeyer, V.: Regional climate modeling on European scales: a joint standard evaluation of the EURO-CORDEX RCM ensemble, Geosci. Model Dev., 7, 1297–1333, https://doi.org/10.5194/gmd-7-1297-2014, 2014.
Kyselỳ, J., Beguería, S., Beranová, R., Gaál, L., and López-Moreno, J. I.: Different patterns of climate change scenarios for short-term and multi-day precipitation extremes in the Mediterranean, Glob. Planet. Change, 98, 63–72, https://doi.org/10.1016/j.gloplacha.2012.06.010, 2012.
Llasat, M. C., Llasat-Botija, M., and López, L.: A press database on natural risks and its application in the study of floods in Northeastern Spain, Nat. Hazards Earth Syst. Sci., 9, 2049–2061, https://doi.org/10.5194/nhess-9-2049-2009, 2009.
Llasat, M. C., Marcos, R., Llasat-Botija, M., Gilabert, J., Turco, M., and Quintana-Seguí, P.: Flash flood evolution in North-Western Mediterranean, Atmos. Res., 149, 230–243, https://doi.org/10.1016/j.atmosres.2014.05.024, 2014.
Llasat, M. C., Marcos, R., Turco, M., Gilabert, J., and Llasat-Botija, M.: Trends in flash flood events versus convective precipitation in the Mediterranean region: The case of Catalonia, J. Hydrol., 541, 24–37, https://doi.org/10.1016/j.jhydrol.2016.05.040, 2016.
Lucas-Picher, P., Caya, D., de Elía, R., and Laprise, R.: Investigation of regional climate models' internal variability with a ten-member ensemble of 10-year simulations over a large domain, Clim. Dynam., 31, 927–940, https://doi.org/10.1007/s00382-008-0384-8, 2008.
Maraun, D., Osborn, T. J., and Rust, H. W.: The influence of synoptic airflow on UK daily precipitation extremes, Part II, regional climate model and E-OBS data validation, Clim. Dynam., 39, 287–301, https://doi.org/10.1007/s00382-011-1176-0, 2012.
Meinshausen, M., Smith, S. J., Calvin, K., Daniel, J. S., Kainuma, M. L. T., Lamarque, J. F., Matsumoto, K., Montzka, S. A., Raper, S. C. B., Riahi, K., Thomson, A., Velders, G. J. M., and van Vuuren D. P. P.: The RCP greenhouse gas concentrations and their extensions from 1765 to 2300, Clim. Change, 109, 213–241, https://doi.org/10.1007/s10584-011-0156-z, 2011.
Metzger, M. J., Bunce, R. G. H., Jongman, R. H. G., Mücher, C. A., and Watkins, J. W.: A climatic stratification of the environment of Europe, Glob. Ecol. Biogeogr., 14, 549–563, https://doi.org/10.1111/j.1466-822X.2005.00190.x, 2005.
Milano, M., Ruelland, D., Fernandez, S., Dezetter, A., Fabre, J., Servat, E., Fritsch, J.-M., Ardoin-Bardin, S., and Thivet, G.: Current state of Mediterranean water resources and future trends under climatic and anthropogenic changes, Hydrol. Sci. J., 58, 498–518, https://doi.org/10.1080/02626667.2013.774458, 2013.
Nuissier, O., Ducrocq, V., Ricard, D., Lebeaupin, C., and Anquetin, S.: A numerical study of three catastrophic precipitating events over southern France, I: Numerical framework and synoptic ingredients, Q. J. Roy. Meteorol. Soc., 134, 111–130, https://doi.org/10.1002/qj.200, 2008.
Nuissier, O., Joly, B., Joly, A., Ducrocq, V., and Arbogast, P.: A statistical downscaling to identify the large-scale circulation patterns associated with heavy precipitation events over southern France, Q. J. Roy. Meteorol. Soc., 137, 1812–1827, https://doi.org/10.1002/qj.866, 2011.
Mearns, L. O., Gutowski, W., Jones, R., Leung, R., Macginnis, S., Nunes, A., and Qian, Y.: A regional climate change assessment program for North America, Eos, 90, https://doi.org/10.1029/2009EO360002, 2009.
Paxian, A., Hertig, E., Seubert, S., Vogt, G., Jacobeit, J., and Paeth, H.: Present-day and future mediterranean precipitation extremes assessed by different statistical approaches, Clim. Dynam., 44, 845–860, https://doi.org/10.1007/s00382-014-2428-6, 2015.
Prein, A. F., Gobiet, A., Truhetz, H., Keuler, K., Goergen, K., Teichmann, C., Maule, C. F., Van Meijgaard, E., Déqué, M., Nikulin, G., and others: Precipitation in the EURO-CORDEX 0.11∘ and 0.44∘ simulations: high resolution, high benefits, Clim. Dynam., 46, 383–412, https://doi.org/10.1007/s00382-015-2589-y, 2016.
Quintana Seguí, P., Ribes, A., Martin, E., Habets, F., and Boé, J.: Comparison of three downscaling methods in simulating the impact of climate change on the hydrology of Mediterranean basins, J. Hydrol., 383, 111–124, https://doi.org/10.1016/j.jhydrol.2009.09.050, 2010.
Quintana-Seguí, P., Le Moigne, P., Durand, Y., Martin, E., Habets, F., Baillon, M., Canellas, C., Franchisteguy, L., and Morel, S.: Analysis of Near-Surface Atmospheric Variables: Validation of the SAFRAN Analysis over France, J. Appl. Meteor. Climatol., 47, 92–107, https://doi.org/10.1175/2007JAMC1636.1, 2008.
Quintana-Seguí, P., Habets, F., and Martin, E.: Comparison of past and future Mediterranean high and low extremes of precipitation and river flow projected using different statistical downscaling methods, Nat. Hazards Earth Syst. Sci., 11, 1411–1432, https://doi.org/10.5194/nhess-11-1411-2011, 2011.
Quintana-Seguí, P., Peral, C., Turco, M., Llasat, M. C., and Martin, E.: Meteorological Analysis Systems in North-East Spain: Validation of SAFRAN and SPAN, J. Environ. Inf., 27, https://doi.org/10.3808/jei.201600335, 2016a.
Quintana-Seguí, P., Turco, M., Herrera, S., and Miguez-Macho, G.: Validation of a new SAFRAN-based gridded precipitation product for Spain and comparisons to Spain02 and ERA-Interim, https://doi.org/10.5194/hess-2016-349, 21, 2187, 2017.
Ramis, C., Llasat, M. C., Genovés, A., and Jansà, A.: The October-1987 floods in Catalonia: Synoptic and mesoscale mechanisms, Meteorol. Appl., 1, 337–350, https://doi.org/10.1002/met.5060010404, 1994.
Reifen, C. and Toumi, R.: Climate projections: Past performance no guarantee of future skill?, Geophys. Res. Lett., 36, https://doi.org/10.1029/2009GL038082, 2009.
Raynaud, F., Borrell-Estupina, V., Pistre, S., Van-Exter, S., Bourgeois, N., Dezetter, A., and Servat, E.: Combining hydraulic model, hydrogeomorphological observations and chemical analyses of surface waters to improve knowledge on karst flash floods genesis, Proc. Int. Assoc. Hydrol. Sci., 369, 55–60, 2015.
Riahi, K., Grübler, A., and Nakicenovic, N.: Scenarios of long-term socio-economic and environmental development under climate stabilization, Technol. Forecast. Soc. Change, 74, 887–935, https://doi.org/10.1016/j.techfore.2006.05.026, 2007.
Ricard, D., Ducrocq, V., and Auger, L.: A climatology of the mesoscale environment associated with heavily precipitating events over a northwestern Mediterranean area, J. Appl. Meteorol. Climatol., 51, 468–488, https://doi.org/10.1175/JAMC-D-11-017.1, 2012.
Schär, C., Ban, N., Fischer, E. M., Rajczak, J., Schmidli, J., Frei, C., Giorgi, F., Karl, T. R., Kendon, E. J., Tank, A. M. K., O'Gorman, P. A., Sillmannn, J., Zhang, X., and Zwiers, F. W.: Percentile indices for assessing changes in heavy precipitation events, Clim. Change, 137, 201–216, https://doi.org/10.1007/s10584-016-1669-2, 2016.
Themeßl, M. J., Gobiet, A., and Heinrich, G.: Empirical-statistical downscaling and error correction of regional climate models and its impact on the climate change signal, Clim. Change, 112, 449–468, https://doi.org/10.1002/joc.2168, 2012.
Tramblay, Y., Ruelland, D., Somot, S., Bouaicha, R., and Servat, E.: High-resolution Med-CORDEX regional climate model simulations for hydrological impact studies: a first evaluation of the ALADIN-Climate model in Morocco, Hydrol. Earth Syst. Sci., 17, 3721–3739, https://doi.org/10.5194/hess-17-3721-2013, 2013.
Trapero, L., Bech, J., Duffourg, F., Esteban, P., and Lorente, J.: Mesoscale numerical analysis of the historical November 1982 heavy precipitation event over Andorra (Eastern Pyrenees), Nat. Hazards Earth Syst. Sci., 13, 2969–2990, https://doi.org/10.5194/nhess-13-2969-2013, 2013.
van der Linden P. and J. F. B. Mitchell (eds.): ENSEMBLES: Climate Change and its Impacts: Summary of research and results from the ENSEMBLES project. Met Office Hadley Centre, FitzRoy Road, Exeter EX1 3PB, Uk, 160 pp, 2009.
Van Vuuren, D. P., Edmonds, J., Kainuma, M., Riahi, K., Thomson, A., Hibbard, K., Hurtt, G. C., Kram, T., Krey, V., Lamarque, J.-F., Masui, T., Meinshausen, M., Nakicenovic, N., Smith, S. J., and Rose, S. K.: The representative concentration pathways: an overview, Clim. Change, 109, 5–31, https://doi.org/10.1007/s10584-011-0148-z, 2011.
Vidal, J.-P., Martin, E., Franchistéguy, L., Baillon, M., and Soubeyroux, J.-M.: A 50-year high-resolution atmospheric reanalysis over France with the Safran system, Int. J. Climatol., 30, 1627–1644, https://doi.org/10.1002/joc.2003, 2010.