the Creative Commons Attribution 4.0 License.
the Creative Commons Attribution 4.0 License.
 | 21 Feb 2019
Global joint assimilation of GRACE and SMOS for improved estimation of root-zone soil moisture and vegetation response
Luigi J. Renzullo
Albert I. J. M. van Dijk
Paul Tregoning
Jeffrey P. Walker
The lack of direct measurement of root-zone soil moisture poses a challenge to the large-scale prediction of ecosystem response to variation in soil water. Microwave remote sensing capability is limited to measuring moisture content in the uppermost few centimetres of soil. The GRACE (Gravity Recovery and Climate Experiment) mission detected the variability in storage within the total water column. However, root-zone soil moisture cannot be separated from GRACE-observed total water storage anomalies without ancillary information on surface water and groundwater changes. In this study, GRACE total water storage anomalies and SMOS near-surface soil moisture observations were jointly assimilated into a hydrological model globally to better estimate the impact of changes in root-zone soil moisture on vegetation vigour. Overall, the accuracy of root-zone soil moisture estimates through the joint assimilation of surface soil moisture and total water storage retrievals showed improved consistency with ground-based soil moisture measurements and satellite-observed greenness when compared to open-loop estimates (i.e. without assimilation). For example, the correlation between modelled and in situ measurements of root-zone moisture increased by 0.1 (from 0.48 to 0.58) and 0.12 (from 0.53 to 0.65) on average for grasslands and croplands, respectively. Improved correlations were found between vegetation greenness and soil water storage on both seasonal variability and anomalies over water-limited regions. Joint assimilation results show a more severe deficit in soil water anomalies in eastern Australia, southern India and eastern Brazil over the period of 2010 to 2016 than the open-loop, consistent with the satellite-observed vegetation greenness anomalies. The assimilation of satellite-observed water content contributes to more accurate knowledge of soil water availability, providing new insights for monitoring hidden water stress and vegetation conditions.
- Article
(8276 KB) - Full-text XML
- BibTeX
- EndNote


Water is a growth-limiting resource that impacts over 40 % of Earth's vegetated surface (Nemani et al., 2003). Vegetation productivity and water stress are strongly coupled by the interactions between soil moisture, photosynthesis, transpiration, interception, and hydraulic redistribution (Porporato et al., 2004). The amount of water available to support plant growth and buffer against rainfall deficiencies largely determines the length of the growing period (Leenaars et al., 2018). Rooting depth as an essential parameter in hydrological modelling to regulate correct simulation of subsurface processes has been estimated based on various scientific hypotheses due to the lack of direct measurements (Wang-Erlandsson et al., 2016; Yang et al., 2016). Although some vegetation species have roots that can grow to tens of metres in depth (Canadell et al., 1996), most plants have roots that are contained in the upper 2 m of the soil column and thus cannot access the deeper water stores (Tokumoto et al., 2014). For example, Dunne and Willmott (1996) derived a global distribution map of plant-extractable soil water capacity based on soil water retention properties, soil texture, and organic content estimates and found that less than 150 mm of the water capacity can be accessed by the plants over 90 % of the vegetated area. The duration of water stress and the vertical distribution of soil moisture determine the vegetation vigour to a large extent in drylands (Canadell et al., 1996). Stress due to limited soil water can trigger a reduction in photosynthesis, which in turn leads to reduced productivity and increased vegetation mortality. The increasing deficit in deep soil water under a changing climate may further intensify ecological droughts during the growing season (Schlaepfer et al., 2017). There is a compelling need to quantify the vegetation responses to water scarcity for improved assessment of climate change impacts at large scales (Breshears et al., 2005).
Wang et al. (2007) and Santos et al. (2014) investigated different responses of vegetation vigour to ground-based root-zone soil moisture observations at different depths. There are limited studies on the impacts of soil water availability on the functions in terrestrial ecosystems at regional to global scale due to the absence of widespread direct observations of root-zone soil moisture. Soil moisture simulations and satellite water content observations from the uppermost soil layer to the total water column have been used to quantify the water-driven surface vegetation greenness variability (Laio et al., 2001; Wang et al., 2007; Andela et al., 2013; Chen et al., 2014; Yang et al., 2014; Xie et al., 2016a). However, model-simulated soil moisture profile estimates are highly uncertain due to the necessary simplification of processes and parameterization (Porporato et al., 2004). Soil moisture observations from in situ monitoring networks or satellite observations are generally spatially, vertically, and temporally constrained by the instruments. Satellite soil moisture retrievals from microwave sensors such as SMOS (Soil Moisture and Ocean Salinity) only provide the soil moisture in the uppermost soil layer and are limited by the errors introduced by soil type, canopy cover, and surface roughness (Houser et al., 1998; Narayan et al., 2004). In contrast, the GRACE (Gravity Recovery and Climate Experiment) mission provided integrated water storage change including water above and under the surface through mapping anomalies in the changing Earth's gravity field (Tapley et al., 2004). It has been demonstrated that GRACE-observed total water storage anomalies can explain changes in surface greenness both interannually and seasonally without time lag over Australia (Yang et al., 2014). Conversely, Chen et al. (2014) found that vegetation greenness typically lags soil moisture at less than 10 cm depth by 1 month over mainland Australia using merged satellite soil moisture products (Liu et al., 2012). This discrepancy in the time lags indicates that vegetation responds differently to variations in surface soil moisture and total water storage. The quantification of vegetation response to soil water availability at a large scale therefore remains challenging without accurate soil moisture profile estimations.
Observations of near-surface soil moisture have been successfully integrated into land surface models to correct model deficiencies in simulating soil moisture using various assimilation techniques (Walker and Houser, 2001; Sabater et al., 2007; Crow et al., 2008; Renzullo et al., 2014; Dumedah et al., 2015). Active/radar and passive/radiometer observations were jointly assimilated to improve surface soil moisture and root-zone soil moisture with optimal accuracy and spatial coverage by Draper et al. (2012) and Lievens et al. (2017). Significant improvements were mainly found for shallow root-zone estimation at 0–30 cm (Draper et al., 2012; Renzullo et al., 2014), with less benefit for deeper soil layers. Conversely, GRACE-observed total water storage anomalies were successfully assimilated or otherwise combined with model simulations for improved deep soil and groundwater estimation (Zaitchik et al., 2008; van Dijk et al., 2014; Tangdamrongsub et al., 2015, 2018; Khaki et al., 2017; Schumacher et al., 2018; Girotto et al., 2017), but with typically marginal improvements for surface and shallow soil moisture (Li et al., 2012; Girotto et al., 2017; Tian et al., 2017; Tangdamrongsub et al., 2018; Shokri et al., 2018). This is due to the highly variable nature of near-surface and shallow soil moisture in space and time, which has little influence on the GRACE signal. Recently, near-surface soil moisture and total water storage observations were jointly assimilated into a water balance model over Australia and demonstrated to consistently improve water storage profile estimates, especially in the root-zone soil moisture estimates (Tian et al., 2017). The use of satellite-observed daily near-surface soil moisture has been demonstrated to better disaggregate shallow soil moisture and groundwater change from GRACE-observed total water storage change because of the different temporal dynamics.
In this study, satellite-observed soil moisture and changes in total water storage were jointly assimilated into a global water balance model following the approach of Tian et al. (2017) and extended with several further innovations. We investigated the impacts of assimilating satellite water content retrievals on the estimation of surface and root-zone soil moisture and evaluated them with ground-based soil moisture measurements. The relationship between vegetation vigour and soil water availability was assessed with satellite-observed greenness and root-zone soil moisture estimates for different vegetation types. The performance of the joint assimilation is compared against the open-loop model and alternative assimilation methods. The annual trends of root-zone soil water storage anomalies are compared with the trends in vegetation greenness anomalies to investigate the potential of using accurate information of soil water availability for explaining and anticipating vegetation greenness and productivity.
2.1 Ecohydrological model
The World-Wide Water (W3) model (van Dijk et al., 2013b) (available at http://wald.anu.science, last access: 20 January 2019) is a one-dimensional, grid-based distributed ecohydrological model that simulates water balance and water-related vegetation dynamics. It was adapted from the Australian Water Resources Assessment Landscape (AWRA-L) model (van Dijk, 2010; Frost et al., 2016). Precipitation is assumed to be the only water input into the system. The precipitation enters the grid cell through the vegetation and soil moisture stores and exits the grid cell through evapotranspiration, run-off, or groundwater discharge (Frost et al., 2016). Each grid cell contains a mix of land cover classes (hydrological response units; HRUs) and is conceptualized as a catchment that does not laterally exchange water with neighbouring cells. Different vegetation has different degrees of access to soil water. Soil and vegetation water and energy fluxes were simulated separately for deep-rooted and shallow-rooted vegetation to consider different rooting and water uptake behaviour. The soil water store was partitioned into three layers, namely, top, shallow, and deep soil to describe the plant-available water, approximately 0–5 cm, 0.05–1 m, and 1–10 m in depth, respectively. A simple groundwater model is used to simulate unconfined groundwater storage considering deep drainage from soil water, capillary rise, and groundwater evaporation and discharge. The unconfined groundwater and surface water stores were simulated at grid cell level.
A 0.25∘ × 0.25∘ global gridded Multi-Source Weighted-Ensemble Precipitation (MSWEP) data set derived by merging gauge, satellite, and reanalysis data (Beck et al., 2017) was used as the only water input in the system. The 0.5∘ × 0.5∘ WFDEI (WATCH Forcing Data methodology applied to ERA-Interim) meteorological forcing data set (Weedon et al., 2014) used in this study included radiation, air temperature, wind speed, and surface pressure, and these were resampled to be consistent with the resolution of precipitation at 0.25∘. The soil water balance of the W3 model was simulated globally on a daily basis with a spatial resolution of 0.25∘ × 0.25∘.
2.2 Land cover types
The 2010 land cover types of each pixel were characterized by the MODIS (Moderate Resolution Imaging Spectroradiometer) global IGBP (International Geosphere-Biosphere Programme) land cover classifications (MCD12Q1) at resolution (Channan et al., 2014). The number of pixels at resolution for each land cover type in all the corresponding 0.25∘ × 0.25∘ grid cells were counted to determine the sub-pixel heterogeneity. If the land cover type is identical for the corresponding model grid cell, the land cover type of this model grid cell is considered to be homogeneous. Model grid cells with multiple land cover types and over 60 % grassland were defined as grassland-dominated mixed vegetation. Similarly, model grid cells with mostly forest were classified as forest-dominated pixels. Grid cells with multiple different land covers were classified as mixed land cover. The forest cover of each 0.25∘ × 0.25∘ grid cell was calculated with the percentage of forest (including evergreen, deciduous, and mixed forest) pixels to investigate the impact of woody vegetation on soil moisture estimation.
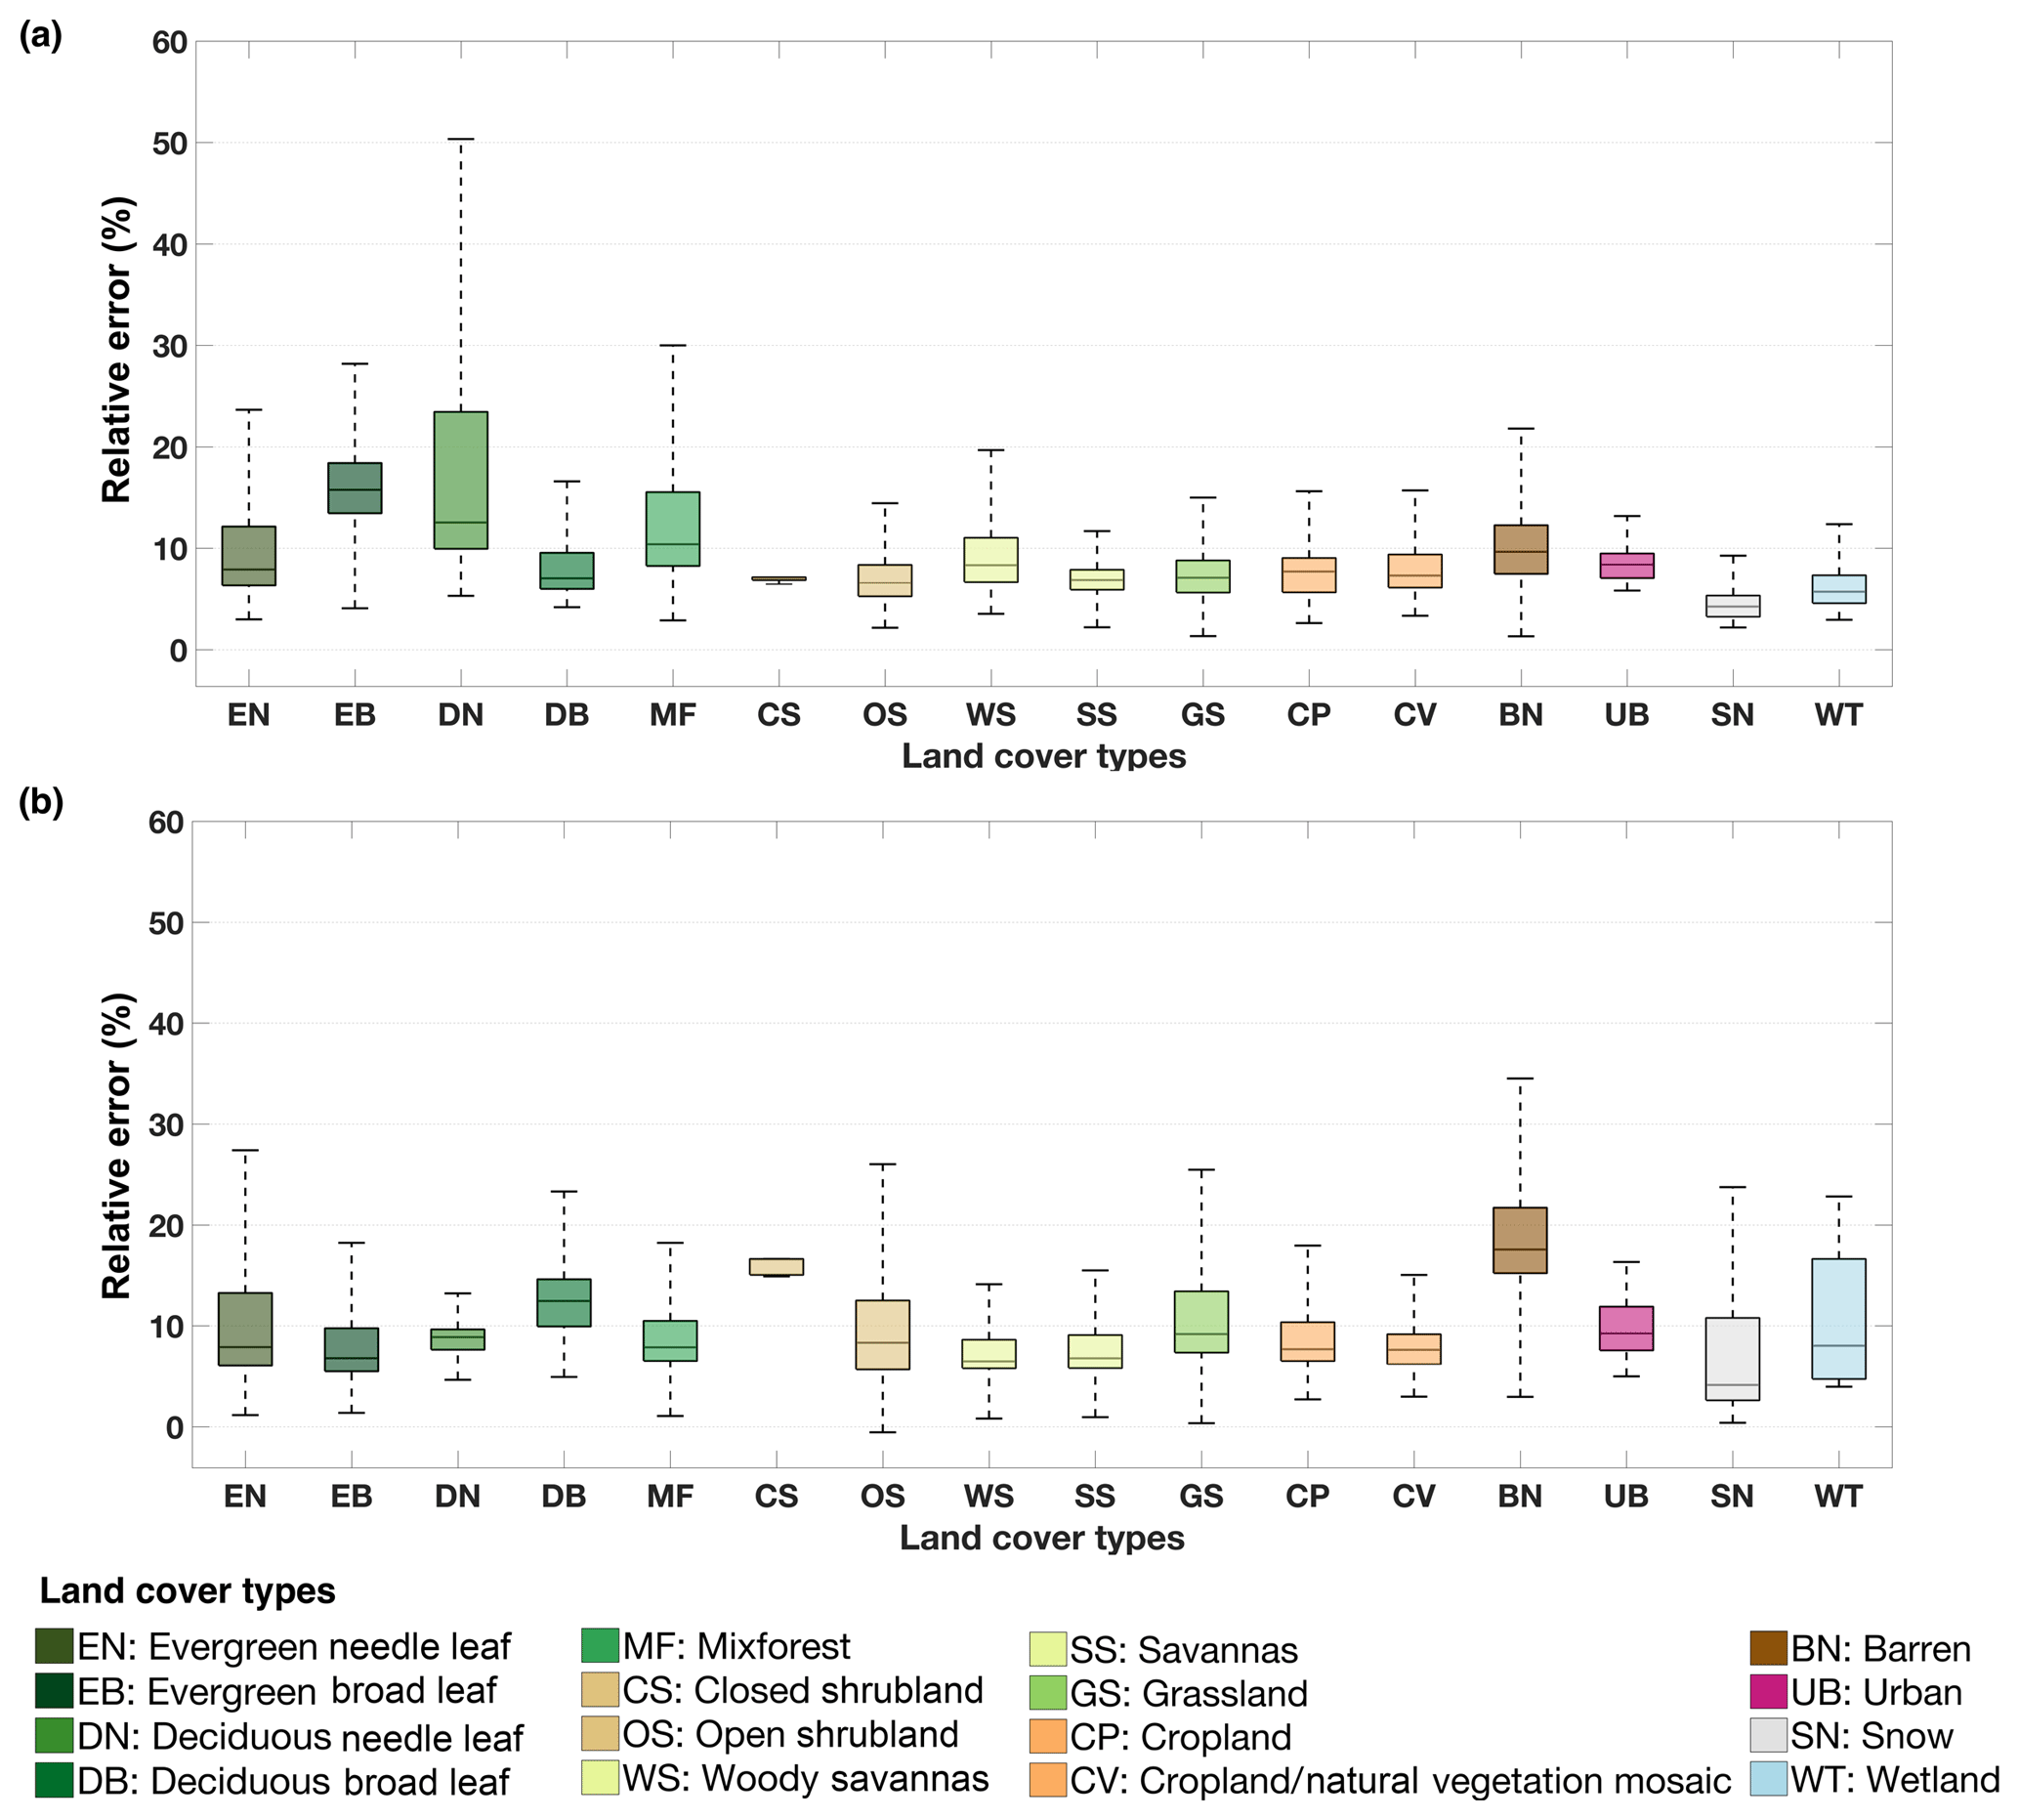
Figure 1Averaged relative error of satellite-observed water content in different land cover types for (a) SMOS-derived soil moisture; and (b) GRACE-derived total water storage.
2.3 Satellite-observed water content
Satellite-observed near-surface soil moisture from SMOS and total water storage from GRACE were used in this study. GRACE tracked the water movement from space by measuring the changes in the distance between the twin satellites caused by surface mass variations (Tapley et al., 2004). The JPL RL05M mass concentration (mascon) GRACE solutions (Watkins et al., 2015) were used to constrain model-simulated total water storage (i.e. the integration of surface water, soil water at three layers and groundwater stores). The GRACE data were represented on a 0.25∘ grid, but they represent the native resolution of 3∘ × 3∘ equal-area caps. In contrast with sensing the integrated water content, SMOS characterizes global temporal change in near-surface (0–5 cm) soil moisture from the microwave brightness temperature observations every 3 days (Kerr et al., 2010). The 0.25∘ Level-3 global daily soil moisture retrievals from CADTS (Centre Aval de Traitement des Données SMOS, https://www.catds.fr, last access: 15 August 2018) (Jacquette et al., 2010; Kerr et al., 2013) for ascending and descending orbits were averaged over the overlapping area. The temporally and spatially varying uncertainties of GRACE and SMOS retrievals were provided as part of their respective products, and were used to investigate observation error variance–covariance matrices in the assimilation method. The relative error was calculated as the ratio of the uncertainty over the absolute value for both GRACE and SMOS retrievals for each grid cell at each time step. The average uncertainties for SMOS and GRACE observations were categorized based on land cover types to investigate the relative weighting between observations in the assimilation (Fig. 1).
2.4 International soil moisture network
In situ soil moisture observations at different depths available from the International Soil Moisture Network (ISMN) (Dorigo et al., 2011) were used to evaluate the performance of model-simulated soil moisture for the uppermost soil layer and root zone. An additional level of quality control was imposed here on the ISMN data to eliminate those sites with less than 2 years of data record, having persistently low or high values, or possessing inexplicable spikes or breaks in the time series. In total, 164 stations from 19 measurement networks provided near-surface (0–5 cm) soil moisture observation globally, while 197 stations from 15 networks provided root-zone soil moisture at 0–1 m (Fig. 2). Hourly observations were averaged over a 24 h period to give daily moisture measurements. Stations with multiple measurements for soil moisture within 1 m depth were aggregated to soil moisture at 0–1 m. The 98th and 2nd percentiles of the data records for each site were assumed to represent the field capacity and wilting point required for the calculation of relative wetness.
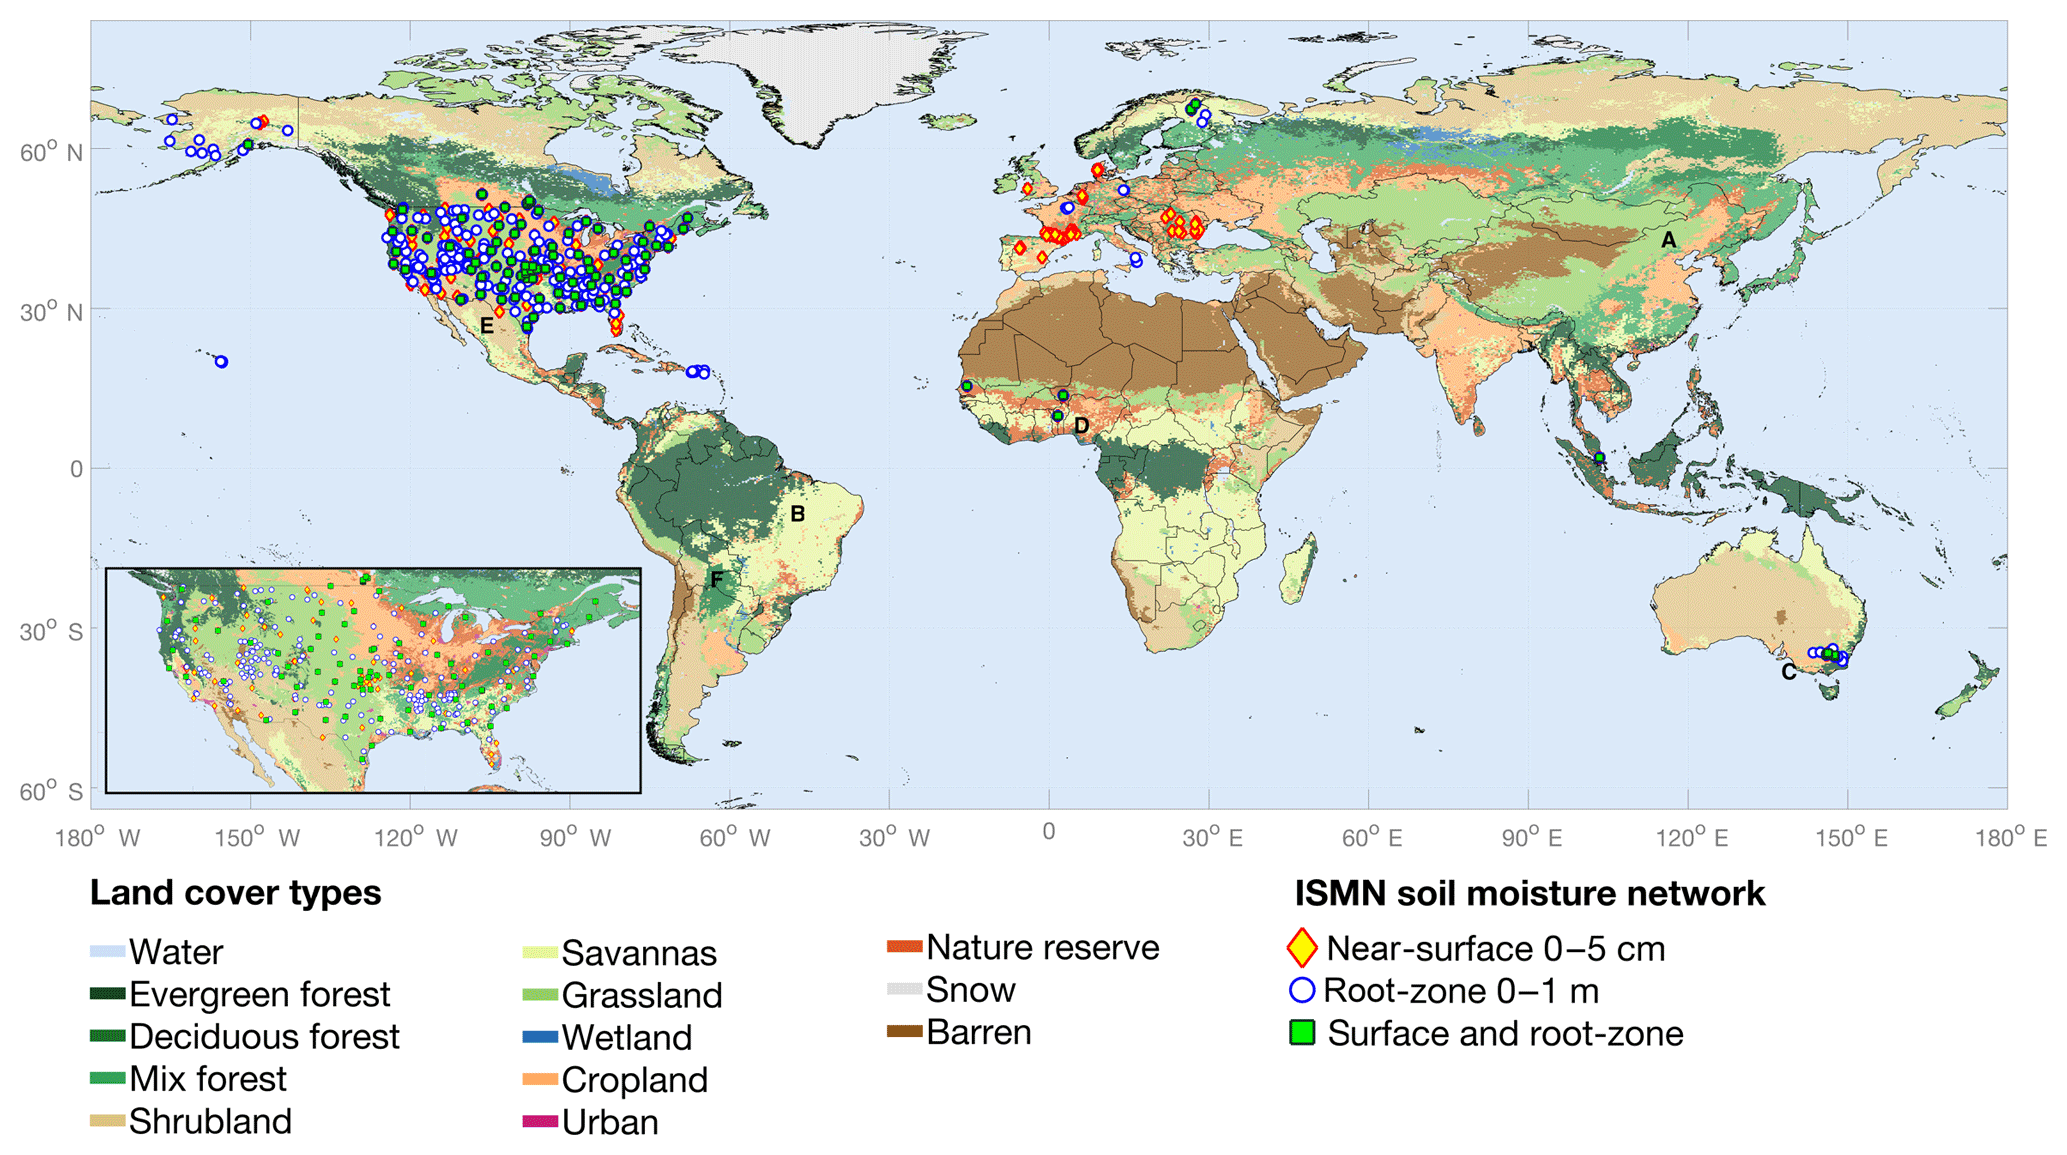
Figure 2Distribution of in situ near-surface and root-zone soil moisture sites from the International Soil Moisture Network (ISMN) overlaid on the background of MODIS IGBP (International Geosphere-Biosphere Programme) land cover classifications (MCD12Q1).
2.5 Satellite-observed greenness
The MODIS 0.05∘ monthly normalized difference vegetation index (NDVI) product (MOD13C2) (Didan and Huete, 2015) derived from atmospherically corrected reflectance in red and near-infrared wavelengths was used as a simple and robust indicator of vegetation greenness. The MOD13C2 NDVI data were aggregated to 0.25∘ to be comparable with model simulations from January 2010 to December 2016. Areas of the Earth's surface that never exceeded a maximum NDVI value of 0.2 over this period were masked as barren land.
3.1 Data assimilation
Satellite-derived total water storage and near-surface soil moisture were jointly assimilated into the global W3 model from 2010 to 2016. Systematic differences between model and observations need to be removed to ensure optimal performance of the assimilation method (Evensen, 1994; Dee, 2005; Renzullo et al., 2014). Since the W3 model only specifies soil water storage in water depth (mm) rather than prescribing a physical thickness of the soil layers and porosity, the model-simulated soil water availability cannot be directly compared with SMOS soil moisture retrievals in volumetric fraction. To resolve the inconsistency between model and satellite observations in representing the near-surface soil water availability, both SMOS retrievals and W3-simulated top-layer soil water storage (θt) were converted to relative wetness (wt) (0–1) with respect to the dry (θwt) and wet (θfc) extremes over the 7-year period, calculated as the 2nd and 98th percentiles, respectively (Eq. 1).
For total water storage, it was a simple matter of adding the W3 model-simulated total water storage averaged over 2004–2009 to the GRACE-observed water storage anomaly for absolute total water storage values.
Due to the disparity in temporal and spatial resolution and measurement depths between SMOS and GRACE, these contrasting satellite water content observations were assimilated using an ensemble-based Kalman smoother approach with a 1-month window, following the approach of Tian et al. (2017). Total water storage together with soil moisture data were used to constrain model-simulated water storage components formed as the state vector x, including vegetation water and soil water (top, shallow, and deep layers) for each hydrological response unit, surface water (rivers, lakes), and unconfined groundwater. The observation vector y consisted of the available daily SMOS surface soil moisture and the GRACE total water storage in a month at each grid. Model error variance Pf was derived from 100 ensemble members of the state variable, generated through the perturbation of precipitation, radiation, and air temperature data. The analysis states xa were updated with the forecast states xf and the weighted difference between the observations and forecasts at the end of every month (Eq. 2), i.e.
The matrix above, known as the Kalman gain, determines the degree of influence that observation y has on changing the model forecast state, xf.
Spatially and temporally varying uncertainties from GRACE and SMOS products, characterized by R, were used in the assimilation to represent the observation error covariance matrix. Tian et al. (2017) applied an artificial weighting factor to the uncertainties of GRACE and SMOS data to compensate for the over-adjustment from SMOS due to the inconsistency in units between SMOS and GRACE data. In this study, the first part of the observation operator H converts SMOS soil moisture retrievals firstly into relative wetness (Eq. 1) and then into available water content (in millimetres) for the uppermost soil layer. The field capacity and wilting point from model simulations for the top 5 cm were applied to both soil wetness and uncertainties. No further weighting factor was required between GRACE and SMOS data after converting SMOS data to equivalent water height. Both ascending and descending SMOS soil moisture retrievals were used to improve the spatial coverage. The second part of the observation operator computes the monthly mean from the sum of daily water storage components in the state vector. The state variables for the next time step of the model forward run were initialized with the analysis states.
The open-loop run (without assimilation of any observation), the assimilation of soil moisture alone, and the assimilation of total water storage alone were also evaluated to examine different impacts of different satellite data on soil moisture profile adjustments. The same ensemble Kalman smoother was applied to the assimilation of SMOS alone (SMOS-only) and the assimilation of GRACE alone (GRACE-only) to compare with the joint assimilation. Since the uncertainty in SMOS data varies considerably between land cover types, another joint assimilation experiment (Joint-landcover) was conducted where SMOS uncertainties were increased by 50 % of the reported value over dense forest area (tree cover > 0.7), implemented to identify any possible underestimation of SMOS uncertainties in forest regions.
3.2 Evaluation of soil moisture estimates
Estimates of soil water content in the uppermost soil layer (0–5 cm) and root zone (0–1 m) after the joint assimilation were evaluated against in situ soil moisture observations from ISMN. The in situ stations within the corresponding model grid cell were aggregated to represent the soil moisture at 0.25∘ scale. The in situ soil moisture monitoring sites were grouped based on the land cover type of the corresponding model grid cell. Both model-simulated and satellite-observed soil moisture were transformed to relative wetness to resolve differences in units and depths between model simulations and in situ observations (Eq. 1). The performance of soil moisture estimation was statistically evaluated with Pearson correlation (r) and root-mean-square error (RMSE) for the open-loop and different assimilation experiments.
3.3 Analysis of vegetation response to root-zone soil moisture
In this study, satellite-observed vegetation greenness was used as an independent evaluation of root-zone soil moisture estimates in water-limited regions. Thirty years of monthly potential evapotranspiration and precipitation data were used to derive the aridity index. The aridity was simply calculated by averaging the fraction of months that potential evapotranspiration exceeded precipitation in a year. The humid regions with aridity index less than 0.4 were masked out in the evaluation. The correlations between satellite-observed vegetation greenness and soil water storage from different sources were calculated for comparison. The deseasonalized NDVI and soil water storage were derived to investigate the impacts of data assimilation on simulating seasonal cycle and anomalies. The estimation of soil water availability used in the comparisons included SMOS soil moisture, GRACE total water storage, model-simulated root-zone soil moisture via the joint assimilation, and the precipitation-based soil moisture estimates from the antecedent precipitation index (API). The API was calculated using the MSWEP precipitation data with a constant decay coefficient of 0.9 (Hooke, 1979). The API was used as it better represents the cumulative effects of precipitation than individual rainfall events on vegetation response. The statistical improvement in correlation was used as an indicator of enhanced performance in simulating seasonal pattern and the deviation of monthly mean.
The soil water availability at the integrated depth that has the maximum correlation with NDVI best explains the changes in surface greenness at each grid cell, so-called vegetation-accessible storage (Tian et al., 2019). The correlations of monthly NDVI and soil moisture estimates integrated over different depths after joint assimilation were calculated. The soil water storage estimates were integrated at four depths: near-surface (0–5 cm), shallow-root zone (0–1 m), deep-root zone (0–10 m), and total water column. Annual trends of the accessible storage anomalies relative to monthly means were calculated to determine the area under soil water stress. Linear trend analysis was also applied to the annual average NDVI anomalies to investigate the consistency between vegetation greenness and soil water storage. The trends in accessible storage derived from the open-loop and joint assimilation were compared with the trends in NDVI to investigate the change in annual trend after data assimilation.
4.1 Near-surface and root-zone soil moisture estimation
SMOS soil wetness and W3 top-layer soil wetness from open-loop and data assimilation were compared with the in situ near-surface soil wetness observations from ISMN (Fig. 3). Satellite observations of soil moisture (SMOS) were generally better correlated with in situ soil moisture observations over non-forest areas than open-loop simulations (Fig. 3a). However, as the fraction of tree cover increases, the relative performance changes and model simulations tend to be better correlated with in situ measurements than SMOS observations. The joint assimilation of both SMOS and GRACE observations (Fig. 3b) shows improved correlation with in situ measurements compared with the model open-loop over the majority of the sites where SMOS observations better correlated with in situ measurements. This improvement is due to data assimilation bringing the model and SMOS soil moisture into better agreement for these sites, as illustrated in Fig. 3c for a grassland site. On the other hand, joint assimilation largely reduces the degradation on surface soil moisture over forest sites where SMOS retrievals are less accurate than model simulations (dark green dots in Fig. 3a and time series in Fig. 3d).
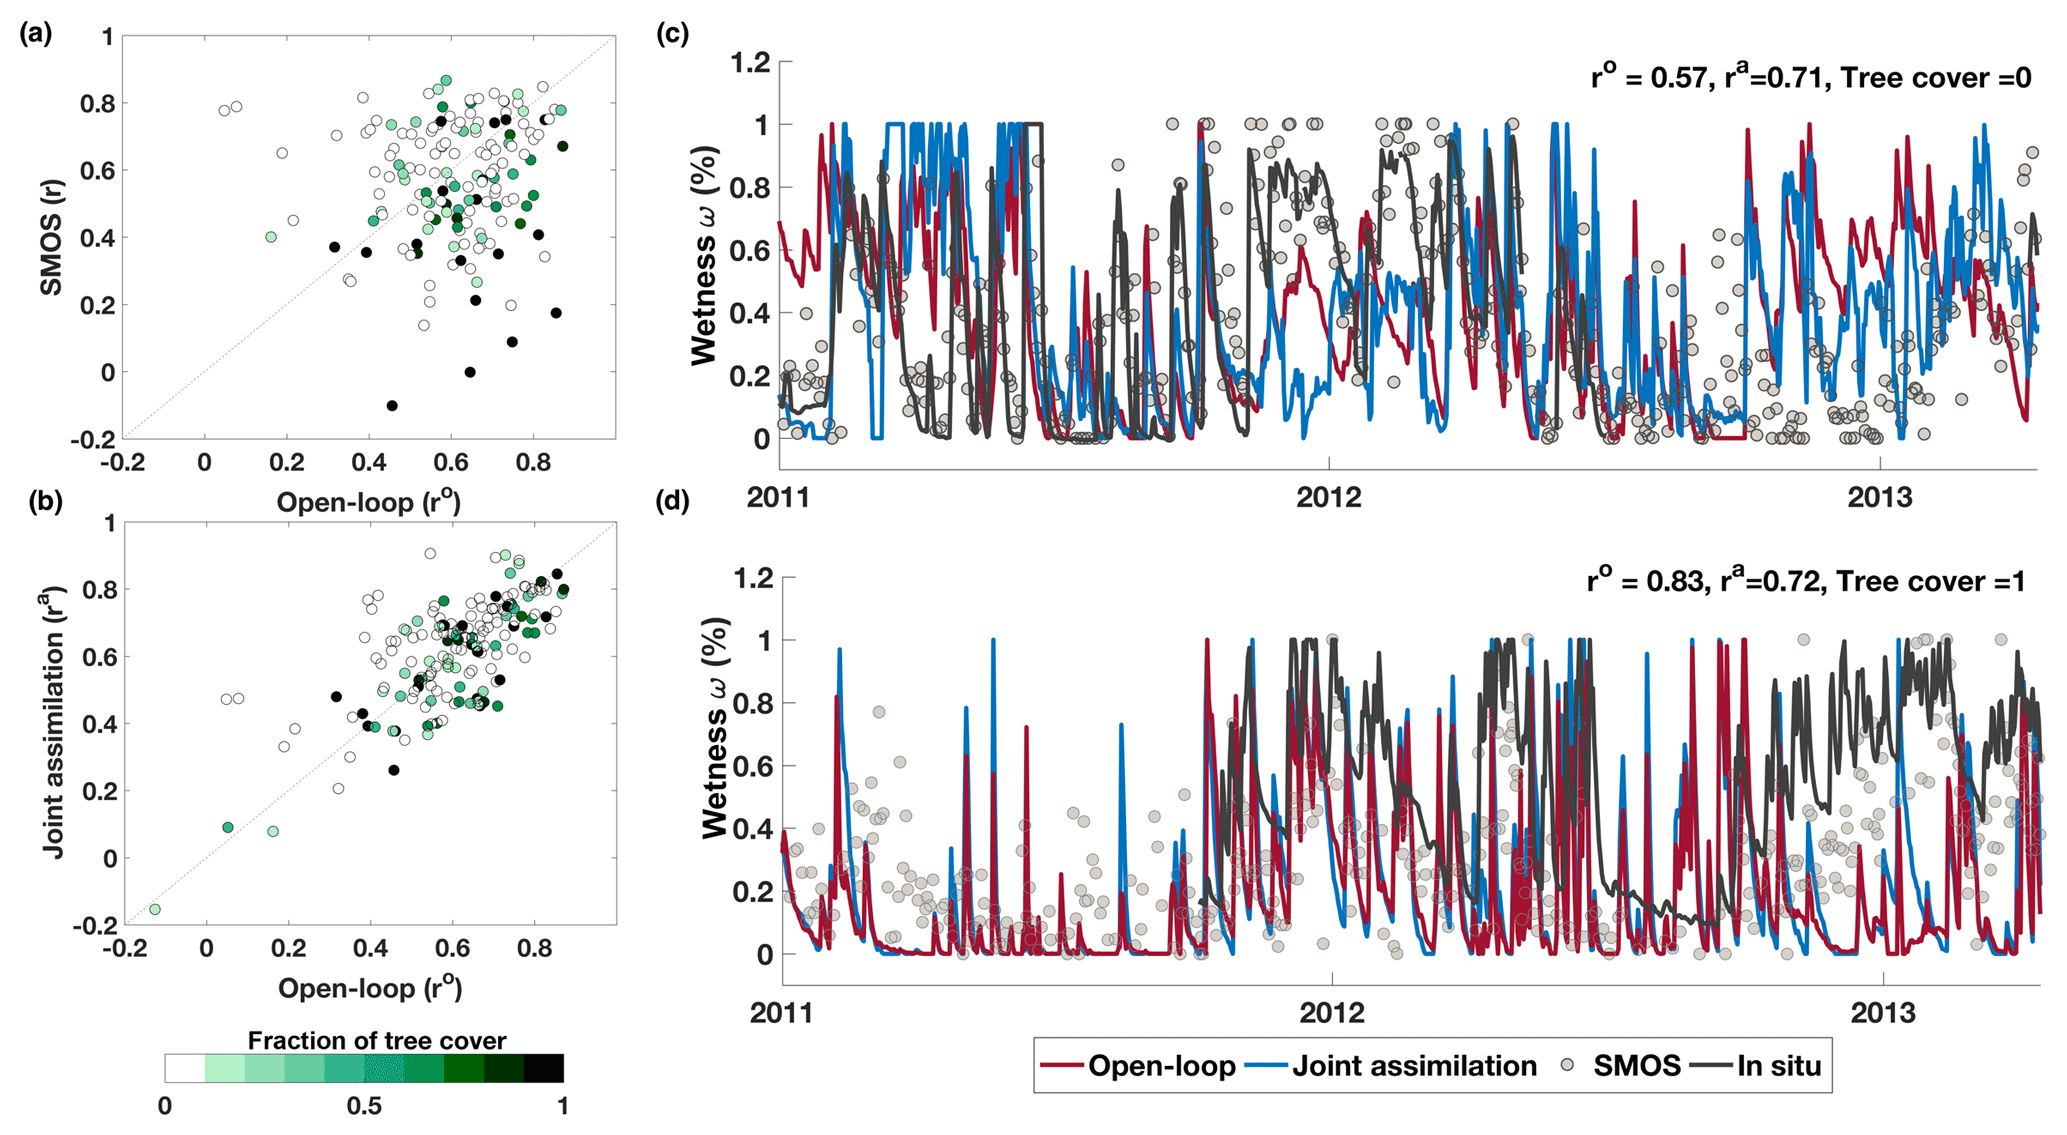
Figure 3Assessment of near-surface soil moisture estimation with ISMN in situ measurements from 2010 to 2015: (a) correlations of SMOS soil moisture retrievals with in situ measurements (y axis) compared against open-loop (x axis); (b) correlation of near soil moisture estimates after the joint assimilation with in situ measurements (y axis) compared against model open-loop (x axis). Each ISMN site is characterized by the fraction of tree cover within the corresponding 0.25∘ cell. (c, d) Time series of simulated surface soil moisture before and after the joint assimilation over grassland and forest-dominated regions.
The impact of data assimilation on W3 model performance is further illustrated in Fig. 4. For near-surface soil moisture (Fig. 4a), the assimilation of SMOS observations alone (SMOS-only) shows more sites with improved correlations and reduced RMSE against model open-loop. The assimilation of GRACE data alone had little impact on surface soil moisture estimation. Joint assimilation of SMOS and GRACE with SMOS observations down-weighted for ISMN sites in forest (high tree cover) areas (plot labelled “Joint-landcover”) was observed with fewer degradation sites than joint assimilation with original SMOS uncertainties (“Joint”).
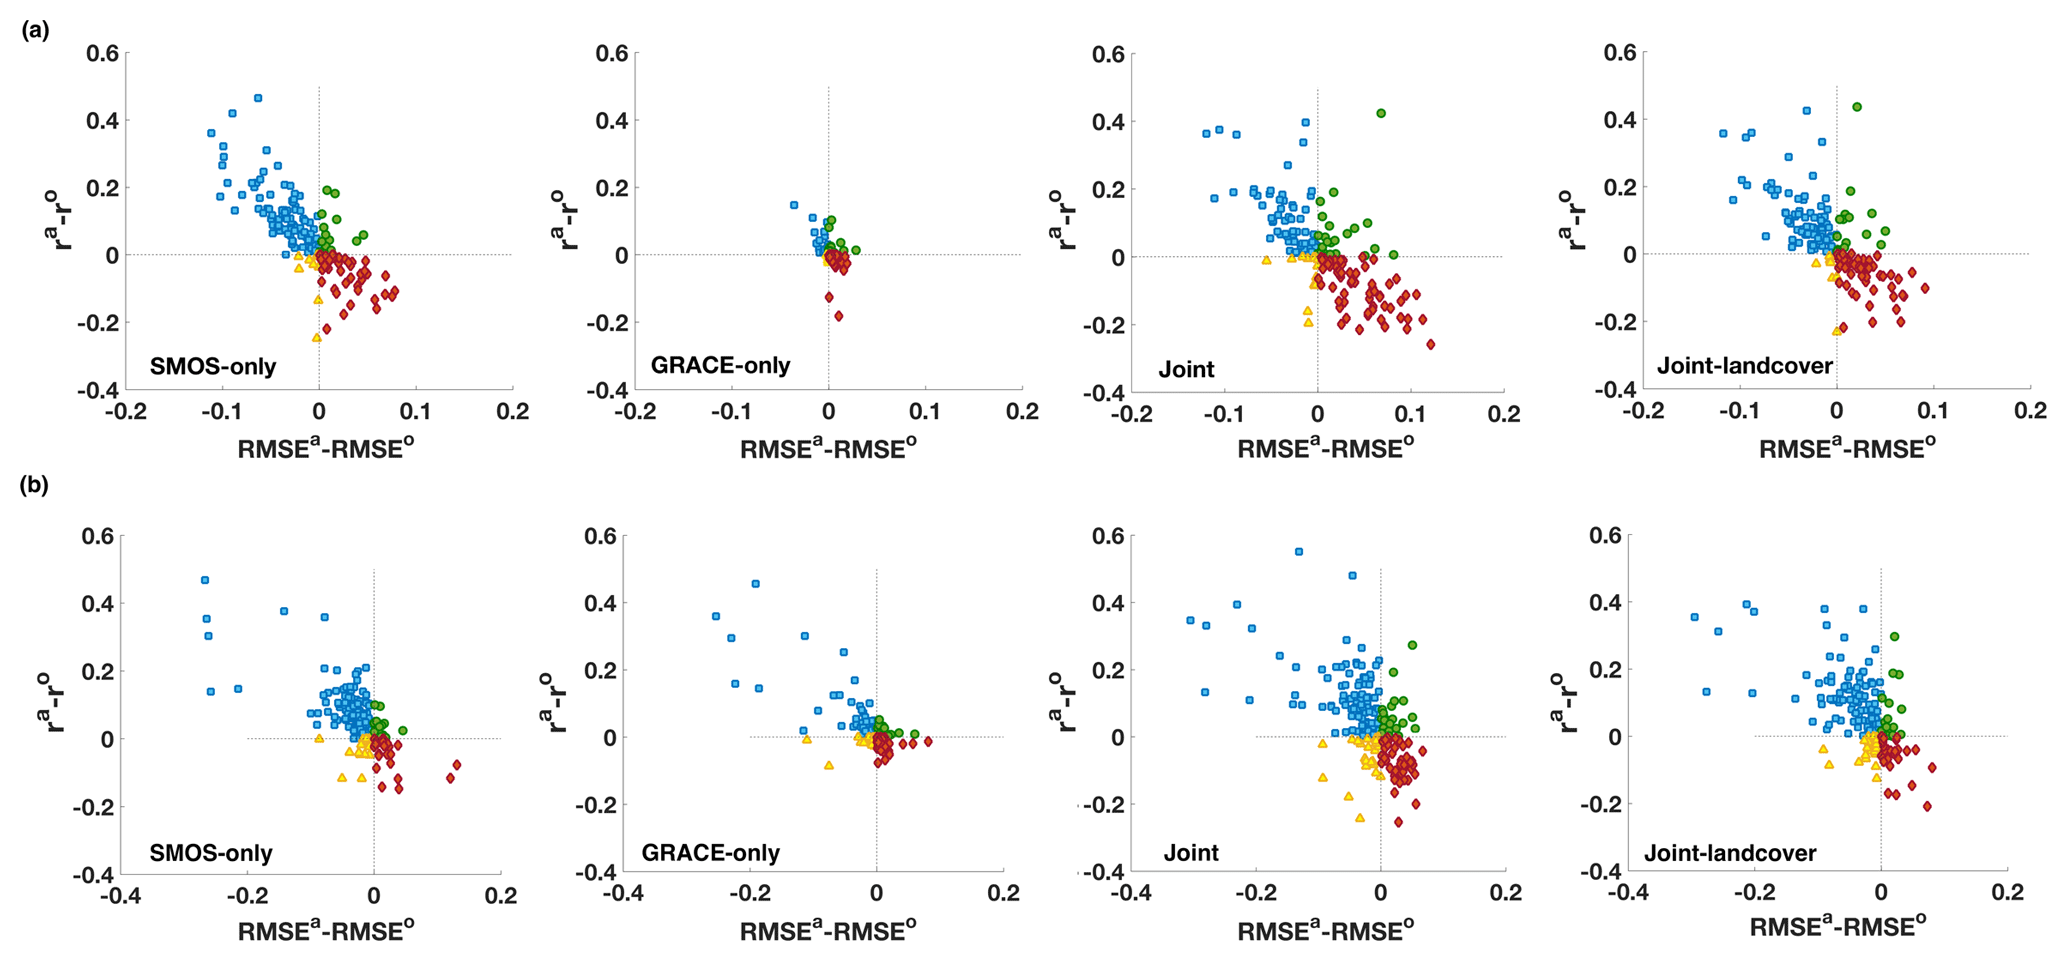
Figure 4Performance of surface and root-zone soil moisture estimates from four data assimilation scenarios against open-loop: correlation (r) and root mean-squared error (RMSE) change after the assimilation (ra−ro, RMSEa − RMSEo; a: after assimilation, o: open-loop) in (a) surface soil moisture estimation; (b) root-zone soil moisture estimation. The four scenarios include SMOS-only as the assimilation of SMOS data alone, GRACE-only as the assimilation of GRACE data only, Joint as joint assimilation of SMOS and GRACE, and Joint-landcover as increasing SMOS uncertainty in forest regions in the joint assimilation. The points in the scatter plots are colour coded such that blue indicates ISMN sites where improvement was observed in both correlation and RMSE; green indicates sites where there was improvement in correlation, but not in RMSE; yellow indicates those sites where there was improved RMSE, but not correlation; and red indicates sites where assimilation resulted in degradation in both correlation and RMSE.
Table 1Evaluation of near-surface and root-zone soil moisture estimation with ISMN in situ soil moisture observation across land cover types.

Land cover types: GS: grassland, OS: open shrubland, WS: woody savannas, SS: savannas, CP: cropland, CV: cropland/natural vegetation, EN: evergreen needleleaf forest, DB: deciduous broadleaf forest, MF: mix forest, GD: grassland-dominated mix types, FD: forest-dominated mix types, and ML: mixed land covers. NA: in situ observations not available.
Data assimilation resulted in significant improvements in W3 root-zone soil moisture estimation over the majority of sites (Fig. 4b). In contrast to surface soil wetness, SMOS and GRACE observations both impacted deeper soil wetness estimation considerably. Simulation of soil wetness over the root zone (0–1 m) in the joint assimilation was less affected by forest cover compared to the near-surface soil wetness, as evident from the high degree of similarity between the “Joint” and “Joint-landcover” plots (Fig. 4b). This suggests no significant difference in performance as a result of down-weighting SMOS influence over forest regions.
Table 1 summarizes W3 model soil moisture estimation performance for both near-surface and root-zone for different land cover types. On average, the correlation with in situ observations increased for both surface and root-zone soil moisture estimates compared to model open-loop. The improvements in surface soil moisture estimates were mainly over croplands (i.e. CP and CV) and grassland-dominated areas (i.e. GS and GD), with changes in correlation, ra−ro, as high as 0.44 for cropland. Correlation in model surface soil moisture estimates over savannas and forest areas decreased relative to open-loop simulations. Data assimilation improved root-zone soil moisture estimates for most land cover types, with up to 0.38 increase over mix-type areas and an average change in correlation of 0.1 for croplands (from 0.59 to 0.69) and grass-dominated areas (from 0.54 to 0.64).
4.2 Relation between vegetation greenness and soil water availability
Monthly water storage integrated to different depths, from the uppermost soil layer to the total soil column, was compared with satellite-observed greenness. The response of vegetation greenness to water storage at different depths is illustrated for selected sites over six land cover types in Fig. 5. Significant differences in soil water variability were found between the joint assimilation and open-loop estimates in all sites (Fig. 5), in particular deep-root zone and total water column. The temporal pattern in greenness and water storage time series was characterized for open-loop and joint assimilation estimates by correlation, ro and ra, respectively. As an example, the grassland site in northern China responded more strongly to the availability of near-surface soil water (higher correlation) than deep soil water and total water storage (Fig. 5a). This suggests a shorter time lag between surface soil water availability and surface greenness. Stronger correlations between NDVI and near-surface soil water storage were found to have increased by 0.15 after assimilation (i.e. ). Greenness of the savannas site in eastern Brazil and the cropland site in southern Australia showed a similar seasonal pattern (correlation) to water storage over all depths (Fig. 5b and c). The largest change in correlation as a result of joint assimilation was observed for the Brazil savannas site (Fig. 5b) () for shallow and deep water storage. NDVI in shrublands and forest sites with deeper roots showed higher correlation with deep soil water and total water storage availability, such as the evergreen broadleaf forest in Nigeria, shrubland in northern Mexico, and deciduous broadleaf forest in southern Bolivia (Fig. 5d to f).
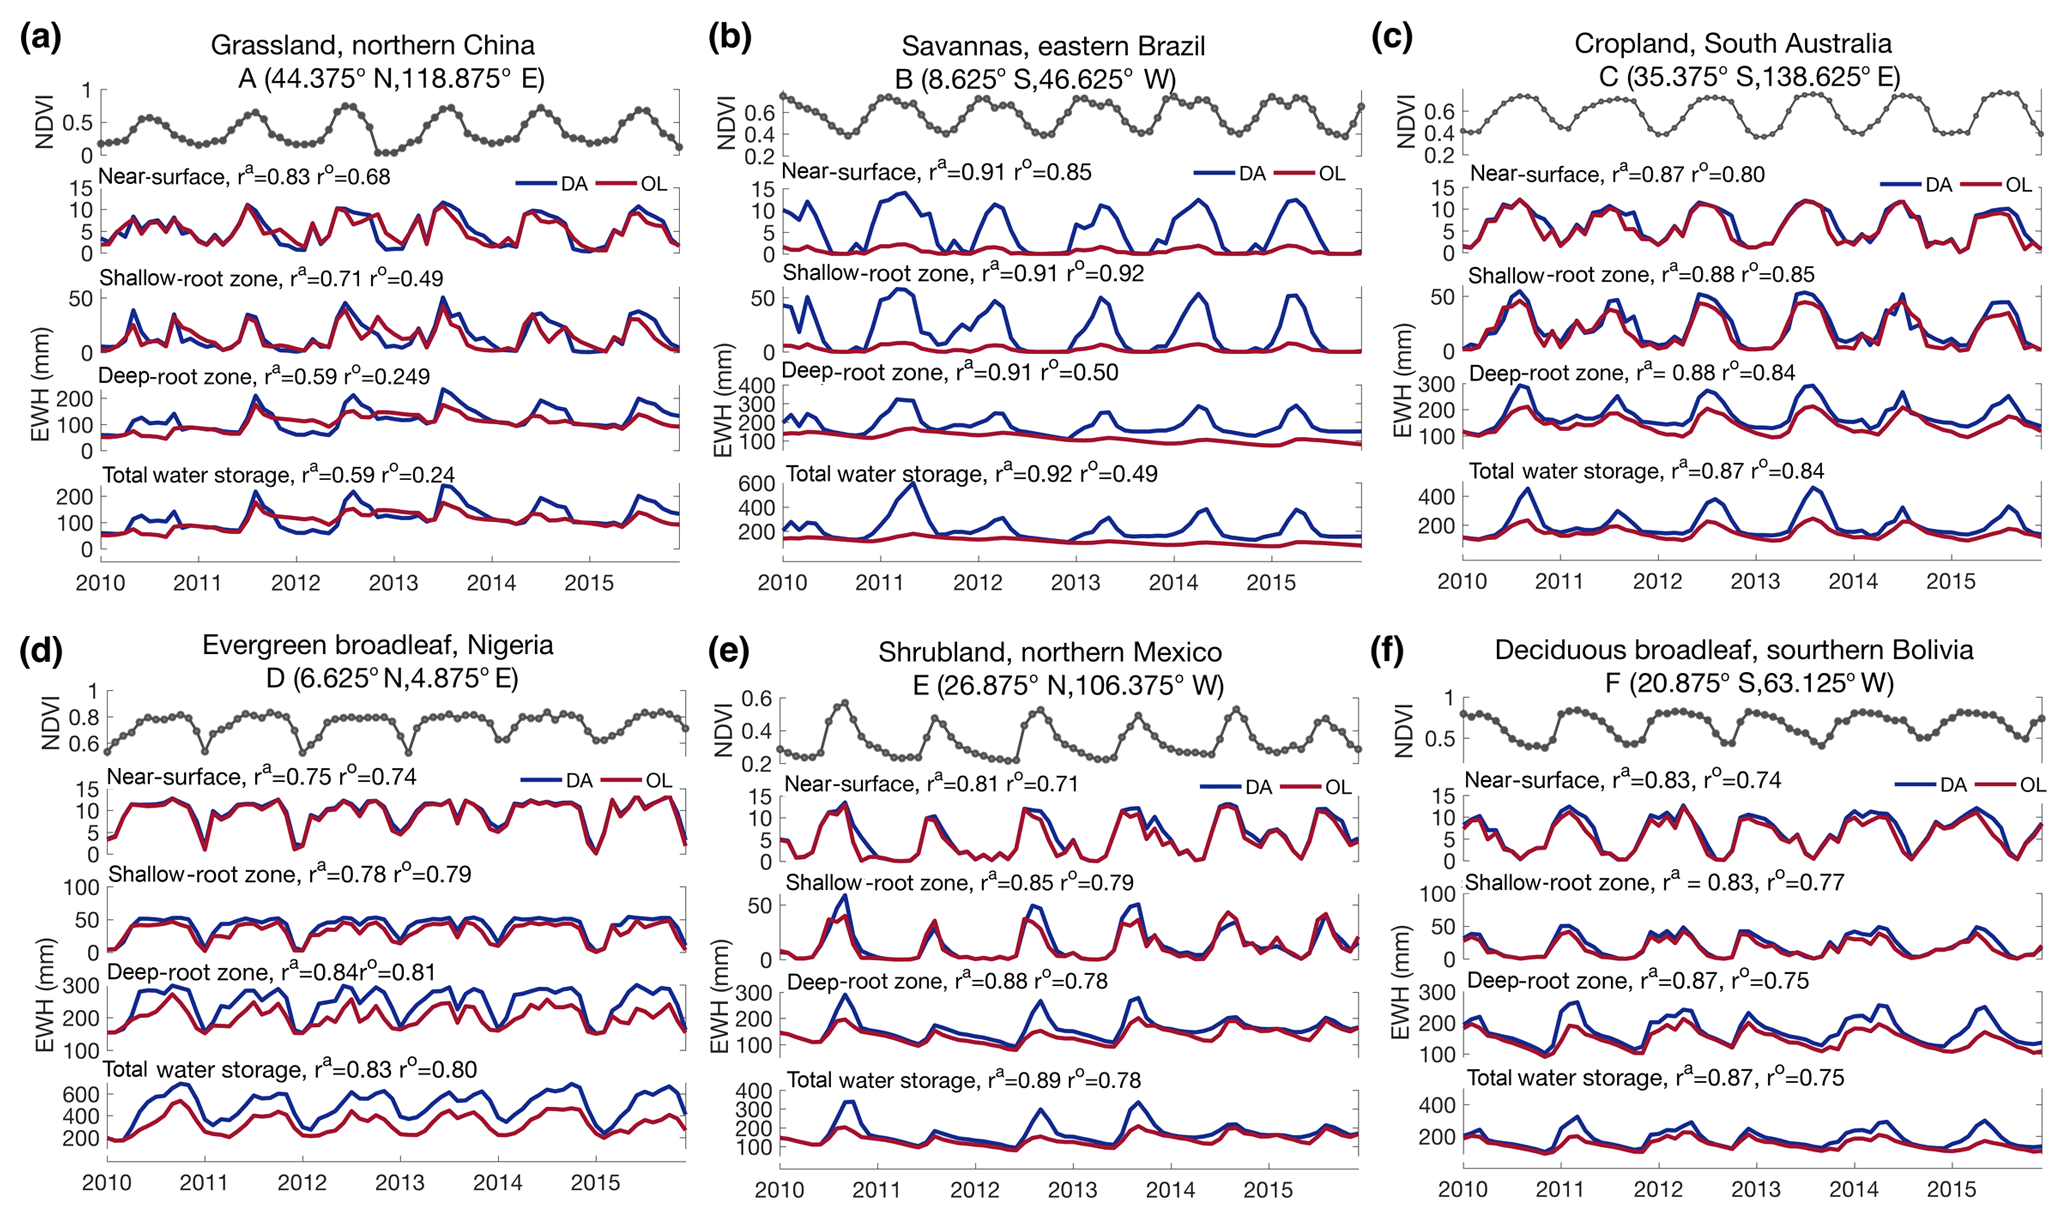
Figure 5Time series of vegetation responses (NDVI) to soil water storage over different integrated depths across land vegetation types before (ro, red curves) and after the joint assimilation (ra, blue curves). The location of each site is shown in Fig. 1.
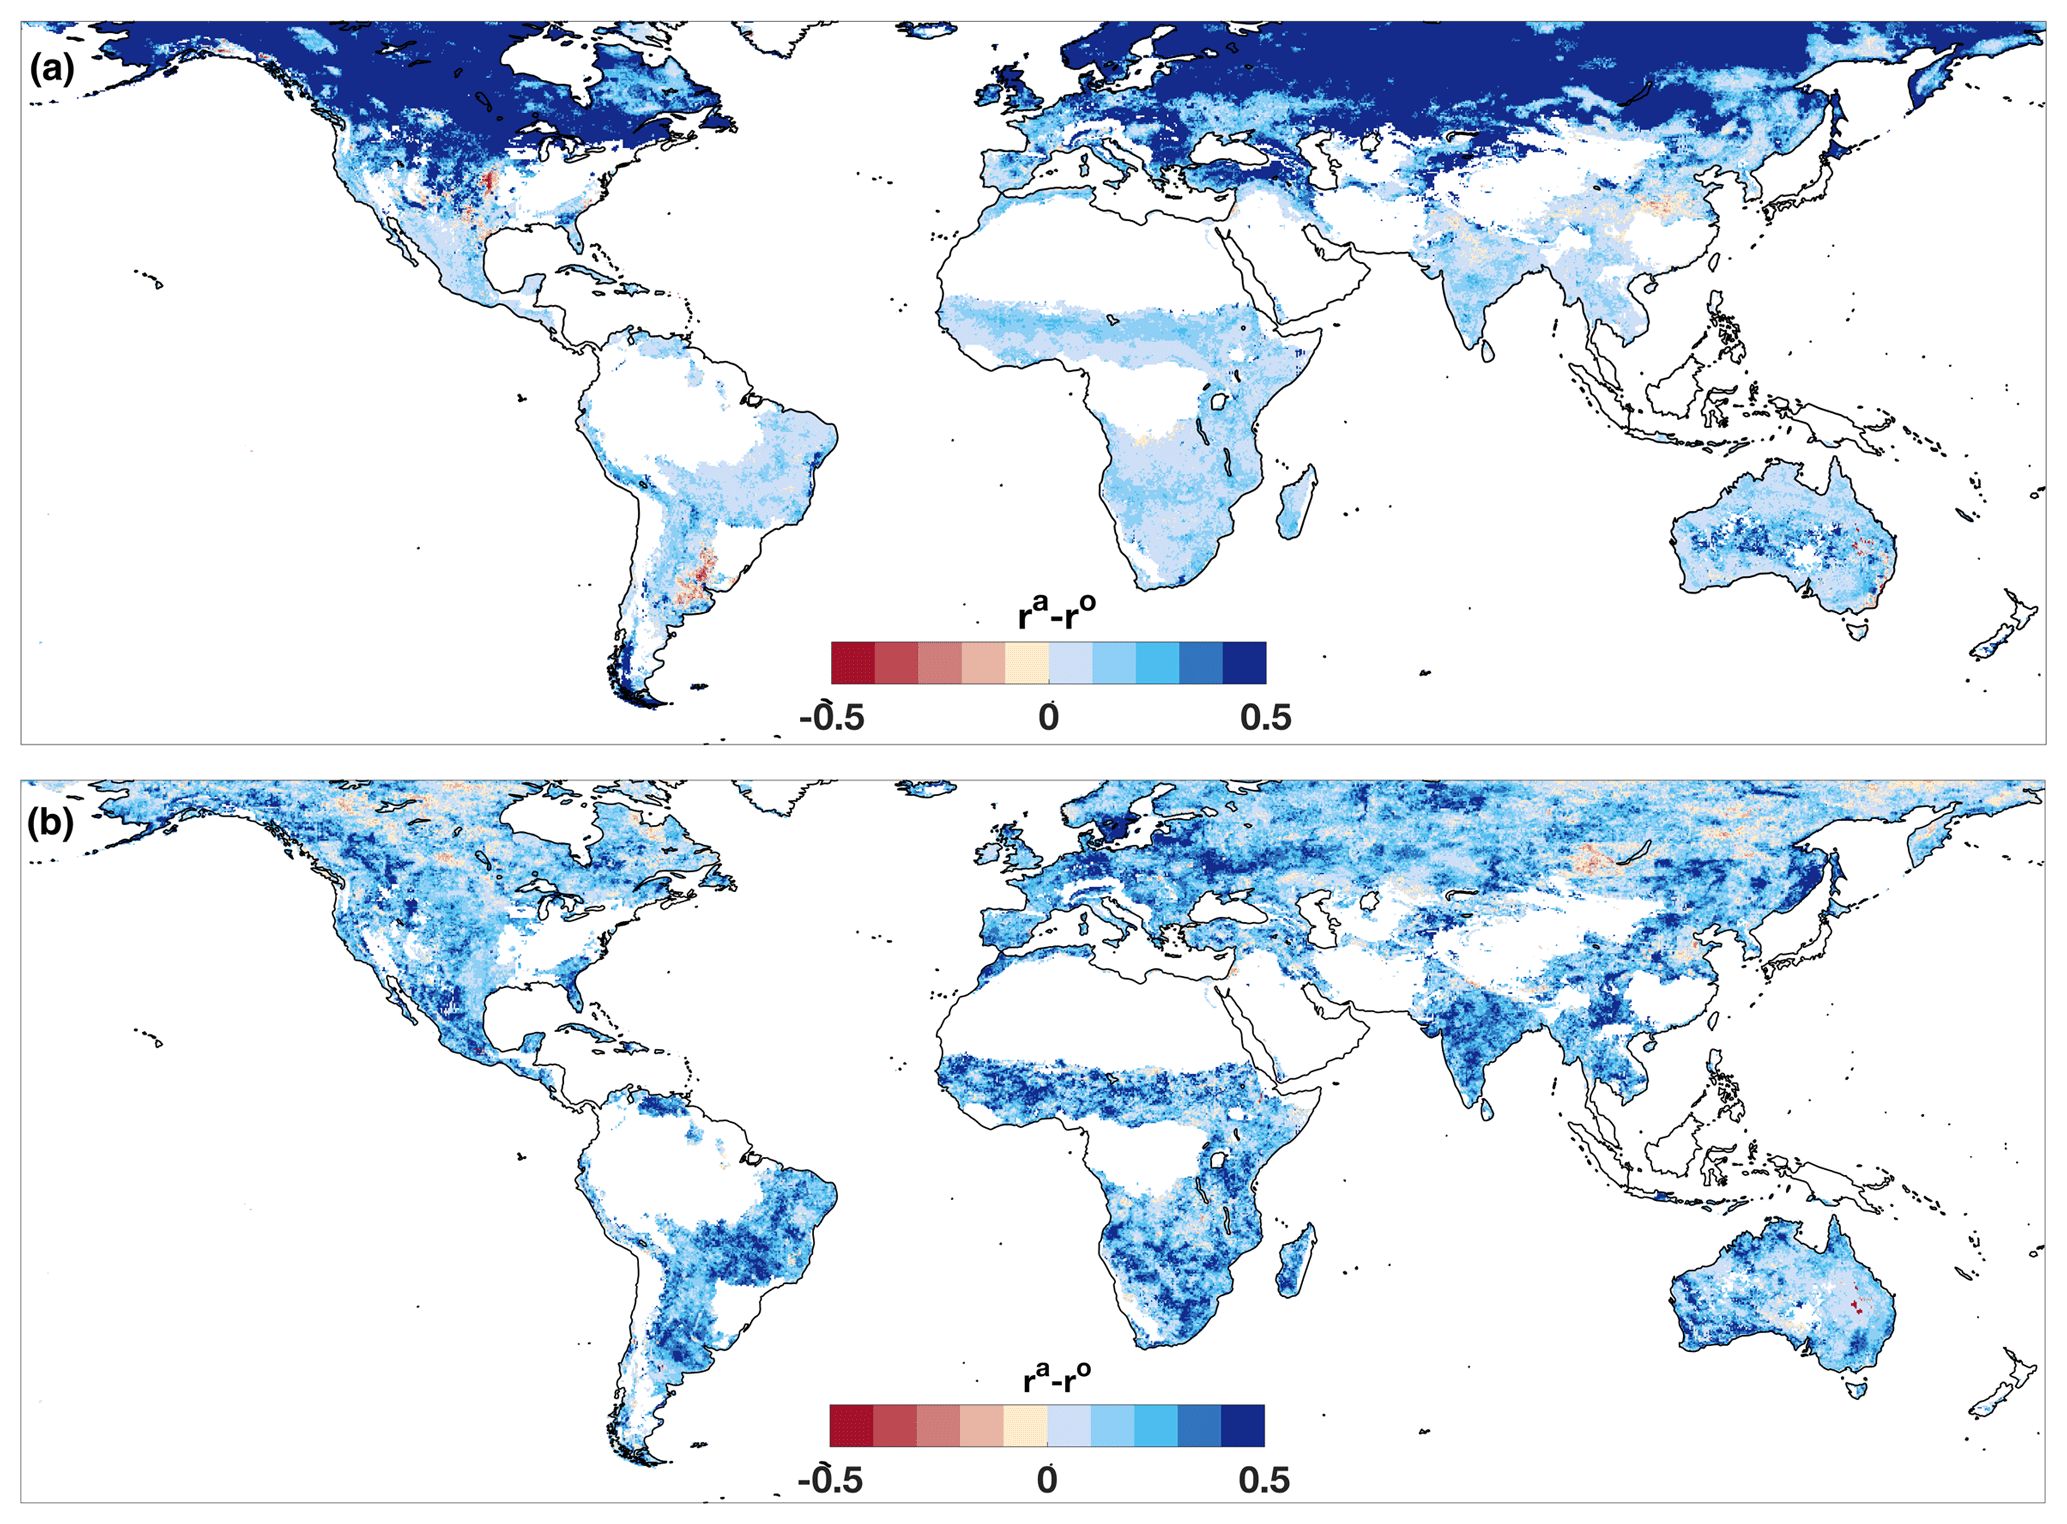
Figure 6Maximum change in correlation (ra−ro, ra: joint assimilation, ro: open-loop) of (a) the seasonal cycle of vegetation greenness and soil water storage over different integrated depths; (b) the anomalies of vegetation greenness and soil water storage over different integrated depths.
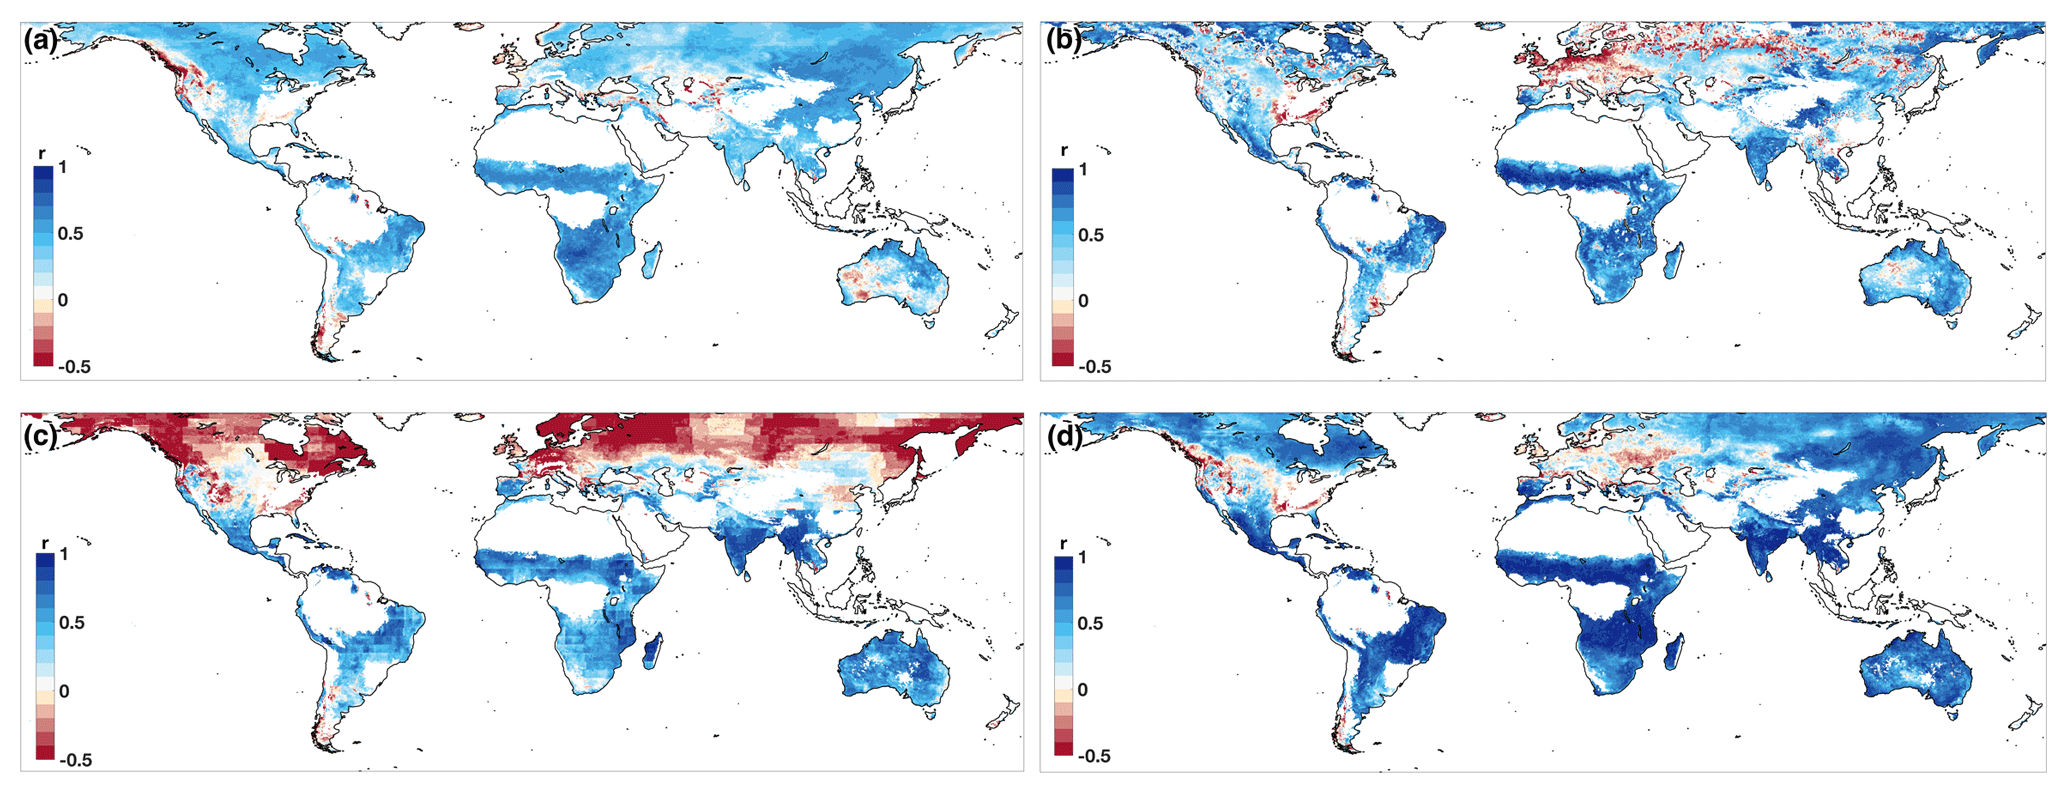
Figure 7Vegetation response to different sources of soil water availability as indicated by the correlation between monthly NDVI and (a) antecedent precipitation index (API), (b) SMOS surface soil moisture retrievals, (c) GRACE total water storage change retrievals, and (d) vegetation-accessible water storage derived after the joint assimilation.
Significant increases in correlation between W3 water storage and vegetation greenness resulted from the joint assimilation of SMOS and GRACE data. Figure 6a shows the maximum change in correlation between the seasonal cycle of NDVI and soil water storage at different integrated depths. Increases in correlations between the seasonality of NDVI and soil water storage after the joint assimilation were observed globally, most notably in the high latitudes of the Northern Hemisphere, where increases in correlation over 0.5 were widespread. This is due to the joint assimilation bringing the seasonality of soil water availability into better agreement with greenness. Significant increases in the correlation between NDVI anomalies and root-zone soil water anomalies by 0.2 were widely observed over the semi-arid and arid regions after the joint assimilation (Fig. 6b). The result shows that the deviations of root-zone soil water to monthly mean can be better simulated after the joint assimilation with improved consistency with vegetation greenness anomalies.
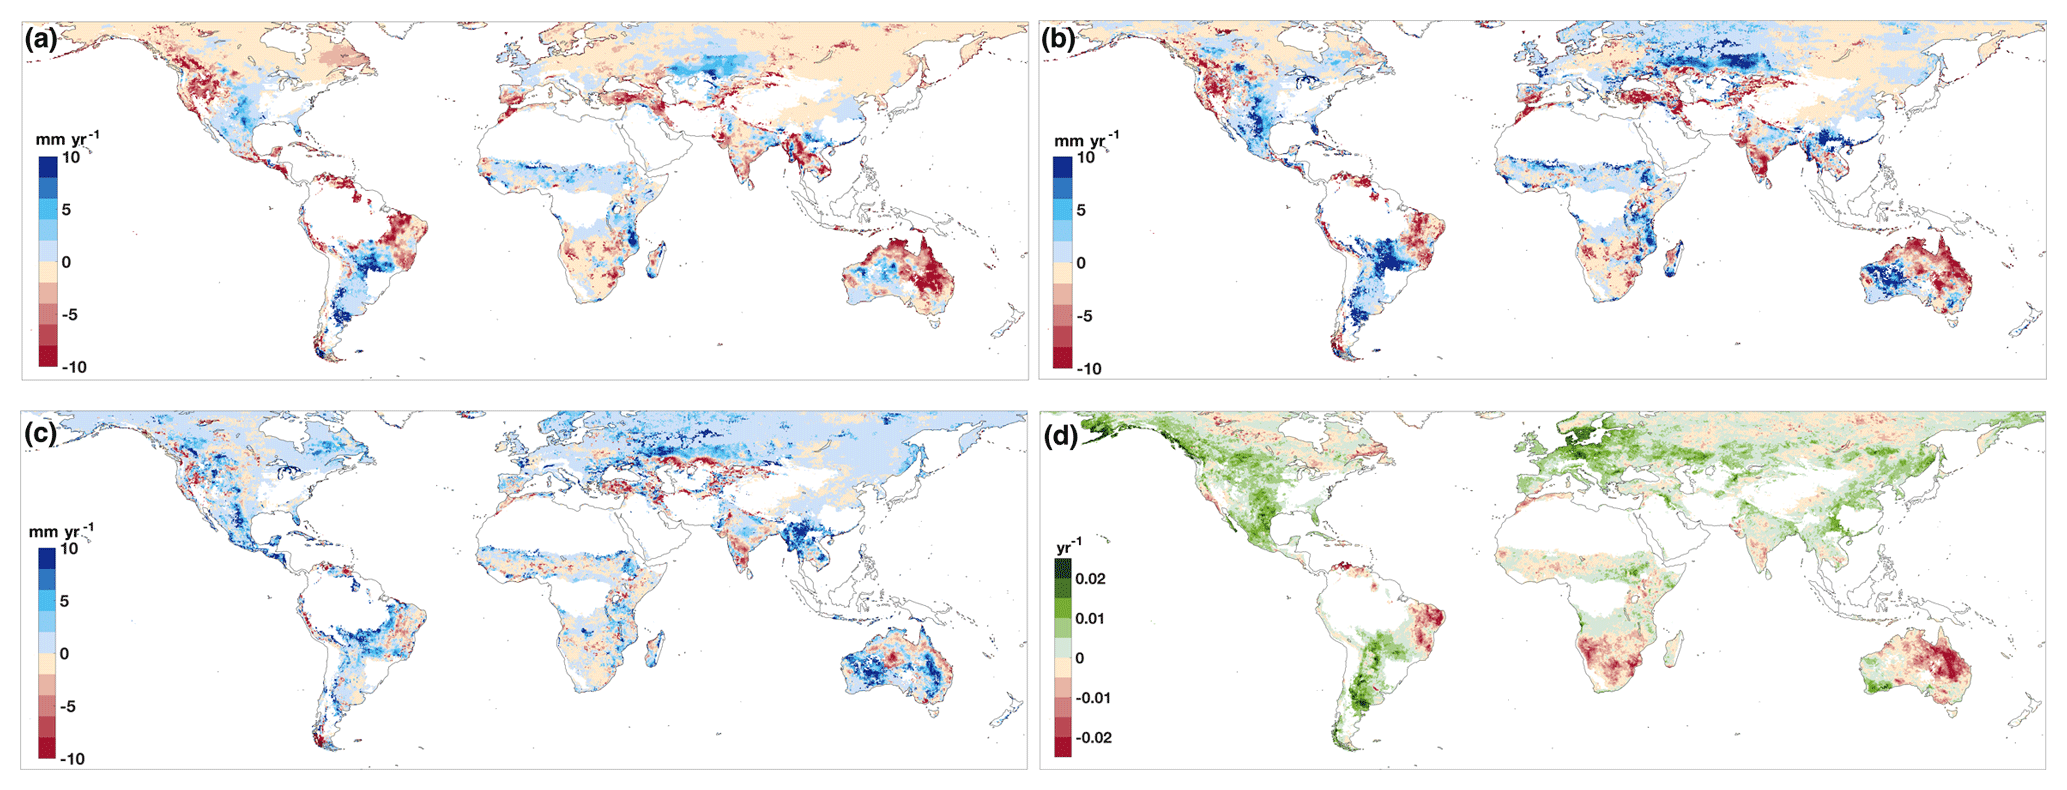
Figure 8Change in soil water availability and vegetation greenness from 2010 to 2016: linear trends of accessible water storage anomalies estimated from (a) model open-loop and (b) joint assimilation; (c) difference in trends between joint assimilation and model open-loop; (d) linear trends of NDVI anomalies.
Having established that joint assimilation improved soil water estimation and the correlation with vegetation response globally, we explored the sources of the improvements. The correlations between NDVI and soil water content estimates from API, SMOS, GRACE, and W3 were computed globally (Fig. 7). API showed a correlation with NDVI of ∼0.5–0.6 over major dry lands and high-latitude regions, except for western and southern Australia and North America (Fig. 7a). Near-surface soil moisture estimates from SMOS showed a strong positive correlation with vegetation conditions over tropical grassland and savanna regions but a strong negative correlation over eastern America and Europe (Fig. 7b). Vegetation growth over tropical regions showed clear wet and dry seasonal patterns closely related to the variability of total water storage from GRACE (Fig. 7c). The correlation of derived accessible soil water storage (from joint assimilation) shows the strongest correlation with NDVI (Fig. 7d) in the semi-arid and arid regions compared to other water content estimates. The negative correlations over western Australia between vegetation conditions and precipitation and surface soil moisture were not observed in GRACE-observed total water storage and joint assimilation derived accessible storage. This indicates that the vegetation here mainly responds to the availability of deep soil moisture. The vegetation conditions were found to be less responsive to the soil moisture availability in Europe and North America since water is not the only limiting factor to the vegetation growth.
4.3 Trends in soil water availability and vegetation response
The soil water anomalies estimated from the W3 open-loop and joint assimilation from January 2010 to December 2016 were compared with the global vegetation greenness anomalies over the same period and clear differences in the magnitude of soil water storage change and high spatial variability were observed globally (Fig. 8a and b). For example, a decrease in soil water storage was simulated in open-loop simulations over southern Mexico and northeastern China. However, joint assimilation results showed an increase in soil water storage anomalies for these same regions. Differences in water storage anomaly change between open-loop and joint assimilation (Fig. 8c) could be over 10 mm yr−1, and were most noticeable over Southeast Asia and Australia.
Clear decreasing trends in NDVI anomalies (more than 0.025 units per year) were observed over central and eastern Australia (Fig. 8d), while decreasing trends in soil water availability of over 10 mm yr−1 were found in both model open-loop and joint assimilation estimates. A greater decrease in soil water storage was inferred in central and eastern Australia through joint assimilation than from the open-loop. Similarly, the deficit in accessible root-zone soil water storage estimated through joint assimilation aligned well with the dramatic decrease in vegetation greenness in eastern Brazil, southern India, and southern Africa. The joint assimilation resulted in estimated increases in soil water storage that were globally much more consistent with increased greenness than the open-loop simulations.
We found that global modelling of root-zone soil moisture can be improved substantially through the joint assimilation of GRACE total water storage and SMOS soil moisture retrievals. This is consistent with previous findings for Australia (Tian et al., 2017). Corrections to near-surface soil moisture estimates resulted mainly from the assimilation of SMOS soil moisture. Uncertainties in SMOS soil moisture retrievals, e.g. related to errors in surface roughness and vegetation cover characterization, influenced the accuracy of the estimation through the weights of the Kalman gain (Eq. 2). Therefore, in locations where satellite soil moisture estimates were observed to be more accurate than the W3 model open-loop simulations (e.g. grassland and cropland areas), the assimilation of these data improved the agreement between model estimates of near-surface soil moisture and in situ observations. However, assimilation of SMOS degraded model estimation for grid cells dominated by forest or mixed land cover types, most likely due to the underestimated SMOS uncertainties. The SMOS relative errors for each cover type ranged from 7 % to 15 % at median values, but were as high as 50 % for full forest coverage regions (Fig. 1a). The average relative errors for SMOS for over 50 % of the in situ sites with mixed land cover types were only 9 % (Table 1), indicating a potential underestimation of SMOS error in those grid cells. By increasing the uncertainty of SMOS observations for forest areas, thus reducing their influence on assimilation, the number of sites with degraded model estimation was reduced (Fig. 4a). This suggests that reported uncertainties associated with the SMOS product are likely underestimated for densely vegetated areas.
The suitability of ISMN in situ soil moisture measurements for evaluation needs to be considered in interpretation. The quality of the data records, the sparseness of network coverage, uneven distribution globally (e.g. heavily skewed to North America), as well as the representativeness of a single site, or a very small number of sites within a model or satellite pixel (∼0.25∘ × 0.25∘), are important contributing factors to the evaluation statistics. For example, there were considerably fewer ISMN sites in dense vegetation cover areas (e.g. Table 1 WS, EN, DB and MF) than other cover types (i.e. 11 out of 167), and therefore should be a consideration in comparing average performance metrics across cover types. Also, by careful inspection of the in situ data and removal of any sites with large gaps in the temporal coverage or with unrealistic temporal behaviour (e.g. abrupt changes between dramatically contrasting moisture states), model evaluation could only be conducted with a subset of only 70 % of the full complement of ISMN data that were believed to be of better quality. Given the paramount importance of these data in evaluation of model and satellite products in general, it is critical that the ISMN and similar in situ measurement networks are maintained, but rigorous quality control is equally important.
The assimilation of GRACE data had a marginal impact on W3 near-surface soil moisture simulation (Fig. 4a). In contrast to the SMOS product, uncertainties in GRACE data were less variable in terms of relative error across land cover type, with error between 10 % and 15 % on average (Fig. 1b). The majority of the modelling grid cells showed improved correlation and reduced RMSE of root-zone soil moisture as a result of joint assimilation of GRACE and SMOS, not only in the grassland-dominated sites, but also for mixed land cover types. The improved root-zone soil water estimation in the joint assimilation could be linked to the Kalman smoother, which used the SMOS (daily) data to temporally disaggregate the GRACE observed (monthly) total water storage. Therefore, not only does the joint assimilation of SMOS and GRACE observations vertically redistribute the water storage change into different W3 soil layers, it also redistributes the change temporally based on different dynamics of the soil moisture signal at the different depths.
Root-zone soil moisture varies considerably in space, as do plant rooting depth and soil physical properties. This makes it a challenge to compare model estimates over a cell and in situ measurements at point scale. Remotely sensed vegetation greenness can serve as a surrogate for water availability in water-limited regions of the world. MODIS NDVI was used as an independent data set to evaluate root-zone soil moisture simulations. Significant increases in correlation were found globally after joint assimilation (Fig. 6). The improvements over temperate regions are due to better consistency with NDVI seasonality (Fig. 6a). The increased correlation between root-zone soil water storage anomalies and vegetation greenness anomalies in semi-arid to arid regions is encouraging, as it may result in improved capability for forecasting drought and vegetation productivity in dryland ecosystems.
The response of vegetation to water availability at different depths varies according to vegetation type and climate. For example, grasslands over the western US and northeastern China showed strong correlation with SMOS near-surface soil moisture retrievals and modelled surface soil moisture, but weak correlation with GRACE-observed total water storage (Figs. 5a and 7). On the other hand, grassland in the Sahel showed the same relative response to water availability at different depths but higher correlation with deep soil availability (Fig. 7). This appears to be due to the relatively deep root zone and lesser water holding capacity (Leenaars et al., 2018). Identifying the soil layers that contribute most to the temporal behaviour of vegetation greenness is critical for understanding the impacts of water stress on the terrestrial ecosystem. The variation of plant-accessible storage strongly reflected vegetation conditions over most of the globe except for part of North America and Europe (Fig. 7d). The SMOS and GRACE observations both showed negative correlation with the surface greenness over Europe and eastern North America, where better correlations were found with a precipitation-based index (API, in Fig. 7a). This is expected, since water is not the primarily and only limiting factor (Nemani et al., 2003; Wu et al., 2015). Overall, the soil water storage derived from the joint assimilation embodied the best knowledge of available water content not only from meteorological forcing data, but also from the SMOS near-surface soil moisture and GRACE total water storage. Given accurate information of soil water availability, vegetation vigour and productivity can potentially be predicted (Tian et al., 2019).
A number of severe droughts have occurred during the last decade, including the droughts in the Sahel, eastern Africa, California, China, and northeastern Australia. The annual trends in NDVI anomalies and root-zone soil water storage anomalies from January 2010 to December 2016 showed consistency in the spatial patterns. After a sharp recovery from the Millennium drought during an extremely wet period from 2010 to 2011 (Leblanc et al., 2009; van Dijk et al., 2013a; Xie et al., 2016b), drought returned to eastern Australia with a decrease in soil water of over 10 mm yr−1 estimated from both model open-loop and joint assimilation (Fig. 8a and b). A decline in NDVI anomalies of more than 0.025 units per year was observed for the majority of middle and eastern Australia due to the developing soil water deficit (Fig. 8d), which is likely due to the widespread rainfall deficits caused by the El Niño 2014–2016 and further amplified by the Indian Ocean Dipole 2015. Increases in soil water deficit were enhanced as a result of assimilating GRACE and SMOS over eastern Brazil, California, and southern India, and this was consistent with a decrease in vegetation greenness in these areas. The stronger signal of water storage deficiency compared to the open-loop is mainly attributed to GRACE-observed decreasing total water storage in agreement with the water storage deficit observed by GRACE data only (Rodell et al., 2018). The severity of groundwater depletion for irrigation in northern and southern India, as observed by GRACE (Rodell et al., 2009), was also better captured through the assimilation of GRACE (Fig. 8b). Joint assimilation of GRACE and SMOS sometimes reversed the direction of change in soil water storage, compared to the open-loop, resulting in better agreement with trends of temporal pattern in NDVI, particularly in southern Mexico and northeastern China.
This work has demonstrated that the joint assimilation of GRACE and SMOS data into an ecohydrological model resulted in a spatial and temporal redistribution of water storage that significantly improved root-zone soil moisture estimation over different land cover types globally. In particular, significant improvements were found in the estimation of root-zone soil water availability over grassland and cropland. The joint assimilation optimally integrated the water dynamics information from SMOS and GRACE and mitigated the deficiencies of the individual sources of observation.
Vegetation response to soil water availability at different depths was found to vary according to ecosystem and climate. The close relationship between vegetation growth and soil water availability was quantified firstly with the root-zone soil water estimates through the assimilation of satellite soil moisture and total water storage retrievals simultaneously. The improved agreement between vegetation vigour and soil water availability indicates the potential for improving ecohydrological modelling and forecasting vegetation condition. Accurate characterization of vegetation response to soil water availability also provides new insights to help improve monitoring and forecasting drought impacts on ecosystems.
Ecohydrological model W3 is available online at http://wald.anu.science (last access: 20 January 2019). The MOD13C2 data were retrieved from online Data Pool, courtesy of the NASA EOSDIS Land Processes Distributed Active Archive Center (LP DAAC), USGS/Earth Resources Observation and Science (EROS) Center, Sioux Falls, South Dakota, https://lpdaac.usgs.gov (last access: 15 August 2018). GRACE land mascon solutions are available at http://grace.jpl.nasa.gov (last access: 15 August 2018), supported by the NASA MEaSUREs Program. The CATDS level-3 daily soil moisture retrievals are available at https://www.catds.fr/sipad/ (last access: 15 August 2018).
ST, LR and AIJMVD designed this study. ST performed analysis and wrote the manuscript with LR. LR, AIJMVD, PT and JW supervised this study. All the authors contributed to discussions about the methods and results and provided feedback on the manuscript.
The authors declare that they have no conflict of interest.
This article is part of the special issue “Integration of Earth observations and models for global water resource assessment”. It is not associated with a conference.
This research was supported through ARC Discovery grant DP140103679. This
research was undertaken with the assistance of resources and services from
the National Computational Infrastructure (NCI), which is supported by the
Australian Government.
Edited by: Gianpaolo Balsamo
Reviewed by: two anonymous referees
Andela, N., Liu, Y. Y., van Dijk, A. I. J. M., de Jeu, R. A. M., and McVicar, T. R.: Global changes in dryland vegetation dynamics (1988–2008) assessed by satellite remote sensing: comparing a new passive microwave vegetation density record with reflective greenness data, Biogeosciences, 10, 6657–6676, https://doi.org/10.5194/bg-10-6657-2013, 2013. a
Beck, H. E., van Dijk, A. I. J. M., Levizzani, V., Schellekens, J., Miralles, D. G., Martens, B., and de Roo, A.: MSWEP: 3-hourly 0.25∘ global gridded precipitation (1979–2015) by merging gauge, satellite, and reanalysis data, Hydrol. Earth Syst. Sci., 21, 589–615, https://doi.org/10.5194/hess-21-589-2017, 2017. a
Breshears, D. D., Cobb, N. S., Rich, P. M., Price, K. P., Allen, C. D., Balice, R. G., Romme, W. H., Kastens, J. H., Floyd, M. L., Belnap, J., Anderson, J. J., Myers, O. B., and Meyer C. W.: Regional vegetation die-off in response to global-change-type drought, P. Natl. Acad. Sci. USA, 102, 15144–15148, 2005. a
Canadell, J., Jackson, R., Ehleringer, J., Mooney, H., Sala, O., and Schulze, E.-D.: Maximum rooting depth of vegetation types at the global scale, Oecologia, 108, 583–595, 1996. a, b
Channan, S., Collins, K., and Emanuel, W.: Global mosaics of the standard MODIS land cover type data, University of Maryland and the Pacific Northwest National Laboratory, College Park, Maryland, USA, available at: http://glcf.umd.edu/data/lc/ (last access: February 2019), 2014. a
Chen, T., De Jeu, R., Liu, Y., Van der Werf, G., and Dolman, A.: Using satellite based soil moisture to quantify the water driven variability in NDVI: A case study over mainland Australia, Remote Sens. Environ., 140, 330–338, 2014. a, b
Crow, W. T., Kustas, W. P., and Prueger, J. H.: Monitoring root-zone soil moisture through the assimilation of a thermal remote sensing-based soil moisture proxy into a water balance model, Remote Sens. Environ., 112, 1268–1281, 2008. a
Dee, D. P.: Bias and data assimilation, Q. J. Roy. Meteorol. Soc., 131, 3323–3343, 2005. a
Didan, K. and Huete, A.: MOD13C2 MODIS/Terra Vegetation Indices Monthly L3 Global 0.05Deg CMG, NASA LP DAAC, https://doi.org/10.5067/MODIS/MOD13C2.006, 2015. a
Dorigo, W. A., Wagner, W., Hohensinn, R., Hahn, S., Paulik, C., Xaver, A., Gruber, A., Drusch, M., Mecklenburg, S., van Oevelen, P., Robock, A., and Jackson, T.: The International Soil Moisture Network: a data hosting facility for global in situ soil moisture measurements, Hydrol. Earth Syst. Sci., 15, 1675–1698, https://doi.org/10.5194/hess-15-1675-2011, 2011. a
Draper, C., Reichle, R., De Lannoy, G., and Liu, Q.: Assimilation of passive and active microwave soil moisture retrievals, Geophys. Res. Lett., 39, L04401, https://doi.org/10.1029/2011GL050655, 2012. a, b
Dumedah, G., Walker, J. P., and Merlin, O.: Root-zone soil moisture estimation from assimilation of downscaled Soil Moisture and Ocean Salinity data, Adv. Water Resour., 84, 14–22, 2015. a
Dunne, K. and Willmott, C. J.: Global distribution of plant-extractable water capacity of soil, Int. J. Climatol., 16, 841–859, 1996. a
Evensen, G.: Sequential data assimilation with a nonlinear quasi-geostrophic model using Monte Carlo methods to forecast error statistics, J. Geophys. Res.-Oceans, 99, 10143–10162, 1994. a
Frost, A. J., Ramchurn, A., and Smith, A.: The Bureau's Operational AWRA Landscape (AWRA-L) Model, Technical Report, Bureau of Meteorology, Melbourne, 2016. a, b
Girotto, M., De Lannoy, G. J., Reichle, R. H., Rodell, M., Draper, C., Bhanja, S. N., and Mukherjee, A.: Benefits and pitfalls of GRACE data assimilation: A case study of terrestrial water storage depletion in India, Geophys. Res. Lett., 44, 4107–4115, 2017. a, b
Hooke, J. M.: An analysis of the processes of river bank erosion, J. Hydrol., 42, 39–62, 1979. a
Houser, P. R., Shuttleworth, W. J., Famiglietti, J. S., Gupta, H. V., Syed, K. H., and Goodrich, D. C.: Integration of soil moisture remote sensing and hydrologic modeling using data assimilation, Water Resour. Res., 34, 3405–3420, 1998. a
Jacquette, E., Al Bitar, A., Mialon, A., Kerr, Y. H., Quesney, A., Cabot, F., and Richaume, P.: SMOS CATDS level 3 global products over land, in: Remote Sensing for Agriculture, Ecosystems, and Hydrology XII, Proc. SPIE 7824, 22 October 2010, Toulouse, https://doi.org/10.1117/12.865093, 2010. a
Kerr, Y. H., Waldteufel, P., Wigneron, J.-P., Delwart, S., Cabot, F., Boutin, J., Escorihuela, M.-J., Font, J., Reul, N., and Gruhier, C.: The SMOS mission: New tool for monitoring key elements of the global water cycle, Proc. IEEE, 98, 666–687, 2010. a
Kerr, Y. H., Jacquette, E., Al Bitar, A., Cabot, F., Mialon, A., Richaume, P., Quesney, A., and Berthon, L.: CATDS SMOS L3 soil moisture retrieval processor Algorithm Theoretical Baseline Document (ATBD), Technical Note SO-TN-CBSA-GS-0029, CBSA, p. 73, 2013. a
Khaki, M., Ait-El-Fquih, B., Hoteit, I., Forootan, E., Awange, J., and Kuhn, M.: A two-update ensemble Kalman filter for land hydrological data assimilation with an uncertain constraint, J. Hydrol., 555, 447–462, 2017. a
Laio, F., Porporato, A., Ridolfi, L., and Rodriguez-Iturbe, I.: Plants in water-controlled ecosystems: active role in hydrologic processes and response to water stress: II. Probabilistic soil moisture dynamics, Adv. Water Resour., 24, 707–723, 2001. a
Leblanc, M. J., Tregoning, P., Ramillien, G., Tweed, S. O., and Fakes, A.: Basin-scale, integrated observations of the early 21st century multiyear drought in southeast Australia, Water Resour. Res., 45, W04408, https://doi.org/10.1029/2008WR007333, 2009. a
Leenaars, J. G., Claessens, L., Heuvelink, G. B., Hengl, T., González, M. R., van Bussel, L. G., Guilpart, N., Yang, H., and Cassman, K. G.: Mapping rootable depth and root zone plant-available water holding capacity of the soil of sub-Saharan Africa, Geoderma, 324, 18–36, 2018. a, b
Li, B., Rodell, M., Zaitchik, B. F., Reichle, R. H., Koster, R. D., and van Dam, T. M.: Assimilation of GRACE terrestrial water storage into a land surface model: Evaluation and potential value for drought monitoring in western and central Europe, J. Hydrol., 446, 103–115, 2012. a
Lievens, H., Reichle, R. H., Liu, Q., De Lannoy, G., Dunbar, R. S., Kim, S., Das, N. N., Cosh, M., Walker, J. P., and Wagner, W.: Joint Sentinel-1 and SMAP data assimilation to improve soil moisture estimates, Geophys. Res. Lett., 44, 6145–6153, https://doi.org/10.1002/2017GL073904, 2017. a
Liu, Y. Y., Dorigo, W. A., Parinussa, R., de Jeu, R. A., Wagner, W., McCabe, M. F., Evans, J., and Van Dijk, A. I. J. M.: Trend-preserving blending of passive and active microwave soil moisture retrievals, Remote Sens. Environ., 123, 280–297, 2012. a
Narayan, U., Lakshmi, V., and Njoku, E. G.: Retrieval of soil moisture from passive and active L/S band sensor (PALS) observations during the Soil Moisture Experiment in 2002 (SMEX02), Remote Sens. Environ., 92, 483–496, 2004. a
Nemani, R. R., Keeling, C. D., Hashimoto, H., Jolly, W. M., Piper, S. C., Tucker, C. J., Myneni, R. B., and Running, S. W.: Climate-driven increases in global terrestrial net primary production from 1982 to 1999, Science, 300, 1560–1563, 2003. a, b
Porporato, A., Daly, E., and Rodriguez-Iturbe, I.: Soil water balance and ecosystem response to climate change, Am. Nat., 164, 625–632, 2004. a, b
Renzullo, L. J., van Dijk, A. I. J. M., Perraud, J. M., Collins, D., Henderson, B., Jin, H., Smith, A. B., and McJannet, D. L.: Continental satellite soil moisture data assimilation improves root-zone moisture analysis for water resources assessment, J. Hydrol., 519, 2747–2762, https://doi.org/10.1016/j.jhydrol.2014.08.008, 2014. a, b, c
Rodell, M., Velicogna, I., and Famiglietti, J. S.: Satellite-based estimates of groundwater depletion in India, Nature, 460, 999–1002, 2009. a
Rodell, M., Famiglietti, J., Wiese, D., Reager, J., Beaudoing, H., Landerer, F., and Lo, M.-H.: Emerging trends in global freshwater availability, Nature, 557, 651–659, 2018. a
Sabater, J. M., Jarlan, L., Calvet, J.-C., Bouyssel, F., and De Rosnay, P.: From near-surface to root-zone soil moisture using different assimilation techniques, J. Hydrometeorol., 8, 194–206, 2007. a
Santos, W. J. R., Silva, B. M., Oliveira, G. C., Volpato, M. M. L., Lima, J. M., Curi, N., and Marques, J. J.: Soil moisture in the root zone and its relation to plant vigor assessed by remote sensing at management scale, Geoderma, 221, 91–95, 2014. a
Schlaepfer, D. R., Bradford, J. B., Lauenroth, W. K., Munson, S. M., Tietjen, B., Hall, S. A., Wilson, S. D., Duniway, M. C., Jia, G., Pyke, D. A., Lkhagva, A., and Jamiyansharav, K.: Climate change reduces extent of temperate drylands and intensifies drought in deep soils, Nat. Commun., 8, 14196, https://doi.org/10.1038/ncomms14196, 2017. a
Schumacher, M., Forootan, E., van Dijk, A. I. J. M., Schmied, H. M., Crosbie, R., Kusche, J., and Döll, P.: Improving drought simulations within the Murray-Darling Basin by combined calibration/assimilation of GRACE data into the WaterGAP Global Hydrology Model, Remote Sens.f Environ., 204, 212–228, 2018. a
Shokri, A., Walker, J. P., van Dijk, A. I. J. M., and Pauwels, V. R.: Performance of Different Ensemble Kalman Filter Structures to Assimilate GRACE Terrestrial Water Storage Estimates Into a High-Resolution Hydrological Model: A Synthetic Study, Water Resour. Res., 54, 8931–8951, 2018. a
Tangdamrongsub, N., Steele-Dunne, S. C., Gunter, B. C., Ditmar, P. G., and Weerts, A. H.: Data assimilation of GRACE terrestrial water storage estimates into a regional hydrological model of the Rhine River basin, Hydrol. Earth Syst. Sci., 19, 2079–2100, https://doi.org/10.5194/hess-19-2079-2015, 2015. a
Tangdamrongsub, N., Han, S.-C., Decker, M., Yeo, I.-Y., and Kim, H.: On the use of the GRACE normal equation of inter-satellite tracking data for estimation of soil moisture and groundwater in Australia, Hydrol. Earth Syst. Sci., 22, 1811–1829, https://doi.org/10.5194/hess-22-1811-2018, 2018. a, b
Tapley, B. D., Bettadpur, S., Watkins, M., and Reigber, C.: The gravity recovery and climate experiment: Mission overview and early results, Geophys. Res. Lett., 31, L09607, https://doi.org/10.1029/2004GL019920, 2004. a, b
Tian, S., Tregoning, P., Renzullo, L. J., van Dijk, A. I. J. M., Walker, J. P., Pauwels, V., and Allgeyer, S.: Improved water balance component estimates through joint assimilation of GRACE water storage and SMOS soil moisture retrievals, Water Resour. Res., 53, 1820–1840, 2017. a, b, c, d, e, f
Tian, S., Van Dijk, A. I. J. M., Tregoning, P., and Renzullo, L. J.: Forecasting dryland vegetation condition months in advance through satellite data assimilation, Nat. Commun., 10, 469, https://doi.org/10.1038/s41467-019-08403-x, 2019. a, b
Tokumoto, I., Heilman, J. L., Schwinning, S., McInnes, K. J., Litvak, M. E., Morgan, C. L., and Kamps, R. H.: Small-scale variability in water storage and plant available water in shallow, rocky soils, Plant Soil, 385, 193–204, 2014. a
van Dijk, A. I. J. M.: AWRA Technical Report 3, Landscape Model (version 0.5) Technical Description, Tech. rep., WIRADA/CSIRO Water for a Healthy Country Flagship, Canberra, 2010. a
van Dijk, A. I. J. M., Beck, H. E., Crosbie, R. S., de Jeu, R. A., Liu, Y. Y., Podger, G. M., Timbal, B., and Viney, N. R.: The Millennium Drought in southeast Australia (2001–2009): Natural and human causes and implications for water resources, ecosystems, economy, and society, Water Resour. Res., 49, 1040–1057, 2013a. a
van Dijk, A. I. J. M., Peña-Arancibia, J. L., Wood, E. F., Sheffield, J., and Beck, H. E.: Global analysis of seasonal streamflow predictability using an ensemble prediction system and observations from 6192 small catchments worldwide, Water Resour. Res., 49, 2729–2746, https://doi.org/10.1002/wrcr.20251, 2013b. a
van Dijk, A. I. J. M., Renzullo, L. J., Wada, Y., and Tregoning, P.: A global water cycle reanalysis (2003–2012) merging satellite gravimetry and altimetry observations with a hydrological multi-model ensemble, Hydrol. Earth Syst. Sci., 18, 2955–2973, https://doi.org/10.5194/hess-18-2955-2014, 2014. a
Walker, J. P. and Houser, P. R.: A methodology for initializing soil moisture in a global climate model: Assimilation of near-surface soil moisture observations, J. Geophys. Res.-Atmos., 106, 11761–11774, 2001. a
Wang, X., Xie, H., Guan, H., and Zhou, X.: Different responses of MODIS-derived NDVI to root-zone soil moisture in semi-arid and humid regions, J. Hydrol., 340, 12–24, 2007. a, b
Wang-Erlandsson, L., Bastiaanssen, W. G. M., Gao, H., Jägermeyr, J., Senay, G. B., van Dijk, A. I. J. M., Guerschman, J. P., Keys, P. W., Gordon, L. J., and Savenije, H. H. G.: Global root zone storage capacity from satellite-based evaporation, Hydrol. Earth Syst. Sci., 20, 1459–1481, https://doi.org/10.5194/hess-20-1459-2016, 2016. a
Watkins, M. M., Wiese, D. N., Yuan, D.-N., Boening, C., and Landerer, F. W.: Improved methods for observing Earth's time variable mass distribution with GRACE using spherical cap mascons, J. Geophys. Res.-Solid, 120, 2648–2671, 2015. a
Weedon, G. P., Balsamo, G., Bellouin, N., Gomes, S., Best, M. J., and Viterbo, P.: The WFDEI meteorological forcing data set: WATCH Forcing Data methodology applied to ERA-Interim reanalysis data, Water Resour. Res., 50, 7505–7514, 2014. a
Wu, D., Zhao, X., Liang, S., Zhou, T., Huang, K., Tang, B., and Zhao, W.: Time-lag effects of global vegetation responses to climate change, Global Change Biol., 21, 3520–3531, 2015. a
Xie, Z., Huete, A., Ma, X., Restrepo-Coupe, N., Devadas, R., Clarke, K., and Lewis, M.: Landsat and GRACE observations of arid wetland dynamics in a dryland river system under multi-decadal hydroclimatic extremes, J. Hydrol., 543, 818–831, 2016a. a
Xie, Z., Huete, A., Restrepo-Coupe, N., Ma, X., Devadas, R., and Caprarelli, G.: Spatial partitioning and temporal evolution of Australia's total water storage under extreme hydroclimatic impacts, Remote Sens. Environ., 183, 43–52, 2016b. a
Yang, Y., Long, D., Guan, H., Scanlon, B. R., Simmons, C. T., Jiang, L., and Xu, X.: GRACE satellite observed hydrological controls on interannual and seasonal variability in surface greenness over mainland Australia, J. Geophys. Res.-Biogeo., 119, 2245–2260, 2014. a, b
Yang, Y., Donohue, R. J., and McVicar, T. R.: Global estimation of effective plant rooting depth: Implications for hydrological modeling, Water Resour. Res., 52, 8260–8276, 2016. a
Zaitchik, B. F., Rodell, M., and Reichle, R. H.: Assimilation of GRACE Terrestrial Water Storage Data into a Land Surface Model: Results for the Mississippi River Basin, J. Hydrometeorol., 9, 535–548, https://doi.org/10.1175/2007jhm951.1, 2008. a