the Creative Commons Attribution 4.0 License.
the Creative Commons Attribution 4.0 License.
 | 10 Jan 2019
Understanding variability in root zone storage capacity in boreal regions
Leo-Juhani Meriö
Hannu Marttila
The root zone storage capacity (Sr) of vegetation is an important parameter in the hydrological behaviour of a catchment. Traditionally, Sr is derived from soil and vegetation data. However, more recently a new method has been developed that uses climate data to estimate Sr based on the assumption that vegetation adapts its root zone storage capacity to overcome dry periods. This method also enables one to take into account temporal variability of derived Sr values resulting from changes in climate or land cover. The current study applies this new method in 64 catchments in Finland to investigate the reasons for variability in Sr in boreal regions. Relations were assessed between climate-derived Sr values and climate variables (precipitation-potential evaporation rate, mean annual temperature, max snow water equivalent, snow-off date), detailed vegetation characteristics (leaf cover, tree length, root biomass), and vegetation types. The results show that in particular the phase difference between snow-off date and onset of potential evaporation has a large influence on the derived Sr values. Further to this it is found that (non-)coincidence of snow melt and potential evaporation could cause a division between catchments with a high and a low Sr value. It is concluded that the climate-derived root zone storage capacity leads to plausible Sr values in boreal areas and that, apart from climate variables, catchment vegetation characteristics can also be directly linked to the derived Sr values. As the climate-derived Sr enables incorporating climatic and vegetation conditions in a hydrological parameter, it could be beneficial to assess the effects of changing climate and environmental conditions in boreal regions.
- Article
(2588 KB) -
Supplement
(215 KB) - BibTeX
- EndNote


The hydrological cycle of boreal regions is changing vastly as a result of climate change (Prowse et al., 2015) and increasing anthropogenic land use activities (Instanes et al., 2016). Increasing temperatures and precipitation, shifts in precipitation from snow to rainfall, and retreating seasonal snow cover are a few examples of alterations of the boreal hydrological cycle (Bring et al., 2016). Consequences of increasing temperatures are likely to be most severe in boreal systems, as slight changes in temperature can alter the magnitude and timing of snow accumulation and melt (Carey et al., 2010). Predicted changes create climatic conditions at certain higher latitudes, which are similar to those at lower latitudes a few decades earlier (Intergovernmental Panel on Climate Change, 2014). These changes in climate will have an effect on different vegetation types, while at the same time land use activities have been intensified, especially in European countries, and are predicted to increase in the near future due to a “green shift” to a bio-based economy (Golembiewski et al., 2015). The land use changes consist of modifications in actual land use (increase in forest cover), but also of more intensive use of forests, including clear cutting, forest trimming, residual harvest and of increasing utilisation of peatland forests as a source for biomass (Laudon et al., 2011; Nieminen et al., 2017).
Under these changing conditions in particular, a proper hydrological understanding of boreal catchments is needed (Laudon et al., 2017; Waddington et al., 2015) to understand the sensitivity and resilience of catchments (Tetzlaff et al., 2013), but also to assess the effect of possible land use activities. Many studies have been conducted to explore hydrological changes resulting from land use activities (Ide et al., 2013; Mannerkoski et al., 2005; Nieminen et al., 2017), and some already studied changes in transpiration (patterns) at the catchment scale in boreal regions (Jaramillo et al., 2018; van der Velde et al., 2013). The partitioning between transpiration and runoff is largely determined by the water use efficiency of vegetation (Troch et al., 2009) and the available root zone storage capacity (Sr) of the vegetation (Zhang et al., 2001): the water use efficiency determines the amount of water the vegetation needs and the root zone storage capacity ensures sufficient storage to supply this water. Thus, detailed knowledge about these variables can increase the hydrological understanding of catchments under different conditions.
Traditionally, Sr is estimated from soil and vegetation data or calibrated in a hydrological model. Following the analysis that Sr is strongly related to climate variables (Gentine et al., 2012; Gimbel et al., 2016; Kleidon and Heimann, 1998), Gao et al. (2014) developed a new method to estimate Sr from climate data. Subsequently, several studies have been carried out in which this method was used. For example, Wang-Erlandsson et al. (2016) used earth observation data to estimate Sr globally, de Boer-Euser et al. (2016) did a comparison between the influence of soil and climate on Sr, Nijzink et al. (2016) investigated the change in Sr after deforestation and Zhao et al. (2016) introduced a snow component to the method and carried out a sensitivity analysis.
Thus, climate (or the balance between precipitation and transpiration) has a large influence on the developed Sr. However, it is very likely that root development is affected by other factors, including nutrients (Shahzad and Amtmann, 2017), the survival mechanism of the vegetation (Christina et al., 2017), or reduced space for root development due to shallow soil layers or high groundwater tables (Soylu et al., 2014). Sr is expected to change if any of these factors changes, which has consequences for the hydrology of the area (Saft et al., 2015). Assessing the (future) hydrology of boreal catchments could benefit from a better understanding of the relation between Sr and climatic and vegetation conditions.
The method to derive Sr from climate data was originally developed to estimate an important parameter in conceptual hydrological models (Gao et al., 2014). Therefore, influences on the derivation and wider applicability of the climate-derived Sr need to be investigated before it can be used to further assess the hydrology of boreal areas and to assist in assessing the hydrological effects of climatic and land use changes. Therefore, this study aims at better understanding the influences of different climate variables on the climate-derived Sr values and the wider applicability of Sr by comparing it with various catchment and vegetation characteristics.
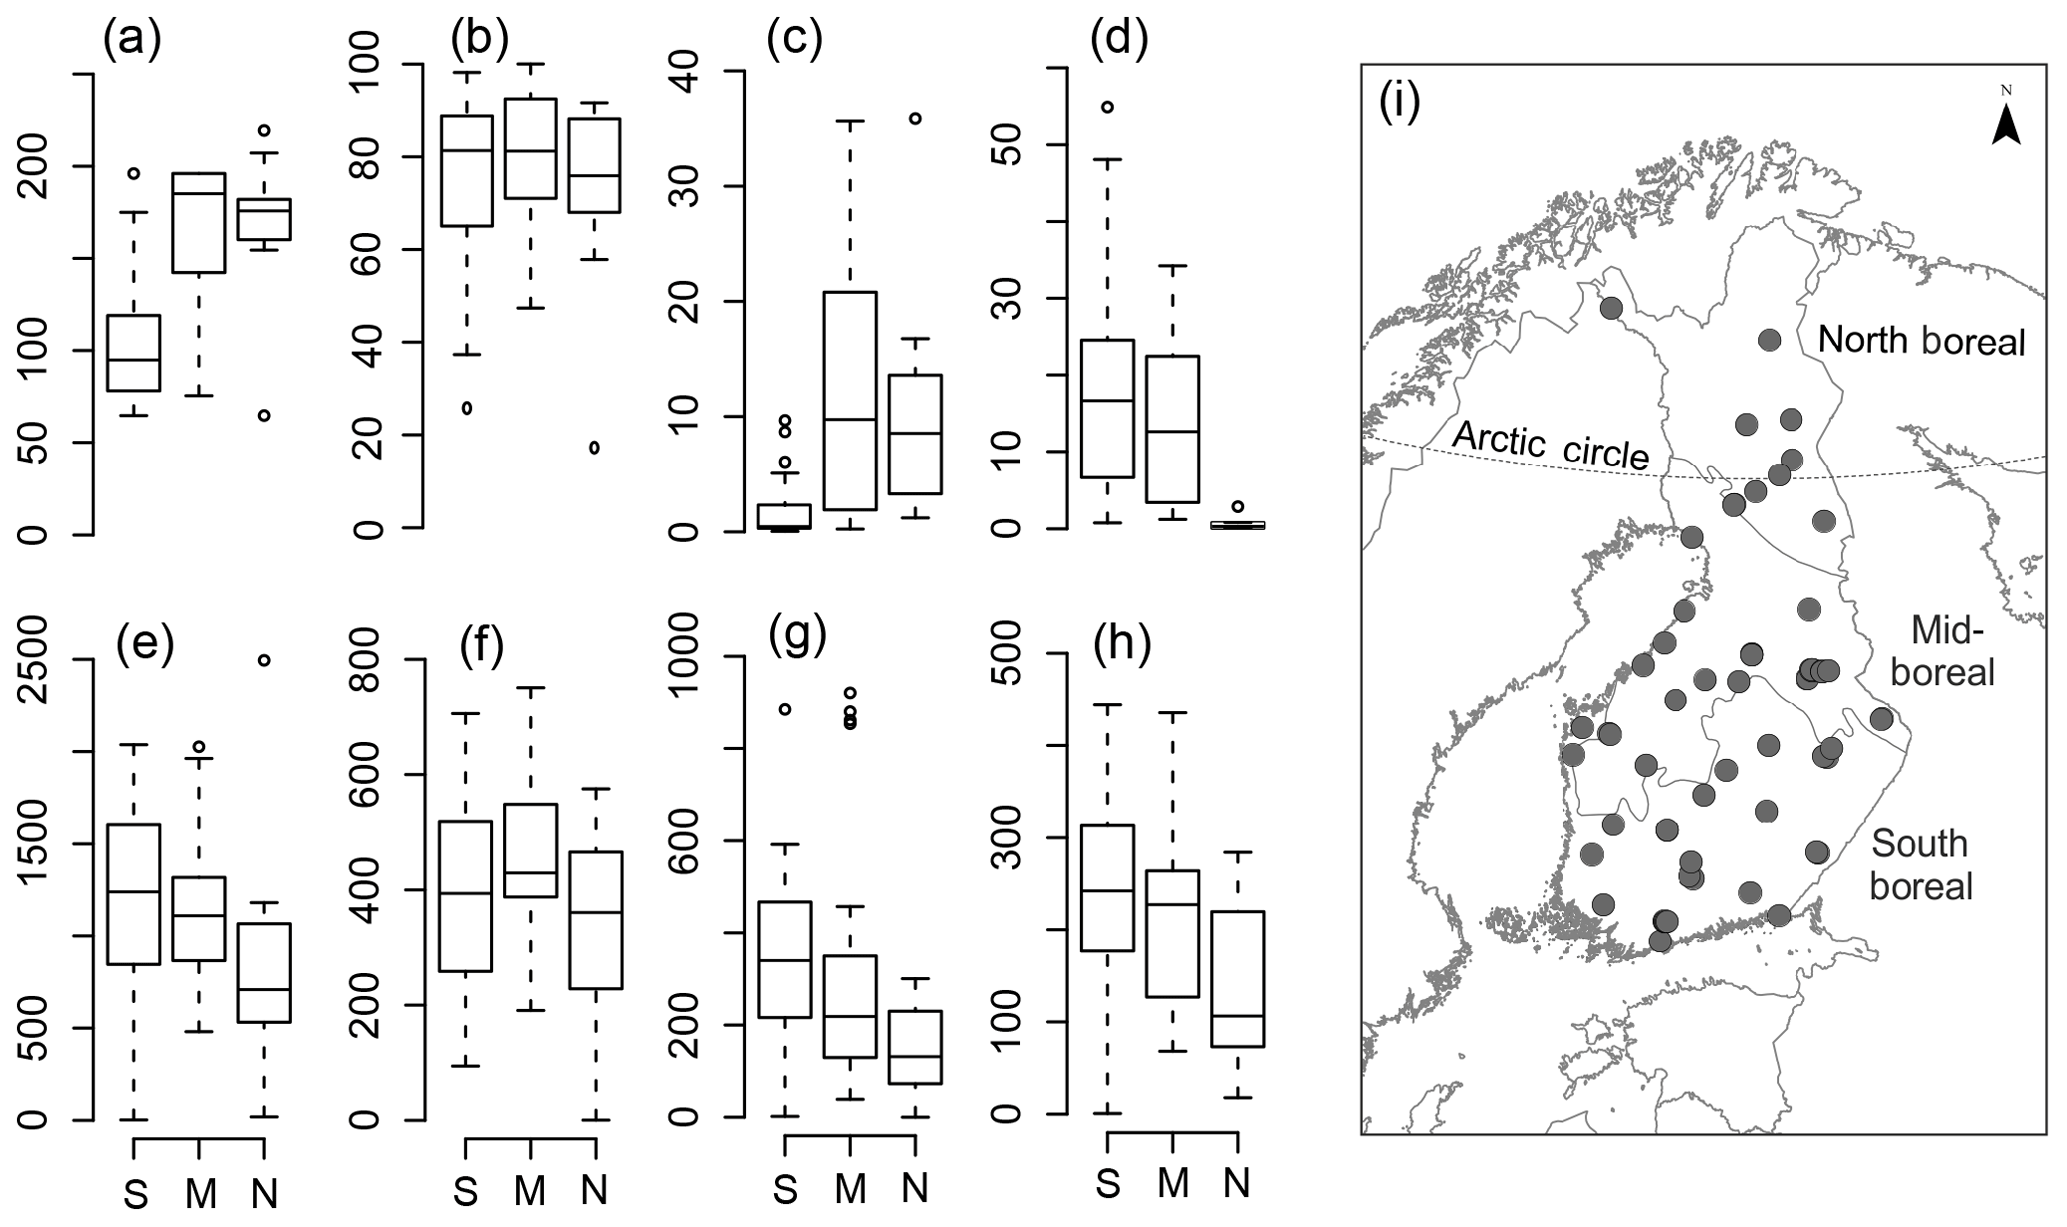
Figure 1(a) Maximum snow water equivalent (SSWE, mm), (b) percentage of forest (%), (c) percentage of pristine peatlands (%), (d) percentage of agricultural areas (%), (e) total tree root biomass (10 kg ha−1), (f) pine root biomass (10 kg ha−1), (g) spruce root biomass (10 kg ha−1) and (h) deciduous root biomass (10 kg ha−1) at different ecoregions (S is south boreal, M is mid-boreal and N is north boreal).
2.1 Characteristics of study catchments
A total of 64 headwater catchments were used for this study, spread over Finland. The catchments are located in different boreal regions (Ahti et al., 1968) and thus have different climate conditions and vegetation patterns (Fig. 1). All catchments belong to a national network of small catchments (Seuna and Linjama, 2004) and have been used in various studies (Kortelainen et al., 2006; Sarkkola et al., 2012, 2013b). The catchments used in this study were selected based on the availability of long-term runoff records, snow line records and meteorological data from the catchments.
The climate of the region is humid, with annual average air temperatures varying from 5 ∘C in the south to −2 ∘C in the north and average precipitation of 600–700 mm y−1 in the south and 450–550 mm y−1 in the north. Average maximum snow depth by the end of March is 50–400 mm in the south and 600–800 mm in the north.
The principal land cover in the study catchments is forest (with a median of 81 % coverage of evergreen, deciduous and mixed forest), followed by shrubs and herbaceous vegetation, inland waters, and wetlands. Agricultural activities were present in some of the catchments in the south and mid-boreal regions. Total root biomass, as well as root biomass for spruce and deciduous trees, decreases towards the north, while pine root biomass is more or less constant (Fig. 1). The surface area of the catchments ranges from 0.07 to 122 km2 (median 6.15 km2).
The soil type in the southern catchments is dominated by clay layers, whereas basal till and peatland cover is increasing when moving towards east and north. The catchments have relatively flat topography with a mean difference in elevation of approximately 70 m. The selected catchments do not contain any urban settlements. Tables S1 and S2 in the Supplement give an overview of available vegetation and climate characteristics for the study catchments.
2.2 Data use and correction
Two sets of data were used in the study: one for the calculation of the climate-derived root zone storage capacity and one to investigate the variation of Sr. For the Sr calculations daily precipitation, daily snow water equivalent, monthly potential evaporation and yearly discharge data were used. For investigating the variability and relations with catchment characteristics additional data were used, including leaf cover, tree length, root biomass, temperature, snow-off date and vegetation type.
Daily discharge was measured with water stage recorders and weirs were routinely checked for errors by the Finnish Environment Institute. Precipitation (P) and temperature data were taken from the national 10 km × 10 km interpolated grid produced by the Finnish Meteorological Institute (FMI) (Paituli database; https://avaa.tdata.fi/web/paituli/latauspalvelu, last access: 10 December 2018). These data have been checked for measurement errors caused by gauges and were corrected in operative quality control. The snow line data for snow water equivalent (SSWE), potential evaporation (Ep; based on pan measurements) and runoff data used were obtained from the Finnish Environmental Institute's open database (Hertta). Note that because Ep is derived from pan measurements, it is not measured when temperatures are below zero. However, it can be assumed that if it would be measured, amounts would be very low.
The snow line measurement points were either located inside or in close proximity to the study catchments; however, for some catchments the increase in SSWE during a season was higher than the total measured precipitation for the same period. As the precipitation data were assumed to be more reliable and less spatially variable, the SSWE data were adjusted on a daily basis to make them consistent with the precipitation data.
Corine Land Cover 2012 data (Paituli database) were used for determining the vegetation types occurring in the study catchments. The surface lithology and geology data are based on the Surface Geology Map of Finland (Hakku database; https://hakku.gtk.fi/en/locations/search, last access: 10 December 2018.). Data for root biomass, tree height and leaf cover are based on multi-source national forest inventory data provided by the Natural Resources Institute Finland (LUKE open data; http://kartta.metla.fi/opendata/valinta.html, last access: 10 December 2018.). Data are based on field inventory data, satellite images, digital map data and other georeferenced data sets (Mäkisara et al., 2016). Tree data were available for pine, spruce and deciduous forest types. Drained and pristine peatland masks were obtained from the Finnish Environmental Institute (SYKE).
2.3 Climate-derived root zone storage capacity
To investigate the variability in root zone storage capacity, a climate-derived root zone storage capacity (Sr) was used. The derivation of this Sr is based on the principle that vegetation will create a buffer with its root system just sufficient to overcome a drought with a certain return period. Investing less in a root system would lead to the vegetation dying in the case of a more severe drought, and investing more is not efficient in terms of carbon use. This method results in a catchment-representative storage capacity, which reflects the root zone storage capacity for all vegetation combined in a catchment. It is further assumed that the amount of required storage depends on the amount of water that should have transpired to close the water balance. In this study the same base calculation was used as in de Boer-Euser et al. (2016), but as snow accumulation cannot be neglected in Finland, an additional snow module was added (Fig. 2). For the calculation of Sr the daily balance between infiltration (I) and transpiration demand (T) is used to simulate the amount of storage the vegetation would need to cover the infiltration deficit.
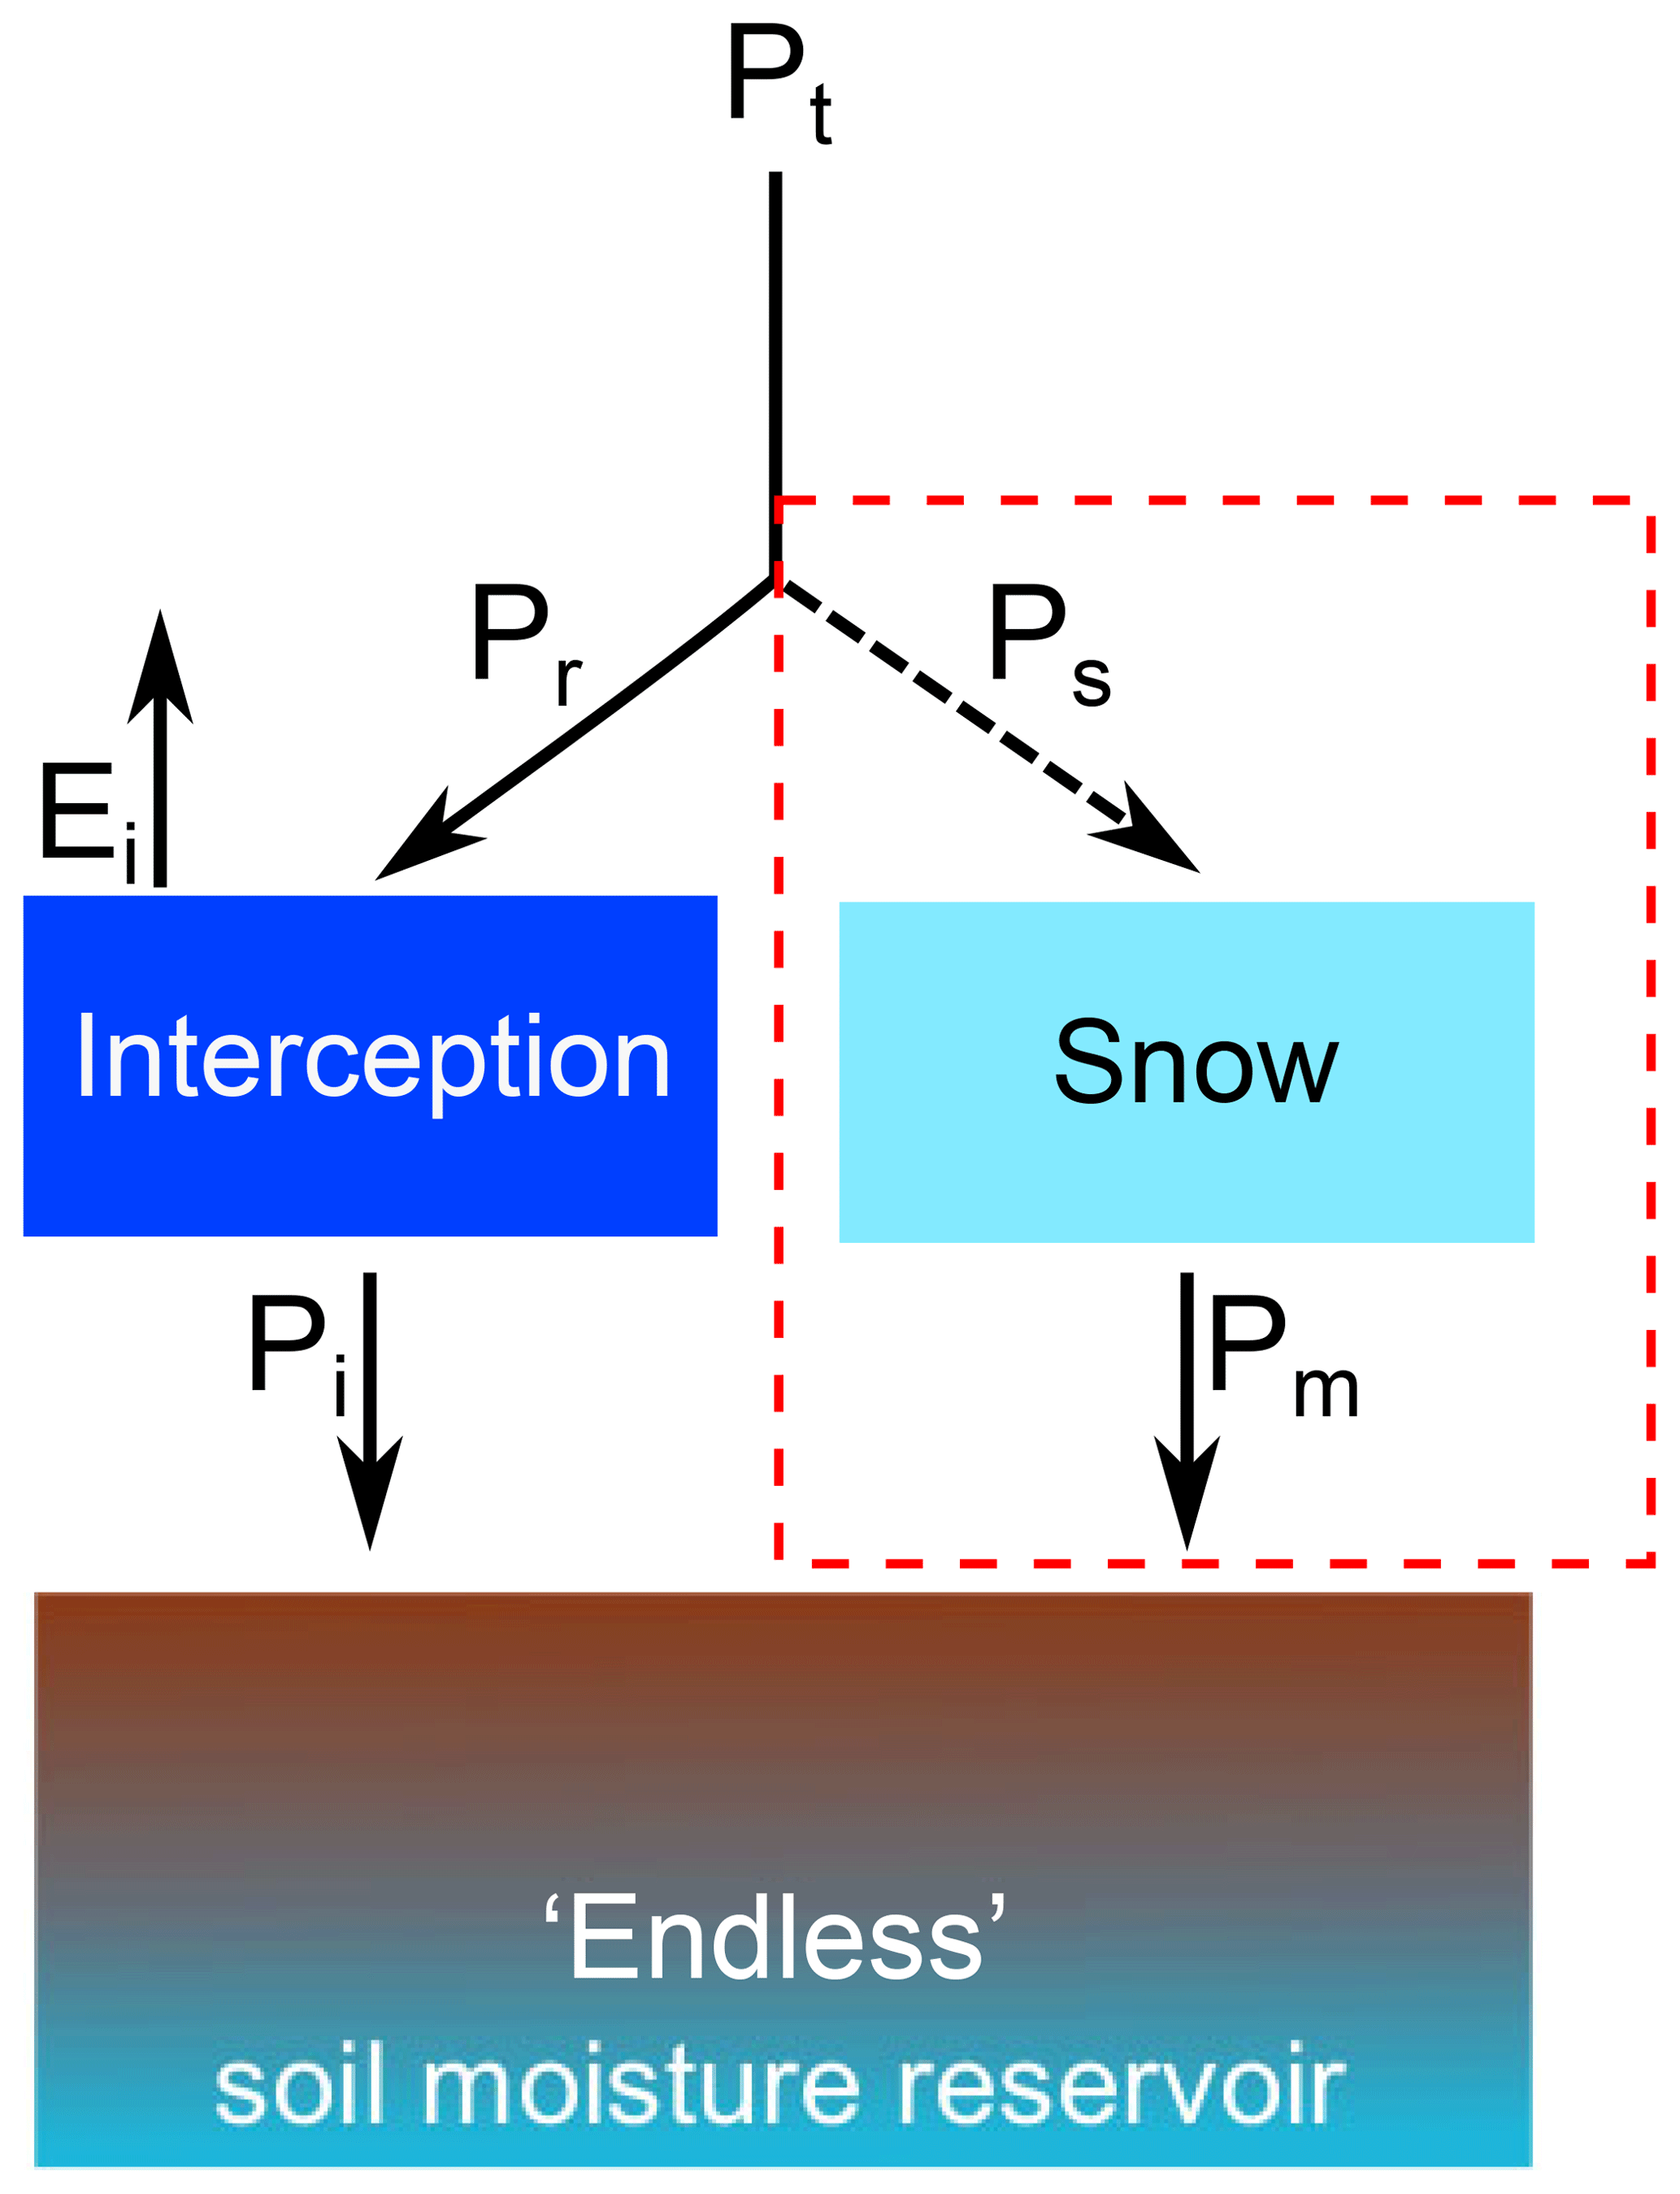
Figure 2Schematisation of the method to calculate Sr, including snow module; the part in the red square is added for this research, the “endless” soil moisture reservoir is similar to the one in de Boer-Euser et al. (2016). The arrow for Ps is dashed as this flux is not actually calculated, but Pm is derived from the change in SSWE.
The transpiration demand used in this method is the amount of water that should, in the long term, transpire to close the water balance. To obtain an estimate for the transpiration demand, first was derived from the long-term water balance (); second, monthly averaged potential evaporation was used to add seasonality. Infiltration was assumed to be the result of precipitation minus interception evaporation in the original calculations (Gao et al., 2014; de Boer-Euser et al., 2016). However, in case of solid precipitation, the precipitation is stored on the soil surface for days to months and only infiltrates during the snow melt period. As this is a relevant process in most of the study catchments, a snow component (Eqs. 1–4) was added to the calculation method. The change in SSWE was used to determine the amount of precipitation stored on and infiltrating into the soil on a daily basis. Interception was only taken into account in case of liquid precipitation and an interception threshold of 1.5 mm was assumed for all catchments. Sublimation was not taken into account, as potential evaporation is generally (very) low when snow cover is present.
The estimates for infiltration and transpiration demand were used in a daily simulation of the root zone storage. Infiltration forms the inflow of water and transpiration the extraction; any excess water is assumed to run off directly. This simulation results in annual required maximum storage capacities, which were used in a Gumbel distribution (Gumbel, 1935) to obtain the required storage capacity to overcome a drought with a 20-year return period. A 20-year return period was selected as an averaged catchment representative, following the results of Gao et al. (2014) and Wang-Erlandsson et al. (2016) and based on the high percentage of forest cover in the study catchments.
The method described above estimates Sr for a current situation based on historical drought occurrences. However, the same principle and calculation method can be used to estimate Sr under changing conditions. These can be derived from observed data (Nijzink et al., 2016), but can also consist of scenarios of changing climate variables or land use characteristics. The latter could be represented by using a different drought return period (Wang-Erlandsson et al., 2016).
For estimating Sr in this study, data from 1 January 1990 to 31 December 2012 were used. For precipitation and snow water equivalent daily values were used, while for discharge and potential evaporation data, long-term yearly and monthly averages were used respectively. For some of the catchments discharge data had limited availability for the study period; for these catchments older discharge data were taken into account as well to obtain a long-term average.
with Prz= infiltration, Pt total precipitation, Pi effective precipitation, Pm snow melt and SSWE snow water equivalent.
2.4 Relations between Sr and catchment characteristics
To further explore the physical meaning and applicability of the climate-derived root zone storage capacity, Sr values were compared with climate variables, vegetation characteristics and coverage of vegetation types.
2.4.1 Climate variables
The method used to derive Sr is based on climate data, so it is expected that climate has a strong influence on the derived Sr values. However, the derived Sr values are not a linear combination of the variables used (i.e. daily P, daily SSWE, yearly Q, monthly Ep) and thus the influence of different climate variables is not straightforward. Therefore, derived Sr values are compared with four other climate variables (P∕Ep ratio, mean annual temperature, snow-off date and maximum SSWE) to analyse which ones have the strongest relation with the Sr values. These variables were selected as they are expected to reflect the absolute and phase difference between water supply (precipitation and snow melt) and water demand (transpiration), which is assumed to have the largest influence on the derived Sr values.
The relations between the estimated Sr values and climate variables were assessed by analysing spatial patterns and scatter plots. To assess the correlation between the different variables, the non-parametric Spearman's correlation coefficient was used.
2.4.2 Vegetation characteristics
The climate-derived Sr is originally a parameter for conceptual hydrological models and for that purpose it is expected to reflect a representative storage capacity in a catchment. In that sense it cannot be attributed to a single type of vegetation or be directly measured in the field; despite this, it is expected that it is related to actual vegetation characteristics. When this correlation indeed exists, the climate-derived Sr will be more useful to use for other purposes than modelling.
First, it is expected that vegetation actually has to increase its root biomass in order to increase the root zone storage capacity. Therefore, the derived Sr is compared with data about root biomass for three different tree types. Second, an essential part of the Sr calculation is the estimation of the transpiration demand. The average transpiration for the calculations is derived from the water balance (difference between precipitation and discharge), and is reflected in the derived Sr values. As the precipitation is relatively similar for the study catchments (mean of 1.65 mm d−1, with a standard deviation of 0.14 mm d−1), higher transpiration demands will lead to higher Sr values. Similarly, higher transpiration demands indicate that the vegetation can use more (solar) energy for their development and thus establish more above-ground biomass as well. Therefore, it is expected that the derived Sr values are related to vegetation properties like leaf cover and tree height as well.
2.4.3 Vegetation types
Different vegetation types and their corresponding land covers occur in different climates and ecosystems and can have different survival mechanisms. And a change of vegetation or land cover type is likely to change the transpiration and thus the hydrology of a catchment. Therefore, the relation between Sr and land cover and vegetation types was investigated. The vegetation types included in this analysis are forest (containing all forest types), pristine peatlands, drained peatlands (covered with either forest or agriculture) and agricultural area. The relations between the estimated Sr values and these vegetation types were assessed using scatter plots between Sr and the vegetation types. The non-parametric Spearman's correlation coefficient was used to assess the correlation between the different variables.
2.4.4 Correlations among catchment characteristics
The catchment characteristics that were compared with the climate-derived Sr are very likely to be correlated, making it difficult to assess their individual relation with Sr. A principal component analysis (PCA) was set up across all catchments to explore the dependencies between the characteristics used. A PCA is a statistical tool which can be used to reduce the dimensions of a problem and explore correlations between variables.
Before carrying out the PCA, the end products were standardised to have zero mean and unit variance on the covariance matrix. The final number of principal components (PCs) was determined using the broken-stick model (Jackson, 1993), in which eigenvalues from a PCA are compared with the broken-stick distribution. Since each eigenvalue of a PCA represents a measure of a component's variance, a component was retained if its eigenvalue was larger than the value given by the broken-stick model. Numerical results of the PCA can be found in Table S3.
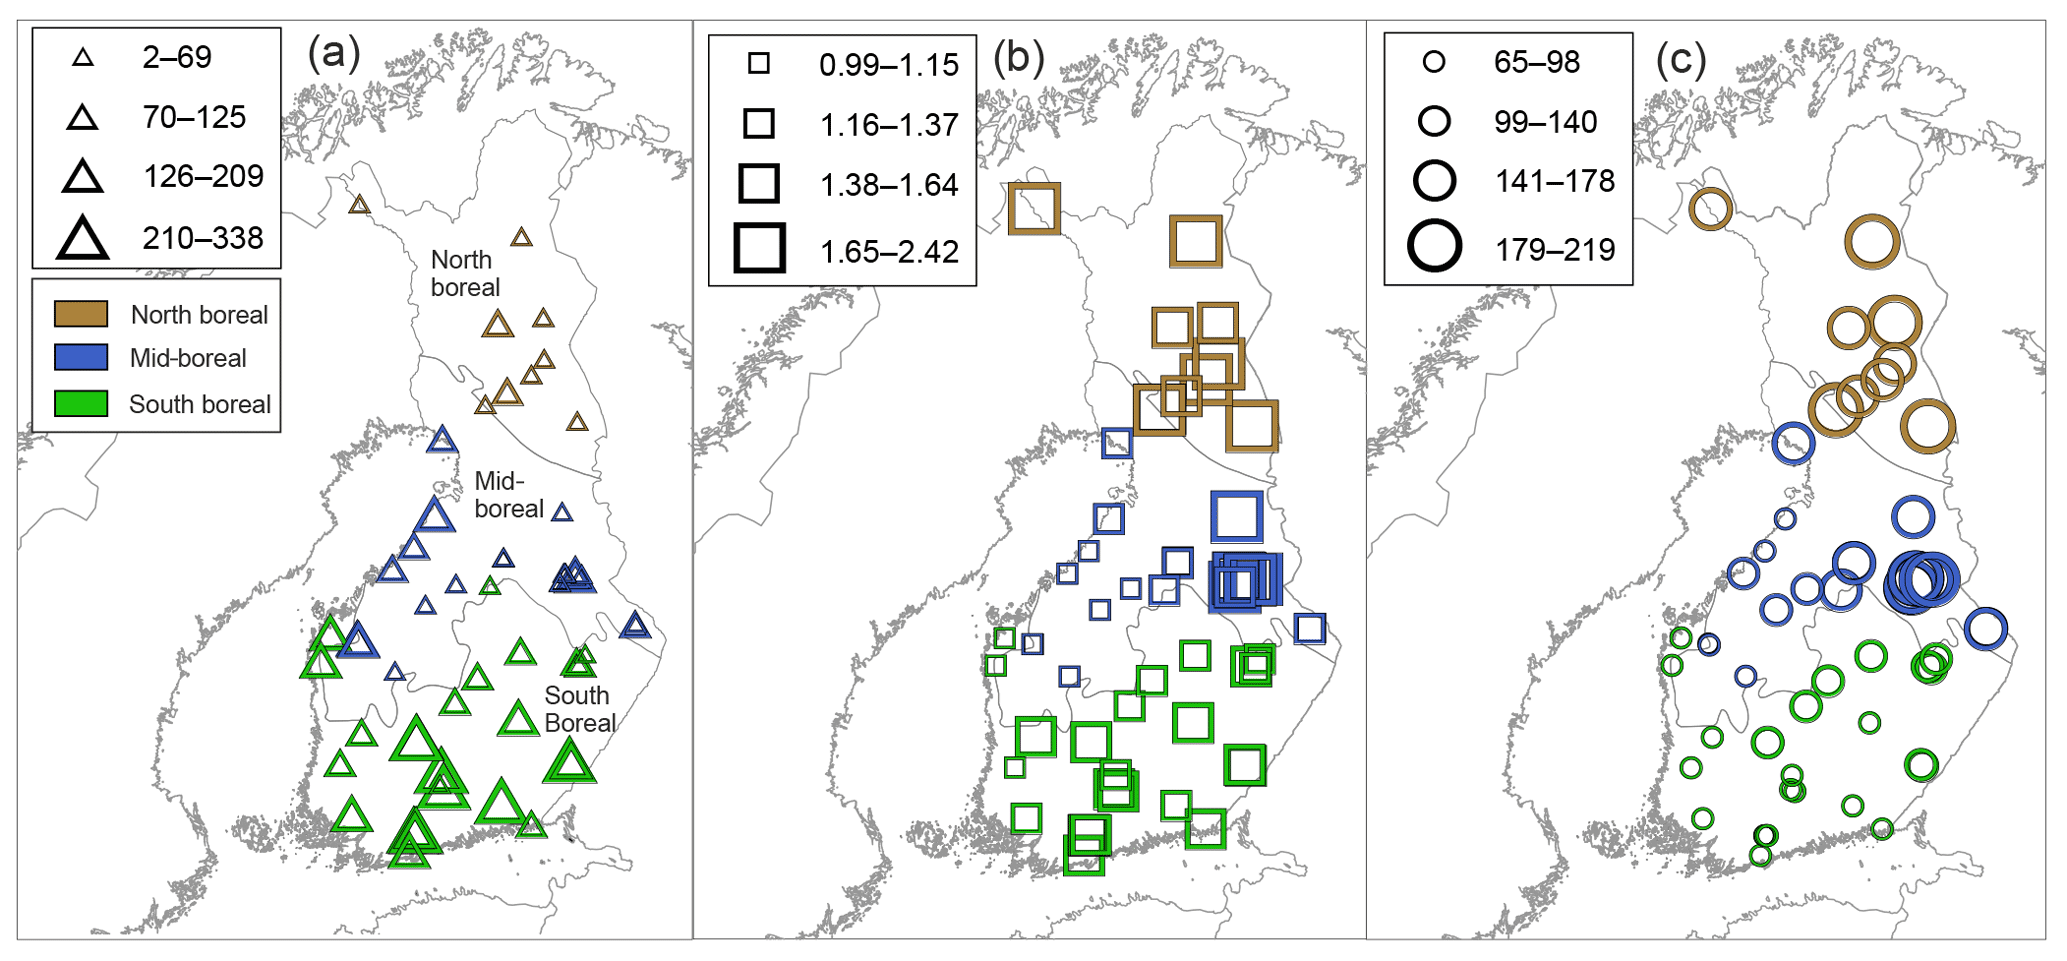
Figure 3Map with study catchments and (a) calculated root zone storage values (Sr, mm), (b) ratio of precipitation and potential evaporation, and (c) maximum snow water equivalent (SSWE, mm). Different boreal ecoregions (south boreal, mid-boreal and north boreal) are shown in the colours of the symbols and boundaries of ecoregions are marked with grey lines.
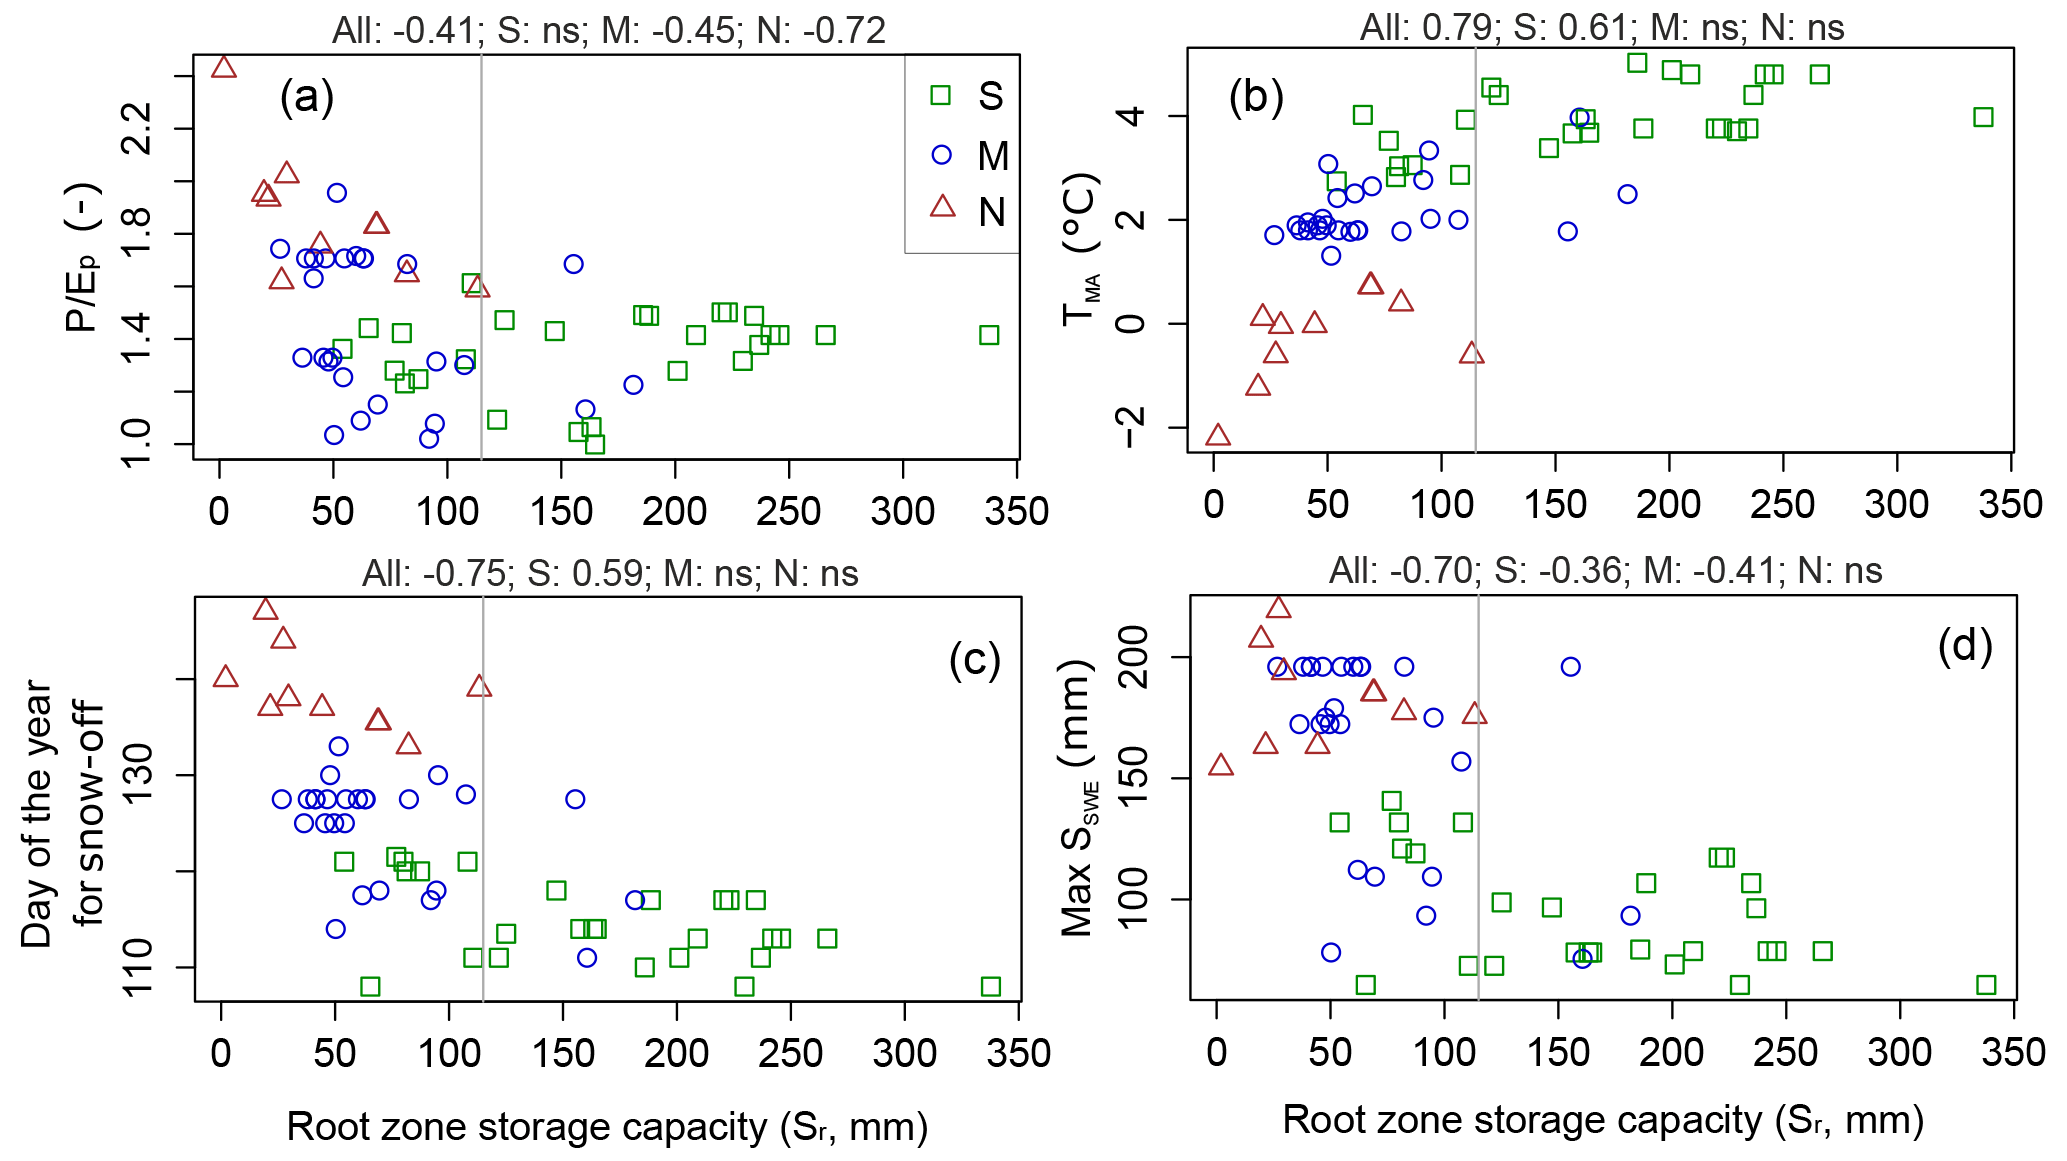
Figure 4Root zone storage capacities and (a) ratio of average precipitation and potential evaporation (P∕Ep), (b) mean annual temperature (TMA, ∘C), (c) day of the year for snow-off, and (d) maximum snow water equivalent (SSWE, mm) in the catchment at different ecoregions (S is south boreal, M is mid-boreal and N is north boreal). The titles of the sub-plots show the Spearman's correlation coefficients (significant correlation for p<0.05). The line at 115 mm illustrates the discussed threshold.
3.1 Climate variables
Derived root zone storage capacities were compared with a set of climate variables reflecting the absolute and phase difference between water supply and demand. Focusing first on the relation between Sr and the absolute difference, Fig. 3 shows the spatial patterns of Sr and P∕Ep (a definition of the aridity index). Sr values generally decrease from south to north and, especially for the mid-boreal region, a large difference exists between the eastern and western side of the country. For the catchments in the north and mid-boreal regions larger Sr values generally coincide with smaller P∕Ep ratios, but for the south boreal region this pattern is less clear. The same can be observed from Fig. 4a: the catchments in the north and mid-boreal regions show a negative correlation between Sr and P∕Ep, while in the south boreal region no significant correlation exists: the range in Sr values is large, although the variability in P∕Ep is small.
Second, snow cover (expressed in snow water equivalent, SSWE) is important when focusing on the phase difference between water supply and demand. With more precipitation being stored for longer periods the supply of water will be delayed. Figure 3 shows for the majority of the catchments higher derived Sr values (a) in case of lower maximum SSWE (b). However, for some catchments in the mid-boreal region very small Sr values are derived while maximum SSWE is not very high. As also discussed in Sect. 3.4 and shown in Fig. 8, P∕Ep and SSWE are correlated. Both Ep and snow storage and melt, in particular, are driven by temperature. Figure 4 shows the strongest correlation between mean annual temperature (TMA) and Sr, followed by snow-off date, maximum SSWE and P∕Ep. This indicates that for the catchments studied the phase difference as well as the absolute difference between water supply and demand are important, with the first one probably having a larger influence.
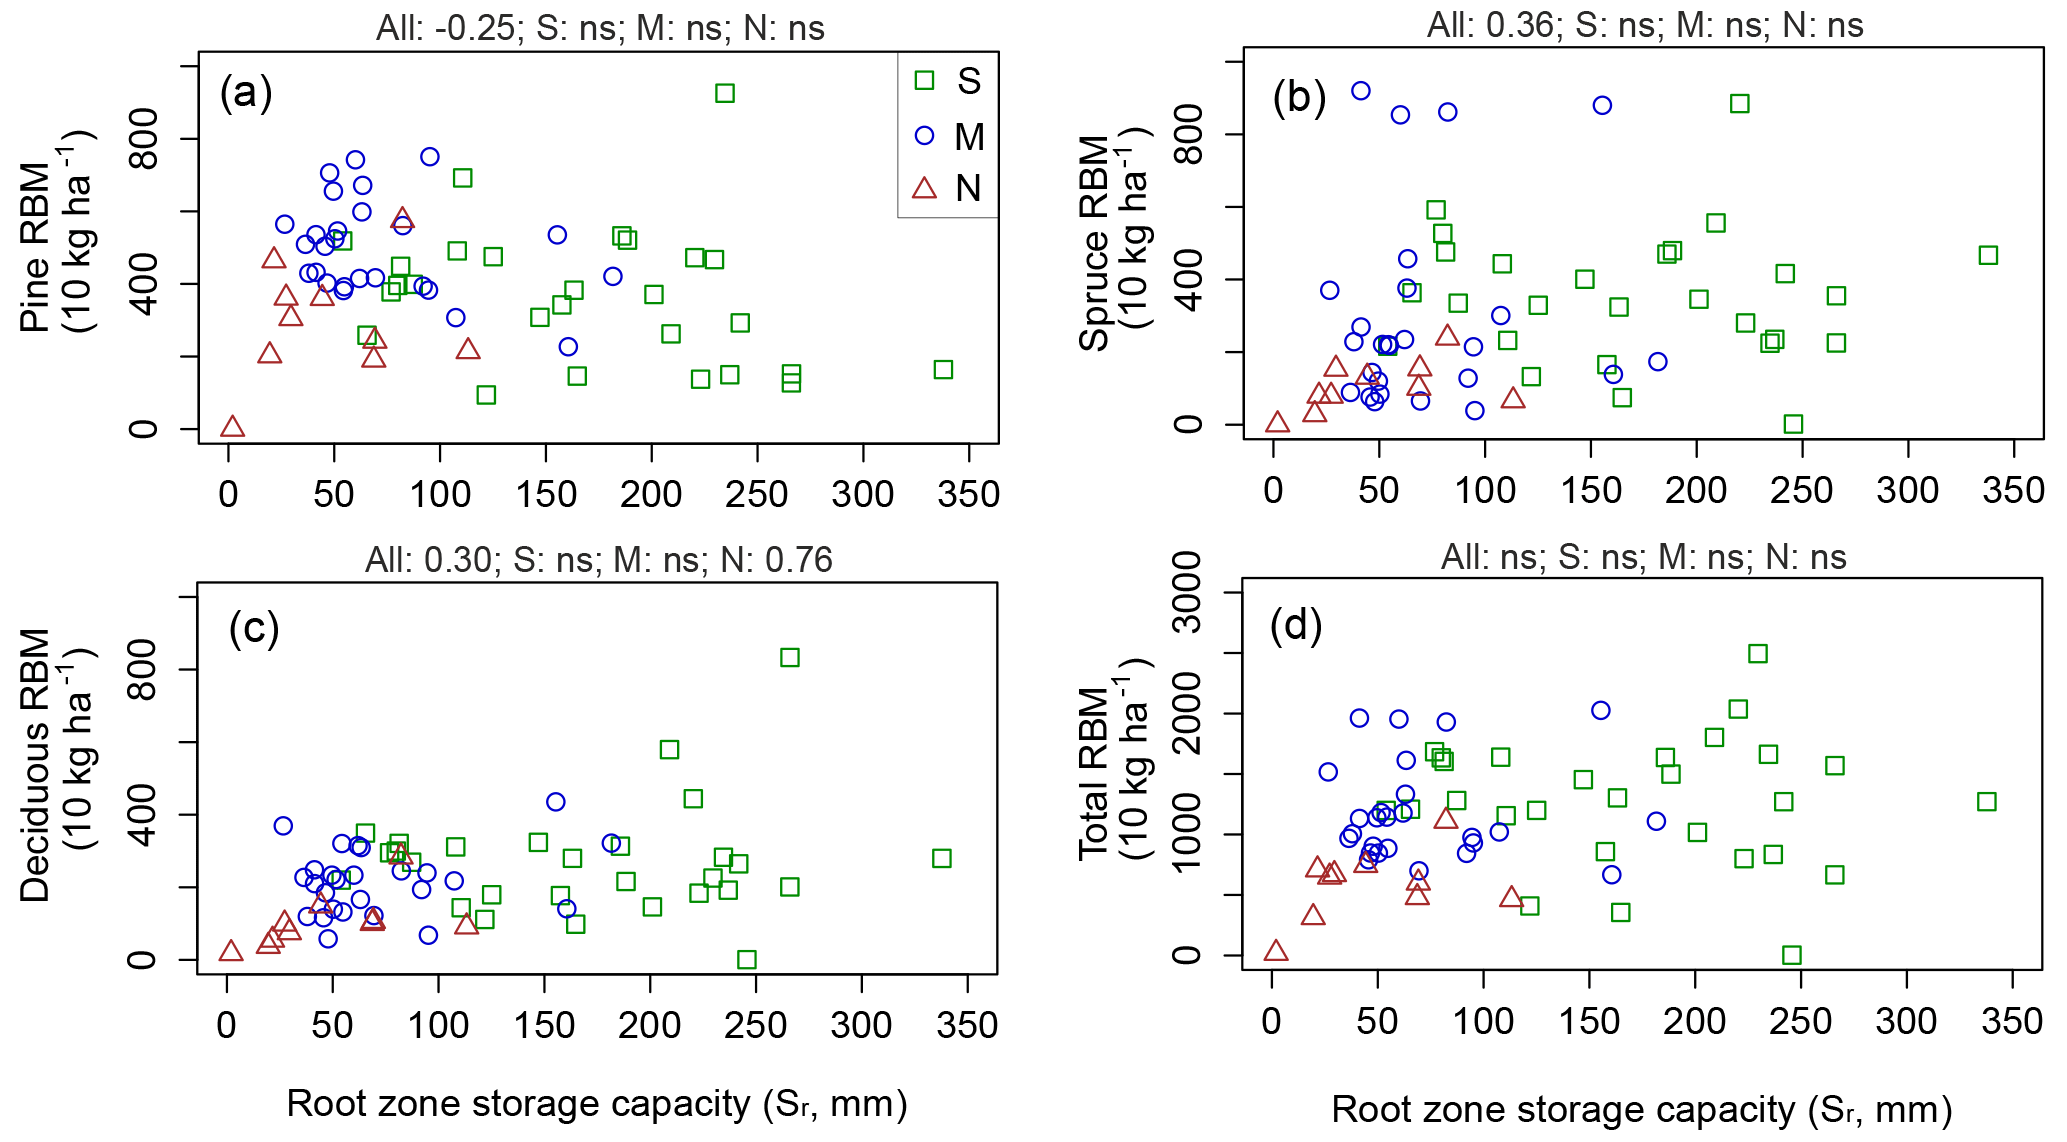
Figure 5Root zone storage capacities and (a) pine root biomass (RBM, 10 kg ha−1), (b) spruce RBM (10 kg ha−1), (c) deciduous RBM (10 kg ha−1) and (d) total RBM (10 kg ha−1) in the catchment at different ecoregions (S is south boreal, M is mid-boreal and N is north boreal). The titles of the sub-plots show the Spearman's correlation coefficients (significant correlation for p<0.05).
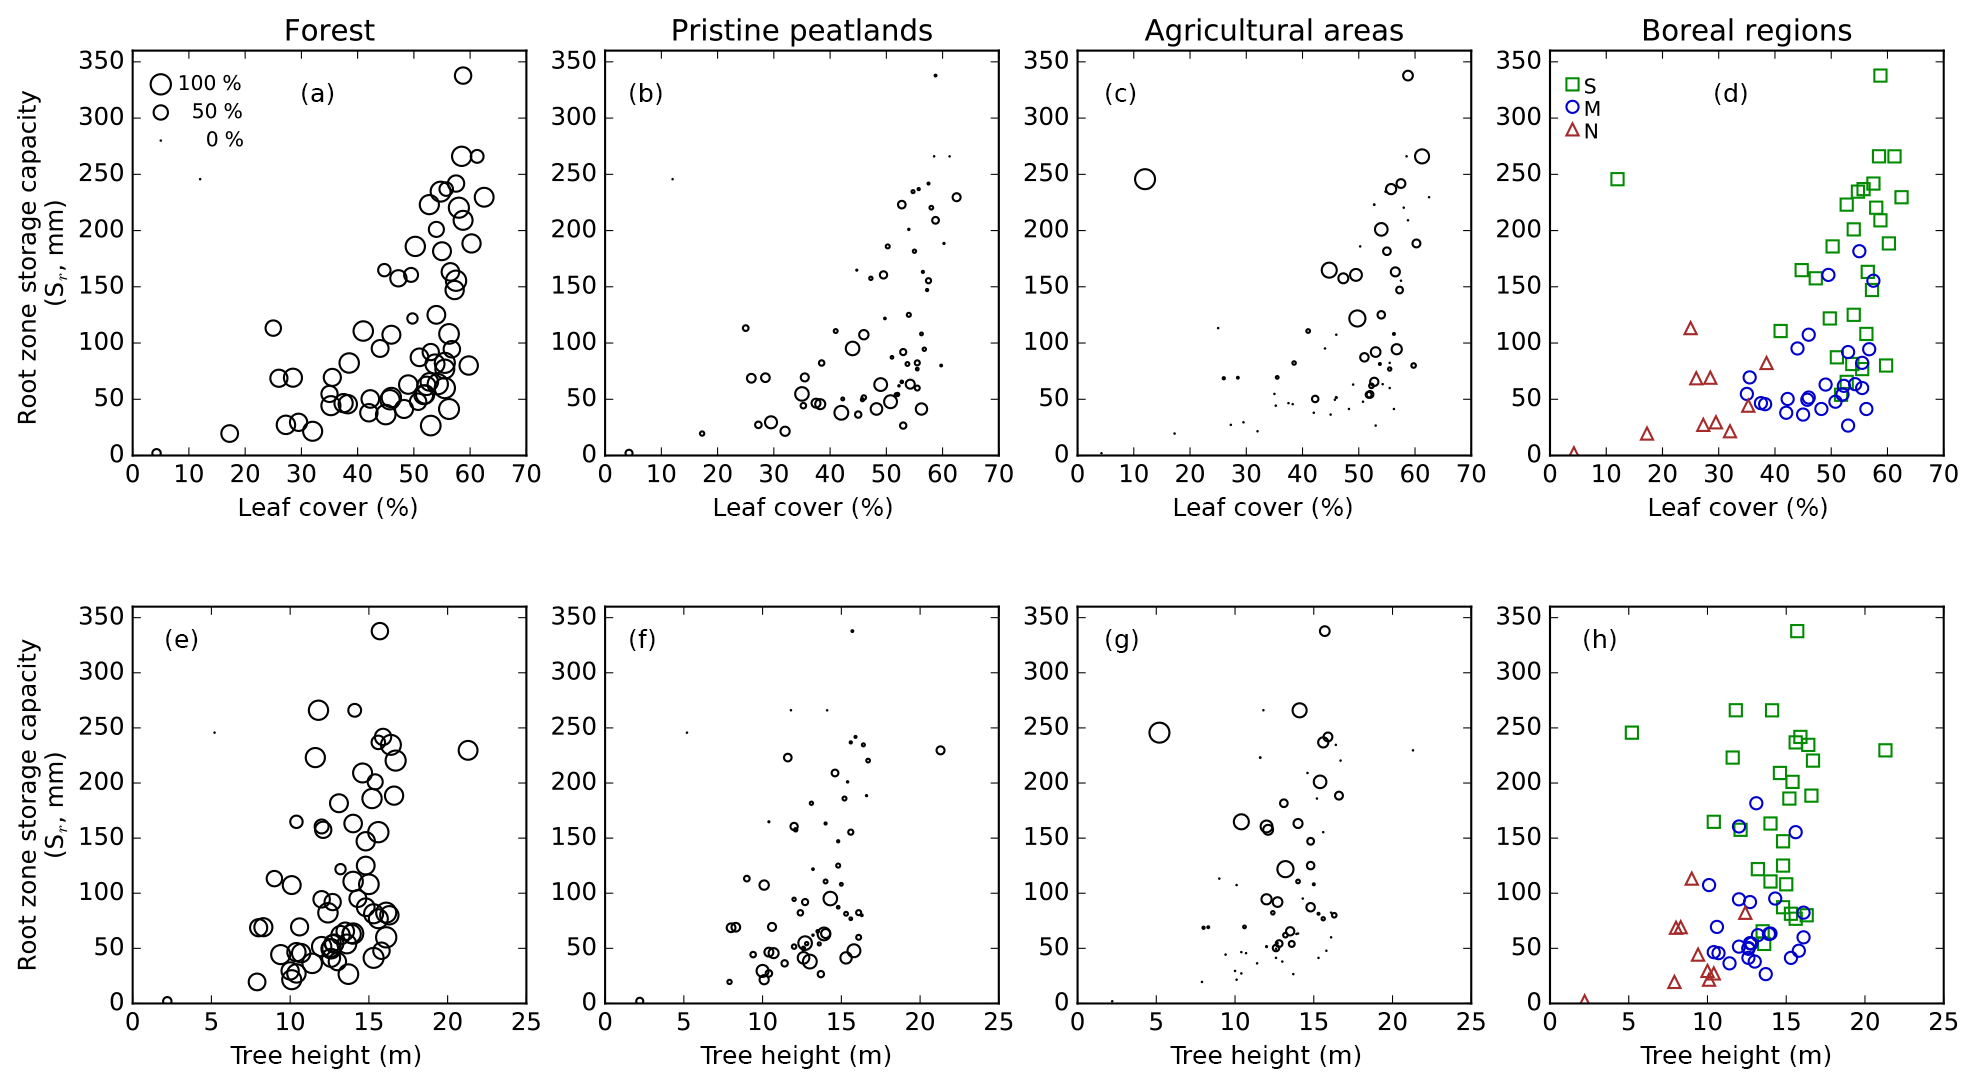
Figure 6Calculated root zone storage capacity versus average leaf cover (a–d) and tree height (e–h) of 4 years. Larger circles indicate a higher percentage of vegetation type for (a, e) forest, (b, f) pristine peatlands and (c, g) agriculture; (d, h) are colour coded by boreal region. Sr has statistically significant Spearman's correlation with leaf cover (r=0.33) and tree height (r=0.32). Different boreal regions did not result in statistically significant correlations when considered individually.
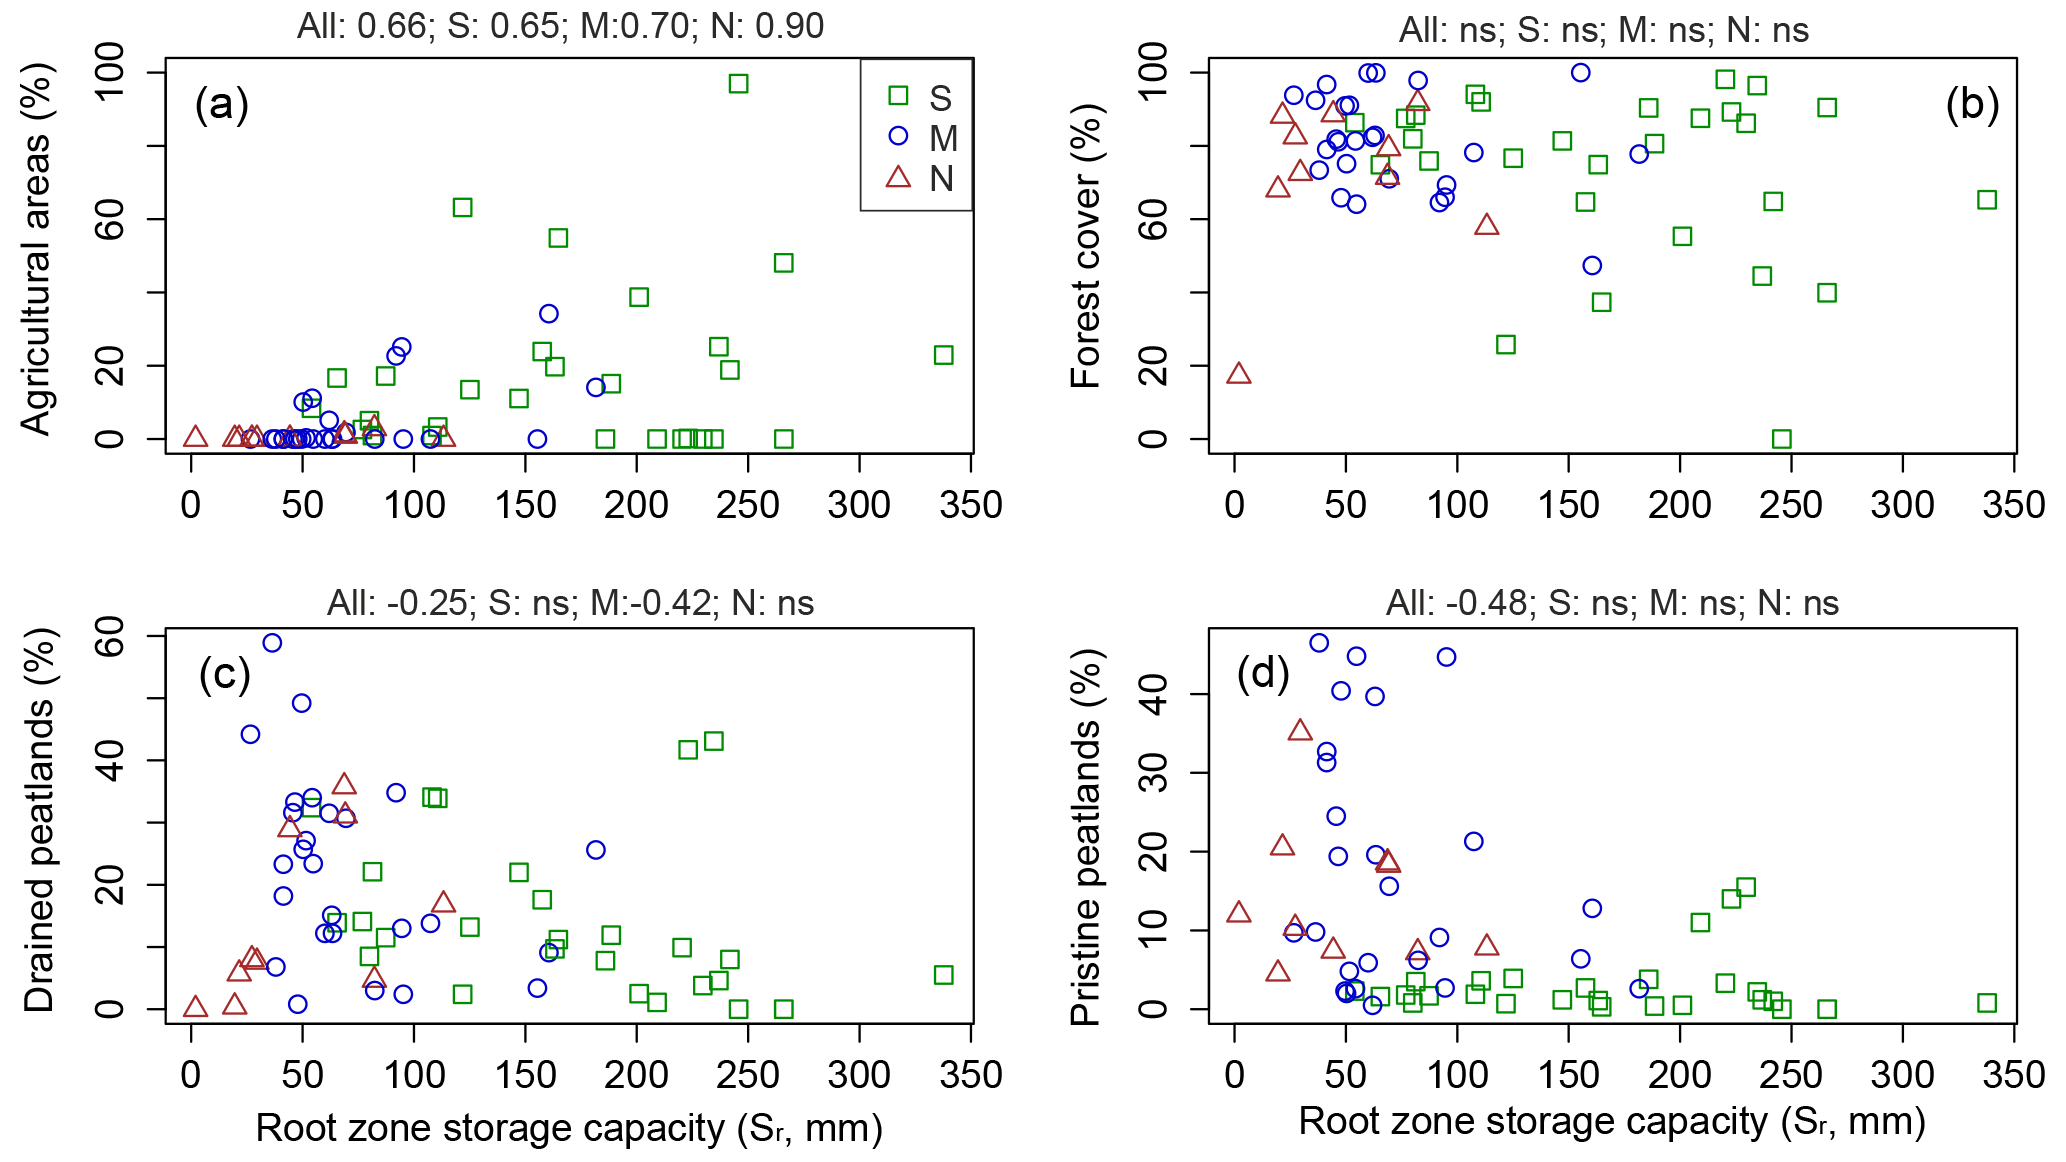
Figure 7Root zone storage capacities (Sr, mm) and proportion of (a) agricultural areas (%), (b) forest cover (%), (c) drained peatlands (%) and (d) undrained peatlands (%) in the catchment at different ecoregions (S is south boreal, M is mid-boreal and N is north boreal). The titles of the sub-plots show the Spearman's correlation coefficients (significant correlation for p<0.05).
3.2 Vegetation characteristics
Estimated root zone storage capacities were compared with characteristics of the vegetation in the study catchments. In Fig. 5 Sr is compared with the observed root biomass in the catchments. A distinction is made between three types of trees: pine, spruce and deciduous trees. Root biomass of spruce and deciduous trees is positively correlated with Sr when considering all catchments; when considering the individual boreal regions, a significant correlation only exists for deciduous trees in the north boreal region. The correlation between Sr and root biomass of pine is very interesting: a negative correlation exists between Sr and root biomass when considering all catchments. For the individual regions no significant correlation exists. This finding indicates that more storage is created with fewer or thinner roots. Figure 5d combines the results for all tree types and shows in general higher Sr values for higher densities of root biomass, but this correlation is not significant.
Figure 6 shows the relation between Sr and average leaf cover (top row) and tree height (bottom row). For both comparisons the data are plotted indicating the occurrence of different vegetation types (forest, pristine peatlands and agriculture) in the catchments and the boreal regions in which the catchments are located. Sr is positively correlated with both leaf cover and tree height (Spearman's coefficients of 0.33 and 0.32 respectively), but no significant correlation exists for the individual boreal regions. When looking at the different vegetation types, it can be seen that catchments with a large forest cover are the ones with the widest range in leaf cover and tree height. For catchments with a large agricultural cover in particular, this range is smaller. More details about the relation between vegetation type and Sr are discussed in Sect. 3.3 and Fig. 7.
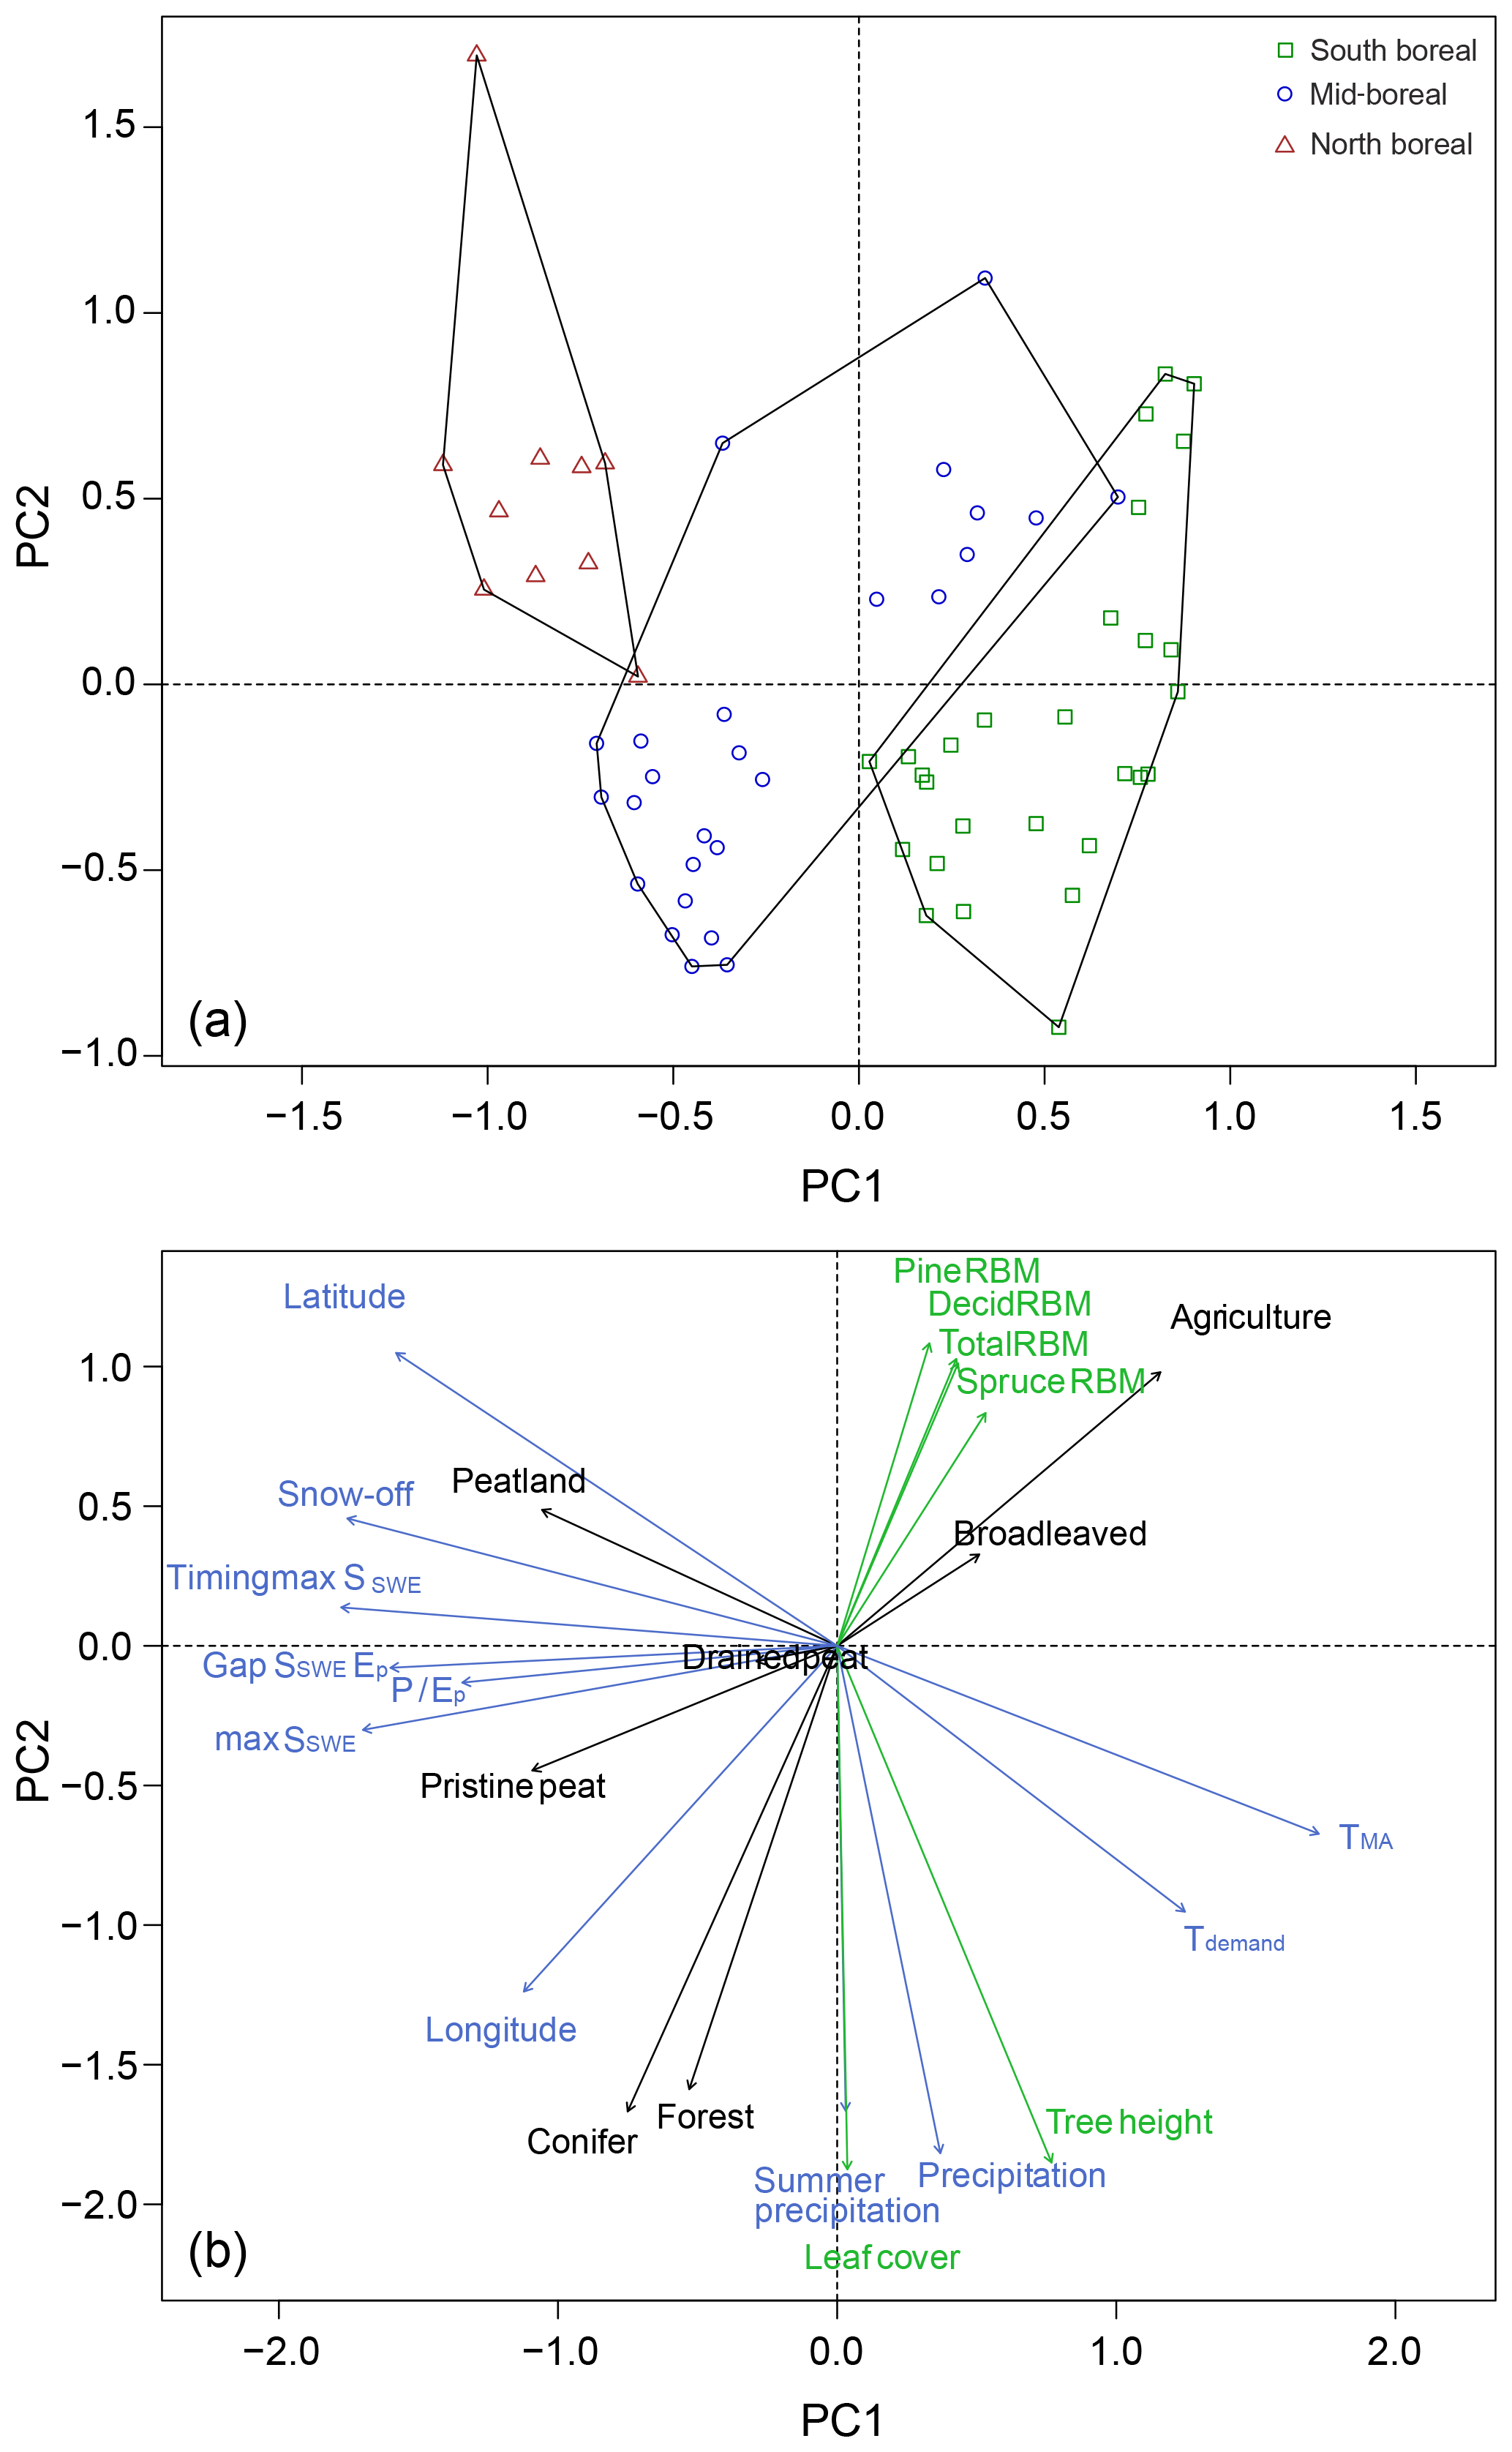
Figure 8Principal component analysis with the catchment characteristics that are being compared with Sr in the study. (a) Catchments plotted on PC1 and PC2, with boreal regions indicated. (b) Catchment characteristics with their loadings on PC1 and PC2; catchment characteristics are divided into three categories: climate (blue), vegetation characteristics (green) and land use types (black). Note that for readability the axis of the two plots are not the same.
3.3 Vegetation types
In addition to climate and vegetation characteristics, vegetation types can also have an influence on the derived Sr, mainly because different vegetation types have different transpiration patterns and survival strategies. Before analysing correlations between Sr and vegetation type, it should be noted though that vegetation types are (partly) correlated with climate as well (Fig. 8). This is especially relevant for the correlations between Sr and (pristine) peatlands and agriculture.
The strongest correlation between Sr and vegetation types can be found for agricultural covers; here a significant positive correlation is not only present when considering all catchments, but also for the three individual regions (Fig. 7). Further, a decrease in forested area coincides with a larger range in Sr, but no significant correlation is found, either for all catchments or for the individual regions (Fig. 7b). The drained peatlands (Fig. 7c) also show a negative correlation with Sr when considering all catchments and for the mid-boreal region: for the north and south boreal regions no significant correlations were found. While for the former three vegetation types a stronger or weaker gradual relation with Sr can visually be observed, the pristine peatlands show strong threshold behaviour. For catchments covered for more than 20 % with pristine peatlands, Sr values are below 115 mm. It should be noted though, that catchments with high pristine peatland cover do not occur in the south boreal region.
3.4 Correlations among catchment characteristics
The variables that were compared with Sr are very likely to be correlated among themselves as well. Therefore, Fig. 8 shows a principal component analysis based on the catchment characteristics used in the analysis. Figure 8a shows the individual catchments with their loadings on PC1 and PC2 (with a combined explained variance of 54 %); Fig. 8b shows the same for the catchment characteristics used in the comparison. The plotted catchments (a) indicate that the eco-regions mainly differ in climate characteristics and that in the mid- and south boreal regions in particular a large range of vegetation characteristics and vegetation types occur.
Figure 8b shows that the majority of the climate variables (shown in blue) are positively correlated to each other and negatively correlated to the mean annual temperature and transpiration demand. What can also be seen is the limited correlation between the majority of the climate variables and (summer) precipitation. With respect to vegetation characteristics (shown in green), these are strongly correlated with forest and agricultural land covers, but weakly correlated to the majority of the climate variables. Only peatland covers are positively correlated with the majority of the climate variables.
In particular, the relative independence of the vegetation characteristics and vegetation types with respect to the climate variables is important to keep in mind when interpreting the results. This means that relations between Sr values and vegetation characteristics are not likely to be strongly influenced by the climate variables.
3.5 Threshold behaviour
The results presented before show to a variable extent a threshold in the relation between the derived Sr values and the catchment characteristics. This threshold is mainly visible in Figs. 4 and 7d and seems to be the strongest for snow characteristics (Fig. 4c, d) and pristine peatlands (Fig. 7d). For all variables the threshold is located at a Sr of approximately 115 mm. To further investigate the origin and position of the threshold the catchments were divided into two groups separated by a Sr of 115 mm. Within the groups statistically significant variations exist in both vegetation groups, specifically in tree root biomass (pine RBM: Mann–Whitney U test, p=0.0131; spruce RBM: U test, p=0.0363) and proportion of pristine (U test, p=0.0008) and drained (U test, p=0.0135) peatlands. At the same time climatic parameters also changed: P∕Ep (U test, p=0.0264), max SSWE (U test, p=0.0000), snow-off date (U test, p=0.0000) and mean annual temperature (TMA: U test, p=0.0000) showed a significant difference between the groups.
As not only the maximum SSWE and TMA show a strong correlation with Sr, but also the snow-off date (Fig. 4), it is possible that the threshold is related to the phase difference between water input and demand in the catchments. Therefore, Fig. 9 shows the period with snow cover (colour plot) and the period in which potential evaporation is above zero (white lines) for each catchment. In general, for catchments with a Sr smaller than 115 mm (bottom part of the plot), the snow melt and onset of potential evaporation overlap. On the other hand, for catchments with a Sr larger than 115 mm the snow has already melted at the onset of the potential evaporation measurements. In the first case the phase difference between input and demand is decreased, while in the second case it is increased, thus requiring a larger storage capacity. The phase difference between snow-off and onset of Ep was calculated and included in Fig. 8; it is positively correlated with the majority of the other climate variables. It is therefore likely to show the combined effect of the different climatic influences. This phase difference gives an explanation for the origin of the threshold, but not for the location at 115 mm. A clear reason for the threshold being located at 115 mm could not be found and it might be an artifact of this specific data set.
The presented results show that among the compared characteristics the climate-derived root zone storage capacities are strongest related to climate variables, followed by vegetation characteristics and vegetation types. These results gain better understanding of the influence of the different climate variables on the calculation of Sr in snow-dominated regions. The boreal ecosystem has been referred to as a “green desert” (Betts et al., 2001; Hall, 1999); although ample water is available on the surface, the vegetation is less productive and evaporation rates are generally low, because of either nutrient limitations or adaptation to cool environments. Our results can thus be used to explore the physical meaning and wider application of Sr for land and water management purposes. Below, possible reasons for differences in correlation and for the threshold found are discussed, together with implications of the findings.
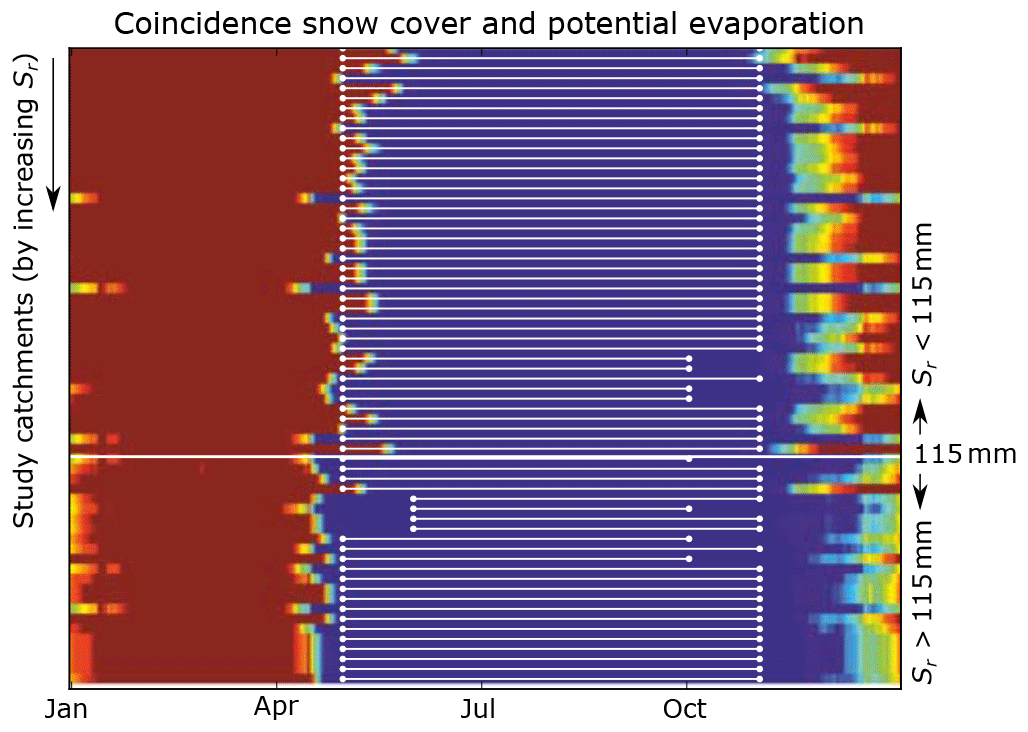
Figure 9Snow cover is presented by the colour plot (red: SSWE>15 mm, blue: SSWE=0). Occurrence of potential evaporation (Ep>0) is presented by white lines; note that the actual amount of Ep is not presented. Presented data are long-term daily averages. Catchments are ordered by increasing Sr values.
4.1 Climate variables
As the root zone storage capacity is derived from climate data, logically a correlation exists between the derived Sr values and various climate variables. The strongest correlations between Sr and the catchment characteristics are found when all three boreal regions are considered together and to a lesser extent when the boreal regions are considered individually; these boreal regions mainly differ in climate characteristics (Fig. 8). Together with the results presented in Fig. 4 this shows that the relation between climate and Sr is stronger than the relations between Sr and other catchment characteristics.
However, it is interesting to see that not all climate variables have the same influence (Fig. 4) on the derived Sr values. More specifically, the phase difference between the snow-off date (water supply) and onset of potential evaporation (water demand) turns out to be very important (Fig. 9). Although the current (non-)coincidence of snow-off and the onset of Ep could partly be attributed to the measurement techniques and locations of both variables, it still shows that the derived Sr values are sensitive to the phase difference between the two. Further, the different analyses show that for the colder regions, the influence of individual climate variables (P∕Ep, TMA, snow-off date) is more important. This larger influence of climate variables in colder regions can also influence or partly cause the observed threshold behaviour.
4.2 Vegetation characteristics
Figure 8 shows that the vegetation characteristics are not strongly correlated with the majority of the climate variables, which makes it interesting to compare them with Sr. However, the result of this comparison did not show patterns as strong as expected. One of the reasons for this could be the heterogeneity in vegetation types in the study catchments. Another reason could be that the Sr parameter does not have a very strong physical meaning in boreal regions.
Despite the conceptual character of the climate-derived root zone storage capacity, it was expected that it is positively correlated with root density or root biomass; this study is the first to show such a connection exists for spruce and deciduous trees (Fig. 5). However, for pine a negative correlation was observed, which means that the vegetation is able to create a larger storage capacity with fewer or thinner roots. This can have multiple reasons, among which is the survival strategies of the trees (e.g. methods to access water or water use efficiency), or the combined effect with other catchment characteristics (e.g. a low density of pine trees in these catchments, thus explaining their influence on the overall transpiration and storage in the catchments or the influence of the drained peatlands in which pine trees often occur). In addition, Fig. 5 could also reflect the optimal growing conditions for pine trees: low Sr values coincide with low transpiration demands and thus likely smaller biomass development. On the other hand, for larger Sr values the growing conditions for spruce and deciduous tree become better, thus out-competing the pine trees.
By using a climate-derived root zone storage capacity, it is assumed that the Sr developed by the vegetation is in balance with the transpiration demands. One does not necessarily cause the other, but a larger Sr coincides with higher or more variable transpiration demands. When the transpiration demands in boreal areas are higher, it is likely that vegetation has higher potential to develop as well (ie. more leaf cover, larger trees). However, if soil conditions are such that root development is slowed down, but vegetation still survives, it is likely that transpiration demand and thus derived Sr values are low. Figure 6 indeed shows a positive correlation between Sr and leaf cover or tree height.
4.3 Vegetation types
Although not as strong as for the climate variables and the vegetation characteristics, relations between Sr and vegetation types were found as well, especially for agriculture and pristine peatlands. A lack of strong patterns could, similarly to for the vegetation characteristics, for example be caused by the heterogeneity of the study catchments. The combined effect of different variables is another option that should especially be considered when looking at vegetation types. For example, when looking at the interaction between transpiration demand and vegetation type, does the existence of agriculture or deciduous forest increase transpiration rates and thus derived Sr values, or are these vegetation types more likely to occur in areas with larger differences between water supply and demand? And linked to this, how large is the influence of the return period to which the vegetation adjusts? Agriculture is likely to adjust to a shorter return period than forest. Or what is the role of soil? The method used assumes that soils are not important for the derived Sr, but they probably influence which vegetation will develop, which again influences the transpiration demands. Or how do the development of vegetation type and climate exactly coincide? Peatland in particular is shown to be strongly correlated to climate (Fig. 8), but to smaller extents agriculture and deciduous forest are as well. To answer these questions, more detailed analysis of specific catchments would be required.
When looking at pristine peatlands in particular, it can be seen that they have a strong relation with the derived root zone storage capacity. In the case of more than 20 % pristine peatland cover, Sr does not exceed the earlier found threshold of 115 mm. This may indicate that the “below-threshold” conditions are ideal for the development of peatlands, which makes sense as peatlands develop in areas where precipitation exceeds evaporation and thus moisture conditions favour the creation of peatland vegetation. In the developed peatlands the available space for root development is generally small, due to high groundwater tables and fully saturated soil moisture conditions (Menberu et al., 2016). However, this is not explicitly accounted for in the Sr calculations. This indicates that the pristine peatlands do not have a high transpiration demand and that evaporation is not excessively increased by high groundwater tables. Typically evaporation from peat surfaces is small, especially if the water levels are below the growing sphagnum vegetation (Wu et al., 2010). Catchments where peatland is drained for forestry show another pattern: the correlation with Sr is lower, but in particular the threshold seems to be weaker. The variation between the two groups for the threshold analysis is larger for pristine peatlands than for drained ones (Mann–Whitney U test, p=0.0008 and p=0.0135 respectively). An effect could be expected since the motivation for artificial drainage is to create suitable soil moisture conditions for trees and increase forest growth (Sarkkola et al., 2013a). Peatland drainage has shown to have many effects on hydrological processes (ie. low flows, peak flows), which could partly be explained by the change in Sr.
Overall, the data used show a variable relation between Sr values and both vegetation characteristics and vegetation types in boreal landscapes. This is especially interesting as forestry actions together with shifting vegetation regions are moving towards the north (Hasper et al., 2016), which may thus result in different outcomes for root zone storage properties. Therefore it would make sense for future catchment-scale studies, focusing on the effects of changes in land use or climate on hydrological patterns, to take into account possible changes in Sr as well.
4.4 Usefulness of a climate-derived Sr
As shown in earlier studies, climate-derived root zone storage capacities can be very useful in a modelling study. However, this study compared derived Sr values with a set of catchment characteristics, which is a first step in exploring the wider application of Sr. The comparison with vegetation characteristics and types showed that the climate-derived Sr indeed also has some physical meaning in the study catchments. In addition, the comparison with climate variables showed that the (non-)coincidences of snow melt and the onset of potential evaporation has a large influence on the derived Sr values. Combining these two findings, it can be expected that if the timing of either of them changes, the hydrological behaviour of boreal catchments can change remarkably. This finding for example may indicate that earlier snow melt decreases soil moisture during summer, resulting in larger root zone storage capacities. A possible increase in root zone storage capacity with increasing annual temperature and declining snow cover may also cause substantial changes to biogeochemical cycles (Wrona et al., 2016) and generated stream flows (Bring et al., 2016). It would therefore be interesting to extend this research to other boreal and temperate regions. In such a study the question of whether the found threshold occurs in many areas with energy-constrained evaporation or whether it is mainly linked to the (non-)existence of snow cover can be investigated.
With this in mind, a climate-derived Sr is especially valuable, as it will probably change when the climatic conditions (ie. amount of precipitation, snow-off date) or vegetation properties (ie. transpiration pattern) change. Before Sr values can be used in this way, more analyses should be carried out to investigate how (quickly) new equilibria are established and whether vegetation does change their survival mechanisms. However, when extending this line of thought, a climate-derived Sr can possibly be used to assess the hydrological effect of future changes in climatic and land cover conditions and the consequences for biogeochemical processes. This is essential in a global perspective, but especially in boreal regions which are facing drastic changes in the near future resulting from the joint pressures of intensified land use and climate change.
This paper showed that the climate-based method to derive root zone storage capacities, with a snow component included, can be well applied to a range of boreal catchments. Subsequently, this paper investigated the relations between a set of catchment and vegetation characteristics and the derived root zone storage capacities to further understand the possibilities and physical meaning of this parameter. A climate-derived Sr was compared with climate variables, vegetation characteristics and vegetation types. A comparison between Sr and the vegetation characteristics showed in general a positive correlation between Sr and leaf cover, tree length and root biomass. This comparison had not been carried out before and further supports the plausibility of the climate-based method. Another important finding is that the (non-)coincidence of the snow-off and the onset of potential evaporation has a particularly large effect on the derived Sr. In the studied regions, where evaporation is energy-constrained, these two are the main variables determining the supply and demand of water. Further, it was observed that catchments with a large pristine peatland cover have small Sr values and that for colder regions the influence of individual climate variables on Sr is larger. A climate-derived Sr enables reflecting (changes in) climatic and vegetation conditions in a hydrological parameter. Therefore it gives additional information about the hydrological characteristics of an area and it could be beneficial to assess the effects of changing conditions.
The data used in the study originate from various open-access databases. Data for precipitation (URN: nbn:fi:csc-kata00001000000000000675), temperature (URN: nbn:fi:csc-kata00001000000000000663) and land use (URN: urn-nbn-fi-csc-kata00001000000000000694) originate from the Paituli database (https://avaa.tdata.fi/web/paituli/latauspalvelu, last access: 10 December 2018). Data for discharge, snow water equivalent and potential evaporation originate from the Finnish Environment Institute (http://metatieto.ymparisto.fi:8080/geoportal/catalog/search/resource/details.page?uuid=\%7B86FC3188-6796-4C79-AC58-8DBC7B568827\%7D, last access: 10 December 2018). Data for root biomass, leaf cover and tree height (all data from 2013) originate from the Luke database (http://kartta.luke.fi/opendata/, last access: 10 December 2018). Data for lithology and geology originate from the Hakku database (http://tupa.gtk.fi/paikkatieto/meta/surface_geology_of_finland_1m_onegeology_europe.html, last access: 10 December 2018).
The supplement related to this article is available online at: https://doi.org/10.5194/hess-23-125-2019-supplement.
Analyses were carried out by all authors. The paper was written by TdBE with contributions and review of LJM and HM.
The authors declare that they have no conflict of interest.
We would like to thank Maik Renner and two anonymous reviewers for their
valuable comments: these really helped us to improve the
paper.
Edited by: Chris DeBeer
Reviewed by: Maik Renner and two anonymous referees
Ahti, T., Hämet-Ahti, L., and Jalas, J.: Vegetation zones and their sections in northwestern Europe, Ann. Bot. Fenn., 5, 169–211, 1968. a
Betts, A. K., Ball, J. H., and McCaughey, J. H.: Near-surface climate in the boreal forest, J. Geophys. Res.-Atmos., 106, 33529–33541, https://doi.org/10.1029/2001JD900047, 2001. a
Bring, A., Fedorova, I., Dibike, Y., Hinzman, L., Mård, J., Mernild, S. H., Prowse, T., Semenova, O., Stuefer, S. L., and Woo, M.-K.: Arctic terrestrial hydrology: A synthesis of processes, regional effects, and research challenges, J. Geophys. Res.-Biogeo., 121, 621–649, https://doi.org/10.1002/2015JG003131, 2016. a, b
Carey, S. K., Tetzlaff, D., Seibert, J., Soulsby, C., Buttle, J., Laudon, H., McDonnell, J., McGuire, K., Caissie, D., Shanley, J., Kennedy, M., Devito, K., and Pomeroy, J. W.: Inter-comparison of hydro-climatic regimes across northern catchments: synchronicity, resistance and resilience, Hydrol. Process., 24, 3591–3602, https://doi.org/10.1002/hyp.7880, 2010. a
Christina, M., Nouvellon, Y., Laclau, J.-P., Stape, J. L., Bouillet, J.-P., Lambais, G. R., and le Maire, G.: Importance of deep water uptake in tropical eucalypt forest, Funct. Ecol., 31, 509–519, https://doi.org/10.1111/1365-2435.12727, 2017. a
de Boer-Euser, T., McMillan, H. K., Hrachowitz, M., Winsemius, H. C., and Savenije, H. H. G.: Influence of soil and climate on root zone storage capacity, Water Resour. Res., 52, 2009–2024, https://doi.org/10.1002/2015WR018115, 2016. a, b, c, d
Gao, H., Hrachowitz, M., Schymanski, S. J., Fenicia, F., Sriwongsitanon, N., and Savenije, H. H. G.: Climate controls how ecosystems size the root zone storage capacity at catchment scale: Root zone storage capacity in catchments, Geophys. Res. Lett., 41, 7916–7923, https://doi.org/10.1002/2014GL061668, 2014. a, b, c, d
Gentine, P., D'Odorico, P., Lintner, B. R., Sivandran, G., and Salvucci, G.: Interdependence of climate, soil, and vegetation as constrained by the Budyko curve, Geophys. Res. Lett., 39, L19404, https://doi.org/10.1029/2012GL053492, 2012. a
Gimbel, K. F., Puhlmann, H., and Weiler, M.: Does drought alter hydrological functions in forest soils?, Hydrol. Earth Syst. Sci., 20, 1301–1317, https://doi.org/10.5194/hess-20-1301-2016, 2016. a
Golembiewski, B., Sick, N., and Bröring, S.: The emerging research landscape on bioeconomy: What has been done so far and what is essential from a technology and innovation management perspective?, Innov. Food. Sci. Emerg., 29, 308–317, https://doi.org/10.1016/j.ifset.2015.03.006, 2015. a
Gumbel, E.: Les valeurs extrêmes des distributions statistiques, Annales de l'I. H. P., 5, 115–158, 1935. a
Hall, F. G.: Introduction to special section: BOREAS in 1999: Experiment and science overview, J. Geophys. Res.-Atmos., 104, 27627–27639, https://doi.org/10.1029/1999JD901026, 1999. a
Hasper, T. B., Wallin, G., Lamba, S., Hall, M., Jaramillo, F., Laudon, H., Linder, S., Medhurst, J. L., Räntfors, M., Sigurdsson, B. D., and Uddling, J.: Water use by Swedish boreal forests in a changing climate, Funct. Ecol., 30, 690–699, https://doi.org/10.1111/1365-2435.12546, 2016. a
Ide, J., Finér, L., Laurén, A., Piirainen, S., and Launiainen, S.: Effects of clear-cutting on annual and seasonal runoff from a boreal forest catchment in eastern Finland, Forest Ecol. Manag., 304, 482–491, https://doi.org/10.1016/j.foreco.2013.05.051, 2013. a
Instanes, A., Kokorev, V., Janowicz, R., Bruland, O., Sand, K., and Prowse, T.: Changes to freshwater systems affecting Arctic infrastructure and natural resources, J. Geophys. Res.-Biogeo., 121, 567–585, https://doi.org/10.1002/2015JG003125, 2016. a
Intergovernmental Panel on Climate Change (Ed.): Climate Change 2013 – The Physical Science Basis: Working Group I Contribution to the Fifth Assessment Report of the Intergovernmental Panel on Climate Change, Cambridge University Press, Cambridge, https://doi.org/10.1017/CBO9781107415324, 2014. a
Jackson, D. A.: Stopping Rules in Principal Components Analysis: A Comparison of Heuristical and Statistical Approaches, Ecology, 74, 2204–2214, https://doi.org/10.2307/1939574, 1993. a
Jaramillo, F., Cory, N., Arheimer, B., Laudon, H., van der Velde, Y., Hasper, T. B., Teutschbein, C., and Uddling, J.: Dominant effect of increasing forest biomass on evapotranspiration: interpretations of movement in Budyko space, Hydrol. Earth Syst. Sci., 22, 567–580, https://doi.org/10.5194/hess-22-567-2018, 2018. a
Kleidon, A. and Heimann, M.: A method of determining rooting depth from a terrestrial biosphere model and its impacts on the global water and carbon cycle, Glob. Change Biol., 4, 275–286, https://doi.org/10.1046/j.1365-2486.1998.00152.x, 1998. a
Kortelainen, P., Mattsson, T., Finér, L., Ahtiainen, M., Saukkonen, S., and Sallantaus, T.: Controls on the export of C, N, P and Fe from undisturbed boreal catchments, Finland, Aquat. Sci., 68, 453–468, https://doi.org/10.1007/s00027-006-0833-6, 2006. a
Laudon, H., Sponseller, R., Lucas, R., Futter, M., Egnell, G., Bishop, K., Ågren, A., Ring, E., and Högberg, P.: Consequences of More Intensive Forestry for the Sustainable Management of Forest Soils and Waters, Forests, 2, 243–260, https://doi.org/10.3390/f2010243, 2011. a
Laudon, H., Spence, C., Buttle, J., Carey, S. K., McDonnell, J. J., McNamara, J. P., Soulsby, C., and Tetzlaff, D.: Save northern high-latitude catchments, Nat. Geosci., 10, 324–325, https://doi.org/10.1038/ngeo2947, 2017. a
Mäkisara, K., Katila, M., Peräsaari, J., and Tomppo, E.: The Multi-Source National Forest Inventory of Finland – methods and results 2013, Tech. Rep. 10/2016, available at: http://jukuri.luke.fi/handle/10024/532147 (last access: 17 November 2018), 2016. a
Mannerkoski, H., Finér, L., Piirainen, S., and Starr, M.: Effect of clear-cutting and site preparation on the level and quality of groundwater in some headwater catchments in eastern Finland, Forest Ecol. Manag., 220, 107–117, https://doi.org/10.1016/j.foreco.2005.08.008, 2005. a
Menberu, M. W., Tahvanainen, T., Marttila, H., Irannezhad, M., Ronkanen, A.-K., Penttinen, J., and Kløve, B.: Water-table-dependent hydrological changes following peatland forestry drainage and restoration: Analysis of restoration success, Water Resour. Res., 52, 3742–3760, https://doi.org/10.1002/2015WR018578, 2016. a
Nieminen, M., Palviainen, M., Sarkkola, S., Laurén, A., Marttila, H., and Finér, L.: A synthesis of the impacts of ditch network maintenance on the quantity and quality of runoff from drained boreal peatland forests, Ambio, 47, 523–534, https://doi.org/10.1007/s13280-017-0966-y, 2017. a, b
Nijzink, R., Hutton, C., Pechlivanidis, I., Capell, R., Arheimer, B., Freer, J., Han, D., Wagener, T., McGuire, K., Savenije, H., and Hrachowitz, M.: The evolution of root-zone moisture capacities after deforestation: a step towards hydrological predictions under change?, Hydrol. Earth Syst. Sci., 20, 4775–4799, https://doi.org/10.5194/hess-20-4775-2016, 2016. a, b
Prowse, T., Bring, A., Mård, J., Carmack, E., Holland, M., Instanes, A., Vihma, T., and Wrona, F. J.: Arctic Freshwater Synthesis: Summary of key emerging issues: Arctic Freshwater Synthesis: Summary, J. Geophys. Res.-Biogeo., 120, 1887–1893, https://doi.org/10.1002/2015JG003128, 2015. a
Saft, M., Western, A. W., Zhang, L., Peel, M. C., and Potter, N. J.: The influence of multiyear drought on the annual rainfall-runoff relationship: An Australian perspective, Water Resour. Res., 51, 2444–2463, https://doi.org/10.1002/2014WR015348, 2015. a
Sarkkola, S., Nieminen, M., Koivusalo, H., Laurén, A., Kortelainen, P., Mattsson, T., Palviainen, M., Piirainen, S., Starr, M., and Finér, L.: Trends in concentrations and export of nitrogen in boreal forest streams, Boreal Environ. Res., 17, 85–101, 2012. a
Sarkkola, S., Nieminen, M., Koivusalo, H., Laurén, A., Ahti, E., Launiainen, S., Nikinmaa, E., Marttila, H., Laine, J., and Hökkä, H.: Domination of growing-season evapotranspiration over runoff makes ditch network maintenance in mature peatland forests questionable, Mires and peat, 11, 2, 2013a. a
Sarkkola, S., Nieminen, M., Koivusalo, H., Laurén, A., Kortelainen, P., Mattsson, T., Palviainen, M., Piirainen, S., Starr, M., and Finér, L.: Iron concentrations are increasing in surface waters from forested headwater catchments in eastern Finland, Sci. Total Environ., 463–464, 683–689, https://doi.org/10.1016/j.scitotenv.2013.06.072, 2013b. a
Seuna, P. and Linjama, J.: Water balances of the northern catchments of Finland, in: Proceedings of Northern Research Basins Water Balance workshop, Victoria, Canada, IAHS Publ., 2004. a
Shahzad, Z. and Amtmann, A.: Food for thought: how nutrients regulate root system architecture, Curr. Opin. Plant Biol., 39, 80–87, https://doi.org/10.1016/j.pbi.2017.06.008, 2017. a
Soylu, M. E., Kucharik, C. J., and Loheide, S. P.: Influence of groundwater on plant water use and productivity: Development of an integrated ecosystem – Variably saturated soil water flow model, Agr. Forest Meteorol., 189–190, 198–210, https://doi.org/10.1016/j.agrformet.2014.01.019, 2014. a
Tetzlaff, D., Soulsby, C., Buttle, J., Capell, R., Carey, S. K., Laudon, H., McDonnell, J., McGuire, K., Seibert, J., and Shanley, J.: Catchments on the cusp? Structural and functional change in northern ecohydrology, Hydrol. Process., 27, 766–774, https://doi.org/10.1002/hyp.9700, 2013. a
Troch, P. A., Martinez, G. F., Pauwels, V. R. N., Durcik, M., Sivapalan, M., Harman, C., Brooks, P. D., Gupta, H., and Huxman, T.: Climate and vegetation water use efficiency at catchment scales, Hydrol. Process., 23, 2409–2414, https://doi.org/10.1002/hyp.7358, 2009. a
van der Velde, Y., Vercauteren, N., Jaramillo, F., Dekker, S. C., Destouni, G., and Lyon, S. W.: Exploring hydroclimatic change disparity via the Budyko framework, Hydrol. Process., 28, 4110–4118, https://doi.org/10.1002/hyp.9949, 2013. a
Waddington, J. M., Morris, P. J., Kettridge, N., Granath, G., Thompson, D. K., and Moore, P. A.: Hydrological feedbacks in northern peatlands, Ecohydrology, 8, 113–127, https://doi.org/10.1002/eco.1493, 2015. a
Wang-Erlandsson, L., Bastiaanssen, W. G. M., Gao, H., Jägermeyr, J., Senay, G. B., van Dijk, A. I. J. M., Guerschman, J. P., Keys, P. W., Gordon, L. J., and Savenije, H. H. G.: Global root zone storage capacity from satellite-based evaporation, Hydrol. Earth Syst. Sci., 20, 1459–1481, https://doi.org/10.5194/hess-20-1459-2016, 2016. a, b, c
Wrona, F. J., Johansson, M., Culp, J. M., Jenkins, A., Mård, J., Myers-Smith, I. H., Prowse, T. D., Vincent, W. F., and Wookey, P. A.: Transitions in Arctic ecosystems: Ecological implications of a changing hydrological regime, J. Geophys. Res.-Biogeo., 121, 650–674, https://doi.org/10.1002/2015JG003133, 2016. a
Wu, J., Kutzbach, L., Jager, D., Wille, C., and Wilmking, M.: Evapotranspiration dynamics in a boreal peatland and its impact on the water and energy balance, J. Geophys. Res., 115, G04038, https://doi.org/10.1029/2009JG001075, 2010. a
Zhang, L., Dawes, W. R., and Walker, G. R.: Response of mean annual evapotranspiration to vegetation changes at catchment scale, Water Resour. Res., 37, 701–708, https://doi.org/10.1029/2000WR900325, 2001. a
Zhao, J., Xu, Z., and Singh, V. P.: Estimation of root zone storage capacity at the catchment scale using improved Mass Curve Technique, J. Hydrol., 540, 959–972, https://doi.org/10.1016/j.jhydrol.2016.07.013, 2016. a