the Creative Commons Attribution 4.0 License.
the Creative Commons Attribution 4.0 License.
 | 11 Mar 2019
Sources and fate of nitrate in groundwater at agricultural operations overlying glacial sediments
Mike Iwanyshyn
Jacqueline Kohn
M. Jim Hendry
Leaching of nitrate () from animal waste or fertilisers at agricultural operations can result in contamination of groundwater, lakes, and streams. Understanding the sources and fate of nitrate in groundwater systems in glacial sediments, which underlie many agricultural operations, is critical for managing impacts of human food production on the environment. Elevated concentrations in groundwater can be naturally attenuated through mixing or denitrification. Here we use isotopic enrichment of the stable isotope values of to quantify the amount of denitrification in groundwater at two confined feeding operations overlying glacial sediments in Alberta, Canada. Uncertainty in and values of the source and denitrification enrichment factors are accounted for using a Monte Carlo approach. When denitrification could be quantified, we used these values to constrain a mixing model based on and Cl− concentrations. Using this novel approach we were able to reconstruct the initial NO3−N concentration and ratio at the point of entry to the groundwater system. Manure filtrate had total nitrogen (TN) of up to 1820 mg L−1, which was predominantly organic N and NH3. Groundwater had up to 85 mg L−1 TN, which was predominantly . The addition of to the local groundwater system from temporary manure piles and pens equalled or exceeded additions from earthen manure storages at these sites. On-farm management of manure waste should therefore increasingly focus on limiting manure piles in direct contact with the soil and encourage storage in lined lagoons. Nitrate attenuation at both sites is attributed to a spatially variable combination of mixing and denitrification, but is dominated by denitrification. Where identified, denitrification reduced agriculturally derived concentrations by at least half and, in some wells, completely. Infiltration to groundwater systems in glacial sediments where can be naturally attenuated is likely preferable to off-farm export via runoff or drainage networks, especially if local groundwater is not used for potable water supply.
- Article
(4273 KB) -
Supplement
(897 KB) - BibTeX
- EndNote


The contamination of soil and groundwater with nitrate from agricultural operations is a global water quality issue that has been extensively documented (Power and Schepers, 1989; Spalding and Exner, 1993; Rodvang and Simpkins, 2001; Galloway et al., 2008; Zirkle et al., 2016; Arauzo, 2017; Ascott et al., 2017). Leaching of nitrate () from animal waste or fertilisers can result in groundwater concentrations that exceed drinking water guidelines and pose human health risks (Fan and Steinberg, 1996; Gulis et al., 2002; Yang et al., 2007). The discharge of high- groundwater, runoff, or drainage can contaminate streams and lakes, resulting in eutrophication and ecosystem decline (Deutsch et al., 2006; Kaushal et al., 2011). In saturated groundwater systems with low oxygen concentrations, elevated can be naturally attenuated by microbial denitrification (Wassenaar, 1995; Robertson et al., 1996; Smith et al., 1996; Tesoriero et al., 2000; Singleton et al., 2007). Concentrations of will also decrease along groundwater flow paths due to attenuation via dilution by hydrodynamic dispersion (referred to hereafter as mixing). Because of these natural attenuation mechanisms, infiltration to groundwater may be preferable to off-site drainage and runoff of nitrate-rich waters. Many agricultural operations are undertaken on fertile soils associated with glacial sediments (Spalding and Exner, 1993; Ernstsen et al., 2015; Zirkle et al., 2016). Understanding the sources and fate of agriculturally derived nitrate in groundwater systems in glacial sediments is therefore critical for managing impacts of human food production on the environment.
Identification of the sources and fate of at agricultural operations can be challenging because of spatial and temporal variations in sources (e.g. earthen manure storage, temporary manure piles, or fertiliser) and heterogeneity in hydrogeologic systems (Spalding and Exner, 1993; Rodvang et al., 2004; Showers et al., 2008; Kohn et al., 2016). These spatial and temporal variations can result in complex subsurface solute distributions that are difficult to interpret using classical transect studies or numerical groundwater models (Green et al., 2010; Baily et al., 2011).
Groundwater containing significant agriculturally derived also typically has elevated chloride (Cl−) concentrations (Saffigna and Keeney, 1977; Rodvang et al., 2004; Menció et al., 2016). Decreasing (or ) ratios have been used to define denitrification based on the assumption that is reactive while Cl− is non-reactive (conservative), such that denitrification results in a decrease in the ratio (Kimble et al., 1972; Weil et al., 1990; Liu et al., 2006; McCallum et al., 2008). However, ratios can also change in response to mixing of groundwater with different ratios or when groundwater sampling traverses hydraulically disconnected formations (Bourke et al., 2015b). If ratios vary among potential sources and the ratio at the point of entry to the groundwater system can be reconstructed, this information could be used to show that anthropogenic at different locations within an aquifer is derived from the same or different sources.
The stable isotopes of ( and ) provide an alternative approach to characterising the source and fate of in groundwater systems. In agricultural areas, multiple sources of are common and could include precipitation, soil , inorganic fertiliser, manure, and septic waste (Komor and Anderson, 1993; Liu et al., 2006; Pastén-Zapata et al., 2014; Clague et al., 2015; Xu et al., 2015). While source identification is theoretically possible using and (particularly with a dual-isotope approach), in practice this can be difficult due to geologic heterogeneity, overlapping source values, and the complexity of biologically mediated reactions (Aravena et al., 1993; Wassenaar, 1995; Mengis et al., 2001; Choi et al., 2003; Granger et al., 2008; Vavilin and Rytov, 2015; Xu et al., 2015).
attenuation by denitrification in groundwater systems can be identified based on the characteristic enrichment of and . Numerous studies have made qualitative assessments that identified denitrification in groundwater using the stable isotope approach (Böttcher et al., 1990; Wassenaar, 1995; Singleton et al., 2007; Baily et al., 2011; Clague et al., 2015; Xu et al., 2015). Recently published papers have also used stable isotopic values of and water as the basis for mixing models in agricultural settings (Ji et al., 2017; Lentz and Lehersch, 2019). Isotopic fractionation effects can also allow for quantitative assessment of the proportion of substrate that has undergone a given reaction, if enrichment factors and source values are known; as in the case of evaporative loss of water, for example (Dogramaci et al., 2012). To date, there have been very few attempts to quantify denitrification using dual-isotope enrichment, largely due to uncertainty in source values and enrichment factors (Böttcher et al., 1990, Xue et al., 2009).
The only published calculations of the fraction of remaining after denitrification the that we are aware of assumed a constant enrichment factor and the same isotopic source values across the field site (Otero et al., 2009). However, the enrichment factor will vary across a field site in response to reaction rates (Kendall and Aravena, 2000), and isotopic values of even the same type of source (e.g. manure) can vary substantially (Xue et al., 2009).
If the variation in source values and enrichment factors can be characterised from measured data then these uncertainties can be accounted for using a Monte Carlo approach (Joerin et al., 2002; Bourke et al., 2015a; Ji et al., 2017), thereby extending the application of the dual-isotope technique to allow for a robust quantitative assessment of denitrification in agricultural settings.
A synthesised analysis of stable isotopes of with additional ionic tracers can further improve the assessment of attenuation mechanisms and sources of NOin agricultural settings (Showers et al., 2008; Vitòria et al., 2008; Xue et al., 2009; Xu et al., 2015; Ji et al., 2017). We hypothesise that if the amount of denitrification can be quantified based on and , then this estimate of the fraction of NO3−N removed through denitrification can be used to constrain a mixing model based on NO3−N and Cl− concentrations. This novel approach allows for the ratio of at the point of entry to the groundwater system to be reconstructed from measured and Cl− concentrations (see Sect. 2.4). Where the ratio varies between sources, this ratio can then be used to assess the source of the in groundwater (e.g. temporary manure piles or feeding pens). These data can also then be used to estimate the initial concentrations of and Cl− at the point of entry to the groundwater system and quantify attenuation by mixing.
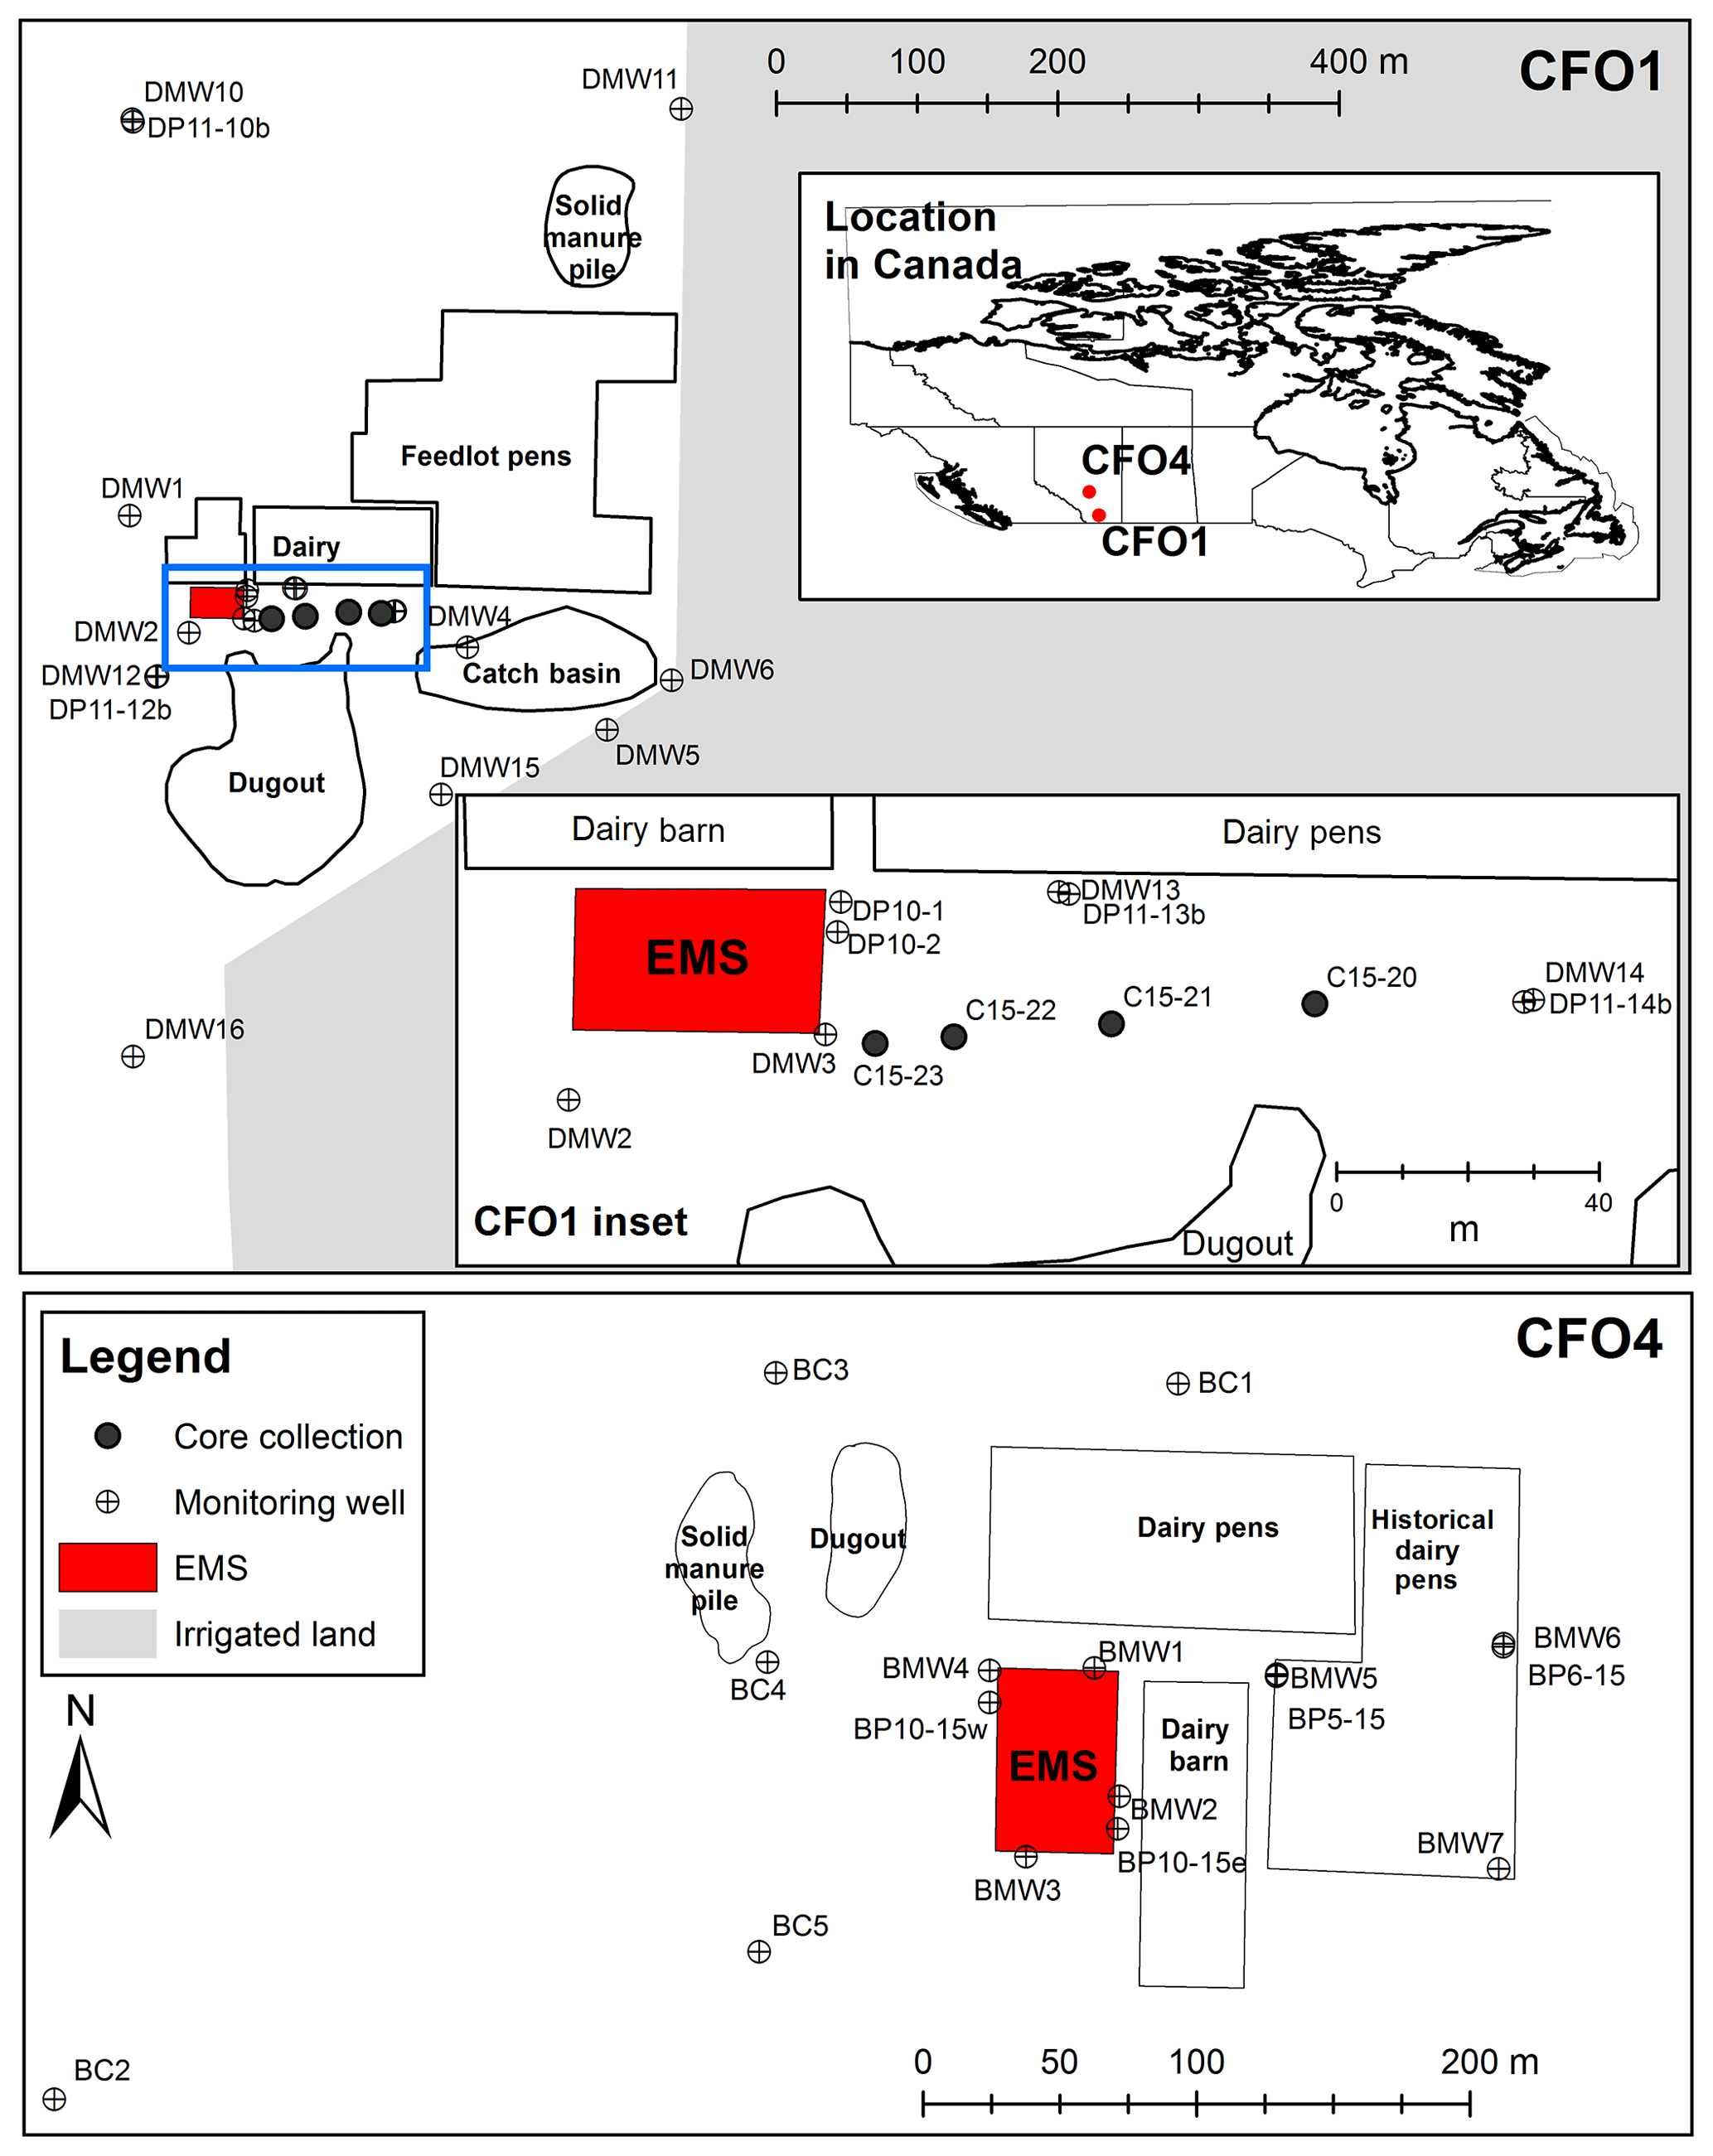
Figure 1Map of study sites CFO1 and CFO4, showing locations of groundwater monitoring wells, core collection, earthen manure storages (EMSs), dairy and feedlot pens, manure piles, and irrigated land. Blue rectangle indicates extent of CFO1 inset.
In this study, we present the application of this approach at two confined feeding operations (CFOs) in Alberta, Canada, with differing lithologies and durations of operation (Fig. 1). Concentrations of Cl− and nitrogen species (N species) and the stable isotopes of were measured in groundwater samples collected from monitoring wells and continuous soil cores, as well as manure filtrate at both sites. These data were interpreted to (1) assess the extent of agriculturally derived in groundwater, (2) identify sources and initial concentrations of at the point of entry to the groundwater system, and (3) assess mixing and denitrification as attenuation mechanisms at these sites.
2.1 Experimental sites
This study was conducted using data from two of the five sites investigated by Alberta Agriculture and Forestry during an assessment of the impacts of livestock manure on groundwater quality (Lorenz et al., 2014). To the best of our knowledge (including discussions with farm operators) fertilisers have not been applied at either of these sites. As such, manure waste from livestock is assumed to be the sole source of agricultural nitrogen (N) and elevated concentrations in groundwater at these sites.
The first study site (CFO1) is located 25 km northeast of Lethbridge, Alberta (Fig. 1). Agricultural operations at this site were initiated with the construction of a dairy in 1928, which has the capacity for 150 dairy cattle. A feedlot for beef cattle was added in 1960s along with an earthen manure storage (EMS) facility for storing liquid dairy manure (approx. 4 m deep) and a catch basin that receives surface water runoff. This feedlot was expanded in the 1980s to the 2000-head capacity it was at the time of this study. There is also a dugout (or slough, a shallow wetland) on-site that receives local runoff and an irrigation drainage canal at the southern boundary of the property.
The second study site (CFO4) is located approximately 30 km north of Red Deer, Alberta, and 300 km north of CFO1. This dairy and associated EMS (approx. 6 m deep) were constructed in 1995 and the facility had 350 head of dairy cattle at the time of the study. Runoff will drain either to the small dugout in the northwest of the site, or the natural drainage features (ephemeral ponds or a creek approx. 1.5 km east).
2.2 Sampling and instrumentation
2.2.1 Groundwater monitoring wells
Groundwater samples were collected from water table wells and piezometers (hereafter both are referred to as wells) installed at both sites (Table 1). At CFO1, groundwater samples were collected from six individual water table wells (DMW1, DMW2, DMW3, DMW4, DMW5, DMW6) and eight sets of nested wells with one well screened at the water table and one well screened 20 m below ground (BG) (DP10-2 and DP10-1, DMW10 and DP11-10b, DMW11 and DP11-11b, DMW12 and DP11-12b, DMW13 and DP11-13b, DMW14 and DP11-14b, DMW15 and DP11-15b, and DMW16 and DP11-16b). Wells DP10-2 and DP10-1 were located directly adjacent to the EMS on the hydraulically down-gradient side. At CFO4, groundwater samples were collected from eight water table wells (BC1, BC2, BC3, BC4, BC5, BMW1, BMW3, BMW7) and four sets of nested wells, with wells screened across the water table and at 15 m BG. Two of these nests were located adjacent to the EMS (BMW2 and BP10-15e, BMW4 and BP10-15w) and two were hydraulically down-gradient of the EMS (BMW5 and BP5-15, BMW6 and BP6-15).
Table 1Details of groundwater monitoring wells and continuous core collection at CFO1 and CFO4 (all screens installed at bottom of the well).

a WTW: water table well, Piezo: piezometer, Core: continuous core. b EMS: earthen manure storage.
Groundwater samples were collected for ion analysis (Cl− and N species) quarterly between April 2010 and August 2015. All water samples were collected using a bailer after purging (1–3 casing volumes) and stored at ≤4 ∘C prior to analysis. Samples for and were collected from wells at CFO1 on 1 January and 1 May 2013. Samples for and at CFO4 were collected on 27 October 2014. Wells were purged prior to sample collection (1–3 casing volumes), and samples filtered into high-density polyethylene (HDPE) bottles in the field and frozen until analysis.
Hydraulic heads in monitoring wells were determined using manual measurements (approximately monthly, 2010–2015). Hydraulic head response tests were conducted on the majority of the wells at the sites to determine hydraulic conductivity (K) of the formation media surrounding the intake zone. These tests were either a slug test (water level decline after water addition) or bail test (water level recovery after water removal) depending on the location of the water level within the well at the time of testing. K was determined from the hydraulic head responses using the method of Hvorslev (1951).
2.2.2 Continuous core
A continuous core was collected at CFO1 immediately adjacent to well DP11-13b on 1 May 2013 (Fig. 1). Additional core samples were collected from 1 to 5 June 2015 along a transect hydraulically down-gradient of the southeastern side of the EMS at CFO1, where hydrochemistry data suggested leakage from the EMS (see Sect. 3). During this 2015 drilling campaign, core samples were collected at four locations (DC15-20, DC15-21, DC15-22, DC15–23) to depths of up to 15 m below surface and distances of up to 100 m from the EMS between wells DMW3 and DP11–14.
Continuous core samples were retrieved using a hollow stem auger (1.5 m core lengths) with 0.3 m sub-samples collected at approximately 1 m intervals ensuring that visually consistent lithology could be sampled. Core samples for Cl− were stored in ZiplocTM bags and kept cool until analysis. Core samples for N-species analysis were stored in Ziploc bags filled with an atmosphere of argon (99.9 % Ar) to minimise oxidation and kept cool until analysis. Subsamples of each core (250–300 g) were placed under 50 MPa pressure in a Carver Auto Series NE mechanical press with a 0.5 µm filter placed at the base of the squeezing chamber, which was placed within an Ar atmosphere to minimise oxidation. A syringe was attached to the base of the apparatus and 15 mL of filtered pore water were collected for analyses within 3.5 to 6.0 h (Hendry et al., 2013).
2.2.3 Liquid manure storages
Samples of liquid manure slurry were collected directly from the EMS at both sites and the catch basin (containing local runoff from the feedlot) at CFO1 using a pipe and plunger apparatus to sample from approximately 0.5 m below the surface. The slurry collected was subsequently filtered (0.45 µm) to separate the liquid and solid components. The water filtered from samples collected from the EMS or catch basin is hereafter referred to as manure filtrate.
2.3 Laboratory analysis
Groundwater samples from wells were analysed by Alberta Agriculture and Forestry (Lethbridge, Alberta). Concentrations of Cl− were determined using potentiometric titration of H2O, with a detection limit of 5.0 mg L−1 and accuracy of 5 % (APHA 4500-Cl−D). Concentrations of NH3 as N (NH3−N), as N (NO3−N), and as N (NO2−N) were measured by air-segmented continuous-flow analysis (APHA 4500-NH3 G, APHA 4500-NO3 F). Total nitrogen (TN) was determined by high temperature catalytic combustion and chemiluminescence detection using a Shimadzu TOC-V with attached TN unit (ASTM D8083-16). Total organic nitrogen (TON) was calculated by subtracting NH3−N, NO3−N, and NO2−N from TN. Bicarbonate () was analysed by titration (APHA 2320 B). Dissolved organic carbon (DOC) was analysed by a combustion infrared method (APHA 5310 B) using a Shimadzu TOC-V system. Manure filtrate was analysed by ALS (Saskatoon, Saskatchewan) using similar methods for Cl− (APHA 4110 B), TN (RMMA A3769 3.3), NO3+NO2 as N (APHA 4500-NO3-F), NH3−N (APHA 4500-NH3 D), (APHA 2320), and DOC (APHA 5310 B).
Pore-water samples squeezed from the continuous core were analysed at the University of Saskatchewan (Saskatoon, Canada) for Cl−, NO3−N, and NO2−N using a Dionex IC25 ion chromatograph (IC) coupled to a Dionex As50 autosampler (EPA Method 300.1, accuracy and precision of 5.0 %) (Hautman and Munch, 1997). Ammonia as N (NH3−N) was measured by Exova laboratories using the automated phenate method (APHA Standard 4500-NH3 G, detection limit of 0.025 mg L−1, accuracy of 2 % of the measured concentration, and a precision of 5 % of the measured concentration).
and in groundwater samples (from wells and pore water from the continuous core) and manure filtrate were measured at the University of Calgary (Calgary, Alberta) using the denitrifier method (Sigman et al., 2001) with an accuracy and precision of 0.3 ‰ for and 0.7 ‰ for . Groundwater samples collected for isotope analysis in January 2013 were also analysed for NO3−N by the University of Calgary (denitrifier technique, Delta + XL).
2.4 Modelling approach
2.4.1 Quantification of denitrification based on and
Nitrate in groundwater that has undergone denitrification is commonly reported as being identified by enrichment of and with a slope of about 0.5 on a cross-plot (Clark and Fritz, 1997). However, published studies of denitrification in groundwater report slopes of up to 0.77 (Mengis et al., 1999; Fukada et al., 2003; Singleton et al., 2007). The relationship between isotopic enrichment of and and the fraction of NO3−N remaining during denitrification can be described by a Rayleigh equation:
where R0 is the initial isotope ratio (relative to the standard) of the ( or ), R is the isotopic ratio when fraction fd of remains, and β is the kinetic fractionation factor (>1) (Böttcher et al., 1990; Clark and Fritz, 1997; Otero et al., 2009; Xue et al., 2009). Kinetic fraction effects are commonly also expressed as the enrichment factor, . In the case of a constant enrichment factor, fd can be calculated from measured (or ), if the initial (δ15N0) is known;
The fraction of NO3−N removed from groundwater through denitrification is then given by (1−fd). The concentration of NO3−N that would have been measured if mixing was the only attenuation mechanism (NO3−Nmix) can also be calculated by dividing the measured concentration by fd.
A subset of 20 samples with isotopic values of indicative of denitrification were identified, and for each of these samples fd (mean and standard deviation) was calculated from Eq. (2) using a Monte Carlo approach with 500 realizations. The distribution of ε values was defined based on measured data. If the initial is known, ε for () can be determined from the slope of the linear regression line on a plot of ln (fd) vs. (Böttcher et al., 1990). If the initial and fd are not known, as is the case here, can be determined from the slope of the regression line on a plot of ln(NO3−N) vs. , which will be the same as on a plot of ln (fd) vs. . In situ variations in temperature and reaction rates may affect the enrichment factor (Kendall and Aravena, 2000) and this was accounted for by allowing for variation in within the Monte Carlo analysis. The enrichment factor for () was calculated by multiplying the by a linear coefficient of proportionality determined for each CFO from the slope of the denitrification trend on an isotope cross-plot (see Sect. 3.2).
For each realisation, initial isotopic values (δ15N0 and δ18O0) were determined by Excel Solver such that the difference between fd calculated from and was minimised (<1 % difference). The ranges of δ15N0 and δ18O0 were limited based on measured data and literature values (see Sect. 3.2). This approach neglects the effect of mixing of groundwater with differing isotopic values and is valid if the concentration of in the source is much greater than background concentrations such that the isotopic composition of is dominated by the agriculturally derived end-member.
2.4.2 Quantification of mixing and initial concentrations of Cl− and NO3−N
A binary mixing model that also accounts for decreasing NO3−N concentrations in response to denitrification was used to quantify attenuation by mixing and estimate the initial concentrations of Cl− and NO3−N. The measured concentration of Cl− was assumed to be a function of two end-members mixing, described by
where Cl is the measured concentration of Cl− in the groundwater sample, Cli is the concentration of Cl− at the initial point of entry of the agriculturally derived to the groundwater system, Clb is the concentration of Cl− in the background ambient groundwater, and fm is the fraction of water in the sample from the source of agriculturally derived Cl− (and ) remaining in the mixture.
The concentration of NO3−N was also assumed to be a function of two end-members mixing but with an additional coefficient, fd (the fraction of NO3−N remaining after denitrification), applied to account for denitrification. The measured NO3−N concentration was thus described by
where NO3−N is the concentration of NO3−N measured in the groundwater sample, NO3−Ni is the concentration of NO3−N in the source of agriculturally derived at the initial point of entry to the groundwater system, and NO3−Nb is the concentration of NO3−N in the background ambient groundwater. This mixing calculation was only conducted on samples for which dominated total-N (NH3−N < 10 % of NO3−N) so that nitrification of NH3 could be neglected.
If Cli is much greater than Clb and NO3−Ni is much greater than NO3−Nb, then fm is insensitive to background concentrations and these terms can be neglected (see Sect. 4.2 for further discussion of this assumption). In this case, Eqs. (3) and (4) reduce to
Solving Eq. (6) for fm and substituting into Eq. (5) yields
Thus, for each groundwater sample, the ratio of at the initial point of entry of the agriculturally derived to the groundwater system can be simply calculated using measured concentrations, and fd estimated from isotope data. This provides a relatively simple method to identify agriculturally derived from different sources (e.g. EMS vs. manure piles) if they have different ratios. Estimated Cli and NO3−Ni are reported as the mid-range value with uncertainty described by the minimum and maximum values. These initial concentrations are at the water table for top-down inputs, or at the saturated point of contact between the EMS and the aquifer for leakage from the EMS. This analysis assumes that a sampled water parcel consists of water with agriculturally derived that entered the aquifer from one source at one point in time and space and has since mixed with natural ambient groundwater. Any produced during nitrification after the anthropogenic source water enters the aquifer is implicitly included in NO3−Ni. The error in was assumed to be dominated by error in the estimated fd, with the measurement error in NO3−N and Cl− considered negligible.
The initial concentrations of the agriculturally derived source (NO3−Ni and Cli) were estimated by simultaneously solving Eqs. (5) and (6) using Excel Solver (GRG nonlinear). The absolute minimum values of NO3−Ni and Cli were defined by measured concentrations (e.g. if Cli=Cl, fm=1). Maximum values of NO3−Ni and Cli were defined based on measured concentrations of NO3−N and Cl− in groundwater and manure filtrate (NO3−N ≤ 150 mg L−1 and Cl− ≤ 1300 mg L−1; see Sect. 3.2). These maximum values of NO3−Ni and Cli correspond to the minimum fm. The value of fd was assumed to be the mean fd estimated from isotopes using Eq. (2), and was required to be within 1 standard deviation of the estimate from Eq. (7).
The resulting estimates of fm are reported as the mid-range, with uncertainty described by the minimum and maximum values. Larger values of fm indicate less mixing (a shorter path for advection–dispersion) and suggest a source close to the well. Smaller values of fm indicate extensive mixing (a longer path for advection–dispersion) and suggest a source further away from the well. The relative contributions of mixing and denitrification to attenuation at each site were evaluated by comparing fm and fd for each sample. This analysis was conducted using isotope values from the samples collected on 1 May 2013 at CFO1, which were combined with the Cl− and NO3−N data from 6 June 2013. At CFO4, results from stable isotopes collected on 27 October 2014 were combined with Cl− and NO3−N data collected on 7 October 2014.
3.1 Site hydrogeology
3.1.1 CFO1
The geology at CFO1 consists of clay and clay–till interspersed with sand layers of varying thickness to the maximum depth of investigation (20 m BG, bedrock not encountered). Hydraulic conductivities (K) calculated from slug tests on wells ranged from to m s−1 (n=10) for sand, to m s−1 (n=2) for clay–till, and to m s−1 (n=8) for clay. Depth to the water table throughout the study site ranged from 0.5 m at DMW14 to 3.8 m at DMW11. Seasonal water table variations were about 0.5 m with no obvious change in the annual average during the 6-year measurement period. Water table elevation was highest at DMW10 and DMW1 on the west side of the site and lowest at DMW11 on the northeast side of the site (see Supplement). Measured heads indicate groundwater flow from the vicinity of the EMS to the northeast and southeast. Mean horizontal hydraulic gradients at the water table ranged from to m m−1. Vertical gradients were predominantly downward in the upper 20 m of the profile (mean gradients ranging from to 0.18 m m−1), with the exception of DMW11 where the vertical gradient was upward (mean gradient m m−1). Using the geometric mean K for the sand ( m s−1) and a lateral head gradient of m m−1 yields a specific discharge (Darcy flux, q) of 2.2 m yr−1. Assuming an effective porosity of 0.3 (Rodvang et al., 1998), the average linear velocity () is 7.4 m yr−1. This suggests that, in the absence of attenuation by mixing or denitrification, agriculturally derived could have been transported through the groundwater system by advection about 400 m since 1960 and 630 m since 1930.
3.1.2 CFO4
The geology at CFO4 consists of about 5 m of clay (with minor till) underlain by sandstone, to the maximum depth investigated (20 m BG). Hydraulic conductivities measured using slug tests on wells were to m s−1 (n=12) for the clay and sandstone (many shallow wells were screened across the clay–till and into the sandstone) and to m s−1 (n=4) for the sandstone. The depth to water table ranged from 1.0 to 3.4 m, increasing from west to east across the study site. Seasonal water table variations were on the order of 1.5 m with water table declines on the order of 0.3 m yr−1. The horizontal hydraulic gradient was consistently from west to east, with a mean gradient at the water table of m m−1 between BC2 and BMW2 and m m−1 between BMW2 and BMW7. Vertical hydraulic gradients were to m m−1 downward. Using the geometric mean K for the site ( m s−1) and a lateral head gradient of m m−1 yields a q of 0.4 m yr−1. Assuming an effective porosity of 0.3 yields a of 1.3 m yr−1. These values suggest that, in the absence of attenuation by mixing or denitrification, anthropogenic could have been transported through the groundwater systems about 10 m by advection between 1995 and the time of sampling.
3.2 Values and evolution of stable isotopes of nitrate
The range of isotopic values of in groundwater was similar at both sites (Fig. 2). At CFO1, ranged from −5.9 to 20.1 ‰ and from −5.2 to 61.0 ‰. At CFO4, ranged from −1.9 to 31.6 ‰ and from −1.3 to 70.5 ‰. The isotopic values of in groundwater are commonly assumed to be derived from a mix of a one-third atmospheric-derived oxygen (+23.5 ‰) and two-thirds water-derived oxygen (Xue et al., 2009). Given the average for both sites (−16 ‰; see Supplement), a one-third atmospheric two-thirds groundwater mix would result in a of −3.7 ‰. Manure filtrate from the EMS at CFO1 had ranging from 0.4 to 5.0 ‰ and ranging from 7.1 to 19.0 ‰. A curve showing the co-evolution of (mixing of atmospheric δ18O with groundwater-derived δ18O) and (Rayleigh distillation, β=1.005) during nitrification is shown in Fig. 2. Isotopic values in DMW3, where direct leakage from the EMS was evident, are consistent with partial nitrification following this trend of isotopic evolution ( of −1.2 ‰ and of 7.8 ‰).
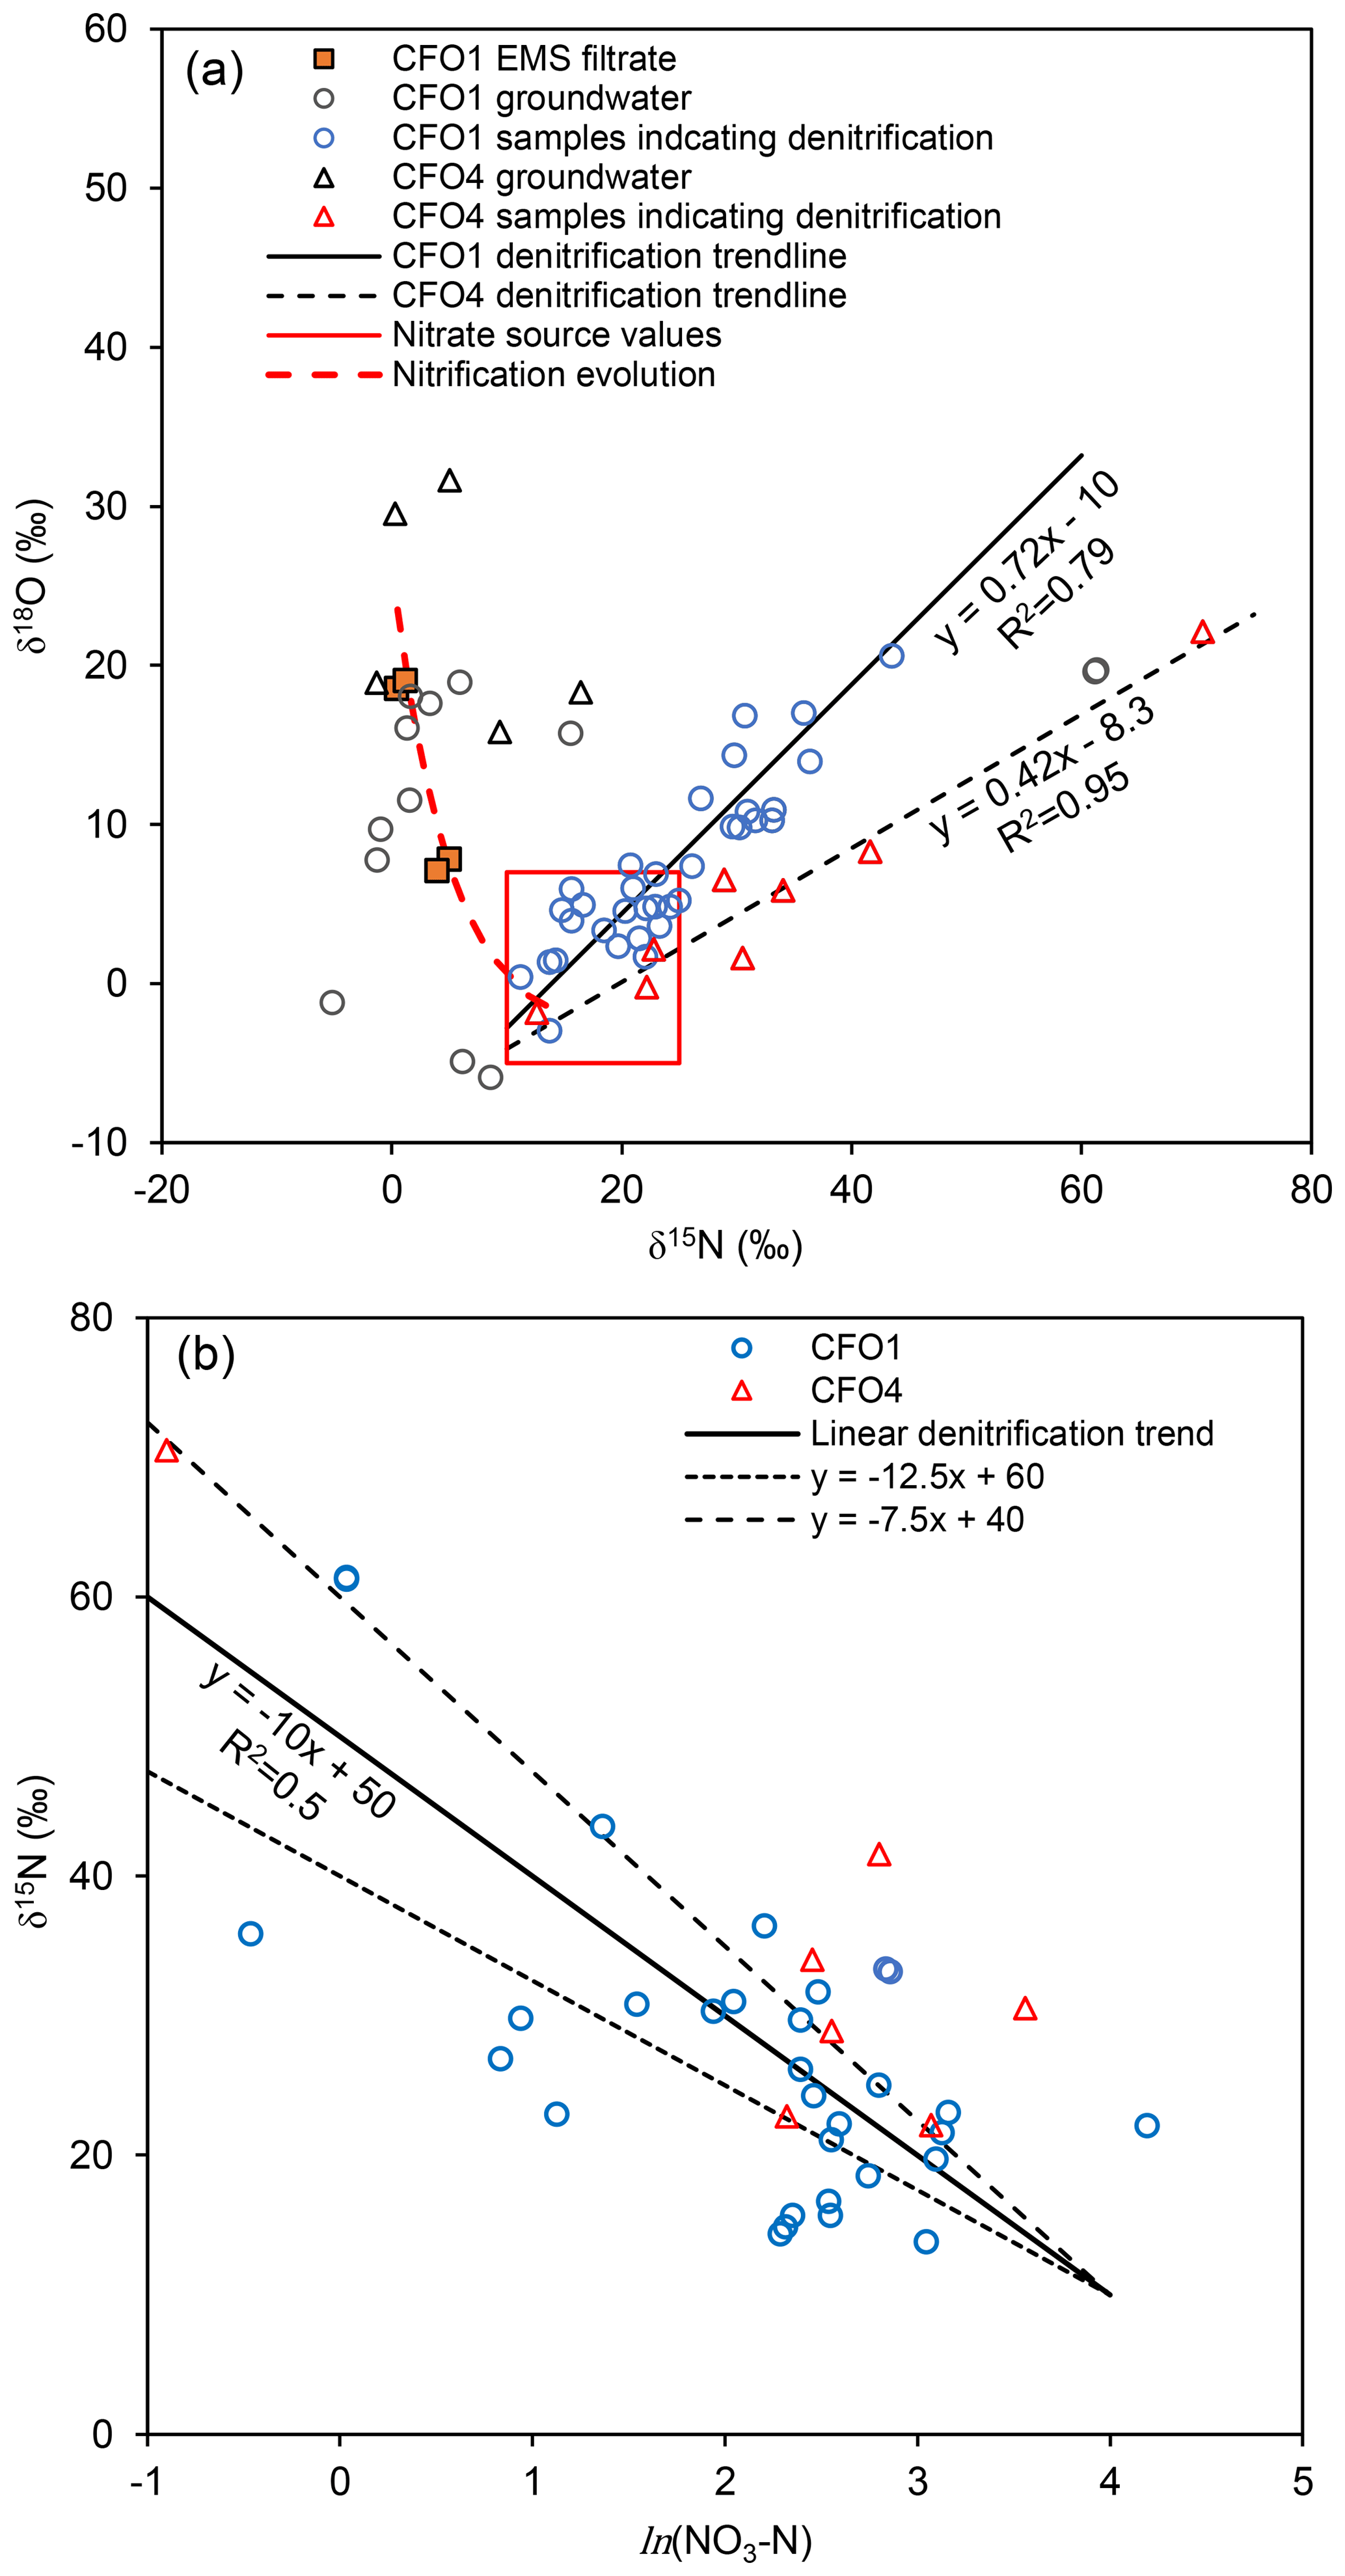
Figure 2(a) Cross-plot of stable isotopes of nitrate at CFO1 and CFO4 showing hypothetical nitrification trend, boundary of manure-sourced values and linear enrichment trends associated with denitrification. (b) Enrichment of during denitrification (only samples within source region and with evidence of denitrification are shown); dashed lines represent ±1 SD of enrichment factor ().
At both sites, co-enrichment of and characteristic of denitrification was evident in some samples (slopes of 0.42 and 0.72 in Fig. 2a). At CFO1, this includes samples from DP10-2, DMW5, DMW11, DMW12, DP11-12b, and DMW13 (and associated core) and some pore water from cores DC15-22 and DC15-23. These samples had NO3−N concentrations of 0.6 to 23.7 mg L−1, ranging from 4.8 to 20.6 ‰, and ranging from 22.9 to 61.3 ‰. At CFO4, samples exhibiting evidence of denitrification were from BMW2, BMW5, BMW6, BMW7, and BC4. These samples had NO3−N concentrations ranging from 0.4 to 35.1 mg L−1, ranging from 1.6 to 22.1 ‰, and ranging from 20.9 to 70.1 ‰. Although the isotopic values of DMW5 suggest enrichment by denitrification, the data plot away from the rest of the CFO1 data and close to the denitrification trend at CFO4 (Fig. 2), suggesting these samples were affected by some other process (possibly mixing or nitrification); therefore, fd was not calculated. Also, well DMW3, which clearly receives leakage from the EMS, did not contain substantial NO3−N and so fd was not calculated.
In the Monte Carlo analysis the potential range of original isotopic values of the source prior to denitrification (δ15N0 and δ18O0) varied from 5 to 27 ‰ for and from −2 to 7 ‰ for based on isotopic values measured during this study (Fig. 2a). These values are consistent with literature values for manure-sourced , which report ranging from 5 to 25 ‰ and ranging from −5 to 5 ‰ (Wassenaar, 1995; Wassenaar et al., 2006; Singleton et al., 2007; McCallum et al., 2008; Baily et al., 2011). was defined by a normal distribution with a mean of −10 ‰ and standard deviation of 2.5 ‰ (Fig. 2b). At CFO1, the coefficient of proportionality between the enrichment factor of and was described by a normal distribution with mean of 0.72 and standard deviation of 0.05. At CFO4, the coefficient of proportionality was also described by a normal distribution with a mean of 0.42 and standard deviation of 0.035 (see Fig. 2a). These enrichment factors are consistent with values from denitrification studies that report ranging from −4.0 to −30.0 ‰ and ranging from −1.9 to −8.9 ‰ (Vogel et al., 1981; Mariotti et al., 1988; Böttcher et al., 1990; Spalding and Parrott, 1994; Mengis et al., 1999; Pauwels et al., 2000; Otero et al., 2009).
3.3 Distribution and sources of agricultural nitrate in groundwater
At both sites TN concentrations in filtrate from the EMS and catch basin were generally an order of magnitude larger than concentrations in groundwater (Table 2). The one exception is well DMW3 at CFO1, which intercepted direct leakage from the EMS (see Sect. 3.3.1 for further discussion of this well). The dominant form of N differed between manure filtrate and groundwater. In the EMS filtrate, N was predominately organic N (TON up to 71 %) or NH3−N (up to 90 %), with NOx−N < 0.1 % of TN. In the catch basin at CFO1 TON was >99 % of TN. In groundwater TN concentrations ranged from <0.25 to 84.6 mg L−1, and this N was predominantly (again, with the exception of DMW3).
Table 2Range of measured concentrations of TN, NH3−N, NOx−N (), and TON at each study site. At CFO1 results from monitoring well DMW3 are presented separately because values in this well differed substantially from all other wells.

a NOx−N of 50 mg L−1 in DMW3 consisted of 12.6 mg L−1 as NO3−N and 37.4 mg L−1 as NO2−N. b NOx−N max in groundwater was measured in core (NO3−N = 66.4 mg L−1, NOx−N = 67.8 mg L−1). c Range across three replicates was measured on 25 August 2011.
3.3.1 CFO1
Agriculturally derived was generally restricted to the upper 20 m (or less) at CFO1 (NO3−N ≤ 0.2 mg L−1 and Cl− ≤ 57 mg L−1 in seven wells screened at 20 m). The one exception was DP11-12b, which had up to 4.1 mg L−1 of NO3−N. The southeast portion of the site also does not appear to have been significantly contaminated by agriculturally derived , with NO3−N concentrations < 1 mg L−1 in five water table wells (DMW4, DMW6, DMW14, DMW15, DMW16). In DMW6, Cl− and TN concentrations were elevated (see Supplement) but NO3−N concentrations were <2 mg L−1. Collectively, these data suggest the catch basin is not a significant source of to the groundwater at this site.
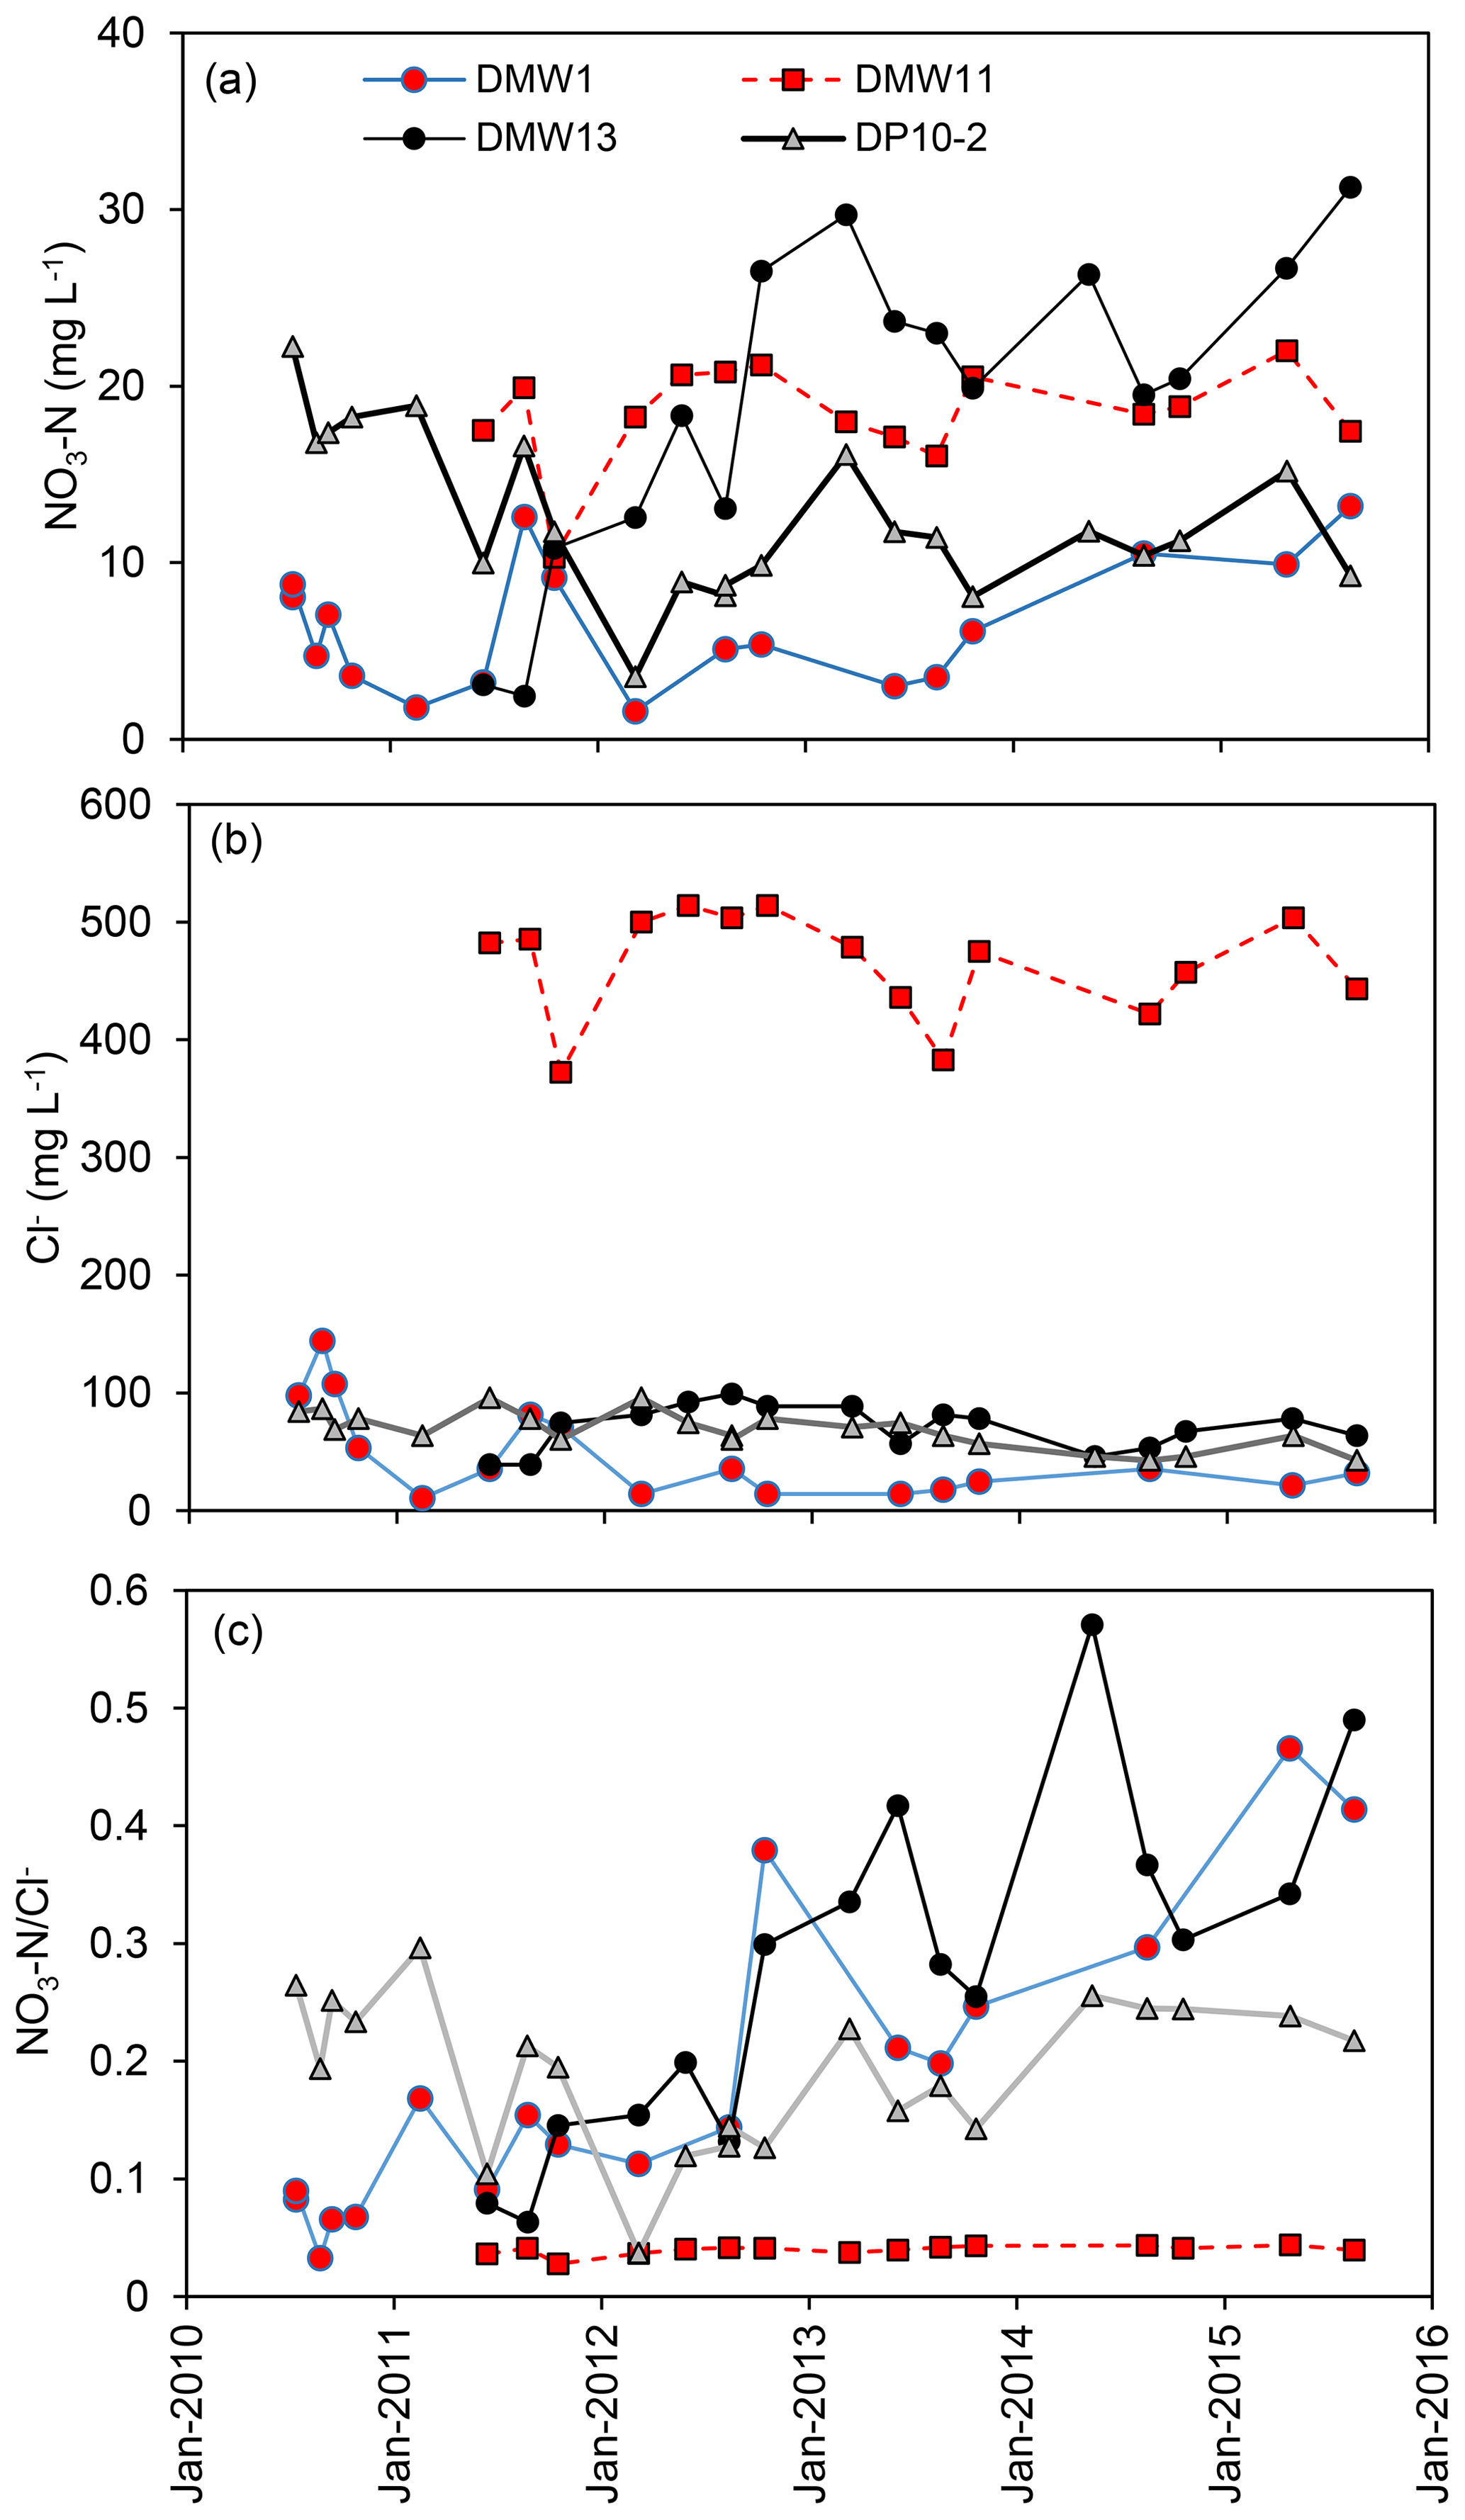
Figure 3Temporal variations in (a) NO3−N, (b) Cl−, and (c) at CFO1. Only wells with NO3−N > 10 mg L−1 are shown.
Leakage of manure slurry from the EMS at CFO1 is clearly indicated by the data from DMW3, which feature the highest concentrations of TN in groundwater (up to 548 mg L−1) and elevated Cl−, , and DOC in concentrations similar to EMS manure filtrate (see Supplement). Nevertheless, NO3−N concentrations in this well were consistently low (1.1±2.7 mg L−1, n=22). The potential for nitrification in the vicinity of this well is indicated by NO2−N production (2.7±8.3 mg L−1, n=22). However, the data demonstrate that only a small proportion of the NH3−N in DMW3 (373.4±79.4 mg L−1, n=22) could have been converted to within the subsurface (NO3−N in groundwater ≤ 66 mg L−1). Further work is required to assess the importance of cation exchange as an attenuation mechanism for direct leakage from the EMS at this site.
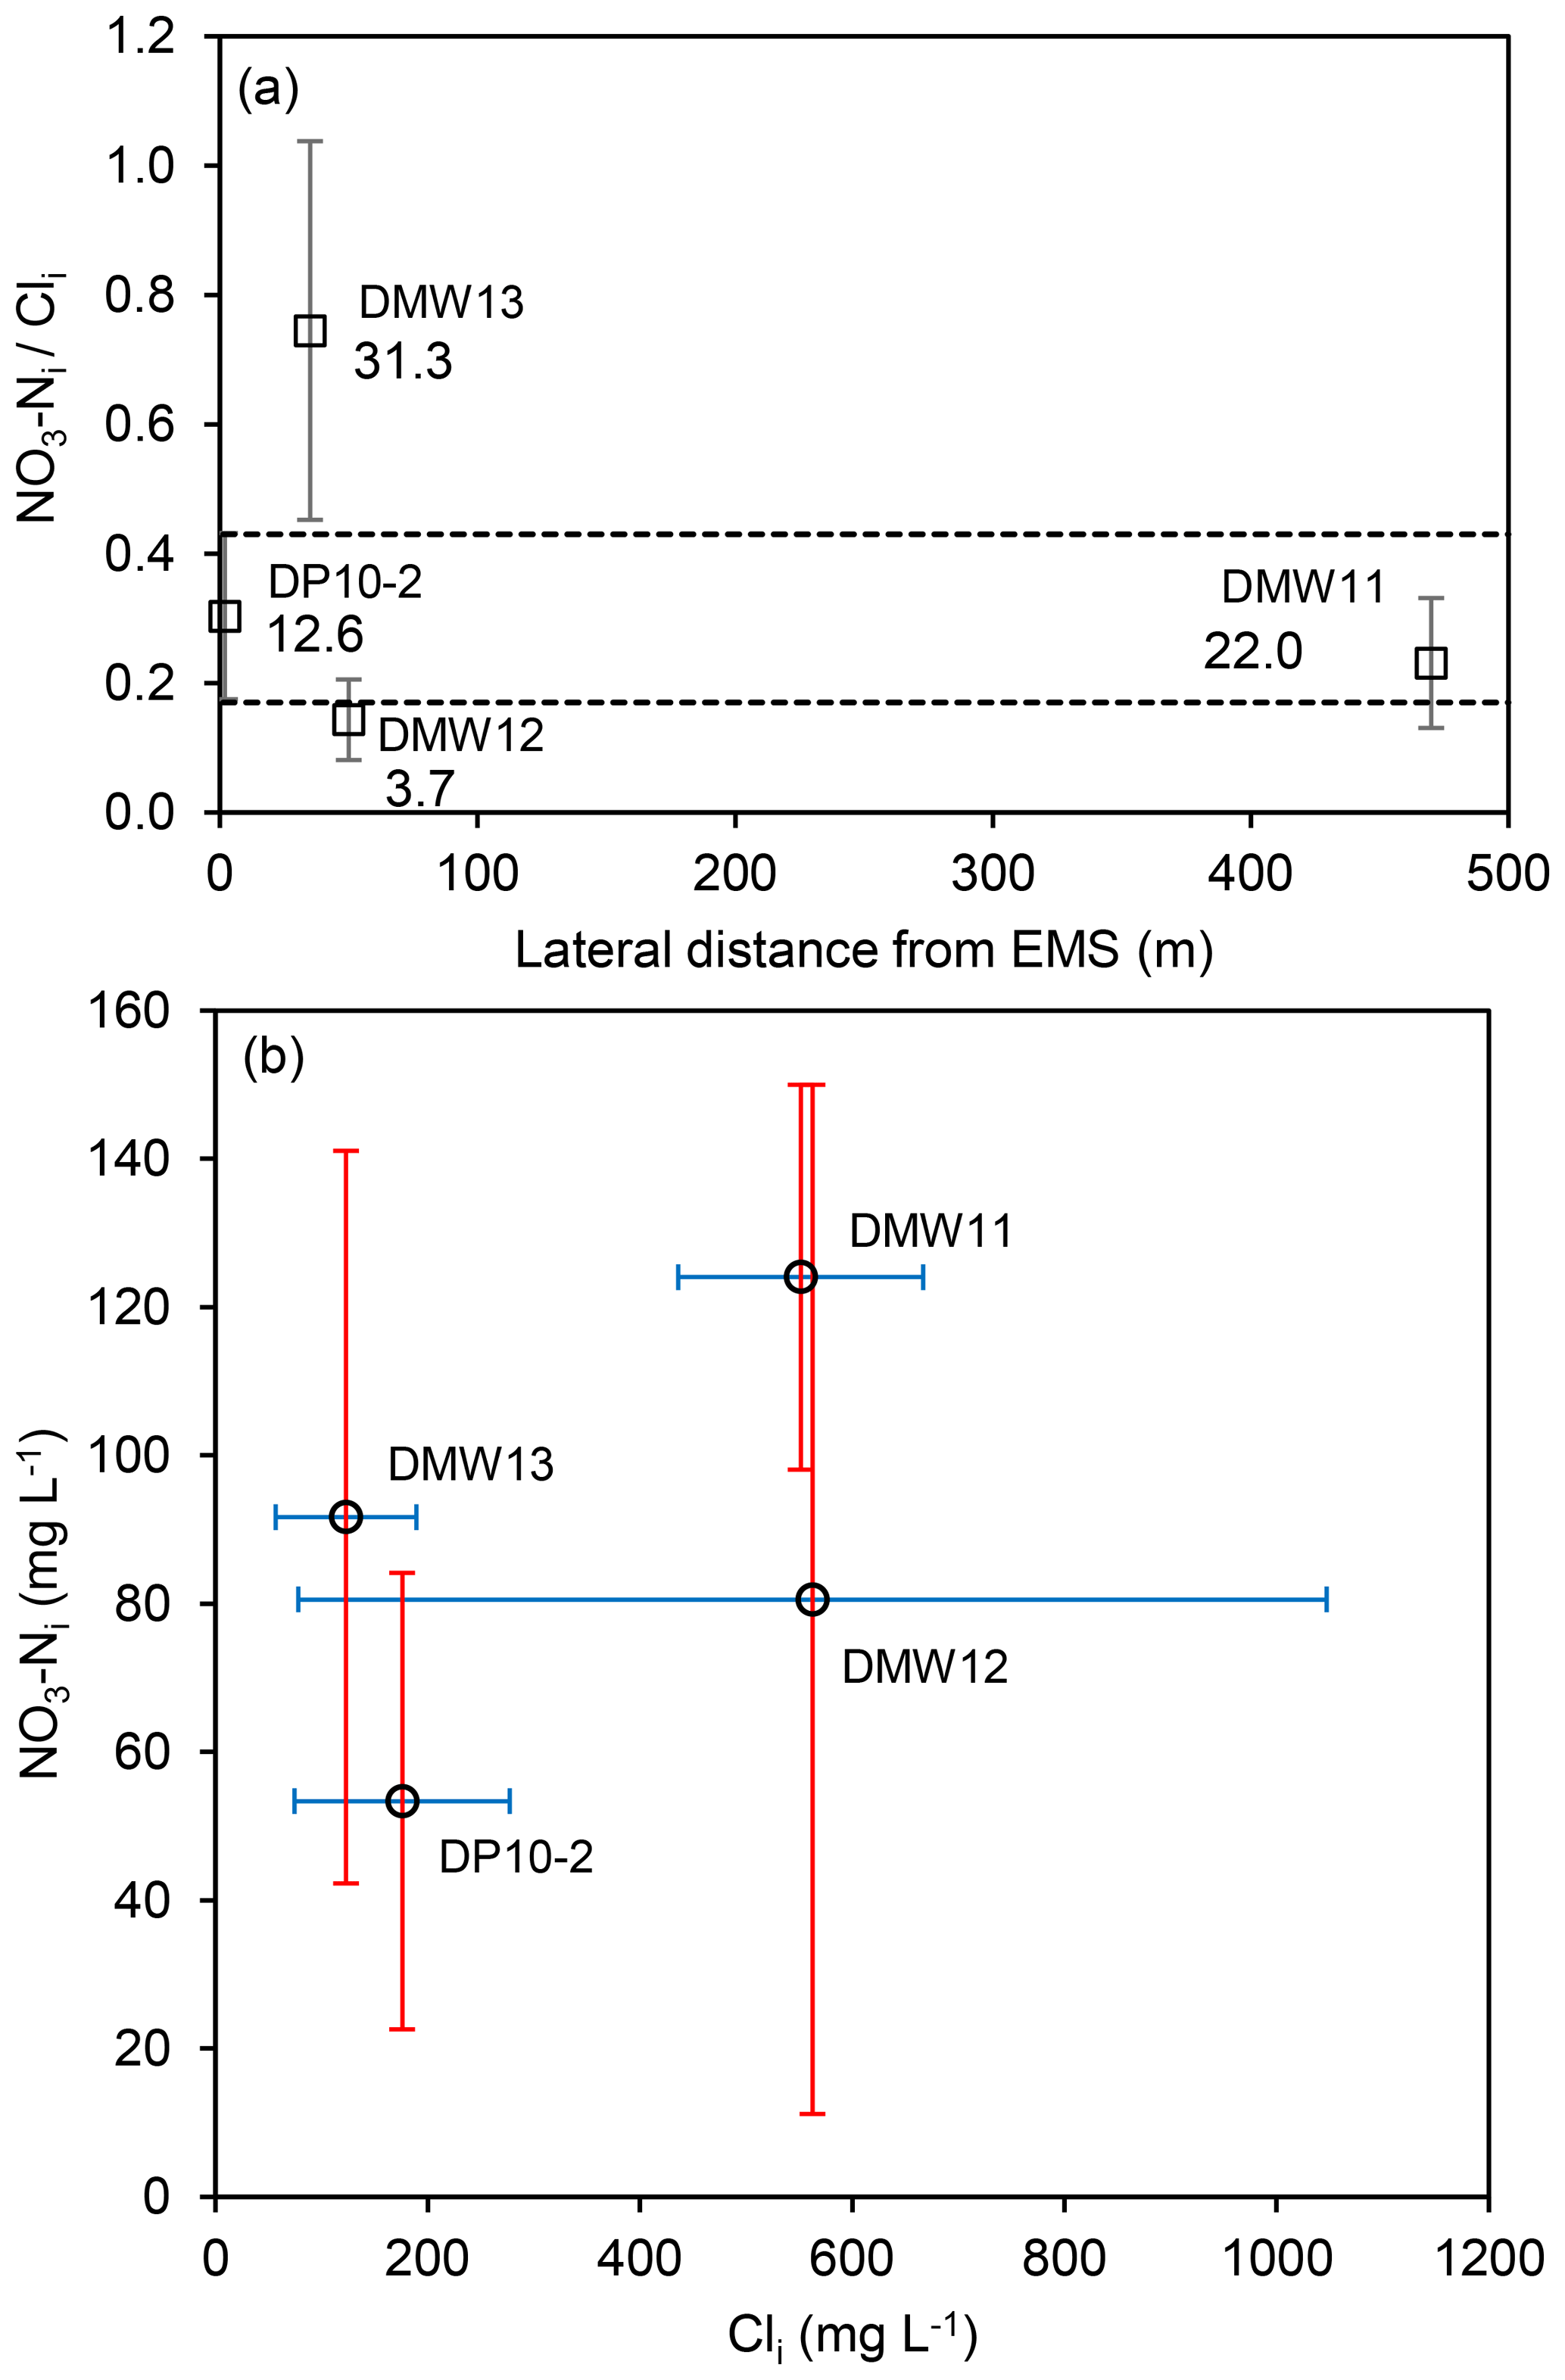
Figure 4(a) Estimated ratios (mean and SD) in water table wells with evidence of denitrification at CFO1, plotted with distance from earthen manure storage (EMS), where dashed lines are the upper and lower bounds of DP10-2 (EMS source) and labelled values are maximum measured NO3−N (mg L−1). (b) Estimated concentrations of NO3−Ni and Cli at CFO1 (mid-range, error bars are max and min values).
Contamination by agricultural that exceeds the drinking water guidelines (NO3−N > 10 mg L−1) was observed in four wells (DMW1, DMW11, DMW13, and DP10-2) and in the continuous core (DC15-23) (Fig. 3). DMW2 and DMW12 also had NO3−N concentrations that were elevated but did not exceed the drinking water guideline (≤3.7 mg L−1). Given the evidence of partial nitrification in DMW3 (and low NO3−N concentrations), the ratio of contamination from the EMS was assumed to be best represented by DP10-2, which is located directly down-gradient of the EMS. Data for this well indicate values of predominantly ranging from 0.1 to 0.3 with NO3−Ni ∕ Cli estimated at 0.3±0.13 (Fig. 4).
The maximum NO3−N concentration in groundwater at CFO1 (66.4 mg L−1) was measured in core sample DC15–23 (clay at 2 m b.g.l., 7 m hydraulically down-gradient of DMW3). Pore water extracted from the unsaturated zone (sand) at the top of this core profile contained 865 mg L−1 of NO3−N and had a ratio of 1.04, consistent with the ratio of 0.95 in the core sample. Given this consistency, and that NO3−N concentrations in the well immediately up-gradient were low (DMW3), the NO3−N in this core sample was most likely introduced into the groundwater system by vertical infiltration or diffusion from above. In contrast, elevated NO3−N (up to 21.1 mg L−1) within the sand between 6 and 12 m depth in this core had ratios consistent with an EMS source (0.07 to 0.31). Stable isotope values in pore water from this sand layer do not indicate substantial denitrification (δ18O ≤ 5.9 ‰, δ15N ≤ 16.7 ‰), suggesting these ratios will be similar to the initial ratios at the point of entry to the groundwater system.
In DMW13 (33 m down-gradient from DP10-2) the ratio of NO3−Ni ∕ Cli was 0.75±0.29, similar to the ratio in DC15-23 at 2 m (0.95), which is interpreted as reflecting a top-down source. The in DMW13 is therefore unlikely to be sourced solely from leakage from the EMS, and could be sourced from the adjacent dairy pens or a temporary manure pile that was observed adjacent to this well during core collection in 2015 (or a combination of EMS and top-down sources).
In DMW12 the NO3−Ni ∕ Cli ratio was not inconsistent with an EMS source, but the hydraulic gradient between DMW2 and DMW12 is negligible, indicating a lack of driving force for advective transport from the EMS towards DMW12. This is also the case for well DMW1, which is up-gradient of the EMS but had elevated NO3−N concentrations (6.5±3.6, n=18). The source of nitrate in these wells is therefore unlikely to be related to leakage from the EMS, but alternative sources (i.e. nearby temporary manure piles) are not known.
Well DMW11, 470 m from the EMS, had consistently low ratios (<0.05), similar to DP10-2, but estimates of Cli were 3 times higher than Cli for DP10-2 (Fig. 4b). NO3−Ni and Cli estimated for DMW11 were consistent with measured values in that well, indicating a local top-down source. Well DMW11 is located hydraulically down-gradient of feedlot pens and adjacent to a solid manure storage area, in a local topographic low. Elevated NO3−N in this well is therefore interpreted to be from surface runoff and top-down infiltration, rather than lateral advection from the EMS.
3.3.2 CFO4
At CFO4, measured data indicate that effects from agricultural operations on concentrations in groundwater are restricted to the upper 15 m of the subsurface. NO3−N concentrations in wells screened at 15 m depth were <0.5 mg L−1, with the exception of one sample from BP10-15w (May 2012) with 4.3 mg L−1 of NO3−N. Water table wells in the west and north of the study site (BC1, BC2, and BC3) also indicate negligible impacts of agricultural operations, with Cl− < 10 mg L−1 and NO3−N < 0.1 mg L−1.
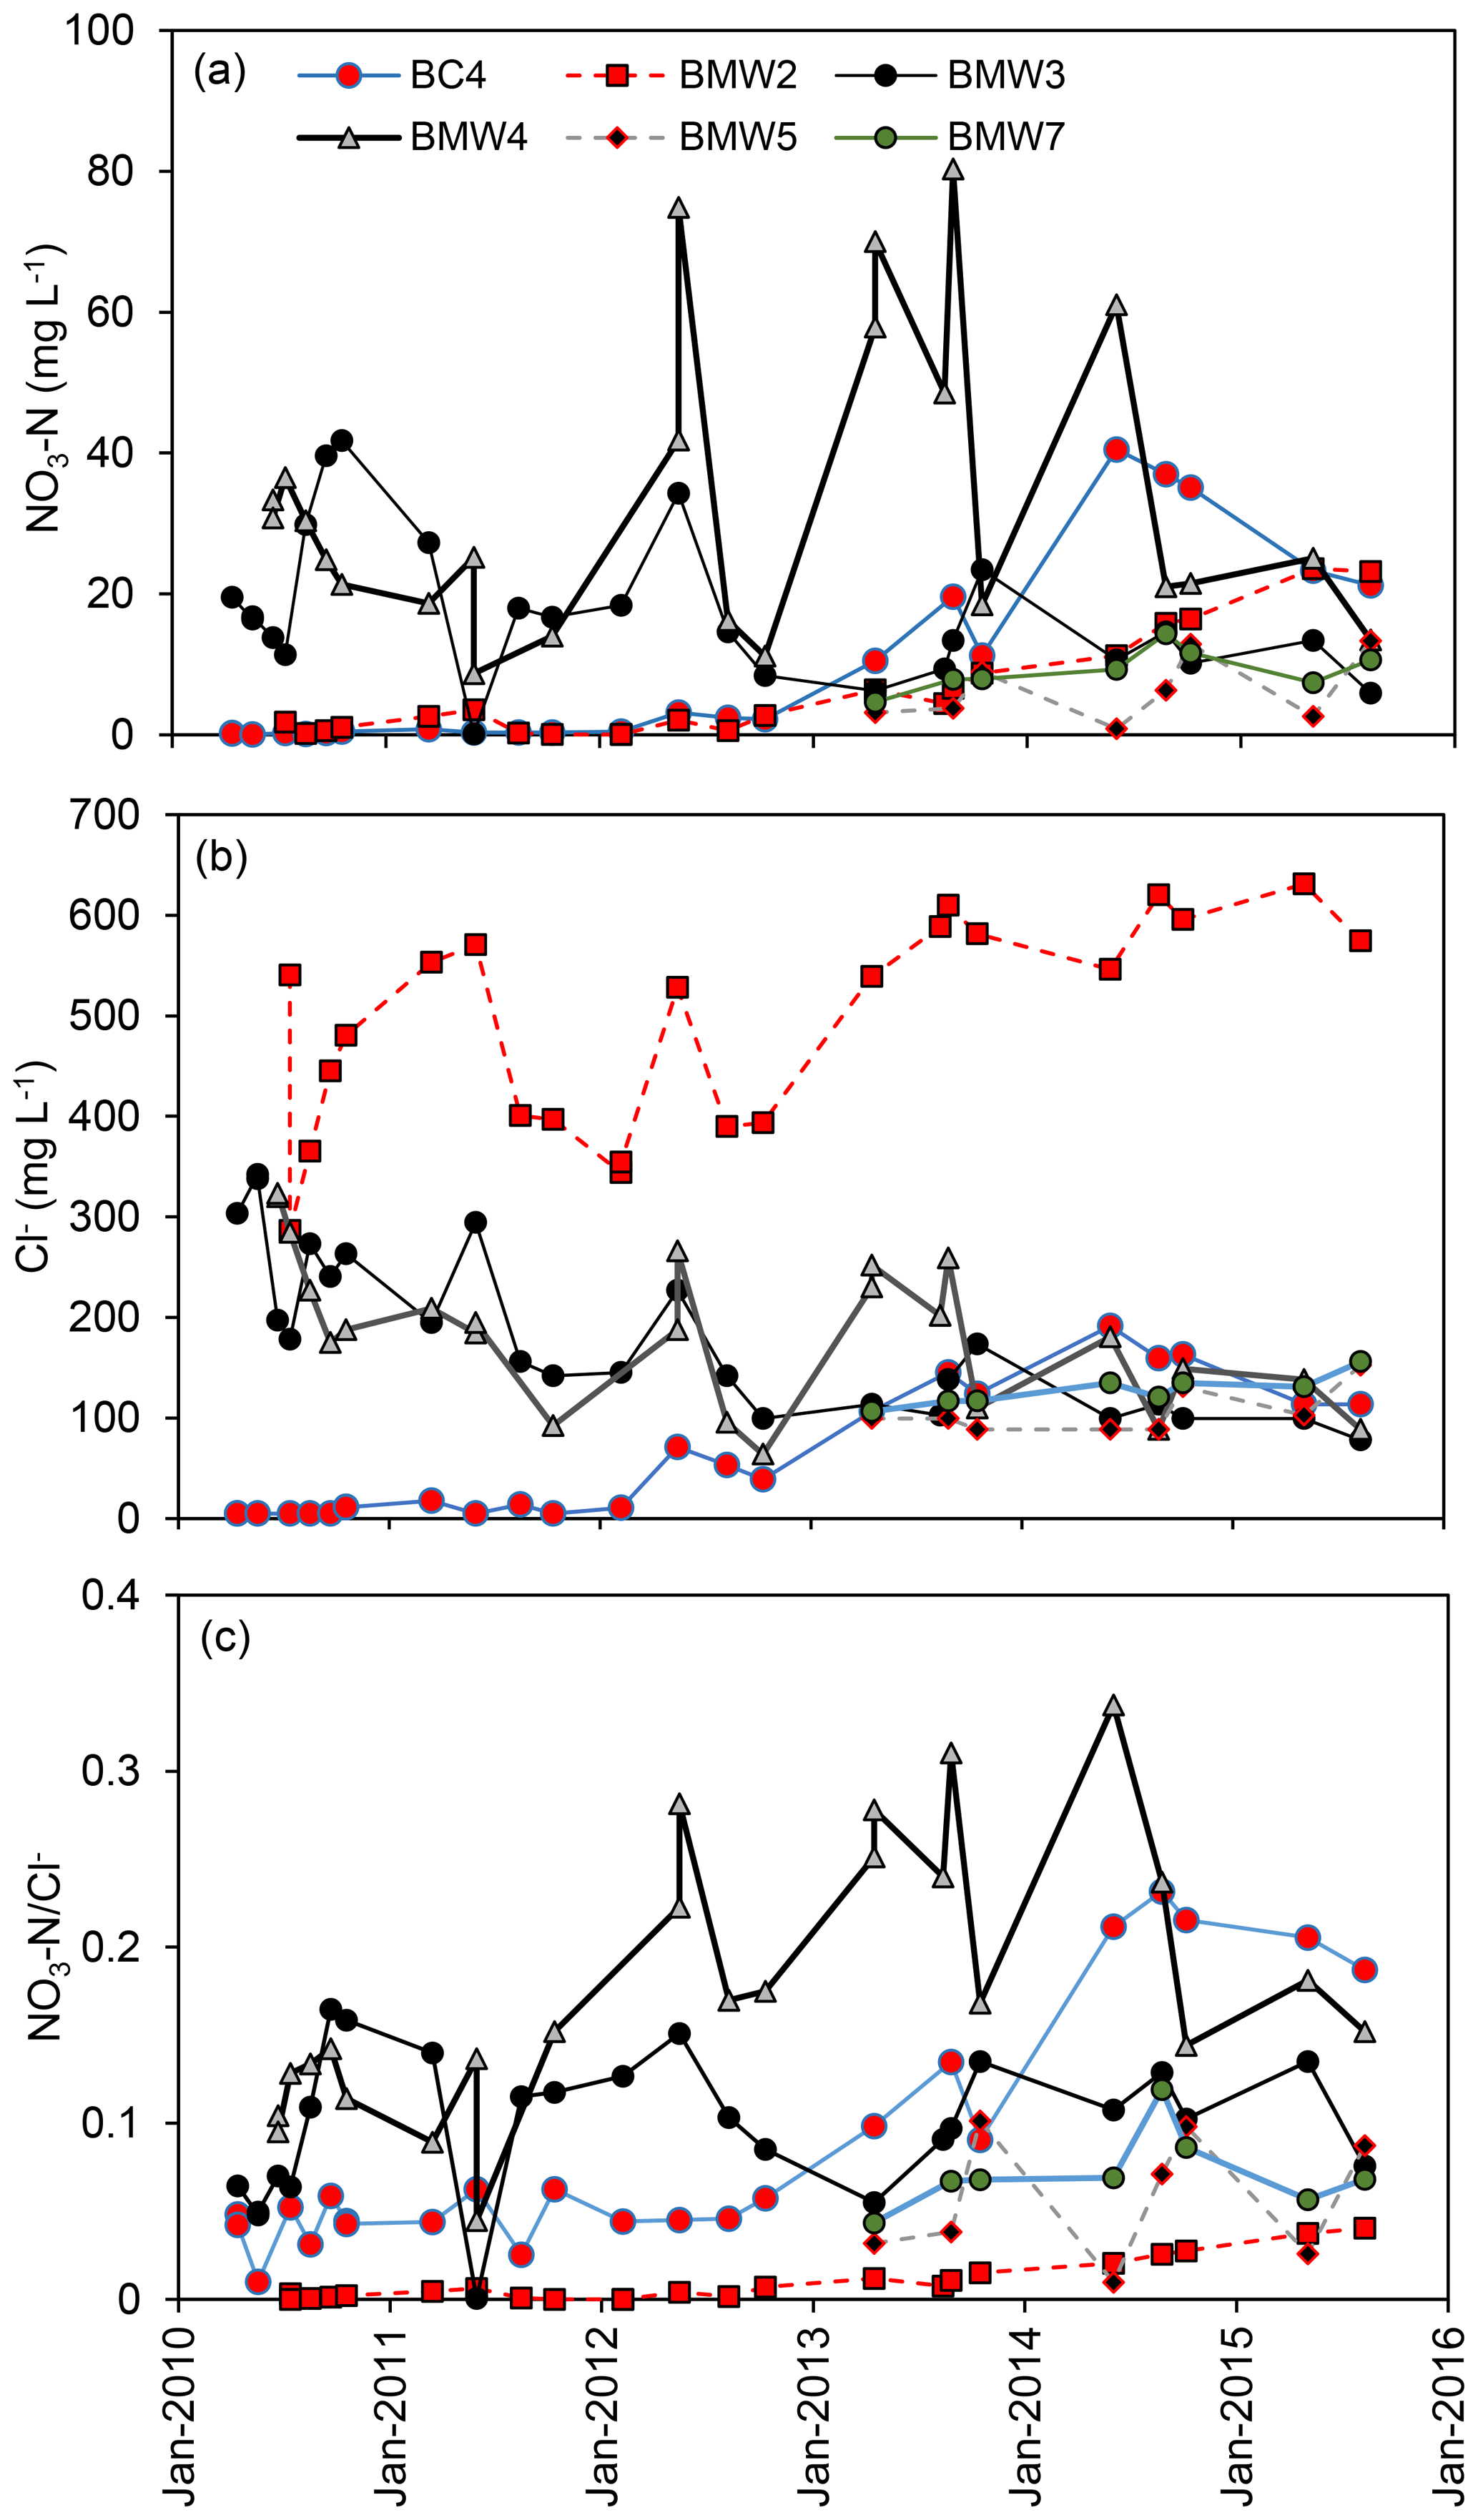
Figure 5Temporal variations in (a) NO3−N, (b) Cl−, and (c) at CFO4. Only wells with NO3−N > 10 mg L−1 are shown.
Concentrations of NO3−N > 10 mg L−1 were measured in three water table wells (BMW2, BMW3, BMW4) adjacent to the EMS, indicating that they have been impacted by the EMS (Fig. 5). Of these, BMW2 had much higher Cl− concentrations (502±97 mg L−1, n=22 in BMW2 compared to 182±81 mg L−1 in BMW3 and 188±74 mg L−1 in BMW4), and therefore lower ratios (<0.05). Cl− concentrations in BMW2 were consistent with concentrations in the EMS suggesting direct leakage, while stable isotopes of and initial concentrations (NO3−Ni≥127 mg L−1) indicate substantial denitrification (Table 3, Fig. 6). The NO3−Ni ∕ Cli ratio in BMW2 is consistent with measured in BMW4, which therefore likely reflects leakage from the EMS without denitrification (consistent with stable isotope of values of ).
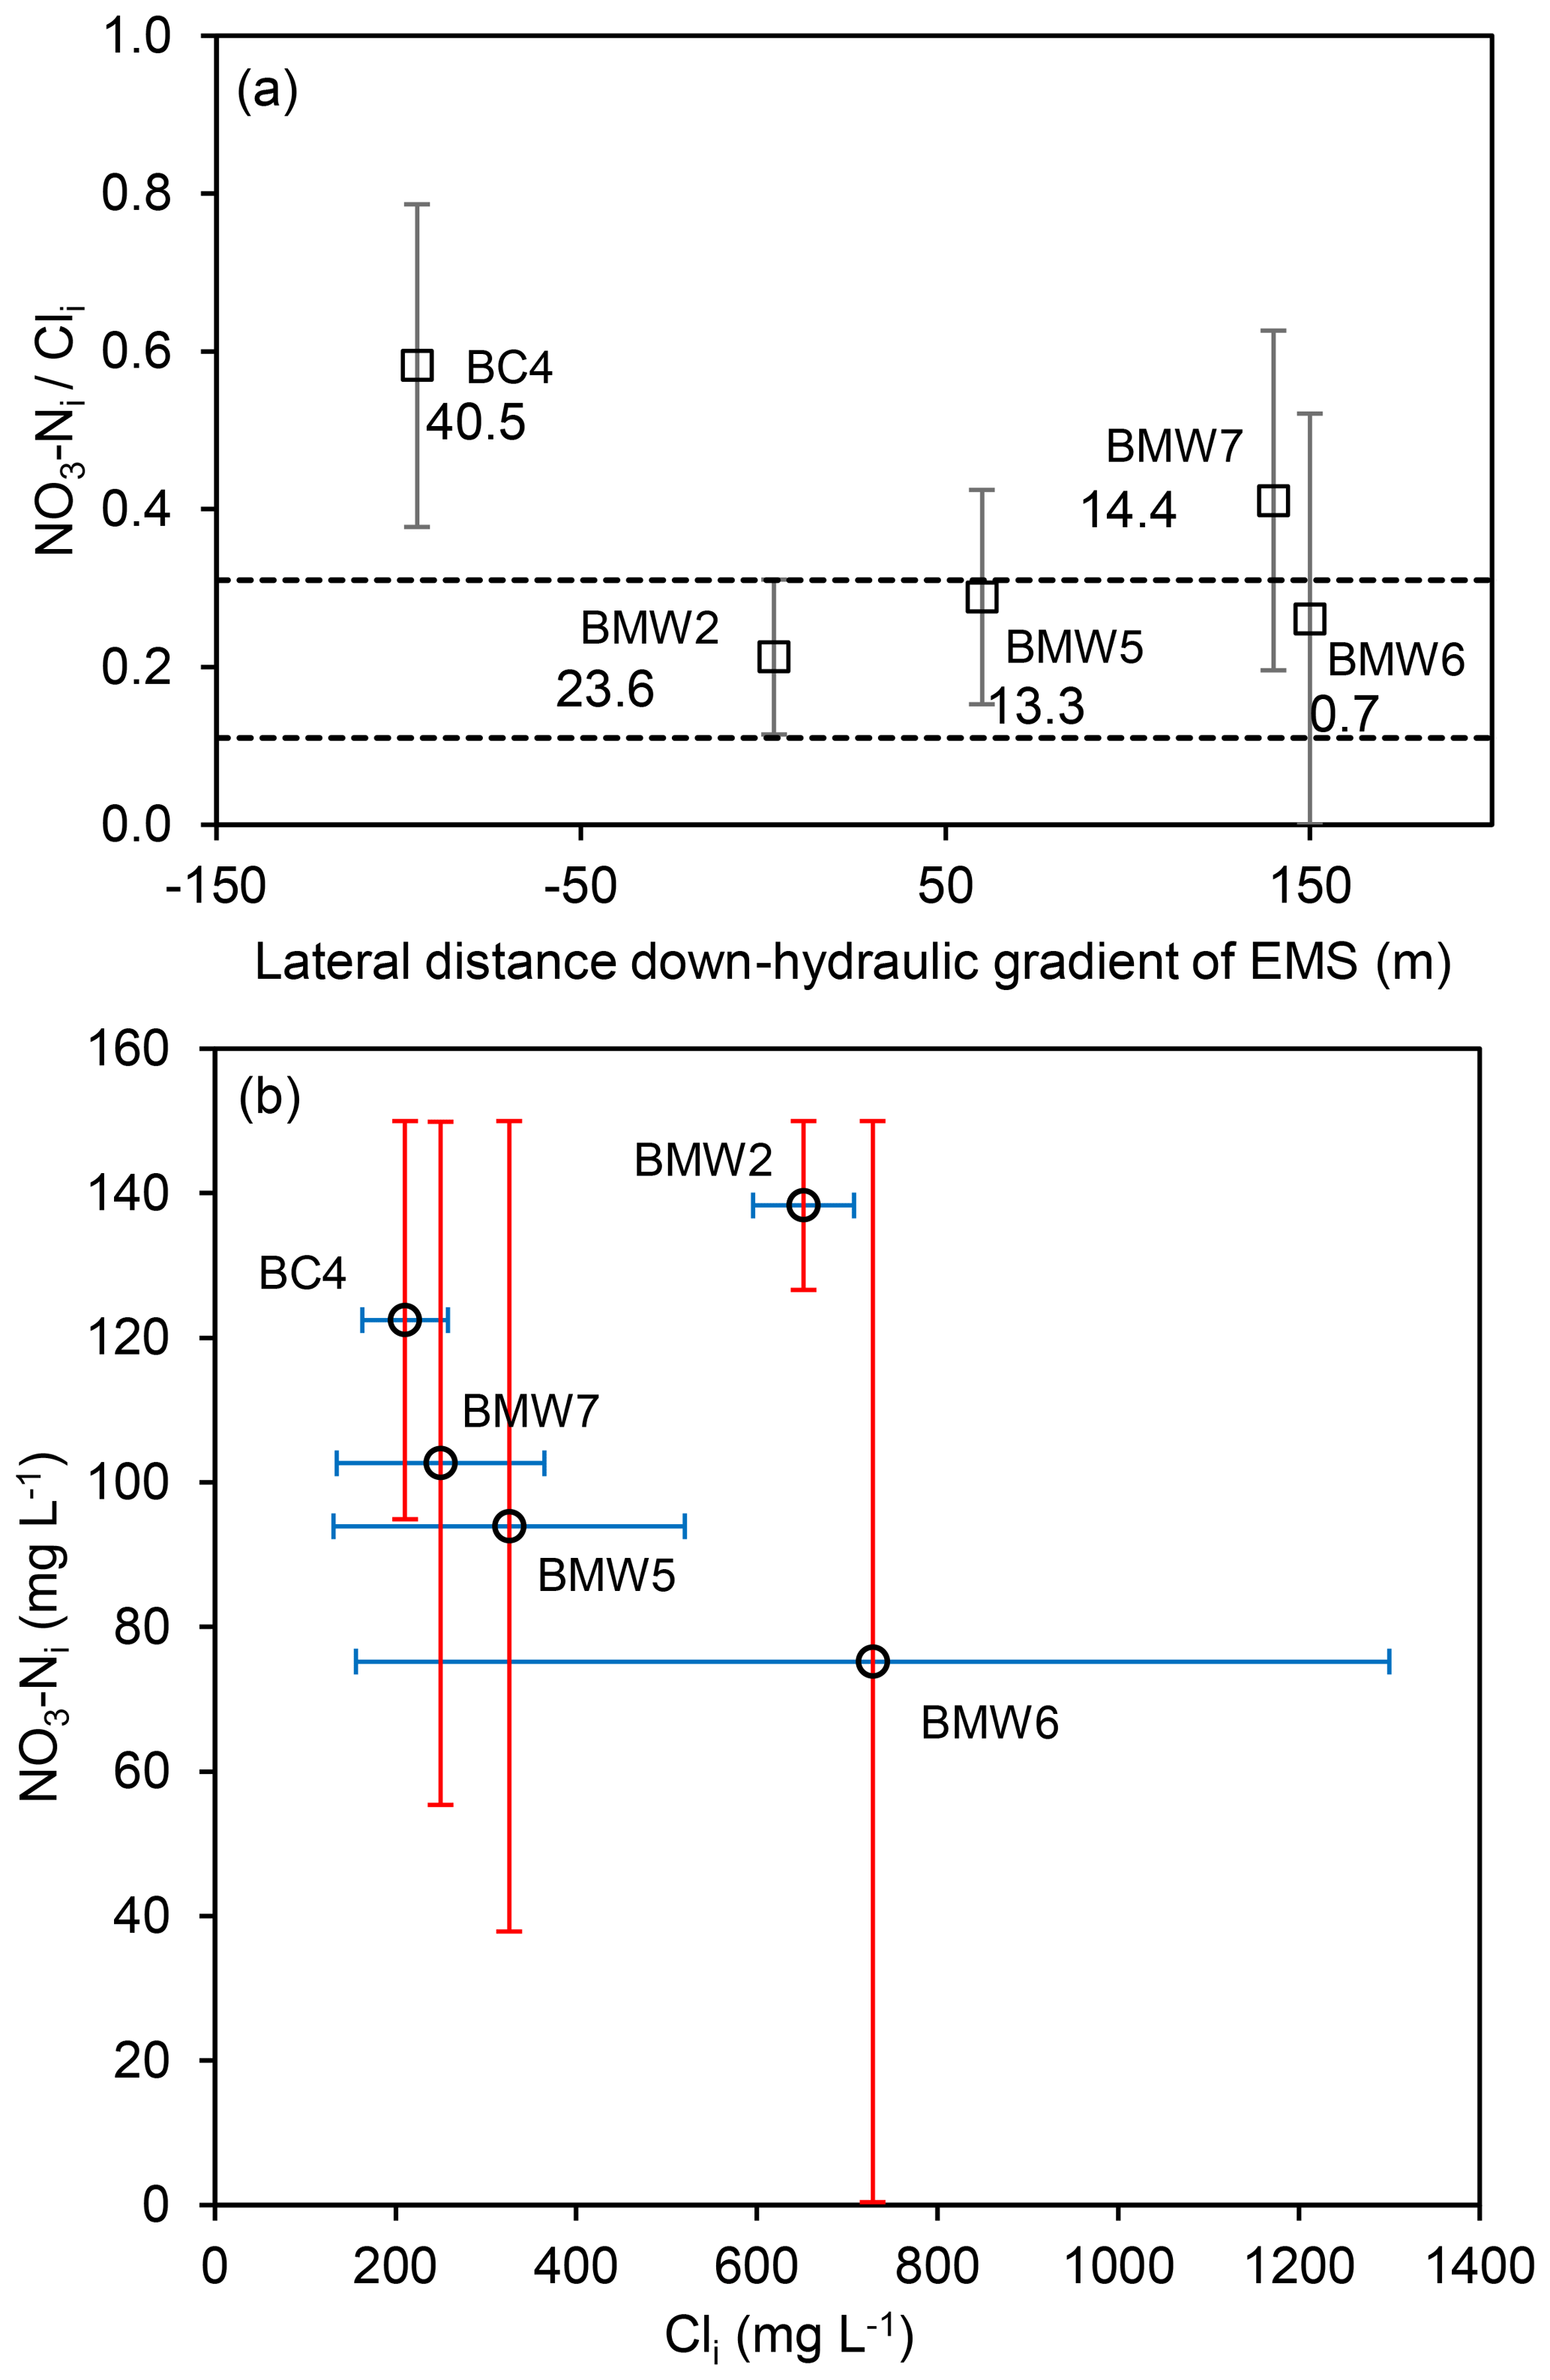
Figure 6(a) Estimated ratios (mean and SD) in water table wells with evidence of denitrification at CFO4, plotted with distance from earthen manure storage (EMS), where dashed lines are upper and lower bounds of BMW2 (EMS source) and values are maximum measured NO3−N (mg L−1). (b) Estimated concentrations of NO3−Ni and Cli at CFO4 (mid-range, error bars are max and min values).
Given that the estimated subsurface travel distance during operations at this site is 10 m, agriculturally derived in other wells not immediately adjacent to the EMS is unlikely to be related to leakage from the EMS. Wells BMW5 and BMW7 are 60 and 140 m hydraulically down-gradient from the EMS, respectively. NO3−Ni ∕ Cli ratios in these wells were not inconsistent with BMW2 (i.e. the range of values overlap), but given the distance from the EMS the source of NO3−N in these wells is most likely the adjacent dairy pens. Concentrations of NO3−N > 10 mg L−1 were also measured in BC4, which is located 95 m hydraulically up-gradient of the EMS. The ratio of NO3−Ni ∕ Cli at BC4 was the highest at CFO4 (0.6) and did not overlap with BMW2. The in this well is interpreted to have been sourced from an adjacent manure pile, which was observed during the study.
3.4 Mechanisms of attenuation of agriculturally derived
Attenuation of agriculturally derived in groundwater is dominated by denitrification at both CFO1 and CFO4, with estimates of fm consistently higher than estimates of fd (Tables 3 and S10, Fig. 7). Calculated fd values indicate that where denitrification was identified, at least half of the NO3−N present at the initial point of entry to the groundwater system has been removed by this attenuation mechanism. Comparison of NO3−Nmix (the concentration of NO3−N that would be measured if mixing was the only attenuation mechanism) with measured concentrations (which reflect attenuation by both mixing and denitrification) suggests that the sample from 20 m depth (DP11-12b) is the only sample that would be below the drinking water guideline if mixing was the only attenuation mechanism (Fig. 8).
Table 3Calculated fd and fm based on measured Cl− and NO3−N concentrations and stable isotope values of .

a Central depth of core samples, x, indicated as SampleID_xm. b Maximum fm is 1 for all samples, which implies no mixing.
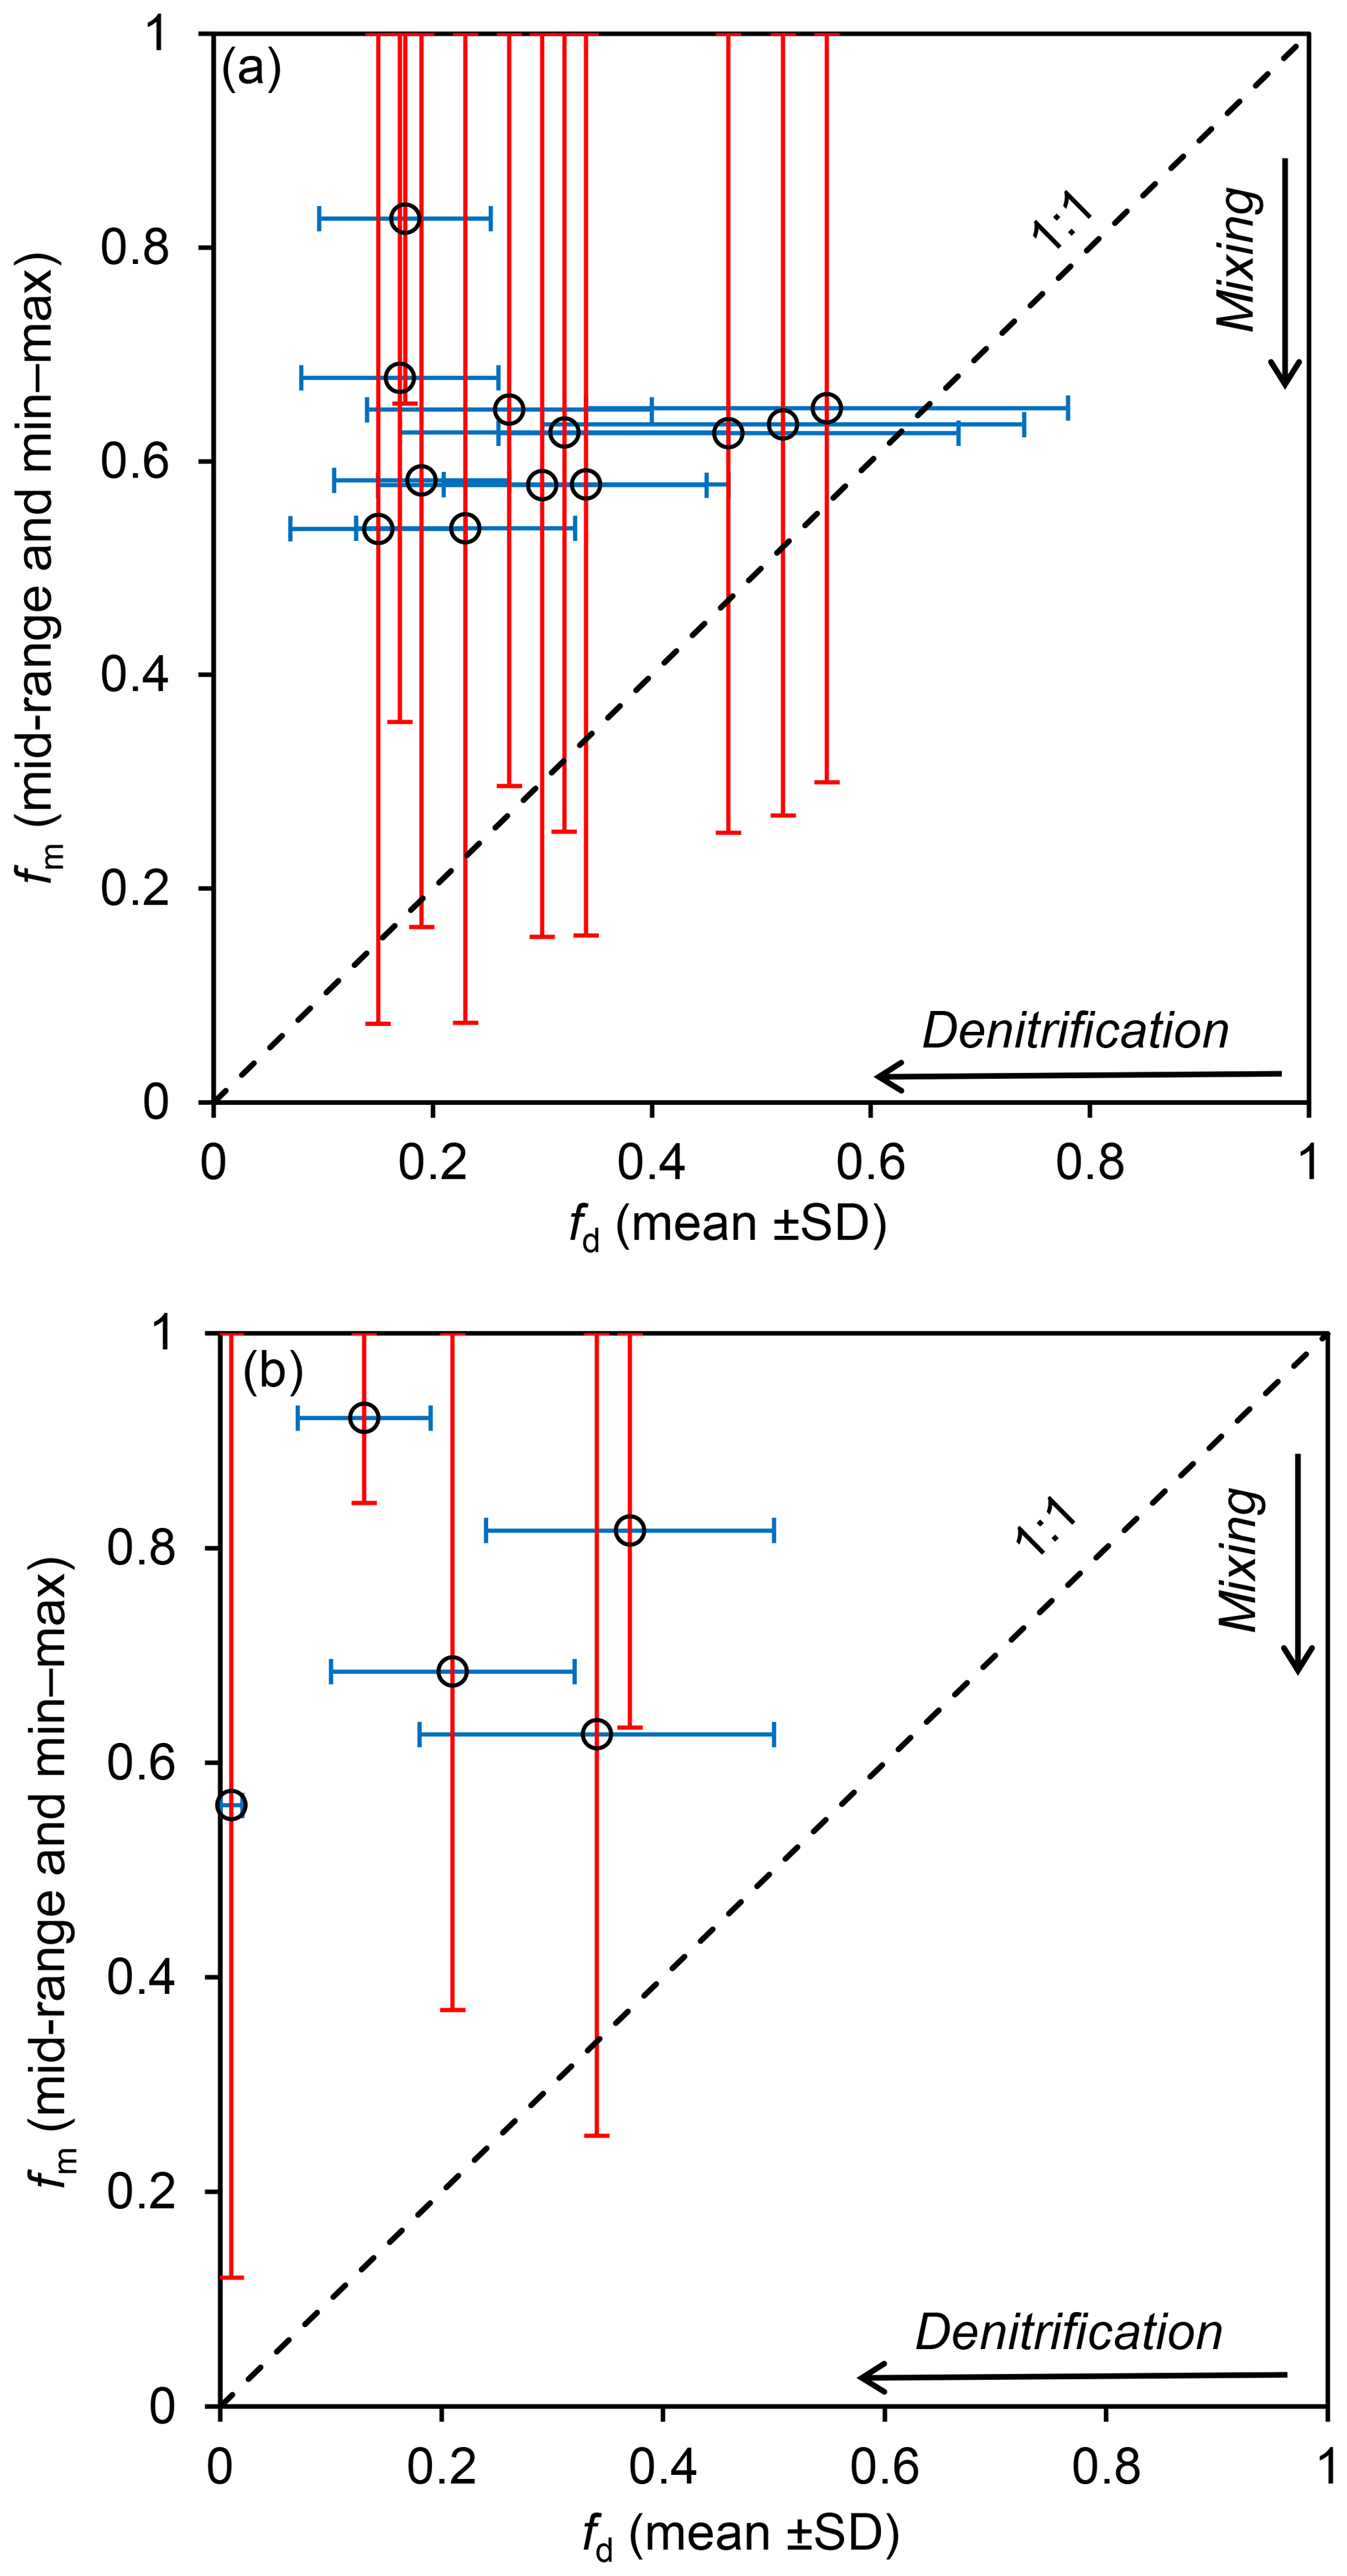
Figure 7Relative contributions to attenuation by mixing and denitrification, as indicated by estimated fm and fd at (a) CFO1 and (b) CFO4, for groundwater samples with denitrification indicated by stable isotope values of .
At both sites, the stable isotope values of indicate that denitrification proceeds within metres of the source. At CFO1, calculated fd in well DP10-2 (2 m from the EMS) is 0.52±0.22; at CFO4, fd in well BMW2 (3 m from the EMS) is 0.13±0.06. Denitrification also substantially attenuated NO3−N concentrations in wells where the source is not the EMS but instead is adjacent solid manure piles (e.g. DMW11 at CFO1, BC4 at CFO4). In BMW6 at CFO4, denitrification completely attenuated the agriculturally derived . This well had negligible NO3−N (0.4±0.2 mg L−1, n=8) and the lowest fd of 0.01. Measured DOC in this well was consistent with other wells at both sites (6.9±1.7 mg L−1, n=3), suggesting DOC depletion does not limit denitrification at these CFOs.
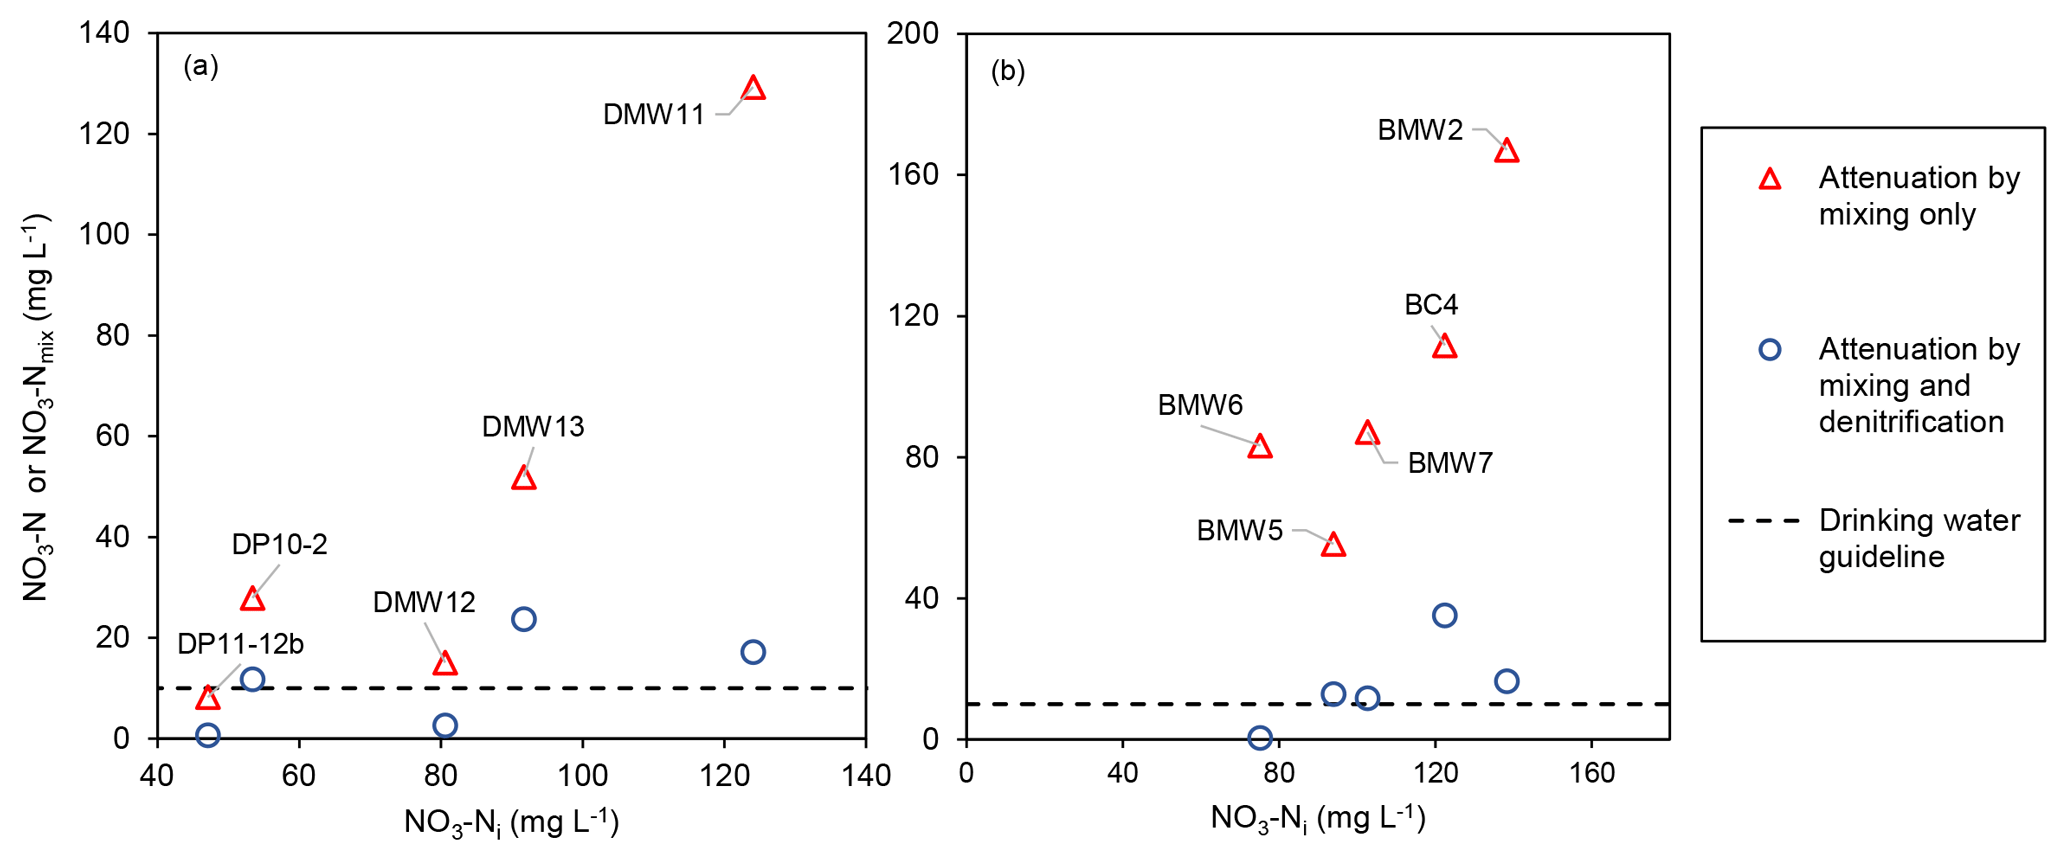
Figure 8Measured concentrations of NO3−N (blue circles – attenuation by mixing and denitrification) and NO3−Nmix (red triangles – attenuation by mixing only) vs. mid-range estimate of NO3−Ni at (a) CFO1 and (b) CFO4. Dashed lines are drinking water guideline (10 mg L−1 of NO3−N).
4.1 Implications for on-farm waste management
Agriculturally derived at these two sites with varying lithology was generally restricted to depths < 20 m, consistent with previous studies at CFOs (Robertson et al., 1996; Rodvang and Simpkins, 2001; Rodvang et al., 2004; Kohn et al., 2016). Attenuation of agriculturally derived in groundwater was a spatially varying combination of mixing and denitrification, with denitrification playing a greater role than mixing at both sites. In the samples for which fd could be determined, denitrification reduced concentrations by at least half and, in some cases, back to background concentrations. Given that the range of source isotopic composition was allowed to vary to its maximum justifiable extent, these quantitative estimates of denitrification based on stable isotopes of are likely to be conservative. Redox conditions within the groundwater system were not able to be determined in this study due to the sampling method used to collect groundwater from wells screened across low-K formations (well bailed dry then sample collected after water level recovery). However, denitrification appears to proceed within metres of the source, suggesting relatively short subsurface residence times are required and that redox conditions close to the water table are conducive to denitrification reactions (Critchley et al., 2014; Clague et al., 2015).
The substantial role of denitrification within the saturated glacial sediments at these study sites indicates the potential for significant attenuation of agriculturally derived by denitrification in similar groundwater systems across the North American interior and Europe (Ernstsen et al., 2015; Zirkle et al., 2016). Denitrification in the unsaturated zone is limited by low water contents and oxic conditions, resulting in substantial stores of in vadose zones (Turkeltaub et al., 2016; Ascott et al., 2017). in water that is removed rapidly from the site is also unlikely to be substantially attenuated by denitrification due to oxic conditions and rapid transit times (Ernstsen et al., 2015). Therefore, water management focussed on reducing the effects of contamination in similar hydrogeological settings to this study should aim to maximise infiltration into the saturated zone where concentrations can be naturally attenuated, provided that local groundwater is not used for potable water supply.
At both sites there is evidence of elevated due to leakage from the EMS, but the impact appears to be limited to within metres of the EMS. This suggests that saturation within the clay lining of the EMS has limited the development of extensive secondary porosity that would allow rapid water percolation (Baram et al., 2012). Infiltration of -rich water that has passed through temporary solid manure piles and dairy pens has resulted in groundwater NO3−N concentrations as high as those associated with leakage from the EMS (e.g. DMW11, BC4). At CFO4, this is in spite of the presence of clay at the surface, reflecting secondary porosity in the upper part of the profile that has led to hydraulic conductivities comparable to sand. This is consistent with the findings of Showers et al. (2008), who investigated sources of at an urbanised dairy farm in North Carolina, USA. Construction of EMS facilities in Alberta has been regulated under the Agriculture Operation Practices Act since 2002, which requires them to be lined with clay to minimise leakage (Lorenz et al., 2014). On-farm waste management should increasingly focus on minimising temporary manure piles that are in direct contact with the soil to reduce contamination associated with dairy farms and feedlots.
4.2 Critique of this approach and applicability at other sites
At both sites, leakage from the EMS had NO3−Ni ∕ Cli of between 0.1 and 0.4, but this alone was not diagnostic of the source. The sources of manure-derived (manure piles vs. EMS) are distinguishable based on NO3−Ni ∕ Cli ratios, provided there is also an understanding of the history of each site, local hydrogeology, and potential sources. Calculated fd and fm generally decreased with increasing subsurface residence time and distance from source, providing additional evidence for source attribution. For example, at CFO4, well BMW2, which is adjacent to the EMS, had the highest fm (0.92), indicating the least attenuation of NO3 by mixing and consistent with the EMS being the source of to this well. Temporal variability in NO3−Ni ∕ Cli for each source could not be determined based on the snapshot isotope sampling conducted, but this could be investigated by measuring isotopes in conjunction with NO3−N and Cl− at multiple times.
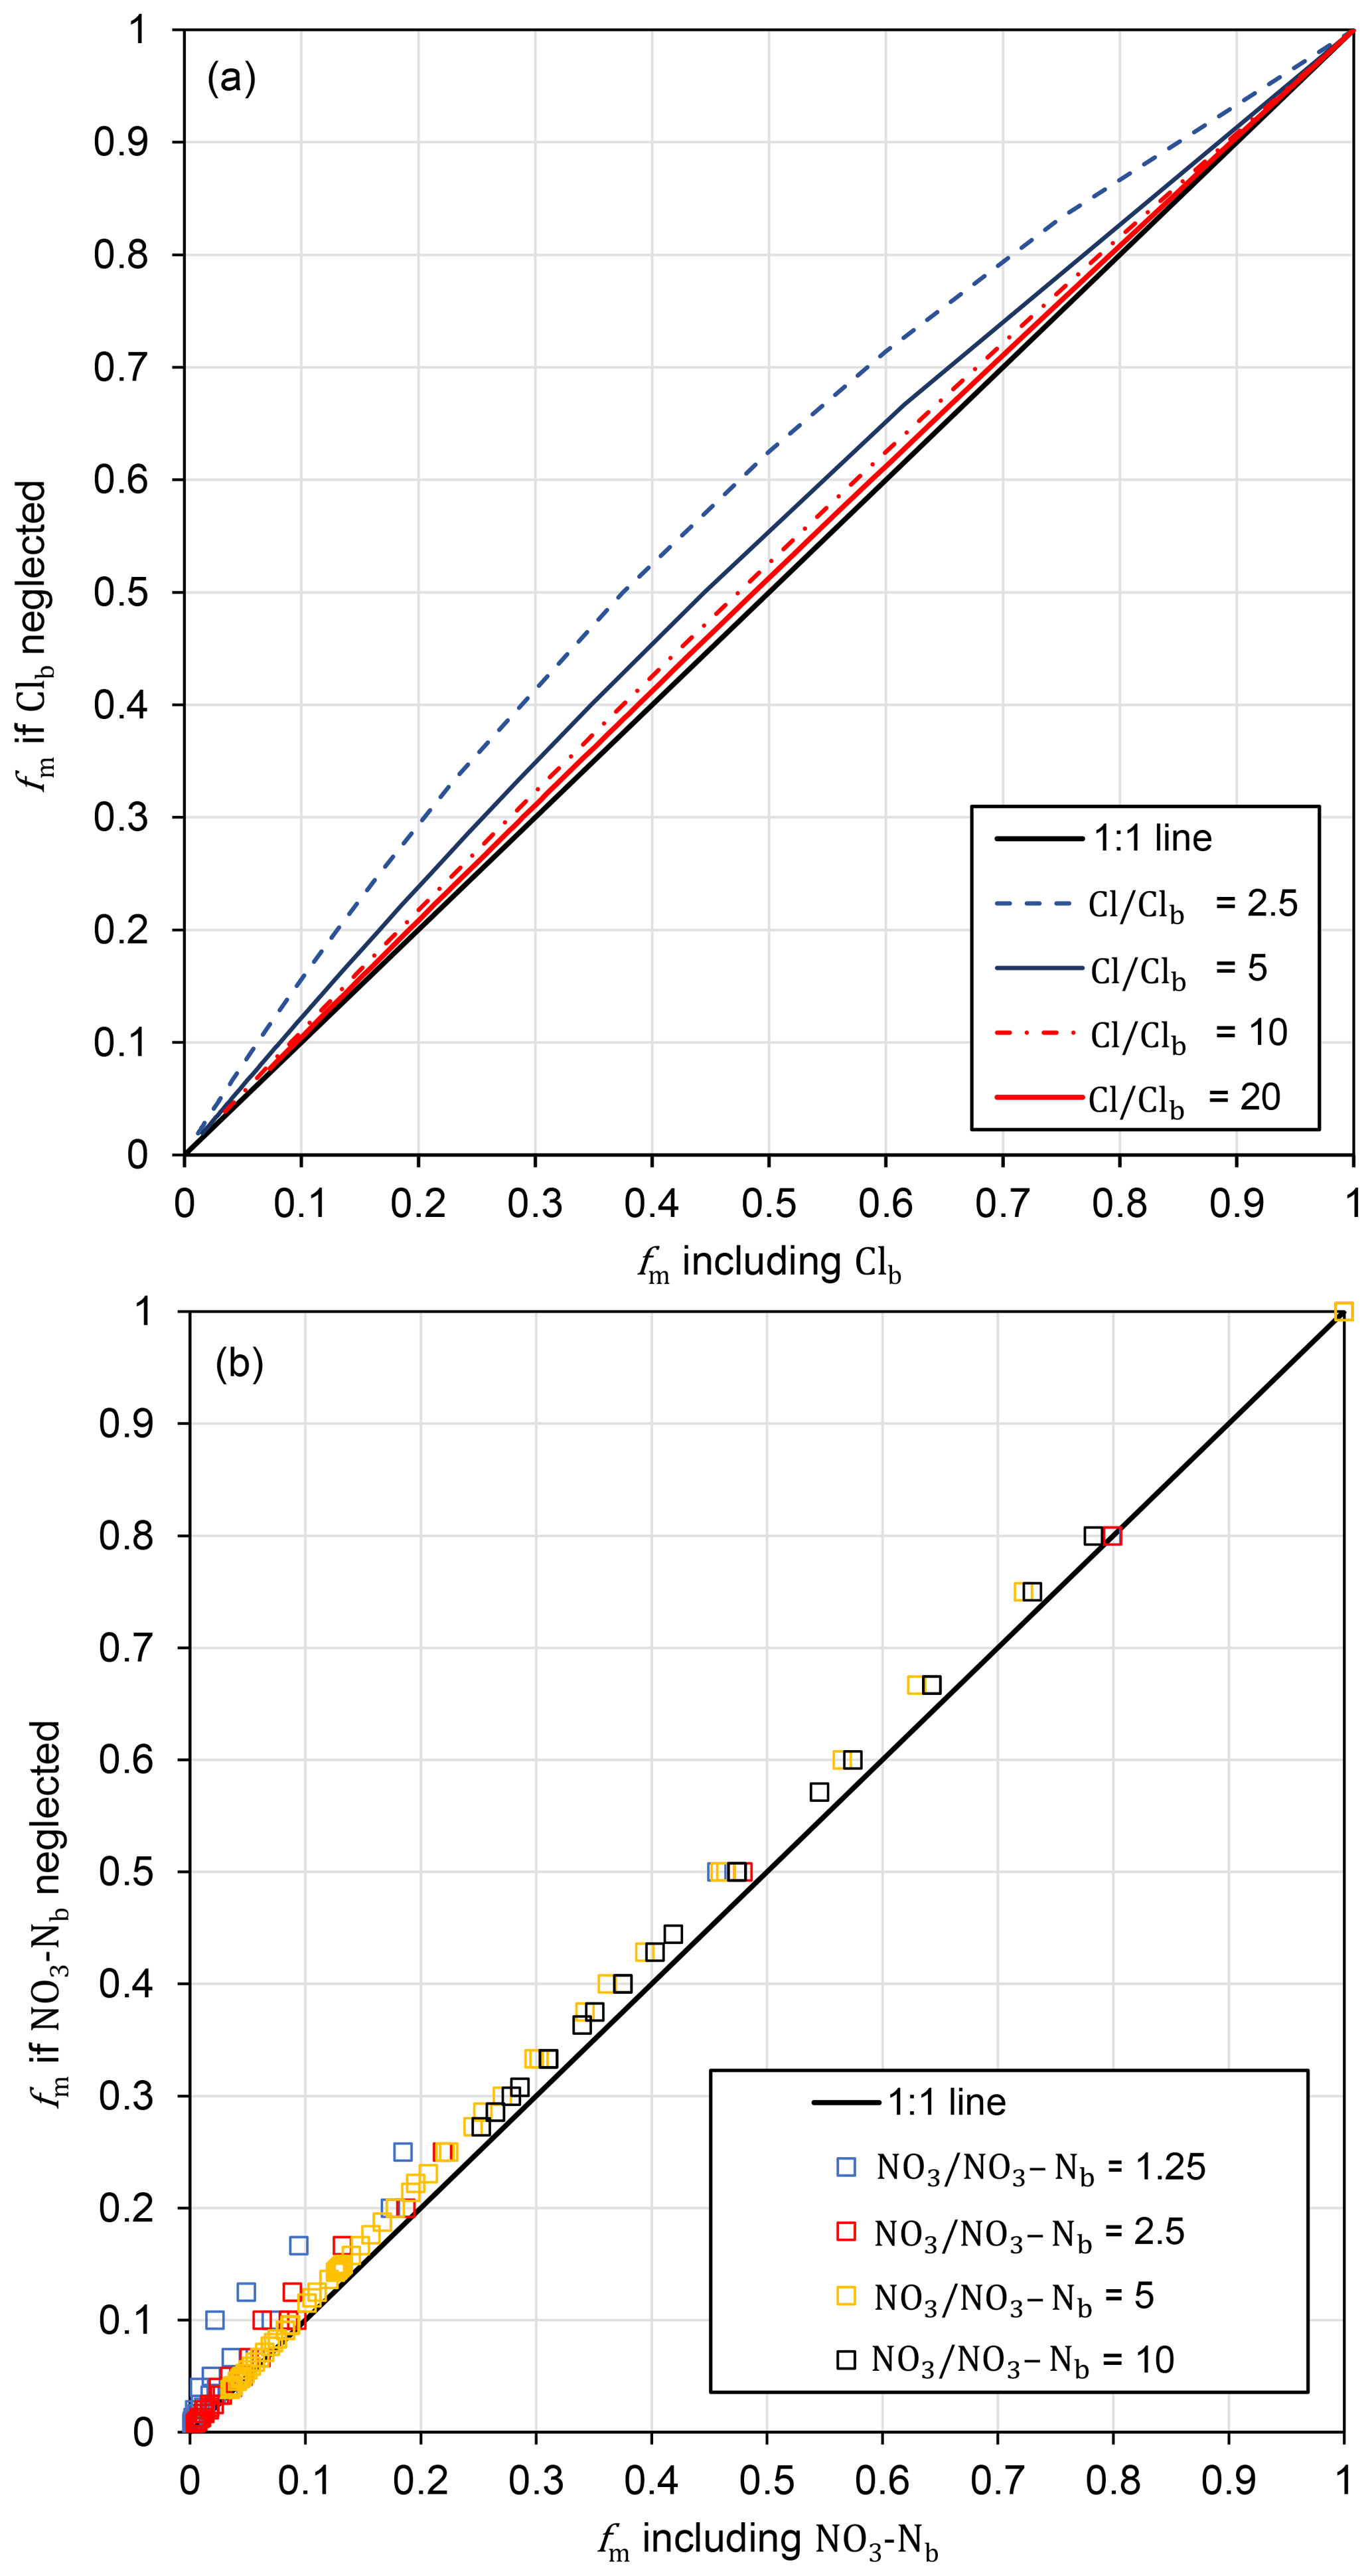
Figure 9Effect of neglecting background concentrations (Clb or NO3−Nb) in the mixing model on calculated fm over the range of values in this study.
Calculation of NO3−Ni ∕ Cli assumed that background concentrations could be neglected in the mixing model. At these study sites, background concentrations are likely to be <20 mg L−1 for Cl− and <1 mg L−1 for NO3−N. Estimated NO3−Ni values were at least 20 times background NO3−N concentrations, and over 100 times background concentrations in some wells. The estimated Cli values were at least 3 times as high as the background concentrations at CFO1 and at least 10 times as high as the background concentrations at CFO4. The error introduced by neglecting background concentrations was assessed by comparing fm calculated with and without background concentrations included, using the full range of values in this study (Fig. 9). Neglecting background concentrations results in overestimation of fm (i.e. underestimation of the amount of attenuation mixing) with the largest errors occurring when measured concentrations are close to background concentrations. For Cl− the maximum difference of 0.13 is in the mid-range of fm values. For NO3−N, the difference is consistently <0.1 with the largest errors at the lowest values of fm. The uncertainty in fm is primarily related to uncertainty in the initial concentrations (Cli and NO3−Ni), which depends on measured Cl− and NO3−N. The largest uncertainties in NO3−Ni and Cli correspond to the lowest measured concentrations (i.e. furthest from the upper limit), with less uncertainty at higher measured concentrations as they approach the maximum values.
Although applicable at these sites, this approach may not be valid at other sites if additional sources of NO3 in groundwater (e.g. fertiliser or nitrification) are significant, or if NO3 concentrations in groundwater are naturally elevated (Hendry et al., 1984). The combination of the approach outlined here with measurement of groundwater age indicators would allow for better constraints on groundwater flow velocities and determination of denitrification rates (Böhlke and Denver, 1995; Katz et al., 2004; McMahon et al., 2004; Clague et al., 2015).
4.3 Comparison with isotopic values of in previous studies
Nitrate isotope values in groundwater at the two CFOs studied were generally consistent with previous studies reporting denitrification of manure-derived at dairy farms (Wassenaar, 1995; Wassenaar et al., 2006; Singleton et al., 2007; McCallum et al., 2008; Baily et al., 2011). However, the isotopic values of in the manure filtrate from the EMS at CFO1 were not consistent with values for manure-sourced reported in other groundwater studies (Wassenaar, 1995; Wassenaar et al., 2006; Singleton et al., 2007; McCallum et al., 2008; Baily et al., 2011). This is likely to be because nitrification within the EMS was negligible (NO3−N < 0.7 mg L−1), such that the isotopic values of NO3−N in the manure filtrate reflect volatilisation of NH3 and partial nitrification within the EMS. values may also have been affected by evaporative enrichment of the being incorporated into (Showers et al., 2008).
A number of groundwater samples collected during this study had relatively enriched (>15 ‰) with depleted (<15 ‰). Some of these isotopic values are within the range previously reported for derived from inorganic fertiliser ( from −3 to 3 ‰ and from −5 to 25 ‰), with the depending on whether the is from or in the fertiliser (Mengis et al., 2001; Wassenaar et al., 2006; Xue et al., 2009). To the best of our knowledge, however, no inorganic fertilisers have been applied at these study sites. Another potential source is derived from soil organic N, but this should have values of 0 to 10 ‰ and values of −10 to 15 ‰ (Durka et al., 1994; Mayer et al., 2001; Mengis et al., 2001; Xue et al., 2009; Baily et al., 2011). Incomplete nitrification of can result in lower than the manure source (Choi et al., 2003), but as there was no measurable NH3−N in these samples this is also unlikely. These isotope values may reflect the influence of from precipitation, which usually has values ranging from −5 to 5 ‰ for and 40 to 60 ‰ for and has been reported to dominate isotope values of groundwater under forested landscapes (Durka et al., 1994). Alternatively, they may be affected by microbial immobilisation and subsequent mineralisation and nitrification, which can mask the source in aquifers with long residence times (Mengis et al., 2001; Rivett et al., 2008).
A mixing model constrained by quantitative estimates of denitrification from isotopes substantially improved our understanding of nitrate contamination at these sites. This novel approach has the potential to be widely applied as a tool for monitoring and assessment of groundwater in complex agricultural settings. NO3−N concentrations in excess of the drinking water guideline were measured at both sites, with sources including manure piles, pens, and the EMS. Even though these sites are dominated by clay-rich glacial sediments, the input of to groundwater from temporary manure piles and pens resulted in NO3−N concentrations comparable to (or greater than) leakage from the EMS. This is attributed to the development of secondary porosity within unsaturated clays.
Nitrate attenuation at both sites is dominated by denitrification, which is evident even in wells directly adjacent to the source. In the wells for which denitrification was identified, concentrations of agriculturally derived had been reduced by at least half and, in some wells, completely. In the absence of denitrification all but one of these wells would have had NO3−N concentrations above the drinking water guideline.
These results indicate that infiltration to groundwater systems in glacial sediments where can be naturally attenuated is likely to be preferable to off-farm export via runoff or drainage networks, provided that local groundwater is not a potable water source. On-farm management of manure waste at similar operations should increasingly focus on limiting manure piles that are in direct contact with the soil to limit contamination of groundwater.
Alberta Agriculture and Forestry are the custodians of the data used in this paper.
The supplement related to this article is available online at: https://doi.org/10.5194/hess-23-1355-2019-supplement.
Investigation was carried out by SB, MI and JM with assistance from staff at AAF, NRCB and USask. SB developed the data analysis methodology and prepared the paper. All co-authors contributed to supervision, conceptualization, review and editing.
The authors declare that they have no conflict of interest.
This research was supported by Alberta Agriculture and Forestry (AAF) and
the Natural Resources Conservation Board (NRCB), who provided assistance
with field work and laboratory analysis. Funding was also provided by a
Natural Sciences and Engineering Research Council of Canada (NSERC)
Industrial Research Chair (IRC) (184573) awarded to M. Jim Hendry. The authors
thank Barry Olson at AAF for reviewing the paper. Our thanks also to the
local producers, whose cooperation made this research possible. And finally,
our thanks to Sebastien Lamontagne, Huaiwei Sun and anonymous reviewers for
their valuable comments and suggestions during the review process.
Edited by: Bill X. Hu
Reviewed by: Huaiwei Sun and three anonymous referees
Arauzo, M.: Vulnerability of groundwater resources to nitrate pollution: A simple and effective procedure for delimiting Nitrate Vulnerable Zones, Sci. Total Environ., 575, 799–812, https://doi.org/10.1016/j.scitotenv.2016.09.139, 2017.
Aravena, R., Evans, M., and Cherry, J. A.: Stable isotopes of oxygen and nitrogen in source identification of nitrate from septic systems, Groundwater, 31, 180–186, 1993.
Ascott, M. J., Gooddy, D. C., Wang, L., Stuart, M. E., Lewis, M. A., Ward, R. S., and Binley, A. M.: Global patterns of nitrate storage in the vadose zone, Nat. Commun., 8, 1416, https://doi.org/10.1038/s41467-017-01321-w, 2017.
Baily, A., Rock, L., Watson, C., and Fenton, O.: Spatial and temporal variations in groundwater nitrate at an intensive dairy farm in south-east Ireland: Insights from stable isotope data, Agr. Ecosyst. Environ., 144, 308–318, 2011.
Baram, S., Kurtzman, D., and Dahan, O.: Water percolation through a clayey vadose zone, J. Hydrol., 424–425, 165–171, https://doi.org/10.1016/j.jhydrol.2011.12.040, 2012.
Böhlke, J. K. and Denver, J. M.: Combined use of groundwater dating, chemical, and isotopic analyses to resolve the history and fate of nitrate contamination in two agricultural watersheds, Atlantic Coastal Plain, Maryland, Water Resour. Res., 31, 2319–2339, https://doi.org/10.1029/95WR01584, 1995.
Böttcher, J., Strebel, O., Voerkelius, S., and Schmidt, H. L.: Using isotope fractionation of nitrate-nitrogen and nitrate-oxygen for evaluation of microbial denitrification in a sandy aquifer, J. Hydrol., 114, 413–424, https://doi.org/10.1016/0022-1694(90)90068-9, 1990.
Bourke, S. A., Cook, P. G., Dogramaci, S., and Kipfer, R.: Partitioning sources of recharge in environments with groundwater recirculation using carbon-14 and CFC-12, J. Hydrol., 525, 418–428, 2015a.
Bourke, S. A., Turchenek, J., Schmeling, E. E., Mahmood, F. N., Olson, B. M., and Hendry, M. J.: Comparison of continuous core profiles and monitoring wells for assessing groundwater contamination by agricultural nitrate, Ground Water Monit. Remediat., 35, 110–117, 2015b.
Choi, W.-J., Lee, S.-M., and Ro, H.-M.: Evaluation of contamination sources of groundwater using nitrogen isotope data: A review, Geosci. J., 7, 81–87, 2003.
Clague, J. C., Stenger, R., and Clough, T. J.: Evaluation of the stable isotope signatures of nitrate to detect denitrification in a shallow groundwater system in New Zealand, Agr. Ecosyst. Environ., 202, 188–197, https://doi.org/10.1016/j.agee.2015.01.011, 2015.
Clark, I. D. and Fritz, P.: Environmental Isotopes in Hydrogeology, CRC Press, Boca Raton, Florida, 1997.
Critchley, K., Rudolph, D., Devlin, J., and Schillig, P.: Stimulating in situ denitrification in an aerobic, highly permeable municipal drinking water aquifer, J. Contam. Hydrol., 171, 66–80, 2014.
Deutsch, B., Mewes, M., Liskow, I., and Voss, M.: Quantification of diffuse nitrate inputs into a small river system using stable isotopes of oxygen and nitrogen in nitrate, Org. Geochem., 37, 1333–1342, https://doi.org/10.1016/j.orggeochem.2006.04.012, 2006.
Dogramaci, S., Skrzypek, G., Dodson, W., and Grierson, P. F.: Stable isotope and hydrochemical evolution of groundwater in the semi-arid Hamersley Basin of subtropical northwest Australia, J. Hydrol., 475, 281–293, https://doi.org/10.1016/j.jhydrol.2012.10.004, 2012.
Durka, W., Schulze, E.-D., Gebauer, G., and Voerkeliust, S.: Effects of forest decline on uptake and leaching of deposited nitrate determined from 15N and 18O measurements, Nature, 372, 765–767, 1994.
Ernstsen, V., Olsen, P., and Rosenbom, A. E.: Long-term monitoring of nitrate transport to drainage from three agricultural clayey till fields, Hydrol. Earth Syst. Sci., 19, 3475–3488, https://doi.org/10.5194/hess-19-3475-2015, 2015.
Fan, A. M. and Steinberg, V. E.: Health implications of nitrate and nitrite in drinking water: An update on methemoglobinemia occurrence and reproductive and developmental toxicity, Regul. Toxicol. Pharmacol., 23, 35–43, https://doi.org/10.1006/rtph.1996.0006, 1996.
Fukada, T., Kisock, K. M., Dennis, P. F., and Grischek, T.: A dual isotope approach to identify denitrification in groundwater at a river-bank infiltration site, Water Res., 37, 3070–3078, 2003.
Galloway, J. N., Townsend, A. R., Erisman, J. W., Bekunda, M., Cai, Z., Freney, J. R., Martinelli, L. A., Seitzinger, S. P., and Sutton, M. A.: Transformation of the nitrogen cycle: Recent trends, questions, and potential solutions, Science, 320, 889–892, https://doi.org/10.1126/science.1136674, 2008.
Granger, J., Sigman, D. M., Lehmann, M. F., and Tortell, P. D.: Nitrogen and oxygen isotope fractionation during dissimilatory nitrate reduction by denitrifying bacteria, Limnol. Oceanogr., 53, 2533–2545, https://doi.org/10.4319/lo.2008.53.6.2533, 2008.
Green, C. T., Böhlke, J. K., Bekins, B. A., and Phillips, S. P.: Mixing effects on apparent reaction rates and isotope fractionation during denitrification in a heterogeneous aquifer, Water Resour. Res., 46, W08525, https://doi.org/10.1029/2009WR008903, 2010.
Gulis, G., Czompolyova, M., and Cerhan, J. R.: An ecologic study of nitrate in municipal drinking water and cancer incidence in Trnava District, Slovakia, Environ. Res., 88, 182–187, https://doi.org/10.1006/enrs.2002.4331, 2002.
Hautman, D. P. and Munch, D. J.: Method 300.1 Determination of inorganic anions in drinking water by ion chromatography, US Environmental Protection Agency, Cincinnati, OH, 1997.
Hendry, M. J., McCready, R. G., and Gould, W. D.: Distribution and evolution of nitrate in a glacial till of sourther Alberta, Canada, J. Hydrol., 70, 177–198, 1984.
Hendry, M. J., Barbour, S. L., Novakowski, K., and Wassenaar, L. I.: Paleohydrogeology of the Cretaceous sediments of the Williston Basin using stable isotopes of water, Water Resour. Res., 49, 4580–4592, 2013.
Hvorslev, M. J.: Time Lag and Soil Permeability in Ground-Water Observations, Bull. No. 36, Waterways Exper. Sta. Corps of Engrs, US Army, Vicksburg, Mississippi, 1–50, 1951.
Ji, X., Runtin, X., Hao, Y., and Lu, J.: Quantitative identification of nitrate pollution sources and uncertainty analysis based on dual isotope approach in an agricultural watershed, Environ. Poll., 229, 586–594, 2017.
Joerin, C., Beven, K. J., Iorgulescu, I., and Musy, A.: Uncertainty in hydrograph separations based on geochemical mixing models, J. Hydrol., 255, 90–106, 2002.
Katz, B. G., Chelette, A. R., and Pratt, T. R.: Use of chemical and isotopic tracers to assess nitrate contamination and ground-water age, Woodville Karst Plain, USA, J. Hydrol., 289, 36–61, https://doi.org/10.1016/j.jhydrol.2003.11.001, 2004.
Kaushal, S. S., Groffman, P. M., Band, L. E., Elliott, E. M., Shields, C. A., and Kendall, C.: Tracking nonpoint source nitrogen pollution in human-impacted watersheds, Environ. Sci. Technol., 45, 8225–8232, https://doi.org/10.1021/es200779e, 2011.
Kendall, C. and Aravena, R.: Nitrate isotopes in groundwater systems, in: Environmental Tracers in Subsurface Hydrology, edited by: Cook, P. and Herczeg, A., Springer US, Boston, MA, 261–297, 2000.
Kimble, J. M., Bartlett, R. J., McIntosh, J. L., and Varney, K. E.: Fate of nitrate from manure and inorganic nitrogen in a clay soil cropped to continuous corn, J. Environ. Qual., 1, 413–415, https://doi.org/10.2134/jeq1972.00472425000100040017x, 1972.
Kohn, J., Soto, D. X., Iwanyshyn, M., Olson, B., Kalischuk, A., Lorenz, K., and Hendry, M. J.: Groundwater nitrate and chloride trends in an agriculture-intensive area in southern Alberta, Canada, Water Qual. Res. J., 51, 47–59, https://doi.org/10.2166/wqrjc.2015.132, 2016.
Komor, S. C. and Anderson, H. W.: Nitrogen isotopes as indicators of nitrate sources in Minnesota sand-plain aquifers, Ground Water, 31, 260–270, 1993.
Lentz, R. D. and Lehrsch, G. A.: Temporal changes in δ15N− and δ18O of nitrate nitrogen and H2O in shallow groundwater: Transit time and nitrate-source implications for an irrigated tract in southern Idaho, Agric. Water Manage., 212, 126–135, 2019.
Liu, C.-Q., Li, S.-L., Lang, Y.-C., and Xiao, H.-Y.: Using δ15N- and δ18O-values to identify nitrate sources in karst ground water, Guiyang, Southwest China, Environ. Sci. Technol., 40, 6928–6933, 2006.
Lorenz, K., Iwanyshyn, M., Olson, B., Kalischuk, A., and Pentland, J. (Eds.): Livestock Manure Impacts on Groundwater Quality in Alberta Project 2008 to 2015: 2008 to 2011 Progress Report, Alberta Agriculture and Rural Development, Lethbridge, Alberta, Canada, 316 pp., 2014.
Mariotti, A., Landreau, A., and Simon, B.: 15N isotope biogeochemistry and natural denitrification process in groundwater: Application to the chalk aquifer of northern France, Geochim. Cosmochim. Ac., 52, 1869–1878, 1988.
Mayer, B., Bollwerk, S. M., Mansfeldt, T., Hütter, B., and Veizer, J.: The oxygen isotope composition of nitrate generated by nitrification in acid forest floors, Geochim. Cosmochim. Ac., 65, 2743–2756, 2001.
McCallum, J. E., Ryan, M. C., Mayer, B., and Rodvang, S. J.: Mixing-induced groundwater denitrification beneath a manured field in southern Alberta, Canada, Appl. Geochem., 23, 2146–2155, 2008.
McMahon, P. B., Böhlke, J. K., and Christenson, S. C.: Geochemistry, radiocarbon ages, and paleorecharge conditions along a transect in the central High Plains aquifer, southwestern Kansas, USA, Appl. Geochem., 19, 1655–1686, 2004.
Menció, A., Mas-Pla, J., Otero, N., Regàs, O., Boy-Roura, M., Puig, R., Bach, J., Domènech, C., Zamorano, M., Brusi, D., and Folch, A.: Nitrate pollution of groundwater; all right …, but nothing else?, Sci. Total Environ., 539, 241–251, 2016.
Mengis, M., Schif, S. L., Harris, M., English, M. C., Aravena, R., Elgood, R. J., and MacLean, A.: Multiple geochemical and isotopic approaches for assessing ground water NO3− elimination in a riparian zone, Ground Water, 37, 448–457, 1999.
Mengis, M., Walther, U., Bernasconi, S. M., and Wehrli, B.: Limitations of using δ18O for the source identification of nitrate in agricultural soils, Environ. Sci. Technol., 35, 1840–1844, 2001.
Otero, N., Torrentó, C., Soler, A., Menció, A., and Mas-Pla, J.: Monitoring groundwater nitrate attenuation in a regional system coupling hydrogeology with multi-isotopic methods: The case of Plana de Vic (Osona, Spain), Agr. Ecosyst. Environ., 133, 103–113, 2009.
Pastén-Zapata, E., Ledesma-Ruiz, R., Harter, T., Ramírez, A. I., and Mahlknecht, J.: Assessment of sources and fate of nitrate in shallow groundwater of an agricultural area by using a multi-tracer approach, Sci. Total Environ., 470–471, 855–864, 2014.
Pauwels, H., Foucher, J.-C., and Kloppmann, W.: Denitrification and mixing in a schist aquifer: Influence on water chemistry and isotopes, Chem. Geol., 168, 307–324, 2000.
Power, J. F. and Schepers, J. S.: Nitrate contamination of groundwater in North America, Agr. Ecosyst. Environ., 26, 165–187, 1989.
Rivett, M. O., Buss, S. R., Morgan, P., Smith, J. W., and Bemment, C. D.: Nitrate attenuation in groundwater: A review of biogeochemical controlling processes, Water Res., 42, 4215–4232, 2008.
Robertson, W., Russell, B., and Cherry, J.: Attenuation of nitrate in aquitard sediments of southern Ontario, J. Hydrol., 180, 267–281, 1996.
Rodvang, S. and Simpkins, W.: Agricultural contaminants in Quaternary aquitards: A review of occurrence and fate in North America, Hydrogeol. J., 9, 44–59, 2001.
Rodvang, S. , Schmidt-Bellach, R., and Wassenaar, L. : Nitrate in groundwater below irrigated fields, Alberta Agriculture, Food and Rural Development, Alberta, 1998.
Rodvang, S., Mikalson, D., and Ryan, M.: Changes in ground water quality in an irrigated area of southern Alberta, J. Environ. Qual., 33, 476–487, 2004.
Saffigna, P. G. and Keeney, D. R.: Nitrate and chloride in ground water under irrigated agriculture in central Wisconsin, Ground Water, 15, 170–177, 1977.
Showers, W. J., Genna, B., McDade, T., Bolich, R., and Fountain, J. C.: Nitrate contamination in groundwater on an urbanized dairy farm, Environ. Sci. Technol., 42, 4683–4688, https://doi.org/10.1021/es071551t, 2008.
Sigman, D. M., Casciotti, K. L., Andreani, M., Barford, C., Galanter, M., and Böhlke, J. K.: A bacterial method for the nitrogen isotopic analysis of nitrate in seawater and freshwater, Anal. Chem., 73, 4145–4153, https://doi.org/10.1021/ac010088e, 2001.
Singleton, M., Esser, B., Moran, J., Hudson, G., McNab, W., and Harter, T.: Saturated zone denitrification: Potential for natural attenuation of nitrate contamination in shallow groundwater under dairy operations, Environ. Sci. Technol., 41, 759–765, 2007.
Smith, R. L., Garabedian, S. P., and Brooks, M. H.: Comparison of denitrification activity measurements in groundwater using cores and natural-gradient tracer tests, Environ. Sci. Technol., 30, 3448–3456, 1996.
Spalding, R. F. and Exner, M. E.: Occurrence of nitrate in groundwater – A review, J. Environ. Qual., 22, 392–402, 1993.
Spalding, R. F. and Parrott, J. D.: Shallow groundwater denitrification, Sci. Total Environ., 141, 17–25, 1994.
Tesoriero, A. J., Liebscher, H., and Cox, S. E.: Mechanism and rate of denitrification in an agricultural watershed: Electron and mass balance along groundwater flow paths, Water Resour. Res., 36, 1545–1559, 2000.
Turkeltaub, T., Kurtzman, D., and Dahan, O.: Real-time monitoring of nitrate transport in the deep vadose zone under a crop field – Implications for groundwater protection, Hydrol. Earth Syst. Sci., 20, 3099–3108, https://doi.org/10.5194/hess-20-3099-2016, 2016.
Vavilin, V. A. and Rytov, S. V.: Nitrate denitrification with nitrite or nitrous oxide as intermediate products: Stoichiometry, kinetics and dynamics of stable isotope signatures, Chemosphere, 134, 417–426, 2015.
Vitòria, L., Soler, A., Canals, À., and Otero, N.: Environmental isotopes (N, S, C, O, D) to determine natural attenuation processes in nitrate contaminated waters: Example of Osona (NE Spain), Appl. Geochem., 23, 3597–3611, 2008.
Vogel, J. C., Talma, A. S., and Heaton, T. H. E.: Gaseous nitrogen as evidence for denitrification in groundwater, J. Hydrol., 50, 191–200, 1981.
Wassenaar, L. I.: Evaluation of the origin and fate of nitrate in the Abbotsford Aquifer using the isotopes of 15N and 18O in , Appl. Geochem., 10, 391–405, 1995.
Wassenaar, L. I., Hendry, M. J., and Harrington, N.: Decadal geochemical and isotopic trends for nitrate in a transboundary aquifer and implications for agricultural beneficial management practices, Environ. Sci. Technol., 40, 4626–4632, 2006.
Weil, R. R., Weismiller, R. A., and Turner, R. S.: Nitrate contamination of groundwater under irrigated coastal plain soils, J. Environ. Qual., 19, 441–448, https://doi.org/10.2134/jeq1990.00472425001900030015x, 1990.
Xu, S., Kang, P., and Sun, Y.: A stable isotope approach and its application for identifying nitrate source and transformation process in water, Environ. Sci. Pollut. Res., 23, 1133–1148, 2015.
Xue, D., Botte, J., De Baets, B., Accoe, F., Nestler, A., Taylor, P., Van Cleemput, O., Berglund, M., and Boeckx, P.: Present limitations and future prospects of stable isotope methods for nitrate source identification in surface-and groundwater, Water Res., 43, 1159–1170, 2009.
Yang, C.-Y., Wu, D.-C., and Chang, C.-C.: Nitrate in drinking water and risk of death from colon cancer in Taiwan, Environ. Int., 33, 649–653, https://doi.org/10.1016/j.envint.2007.01.009, 2007.
Zirkle, K. W., Nolan, B. T., Jones, R. R., Weyer, P. J., Ward, M. H., and Wheeler, D. C.: Assessing the relationship between groundwater nitrate and animal feeding operations in Iowa (USA), Sci. Total Environ., 566–567, 1062–1068, 2016.