the Creative Commons Attribution 4.0 License.
the Creative Commons Attribution 4.0 License.
 | 19 Mar 2019
Projected decrease in wintertime bearing capacity on different forest and soil types in Finland under a warming climate
Ari Venäläinen
Matti Kämäräinen
Antti Asikainen
Juha Laitila
Perttu Anttila
Heli Peltola
Trafficability in forest terrain is controlled by ground-bearing capacity, which is crucial from the timber harvesting point of view. In winter, soil frost affects the most the bearing capacity, especially on peatland soils which have in general low bearing capacity. Ground frost similarly affects the bearing capacity of forest truck roads. A 20 cm thick layer of frozen soil or 40 cm thick layer of snow on the ground may already be sufficient for heavy forest harvesters. In this work, we studied the impacts of climate change on soil frost conditions and, consequently, on ground-bearing capacity from the timber harvesting point of view. The number of days with good wintertime bearing capacity was modelled by using a soil temperature model with a snow accumulation model and wide set of downscaled climate model data until the end of the 21st century. The model was calibrated for different forest and soil types. The results show that by the mid-21st century, the conditions with good bearing capacity will decrease in wintertime in Finland, most likely by about 1 month. The decrease in soil frost and wintertime bearing capacity will be more pronounced during the latter half of the century, when drained peatlands may virtually lack soil frost in most of winters in southern and western Finland. The projected decrease in the bearing capacity, accompanied with increasing demand for wood harvesting from drained peatlands, induces a clear need for the development of sustainable and resource-efficient logging practices for drained peatlands. This is also needed to avoid unnecessary harvesting damages, like rut formation on soils and damage to tree roots and stems.
- Article
(13171 KB) -
Supplement
(153 KB) - BibTeX
- EndNote


Forests are the most important natural resource in Finland (Finnish Forest Research Institute, 2011). In 2016 the annual harvested volume of round wood in the country reached a new national record of 70 million m3 (Natural Resources Institute Finland, 2017a, b). Pressure exists to increase this volume up to 80 million m3 within the next couple of decades to meet the increasing wood demand in the growing bioeconomy sector (Ministry of Employment and the Economy et al., 2014; Asikainen et al., 2016). Preferably, the wood harvesting should be increased throughout the year to ensure continuous supply of raw material for wood using industry. This may be challenging due to differences in bearing capacity of forest soils with varying soil types and weather conditions.
Traditionally, in Finland, logging has been mainly conducted during winter months. Still, nowadays, approximately 60 % of logging is carried out while the soil is frozen (Finnish Forest Research Institute, 2014). This is because the bearing capacity of forest sites is clearly higher during frozen than unfrozen soil conditions. A 20 cm thick layer of frozen soil or 40 cm thick layer of snow can already bear standard machines used in forest harvesting that weigh 15–30 t (Eeronheimo, 1991; Kokkila, 2013). Small forest truck roads having light foundations also do not bear heavy timber trucks in wet road sections unless the soil is frozen (Kaakkurivaara et al., 2015). Multiple passes of a harvester and a loaded forwarder may cause ruts on the forest floor (Suvinen, 2006; Sirén et al., 2013; Pohjankukka et al., 2016). Operations in poorly bearing conditions increase this rut formation and damage caused to tree roots and stems as well as time and fuel consumption in the harvesting (Sirén et al., 2013; Pohjankukka et al., 2016). Furthermore, the condition of the road network affects to the fuel consumption in timber transportation (Svenson and Fjeld, 2016).
More than half of the original peat bog area in Finland was drained for forestry mainly during the 1960s and 1970s (Simola et al., 2012). Consequently, peatlands consist nowadays of one-third of the Finnish forestry area and one-fourth of the growing stock volume (Ala-Ilomäki et al., 2011). In increasing the wood harvesting, more intensive utilization of drained peatland forests has the largest potential (Ala-Ilomäki et al., 2011) because of a pronounced reduction in suitable logging sites on upland (mineral) soils (Uusitalo and Ala-Ilomäki, 2013). However, more intensive utilization of peatlands is a controversial issue. Peatlands representing sensitive forest sites are generally characterized by the most difficult forest harvesting conditions (Nugent et al., 2003; Uusitalo and Ala-Ilomäki, 2013; Uusitalo et al., 2015a). Moreover, in addition to the increasing demand in wood harvesting from drained peatlands, pressure exists to restore drained peatlands to their natural state in order to maintain biodiversity and prevent carbon loss and nitrous oxide emissions from peatlands (Komulainen et al., 1999; Carroll et al., 2011; Pitkänen et al., 2013; Pärn et al., 2018).
The difficult harvesting conditions in drained peatlands are because of their inherently low ground-bearing capacity. Thus, logging there is generally conducted during winter, when the soil is frozen (Ala-Ilomäki et al., 2011). Nevertheless, soil frost periods are shorter in drained peatlands than in upland forest sites because of the insulating effect of peat compared to upland (mineral) soils. In addition, ditch networks form obstacles for vehicles in peatlands. They are neither typically located next to the forest truck roads, and trees are characterized by small size, uneven distribution and superficial roots (Laitila et al., 2013). Hence, wood harvesting in drained peatlands is in general less cost efficient than in upland forest sites (Ala-Ilomäki et al., 2011). Determined efforts are thus required to prolong the wood harvesting season from drained peatlands. This would provide an opportunity to increase the annual harvesting volume and confine seasonal variations in harvesting.
During the forthcoming decades, climate has been projected to become warmer due to the anthropogenic climate change (Collins et al., 2013; Knutti and Sedláček, 2013). The climate warming is expected to be pronounced in high latitudes like in Finland (Räisänen and Ylhäisi, 2015; Ruosteenoja et al., 2016). Previous studies have indicated that the climate warming leads, unsurprisingly, to reduced soil frost depth and shorter soil frost periods (e.g. Venäläinen et al., 2001a, b; Kellomäki et al., 2010; Gregow et al., 2011; Jungqvist et al., 2014). This may shorten the winter harvesting season with good ground-bearing capacity, particularly on drained peatlands, having thus mainly negative impacts on the forestry sector. Thus, comprehensive understanding of expected changes in soil frost conditions is utmost important as these changes affect wood harvesting conditions and transport availability. This is also needed to develop logging practices that are at the same time both sustainable and cost-efficient and meet the required increase in wood supply for the bioeconomy and climate change mitigation goals.
There are several models designed for calculation of soil temperatures (e.g. Yin and Arp, 1993; Rankinen et al., 2004; Jansson, 2012; Barrere et al., 2017; Park et al., 2017). In principle, the models approximate the solutions of differential equations describing water and heat flow. In conjunction with climate model data, these models can be utilized in evaluating the climate change impacts on soil temperature and frost conditions (e.g. Sinha and Cherkauer, 2010; Houle et al., 2012; Jungqvist et al., 2014; Oni et al., 2017). In addition to air temperature, the soil frost formation is affected by soil properties like heat capacity and thermal conductivity. In addition, snow, as an efficient insulator of heat flow, has large influence on soil frost. Snow depth in a spatially varying terrain varies even within short distances depending on vegetation and topography leading to variations in soil frost depth.
In this study, we used a relatively simple soil temperature model, developed originally by Rankinen et al. (2004). The only meteorological variables needed in the model calculations were daily mean air temperature and snow depth. Our objective was to study the impacts of projected climate warming by 2100 on soil frost conditions and, consequently, on bearing capacity of different forest and soil types in Finland with regard to wintertime wood harvesting conditions and transport availability on forest truck roads. We used the soil temperature model in evaluating the soil frost conditions which largely define the ground-bearing capacity in winter. The ground-bearing capacity was assumed to be good if the depth of soil frost was at least 20 cm or the depth of snow cover was at least 40 cm. First, we calibrated the model parameters by describing, for example, soil thermal conductivity and specific heat capacity of soil for different soil types based on soil temperature observations from several stations across Finland. The effect of forest density on snow cover was also taken into account. Then, we evaluated the wintertime bearing capacity in future climatic conditions by using daily data from several global and regional climate model simulations downscaled onto an approximately 10 km ×10 km grid. The used global climate model (GCM) data were extracted from the Coupled Model Intercomparison Project Phase 5 (CMIP5) database (Taylor et al., 2012), while the used regional climate model (RCM) simulations were constructed within the EURO-CORDEX project (Jacob et al., 2014). The climate simulations were extended until 2099, considering two representative concentration pathway (RCP) scenarios, RCP4.5 and RCP8.5 (van Vuuren et al., 2011). We used data from wide set of climate models under the two emission scenarios to achieve a comprehensive picture of possible future outcomes. To foster the use of our results in forestry applications, the multi-GCM data describing the bearing capacity in different forest stands over different periods has been made publicly available.
2.1 Description of soil temperature model and its parametrization and validity
2.1.1 Description of soil temperature model
Soil temperatures were calculated by using an extended version of soil temperature model originally introduced by Rankinen et al. (2004). The model is derived from the law of conservation of energy and mass, assuming constant water content in the soil. This assumption simplified the model considerably, with the expense of its validity under extremely wet and dry conditions. According to the model, soil temperature at depth ZS can be calculated as follows:
where (∘C) is the soil temperature on a previous day, TAIR (∘C) is the air temperature, Δt is the length of a time step (s), KT (W m−1 ∘C−1) is the thermal conductivity of the soil and CA (J m−3 ∘C−1) is the heat capacity of the soil. CA can be approximated as follows:
where CS (J m−3 ∘C−1) is the specific heat capacity of the soil and CICE (J m−3 ∘C−1) is the specific heat capacity due to freezing and thawing. When ∘C, the latter variable equals 0.
As Eq. (1) did not take the insulating effect of snow cover into account, the equation was extended by an empirical relationship (Rankinen et al., 2004):
where fS (m−1) is an empirical damping parameter and DS (m) is snow depth. This model assumed that there is no heat flow below the soil layer of consideration. To extend the model, Jungqvist et al. (2014) added parameters controlling the lower soil thermal conductivity KT,LOW (W m−1 ∘C−1), lower soil specific heat capacity CS,LOW (J m−3 ∘C−1), and lower soil temperature TLOW (∘C):
where Zl (m) is the depth where TLOW prevails.
We assumed TLOW to be equal to the mean 2 m air temperature of previous 365 days, and the values of parameters KT, CS, CICE, fS, KT,LOW, CS,LOW and Zl were calibrated based on soil temperature observations (see the detailed description in the Sect. 2.1.2). According to forest harvesting specialists, a 20 cm thick layer of frozen soil or 40 cm thick snow cover makes the terrain passable for heavy harvesters, even in soil types characterized by low bearing capacity (Eeronheimo, 1991). Keeping this in mind, the emphasis on calibrating the parameters was given near the surface. Moreover, the parameters controlling heat flow below the soil layer under consideration had only a negligible effect on modelled soil temperatures near the surface.
2.1.2 Parametrization of soil temperature model
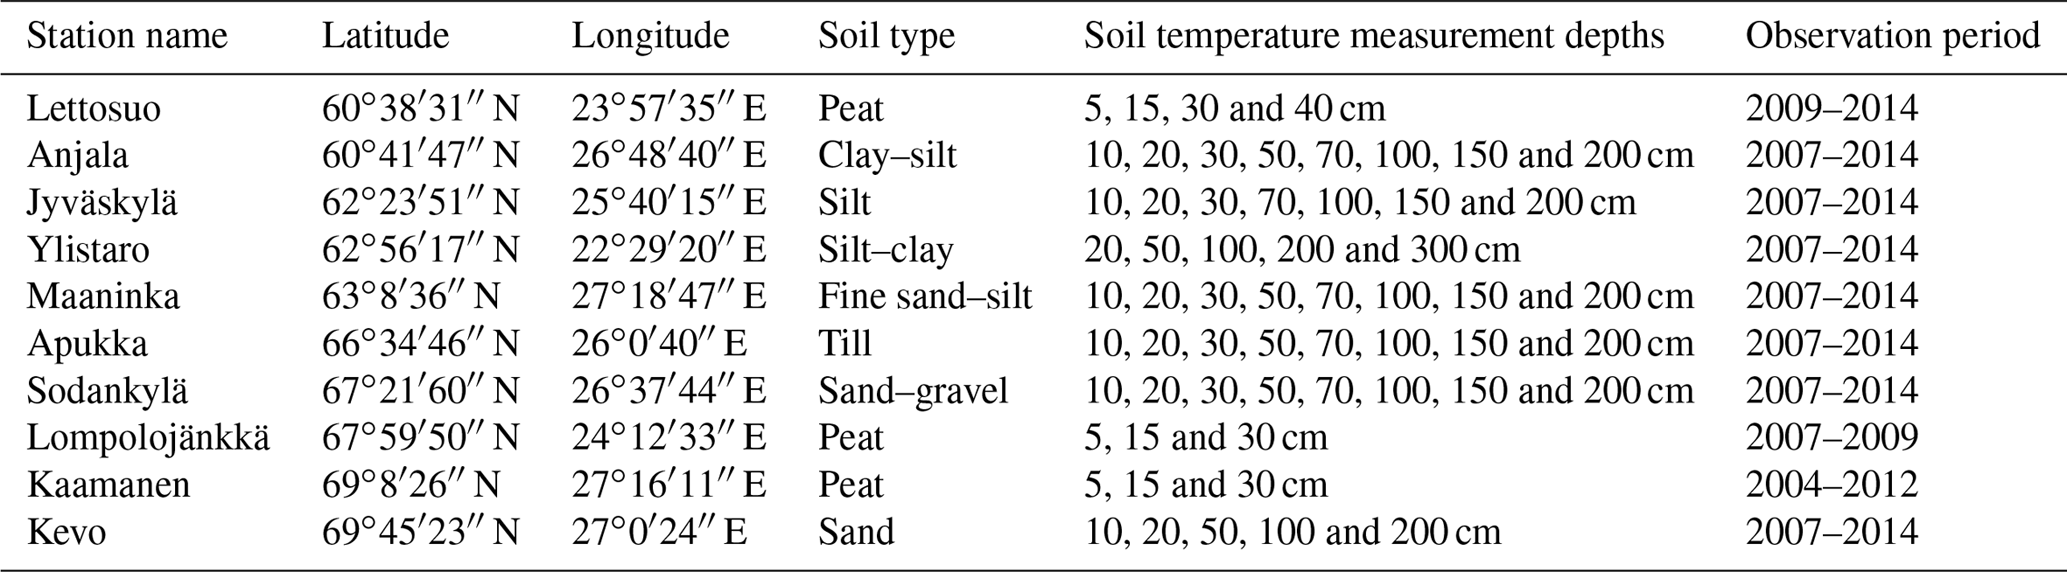
In the calibration of the parameters, we used soil temperature observations from the stations listed in Table 1. The idea was to search for typical values for the parameters in different soil types. The model was allowed to spin up for 1 year to reach thermal equilibrium in all of our calculations. Soil temperatures were measured every fifth day; except at Lettosuo (Korkiakoski et al., 2017), Apukka, Lompolojänkkä (Aurela et al., 2015) and Kaamanen (Aurela et al., 2001), the measurements were available on a daily basis. However, there were some time periods with missing data at these sites. The stations represented different soil types. The soil types were extracted from Soveri and Varjo (1977) and Heikinheimo and Fougstedt (1992), except for at the Lettosuo, Apukka, Lompolojänkkä and Kaamanen stations. According to the soil type map provided by the Geological Survey of Finland, the soil type at Apukka station is till. The Lettosuo station is situated in a drained peat bog, and the stations Lompolojänkkä and Kaamanen are located on open fen (minerotrophic peatlands). Snow depth measurements needed in the calculations were not available from Lettosuo, Lompolojänkkä and Kaamanen stations, and at these sites, snow depths measured at nearby stations were thus used in the model calibration. The replacement stations were Jokioinen for Lettosuo, Kenttärova for Lompolojänkkä and Inari for Kaamanen. Daily mean temperatures used in the model calibration were extracted from a gridded data set covering Finland (Aalto et al., 2016).
Table 1Soil temperature measurement data used in the calibration of soil temperature model.
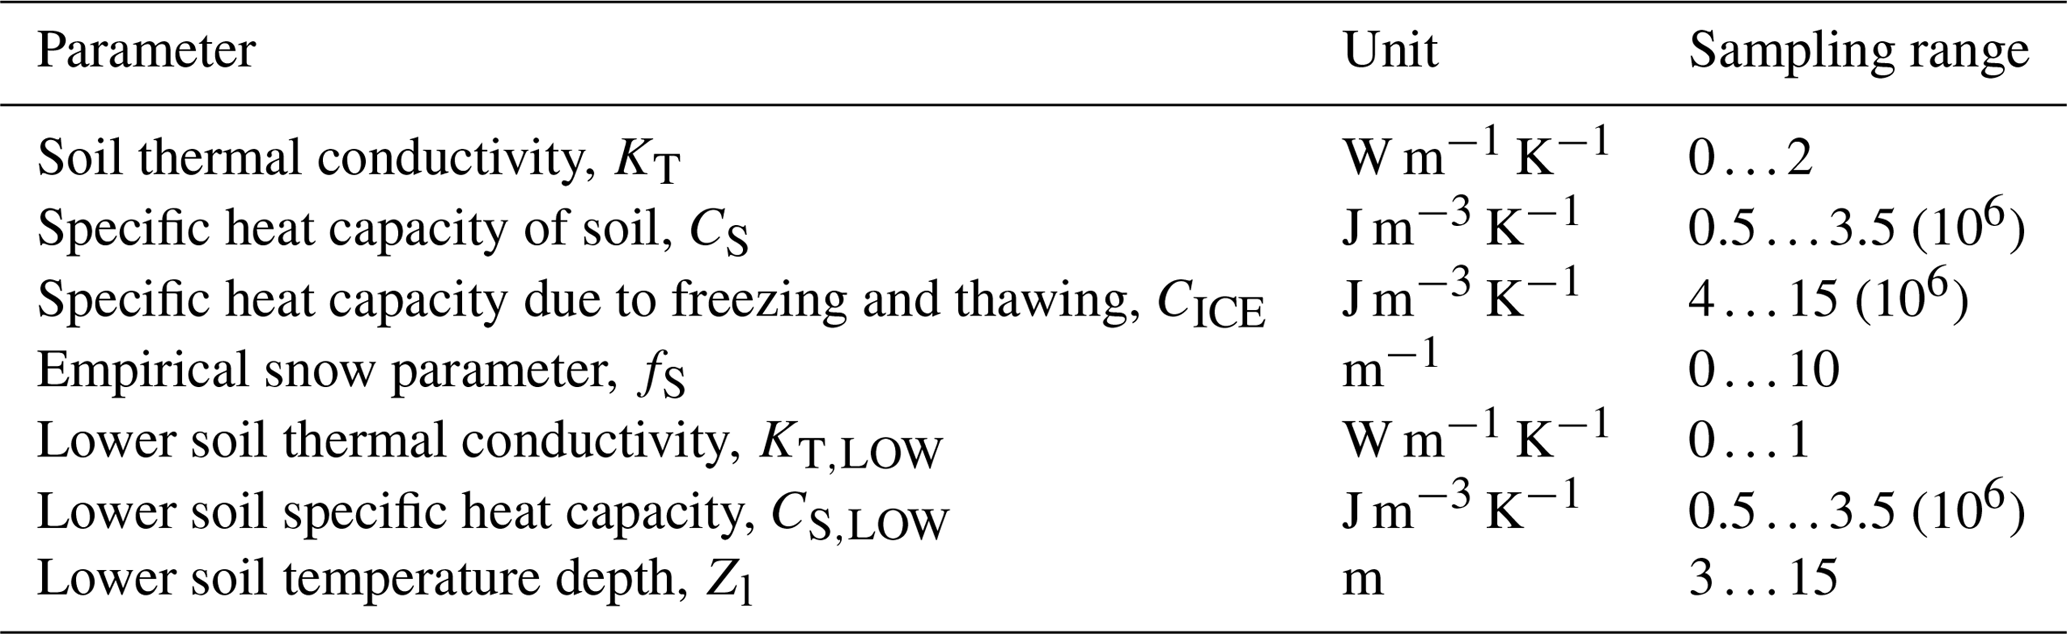
First, the parameter values were calibrated for each station and at different measurement depths using a Monte Carlo approach. The sampling ranges for the parameters (Table 2) were adopted from Jungqvist et al. (2014) but for KT the upper limit was extended from 1 to 2 W m−1 K−1 to better represent the range of soil types and measurement depths considered in our study.
Table 2Parameter ranges for the model calibration simulations.
During the first calibration round, the soil temperature model was run 10 000 times for each station and measurement depth, sampling a new set of randomized parameters for each run from the chosen parameter ranges. Then, the set of parameters indicating the highest linear correlation between the observed and modelled soil temperatures at each station and each measurement depth was selected. Supplement Table S1 shows the calibrated values with their standard deviations after the first calibration round, as averaged over all the validation stations at 10 and 20 cm depths. At this point, Zl and fS, without a clear physical connection to local soil properties, were set to their final values. Calibrated Zl values varied rather randomly within the sampling range, implying that it was only marginally important parameter. The average for calibrated Zl values over all the stations and measurement depths was 6.8 m, and Zl was set to that value. The calibrated values of fS varied between 9 and 10, with soil depths below 50 cm except at two stations. With increasing soil depth, calibrated fS values tended to generally decrease. Keeping in mind that we were most interested in the depths up to 20 cm, we set fS to 9.0.
During the second calibration round, the soil temperature model was run an additional 100 000 times with the fixed Zl and fS values while the other parameters were sampled again. After this second calibration round, all other parameters except KT were also set to their final values. KT,LOW and CS,LOW were given the same values at all depths and locations, as there was no clear relationship between their calibrated values and measurement depth or soil type, most likely because the heat flow from Zl was only marginally important compared to the heat flow from the surface, particularly near the surface. CICE was set to 11.0 J m−3 K−1, except at Sodankylä and Kevo with sandy soil, which were set to 8.0 J m−3 K−1. Calibrated CS values were mainly close to the lower limit of sampling range with depths below 100 cm, while near the surface, calibrated values were clearly higher. Thus, CS was set to depend on the soil depth following an asymmetrical sigmoid function by using the calibrated values averaged across all the stations and measurement depths.
Then, the soil temperature model was run 10 000 times again to sample only the KT values. In the final phase of the calibration, we sampled only the KT values, as KT is clearly the most sensitive parameter in the soil temperature model (Jungqvist et al., 2014). The calibrated KT values tended to increase with soil depth at each location (Fig. 1). Anjala, Sodankylä and Lettosuo stations were selected to represent clay–silt, sand and peat soil types, respectively. At these stations, there were not much variability in soil type with different depths, and calibrated KT values steadily increased with increasing soil depth. Moreover, there were no missing observation depths at these stations. For the three soil types, KT was then estimated by fitting a logistic regression curve on the calibrated values on these three representative stations (Fig. 1). The final calibrated parameters used in the soil temperature calculations describing clay–silt, sand and peat soils are listed in Table 3.
Table 3Calibrated parameters of soil temperature model for different soil types. The values of parameters are as follows: a=25.788, b=0.18029, c=0.71240, , e=2.7183, f=0.33272, g=18.231, h=0.17401, i=1.0885, , k=0.57526, l=19.217, m=0.18222, n=0.20835, o=1.8970, p=124.76, q=24.398, r=0.46356, s=0.010773 and Z= soil depth (cm).

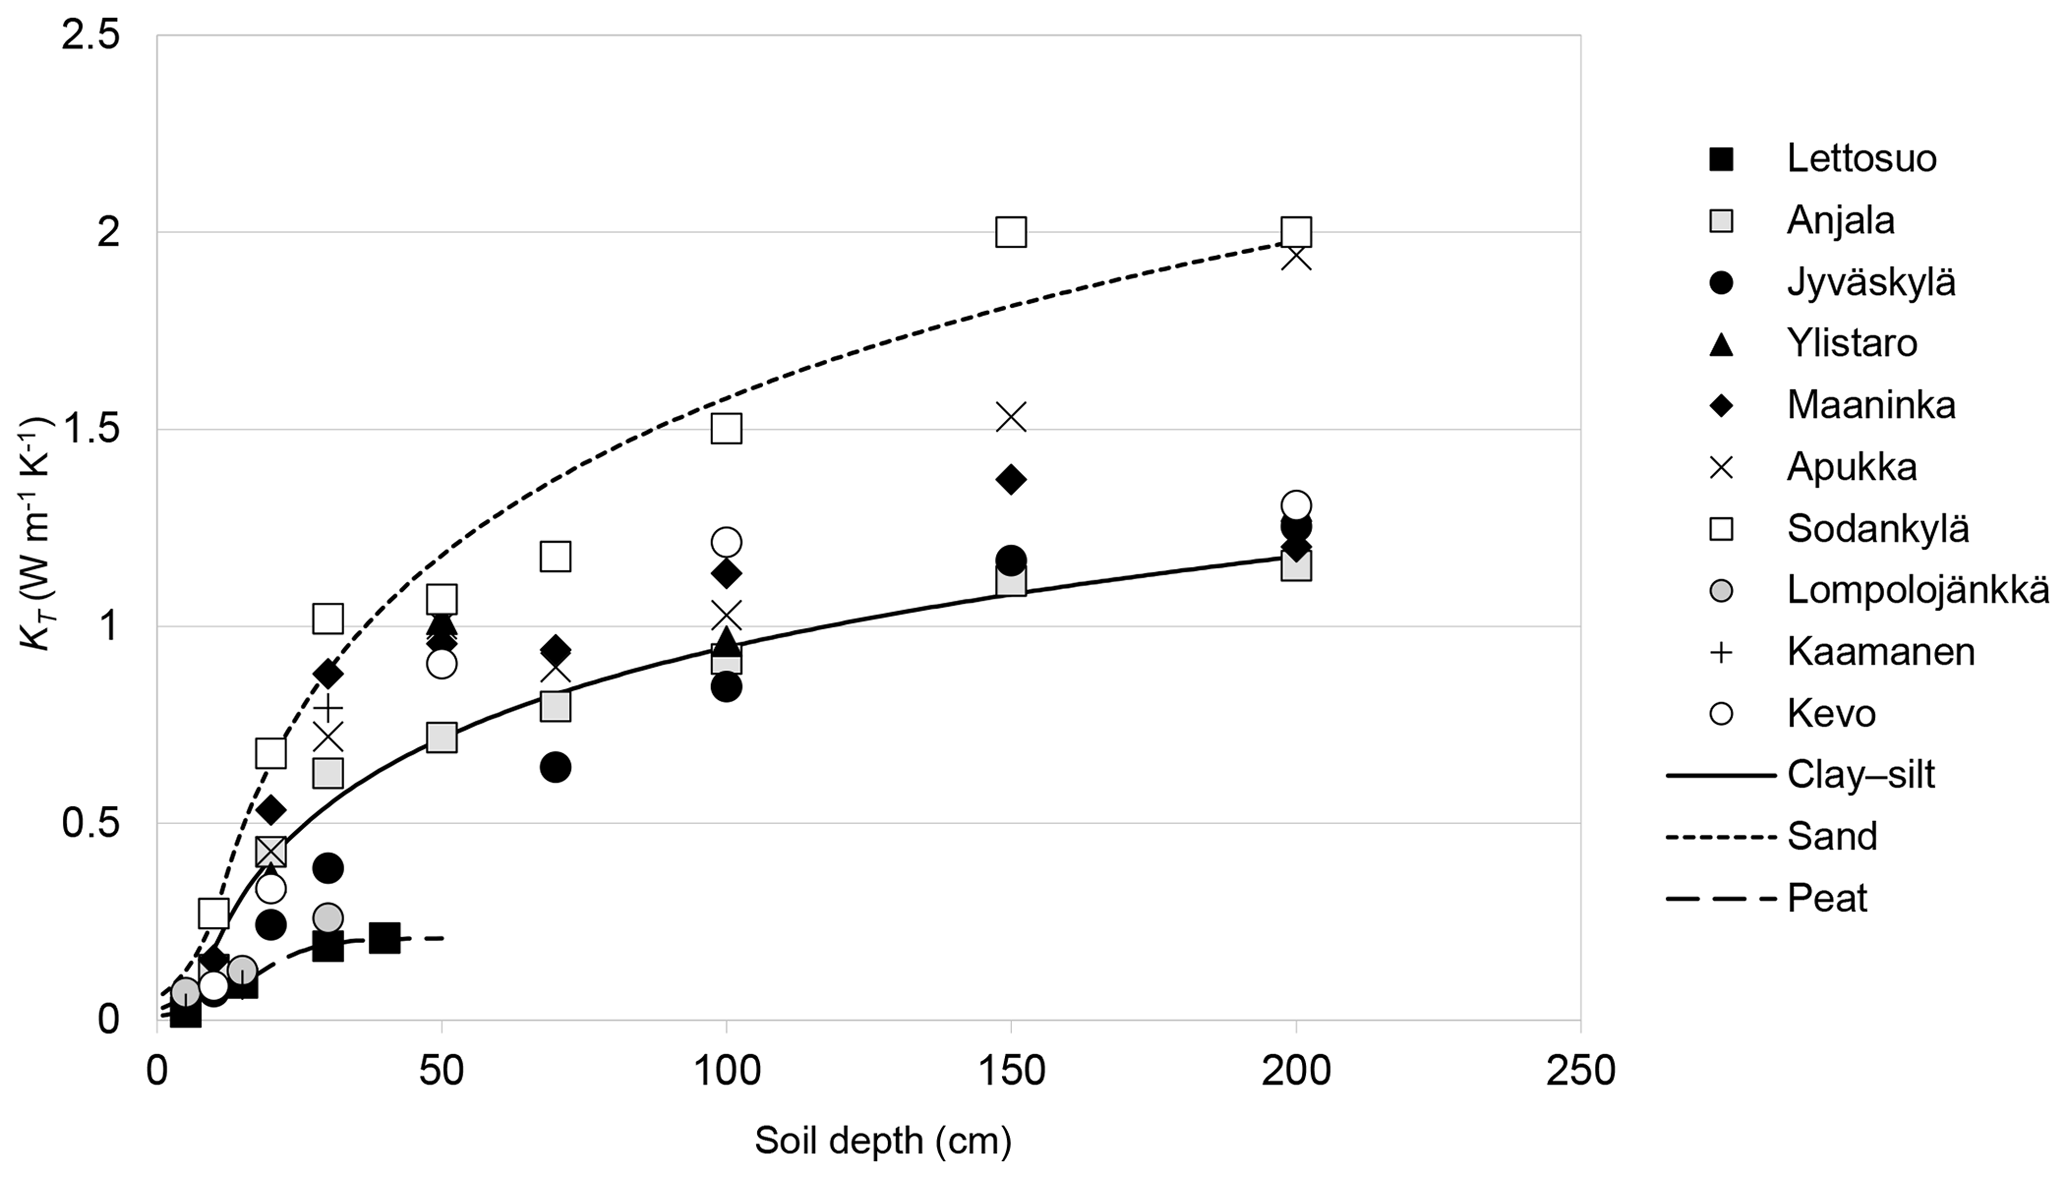
Figure 1Calibrated KT values at each soil temperature measurement site and depth. Logistic regression curves fitted to the data from Anjala, Sodankylä and Lettosuo stations and representing clay–silt, sand and peat soil types, respectively, are shown as well.
In addition, we modelled the soil frost in forest truck roads. In this case, we assumed that there is no snow on the surface, and the parameters describing soil properties were set to one-third of the weight for the parameters used to describe sandy soils and two-thirds for those describing clay–silt soils.
2.1.3 Validity of the modelled soil temperatures
Apart from the three stations (Lettosuo, Anjala and Sodankylä) used in calibration of KT in the final phase of model calibration, the modelled soil temperatures for clay–silt and sand soil types typically explained 90 %–99 % of the observed variability in soil temperatures between the depths of 20 and 100 cm (Table S2). Near the surface as well as below 1 m the modelled temperatures correlated slightly worse with the observed ones. In spite of the generally high correlations, the modelled number of days with soil temperatures below 0 ∘C were still greatly overestimated, even by more than twofold at many stations (not shown). Thus, we also tested setting the model parameters by calibrating the modelled number of days with soil temperatures below 0 ∘C, but the correlations between observed and modelled soil temperatures became clearly worse, R2 values dropping below 0.9 even at best (not shown). In order to estimate the number of days more realistically with frozen soil, we thus assumed in our model calculations that the soil does not freeze completely until the soil temperature drops below −0.1 ∘C in sand or below −0.5 ∘C in other soil types as some supercooling in the soil is needed to initiate the process of freezing (Kozlowski, 2009). For instance, in kaolinite clay, ice lenses start to form in temperatures between −0.2 and −0.3 ∘C based on experiments and theoretical calculations (Style et al., 2011). At the depth of 20 cm, this reduced the number of soil frost days only by a few days in sand but roughly by 1 month in clay–silt and approximately 1–3 months in peat. The choice of freezing points was based on a study by Soveri and Varjo (1977), who stated that the freezing point in saturated sandy soil lies between 0 and −0.15 ∘C and around −0.5 ∘C in thin clay. Based on their study, in thick clay the freezing point can be as low as −20 ∘C because the finer the soil texture is, the stronger adsorption water and capillary water bound around the soil particles by reducing the freezing point. The melting point of soil was still set to 0 ∘C in all of our calculations.
2.2 Description of snow model and its parametrization and validity
2.2.1 Description of snow model
In order to estimate the snow depth DS needed in the soil temperature calculations, we used a temperature index snow model based largely on approaches presented by Vehviläinen (1992). Meteorological variables needed in the snow depth calculations are the daily mean air temperature and daily total precipitation sum. First, the precipitation is divided into liquid and solid forms of precipitation as follows (Hankimo, 1976; Vehviläinen, 1992):
where Psolid (mm) is the amount of solid precipitation, Pliquid (mm) is the amount of liquid precipitation, Ptot (mm) is the total amount of precipitation and Tmean (∘C) is the 2 m daily mean air temperature.
The used snow model calculates the snow water equivalent (SWE) and density of snowpack. The SWE (mm) is divided into two components as follows:
where SWEnew (mm) is the amount of the SWE accumulated on the day considered and SWEold (mm) describes the amount of snowpack left from the previous day. SWEnew is calculated as follows:
where cps is a correction factor for solid precipitation and SWEinc,liq (mm) is the increase of water storage in snowpack due to liquid precipitation. SWEinc,liq is limited by the water retention capacity of snowpack (WH), which is proportional to the total amount of snowpack and is thus determined as follows:
where a is an empirical coefficient. SWEinc,liq is furthermore defined as follows:
A decrease in the SWE is caused both by evaporation from snowpack and by melting. Snowmelt is caused by thaw and liquid precipitation. Rainfall affects snowmelt directly by heating snowpack but, more importantly, also by creating drains in the snowpack and accelerating the ripening process of snow cover. SWEold is then calculated as follows:
where km (mm ∘C−1 d−1) is a degree-day factor, tm (∘C) is the threshold air temperature for snowmelt, pm (∘C−1 d−1) is a melt factor related to liquid precipitation and ev (mm d−1) is evaporation from snowpack. The degree-day factor km is calculated as follows (Anderson, 1973):
where kmax (mm ∘C−1 d−1) is the degree-day factor on 21 June, kmin (mm ∘C−1 d−1) is the degree-day factor on 21 December and N is the day number beginning on 21 March.
Density of snow is calculated separately for new and old snow. Density of freshly fallen snow (ρs,new) is calculated as follows:
where b (kg m−3 ∘C−1) and c (kg m−3) are empirical coefficients and (kg m−3) is the minimum possible density of freshly fallen snow.
Density of old snow (ρs,old) is increased due to aging, thawing and liquid precipitation and is thus calculated as follows:
where (kg m−3) is the density of snowpack on a previous day, ρs,inc (kg m−3 d−1) is the density increment due to aging and thawing of snowpack, (kg m−3 mm−1 d−1) is the density increment due to liquid precipitation, and (kg m−3) is the maximum possible density of snowpack. ρs,inc (kg m−3 d−1) is defined as follows:
where (kg m−3 d−1) is a coefficient defining the density increment of snowpack due to aging and (kg m−3 ∘C−1 d−1) is a coefficient related to the density increment of snowpack due to thawing.
Finally, DS (m) is calculated as follows:
2.2.2 Parametrization of snow model
Parameters for the snow model were calibrated in a similar manner as for the soil temperature model. We randomly sampled 10 000 times the parameters a, b, c, cps, tm, pm, ev, kmax, kmin, , , , and from the parameter ranges shown in Table 4. Then, the model was run with each of these 10 000 set of parameters for the seven stations with soil temperature observations covering the period 2007–2014 (Table 1). The snow model was run over the period 1961–2014 by using the Finnish gridded climate data (Aalto et al., 2016), and the period 2006–2014 was used as the calibration period for the snow model. We minimized the root-mean-square error (RMSE) between modelled and observed snow depths on the stations during the calibration period by selecting the set of parameters indicating the smallest RMSE on each station. Then, the calibrated parameters were averaged among all the seven stations to give the final parameters for the snow model (Table 4). Exceptions were kmax and kmin, which seemed to show a latitudinal dependence as expected. These parameters were thus approximated by latitudinally dependent exponent functions.
Table 4Parameter ranges for snow model calibration and the calibrated parameter values.
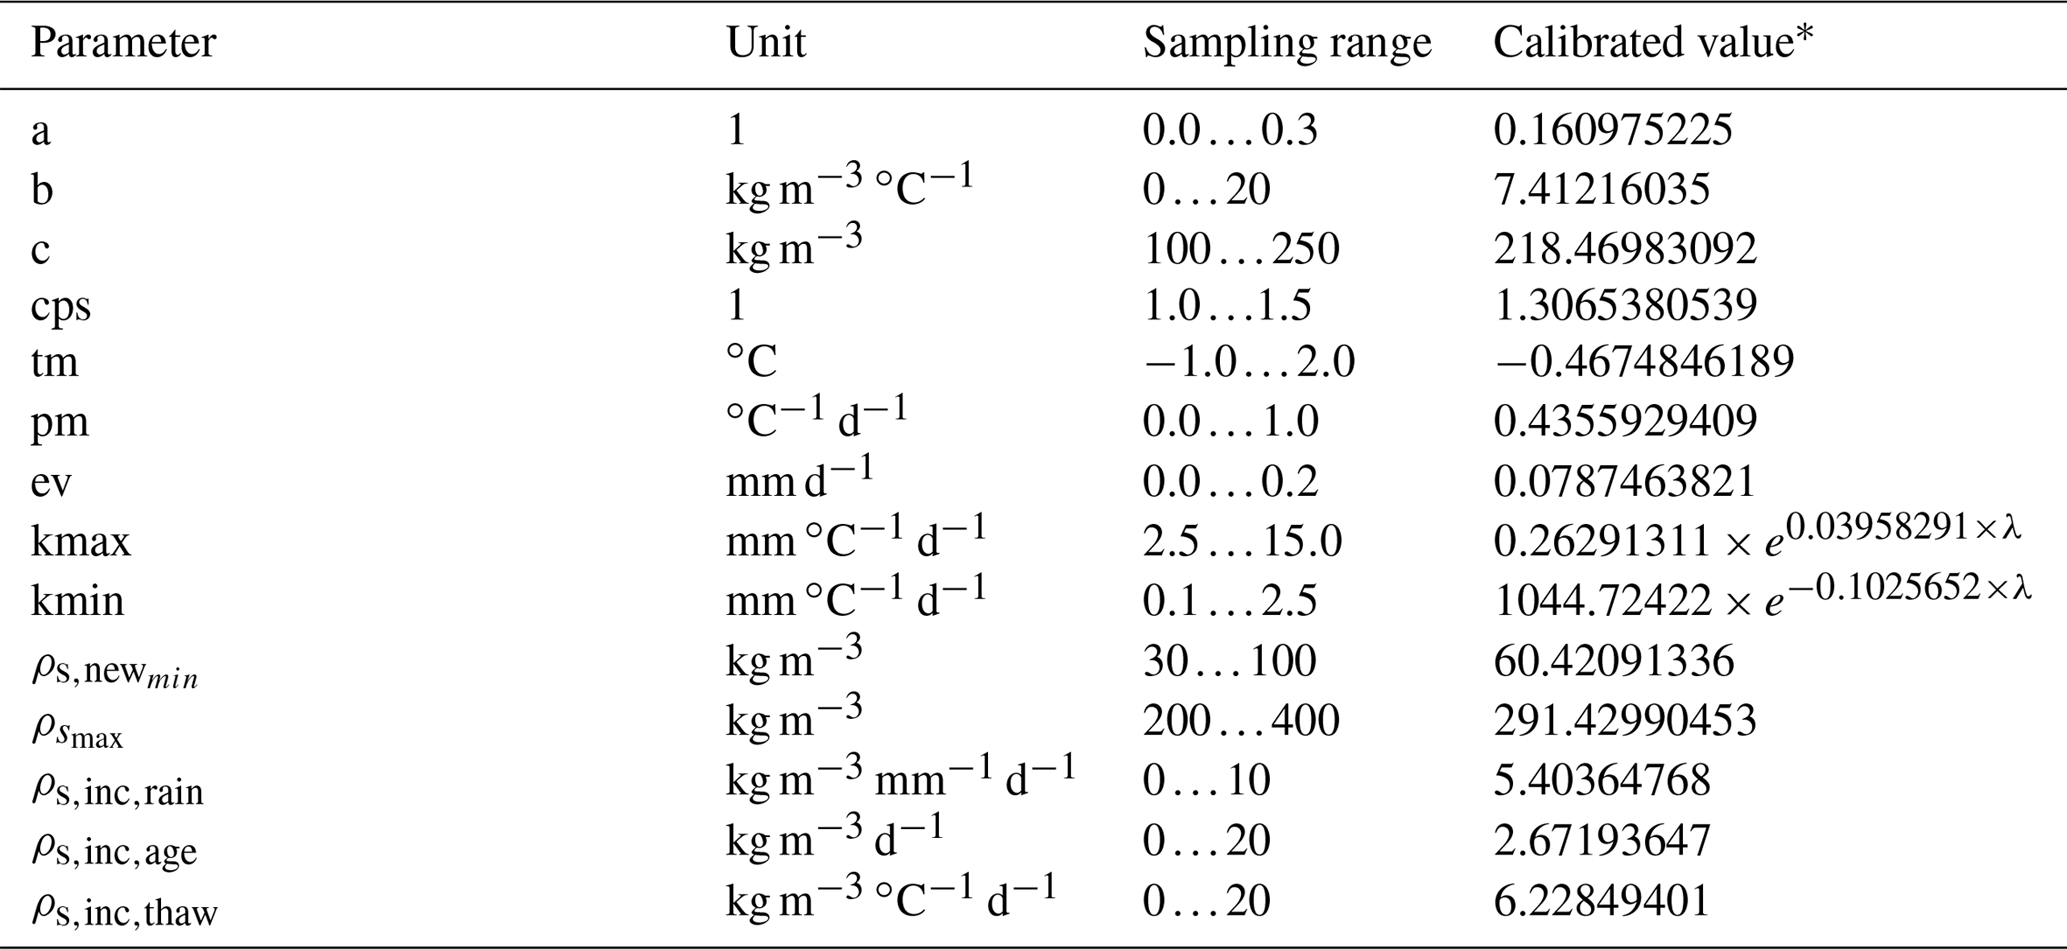
. λ is latitude in degrees north.
During the calibration period 2006–2014, the snow model with calibrated parameters shown in Table 4 explained 94 %–96 % of the observed variability in snow depth, except at Apukka, where the R2 value was only 0.84 (Table S3). When using the parameters calibrated for each station before averaging, the R2 values were on average approximately 0.01 higher (not shown). We also tested the model with fixed kmax and kmin values averaged similarly to the other parameters; then the R2 values were on average 0.003 lower than those showed in Table S3. Except at Apukka, the model performance was in this case slightly worse at every station.
As the snow depth measurement sites are located in open environments, the calibrated parameters shown in Table 5 were used to model snow depth in open habitats. In forested areas, snow cover is reduced due to interception by the canopy, evaporation of the intercepted snow and enhanced wintertime snowmelt below the canopy (Hedstrom and Pomeroy, 1998; Varhola et al., 2010). Interception typically increases with increasing forest density and the leaf area index (Lundberg and Koivusalo, 2003; Rasmus et al., 2013). Interception can be as high as nearly 50 % of precipitation (Stähli and Gustafsson, 2006). In order to model the soil frost in different kind of forest stands, we added an interception coefficient to the snow model. In addition to open habitats, the calculations were performed for forests with three different density classes, corresponding roughly to deciduous forest or sparse mixed forest, pine forest and dense spruce forest. The interception coefficients for these forest stands were extracted from Lundberg and Koivusalo (2003). To reduce the modelled snow cover in forests, SWEnew was multiplied with the interception coefficient in every time step.
Table 5Interception coefficients, kmax coefficients and kmin coefficients used in this study for different forest types.
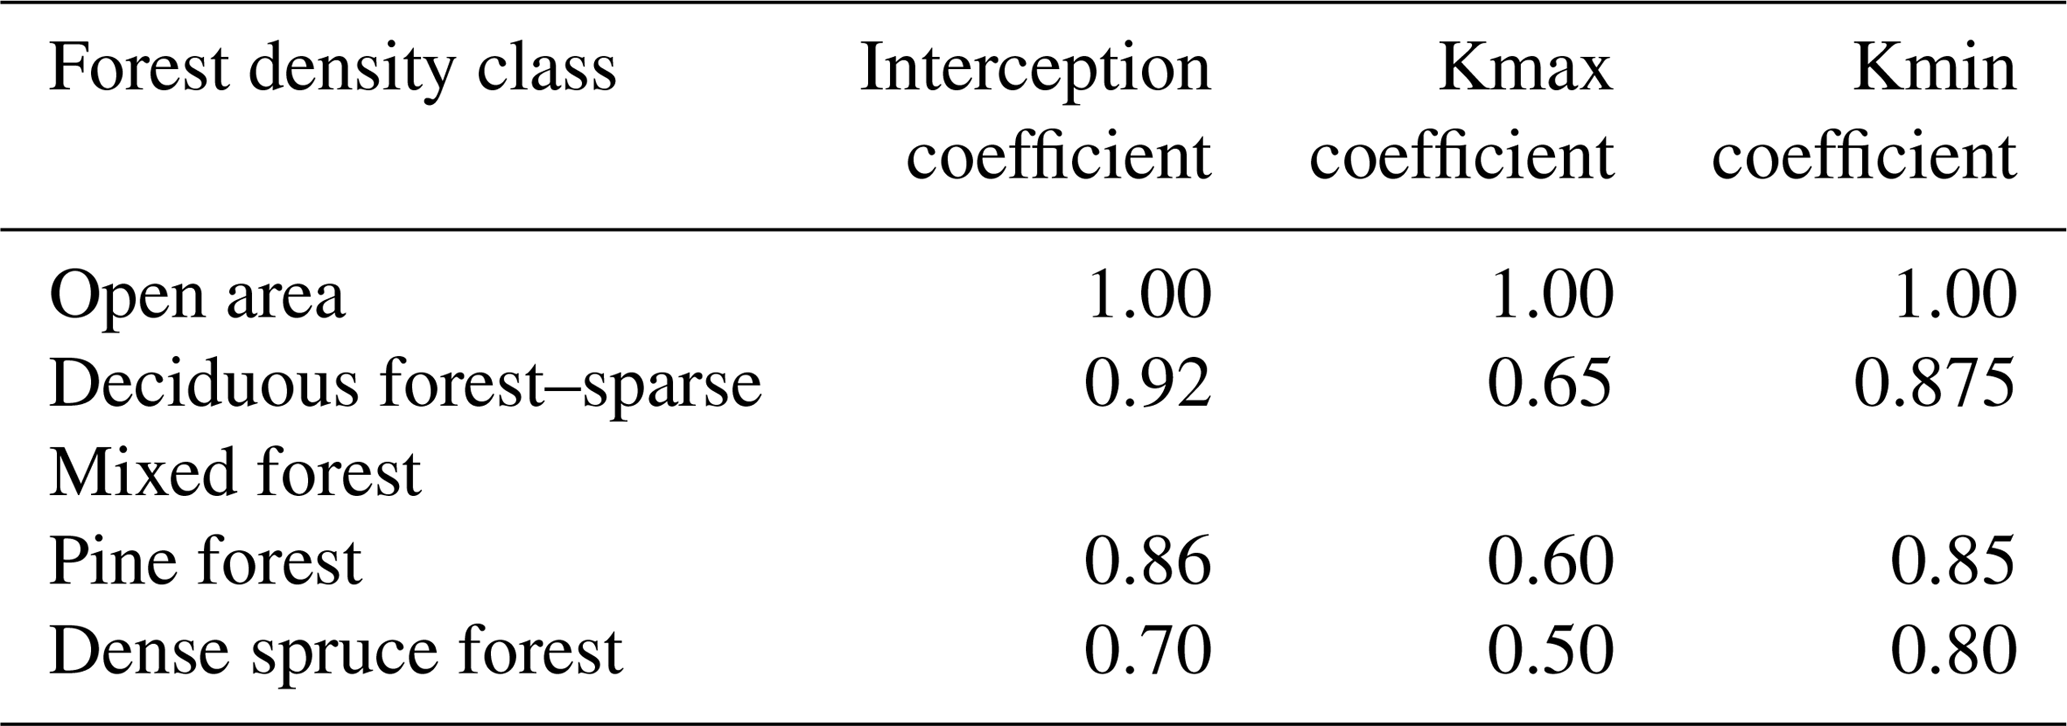
Forest canopy also shelters snow cover from direct sunlight which reduces the degree-day factor. In general, the denser the forest, the slower the melting proceeds. Vehviläinen (1992) presented experimental degree-day factors for open and forested areas for different river catchments and also based on earlier studies for both open areas and for different kind of forests (Gurevich, 1950; Hiitiö, 1982). Based on Vehviläinen (1992), the degree-day factor is typically 30 %–60 % smaller in forests compared to open areas, depending on river catchment and the time of the melting season, but the estimates were quite variable. Hiitiö (1982) concluded that the degree-day factor in spruce forests is reduced by 28 % from its value in open areas, whereas Gurevich (1950) suggested a reduction of over 60 % in dense spruce forests. In general, the reduction is smaller in the beginning of the melting season, as solar radiation increases towards summer. We used rough estimates for the degree-day factor in different forest types based on the literature review presented by Vehviläinen (1992).The coefficients used in reducing kmax and kmin as well as the interception coefficients used in this study for different forest types are shown in Table 5.
2.2.3 Validity of the modelled snow depths
The validation period 1962–2005 was divided into two sub-periods, 1962–1980 and 1981–2005, because the precipitation gauges and their wind shields in Finland were changed during 1981–1982 in order to improve the catch efficiency of snow. Before 1981, Nipher-shielded Wild gauges were used, and after 1982 shielded Tretyakov gauges were used, which are known to suffer less from wind-induced undercatch of snowfall (Yang et al., 1999; Taskinen and Söderholm, 2016). During the period 1981–2005, the R2 values varied between 0.87 and 0.93, so the model performance was somewhat lower than during the calibration period. Before 1981, the model performance was even worse, except at Apukka, where the snow model performed best during the validation periods. This is probably related to the fact that the modelled snow depths in a grid cell surrounding the Apukka station were on average 31 % higher than the observed ones at the station during the calibration period, while at other stations the modelled and observed snow depths resembled each other more closely (Table S3). The overestimation of snow depth at Apukka might be related to local microclimatological characteristics, as we used the gridded climate data in snow modelling, not the station observations. At the Rovaniemi Airport weather station, located only at a distance of 7.9 km from the Apukka station, the observed snow depths already tend to be remarkable higher (not shown). It is moreover noteworthy that modelled snow depths were in general systematically underestimated during the validation periods, especially before 1981. This indicates that a higher correction factor cps should have been used for the previous decades to improve the model performance, due to the higher undercatch of snowfall before 1981 (Taskinen and Söderholm, 2016).
2.3 Simulation of soil frost and snow depth for different forest and soil types under changing climatic conditions
The soil frost and snow depth calculations were performed for each possible combination of three soil types and four forest types to evaluate the changes in soil bearing capacity. In addition, the calculations were performed for forest truck roads without snow cover, leading to a total of 13 different combinations of soil and forest types. Calculations for each of these soil and forest types were performed on every grid cell. The simulation results were analysed for the near-future period 2021–2050 and for the far-future period 2070–2099 as compared to the baseline period 1981–2010. In addition, over the baseline period the soil temperature and snow depth models were also run by using the observational Finnish gridded climate data (Aalto et al., 2016). We modelled the number of days with good bearing capacity in the forest harvesting point of view. Good bearing capacity was assumed to prevail when the soil frost penetrated continuously from the surface to at least the depth of 20 cm or when the snow depth exceeded 40 cm.
The calculations for the period 1980–2099 under changing climate were completed using daily data from six GCMs (listed in Table S4) participating in the CMIP5 (Taylor et al., 2012; Flato et al., 2013). In addition, we used daily data from 11 bias-adjusted RCM simulations (listed in Table S5) constructed within the EURO-CORDEX project (Jacob et al., 2014). The variables used in this study were daily mean 2 m air temperature and daily precipitation sum.
The GCMs were chosen on the basis of their skill to simulate present-day average monthly temperature and precipitation climatology in northern Europe. However, the GCM outputs are always more or less biased and presented on a relatively coarse grid. Hence, before soil temperature calculations, for the GCM data, we performed a combined bias correction and statistical downscaling from a lower to a higher resolution (Maraun and Widmann, 2018). In this procedure, the distributions of downscaled weather variables were modified to correspond the observed distributions within the calibration period (1981–2010 in our case) in the resolution of the observational data set. Then, the same corrections were applied to the whole simulation period. As our observational data set, we used the Finnish gridded climate data on a regular grid (Aalto et al., 2016). The combined statistical downscaling and bias correction was performed by applying a quantile mapping technique using smoothing. A detailed evaluation of this procedure for correcting simulated temperature time series was presented by Räisänen and Räty (2013) and, for correcting simulated precipitation time series, by Räty et al. (2014).
From the EURO-CORDEX archive we chose the set of models with the largest number of simulations available with a uniform bias-adjustment approach. All the used RCM simulations were constructed in the Institut Pierre Simon Laplace (IPSL) using a cumulative distribution function (CDF) method (Vrac et al., 2016). They were downscaled onto the EUR-11 CORDEX domain with a horizontal resolution of by using the Water and Global Change Forcing Data ERA-Interim (WFDEI) meteorological forcing data set (Weedon et al., 2014) over the calibration period 1979–2014. Before soil temperature calculations, we linearly interpolated the RCM data onto the same grid with the GCM data.
Both GCM and RCM model ensembles were based on the RCP4.5 and RCP8.5 scenarios (van Vuuren et al., 2011), which are widely used in climate change impact studies. The RCP4.5 scenario represents a world characterized by relatively well-succeeded mitigation of greenhouse gas emissions, and in that scenario, the radiative forcing stabilizes at 4.5 W m−2 in 2100. The RCP8.5 scenario, on the other hand, represents a world without any efficient mitigation activities applied and leads to radiative forcing and climate warming almost twice as large on the global scale by 2100. In Finland, the projected increases in mean annual temperature and precipitation are up to 6 ∘C and 18 % under the RCP8.5 scenario, respectively, when the atmospheric CO2 concentration approaches 1000 ppm by 2100 (Ruosteenoja et al., 2016). The increases in temperature and precipitation are both predicted to be clearly higher in winter months than in summer.
3.1 Wintertime bearing capacity during the baseline period 1981–2010
The modelled annual average number of days with good wintertime bearing capacity during 1981–2010 based on observational weather data in three different forest types common in Finland, i.e. dense Norway spruce (Picea abies) forests on clay or silt soil, Scots pine (Pinus sylvestris) forests on sandy soil, and Scots pine forests on peatlands, is shown in the left column of Fig. 2. The number of days with good wintertime bearing capacity on forest truck roads is shown as well. Upland forests on sandy soil generally have most, and forests on drained peatlands the least, days with good bearing capacity, as the soil frost penetrates fastest in sand and slowest in peat. The winter period with good bearing capacity lasts on average approximately 5–7 months in northern Finland, depending on forest and soil type. In the central parts of the country, the wintertime bearing season lasts about 3–4 months on drained peatlands and roughly about 5 months on other soil types. In the coastal areas of southern and southwestern Finland, the length of the bearing season varies typically between 2 and 4 months per winter depending on the soil type. On forest truck roads, the bearing season is modelled to last about 3–4 months per winter in southern Finland and about half a year in northernmost Finland.
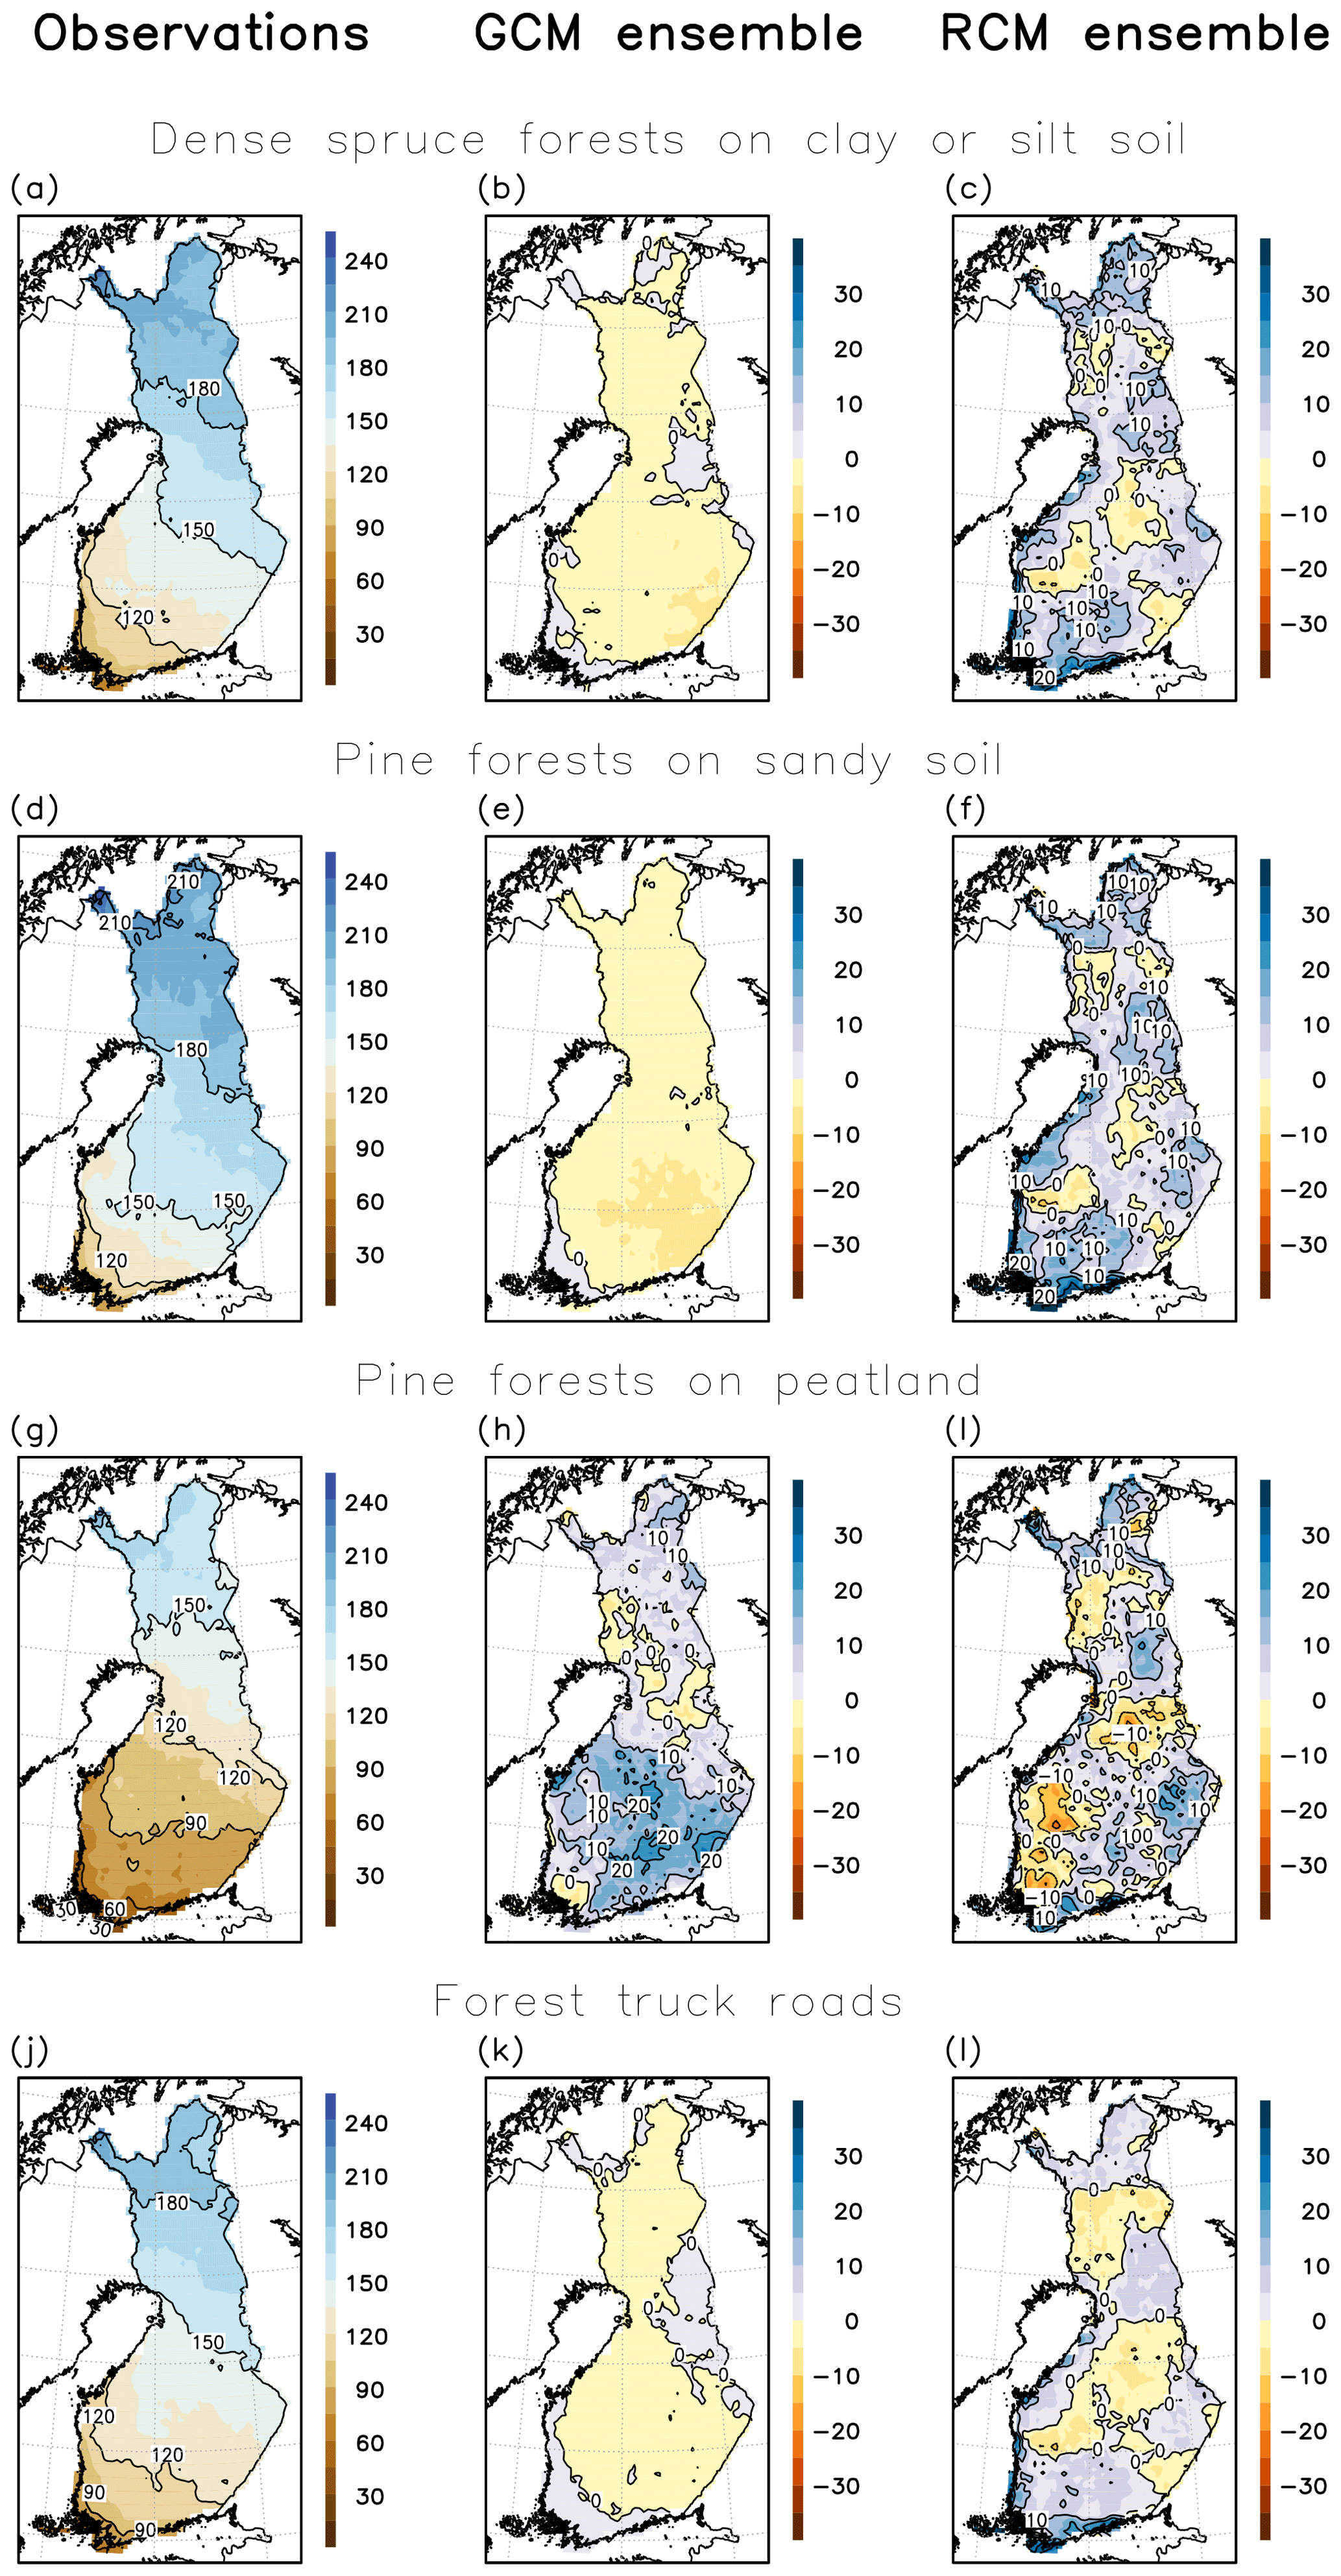
Figure 2Annual average modelled number of days with good bearing capacity over the period 1981–2010 in three different forest and soil types and in forest truck roads based on observed weather data (left column). The middle column depicts the multi-model mean differences in the annual average number of days with good bearing capacity over the period 1981–2010 between the bias-corrected GCM ensemble and calculations using the observed weather data. In the right column the same multi-model mean differences are showed for the bias-adjusted RCM ensemble.
The used models generally reproduce the spatial pattern of wintertime bearing season length during the baseline period as expected, as the model data has been bias corrected. In the GCM ensemble, the difference in the number of days with good bearing capacity between the multi-model ensemble and model calculations using observational weather data tend to be, almost everywhere, even less than 5 days, except in pine-dominated drained peatland forests, where the bearing season length is locally overestimated by 20 days (Fig. 2h). In the RCM ensemble, the agreement between the calculations using model data and observational weather data is generally poorer, but the difference in the number of days with good bearing capacity is still less than 10 days over most of Finland.
3.2 Wintertime bearing capacity during the future periods 2021–2050 and 2070–2099
The projected change in the average wintertime bearing season length for the above-mentioned forest types and for forest truck roads is displayed in Fig. 3 for the GCM ensemble and in Fig. 4 for the RCM ensemble. The wintertime bearing season is projected to shorten by roughly 1 month for the near-future period 2021–2050. The change is only a little smaller under the RCP4.5 than the RCP8.5 scenario. The GCM and RCM ensembles indicate rather similar changes. The projected change is moreover rather similar among the different soil types.
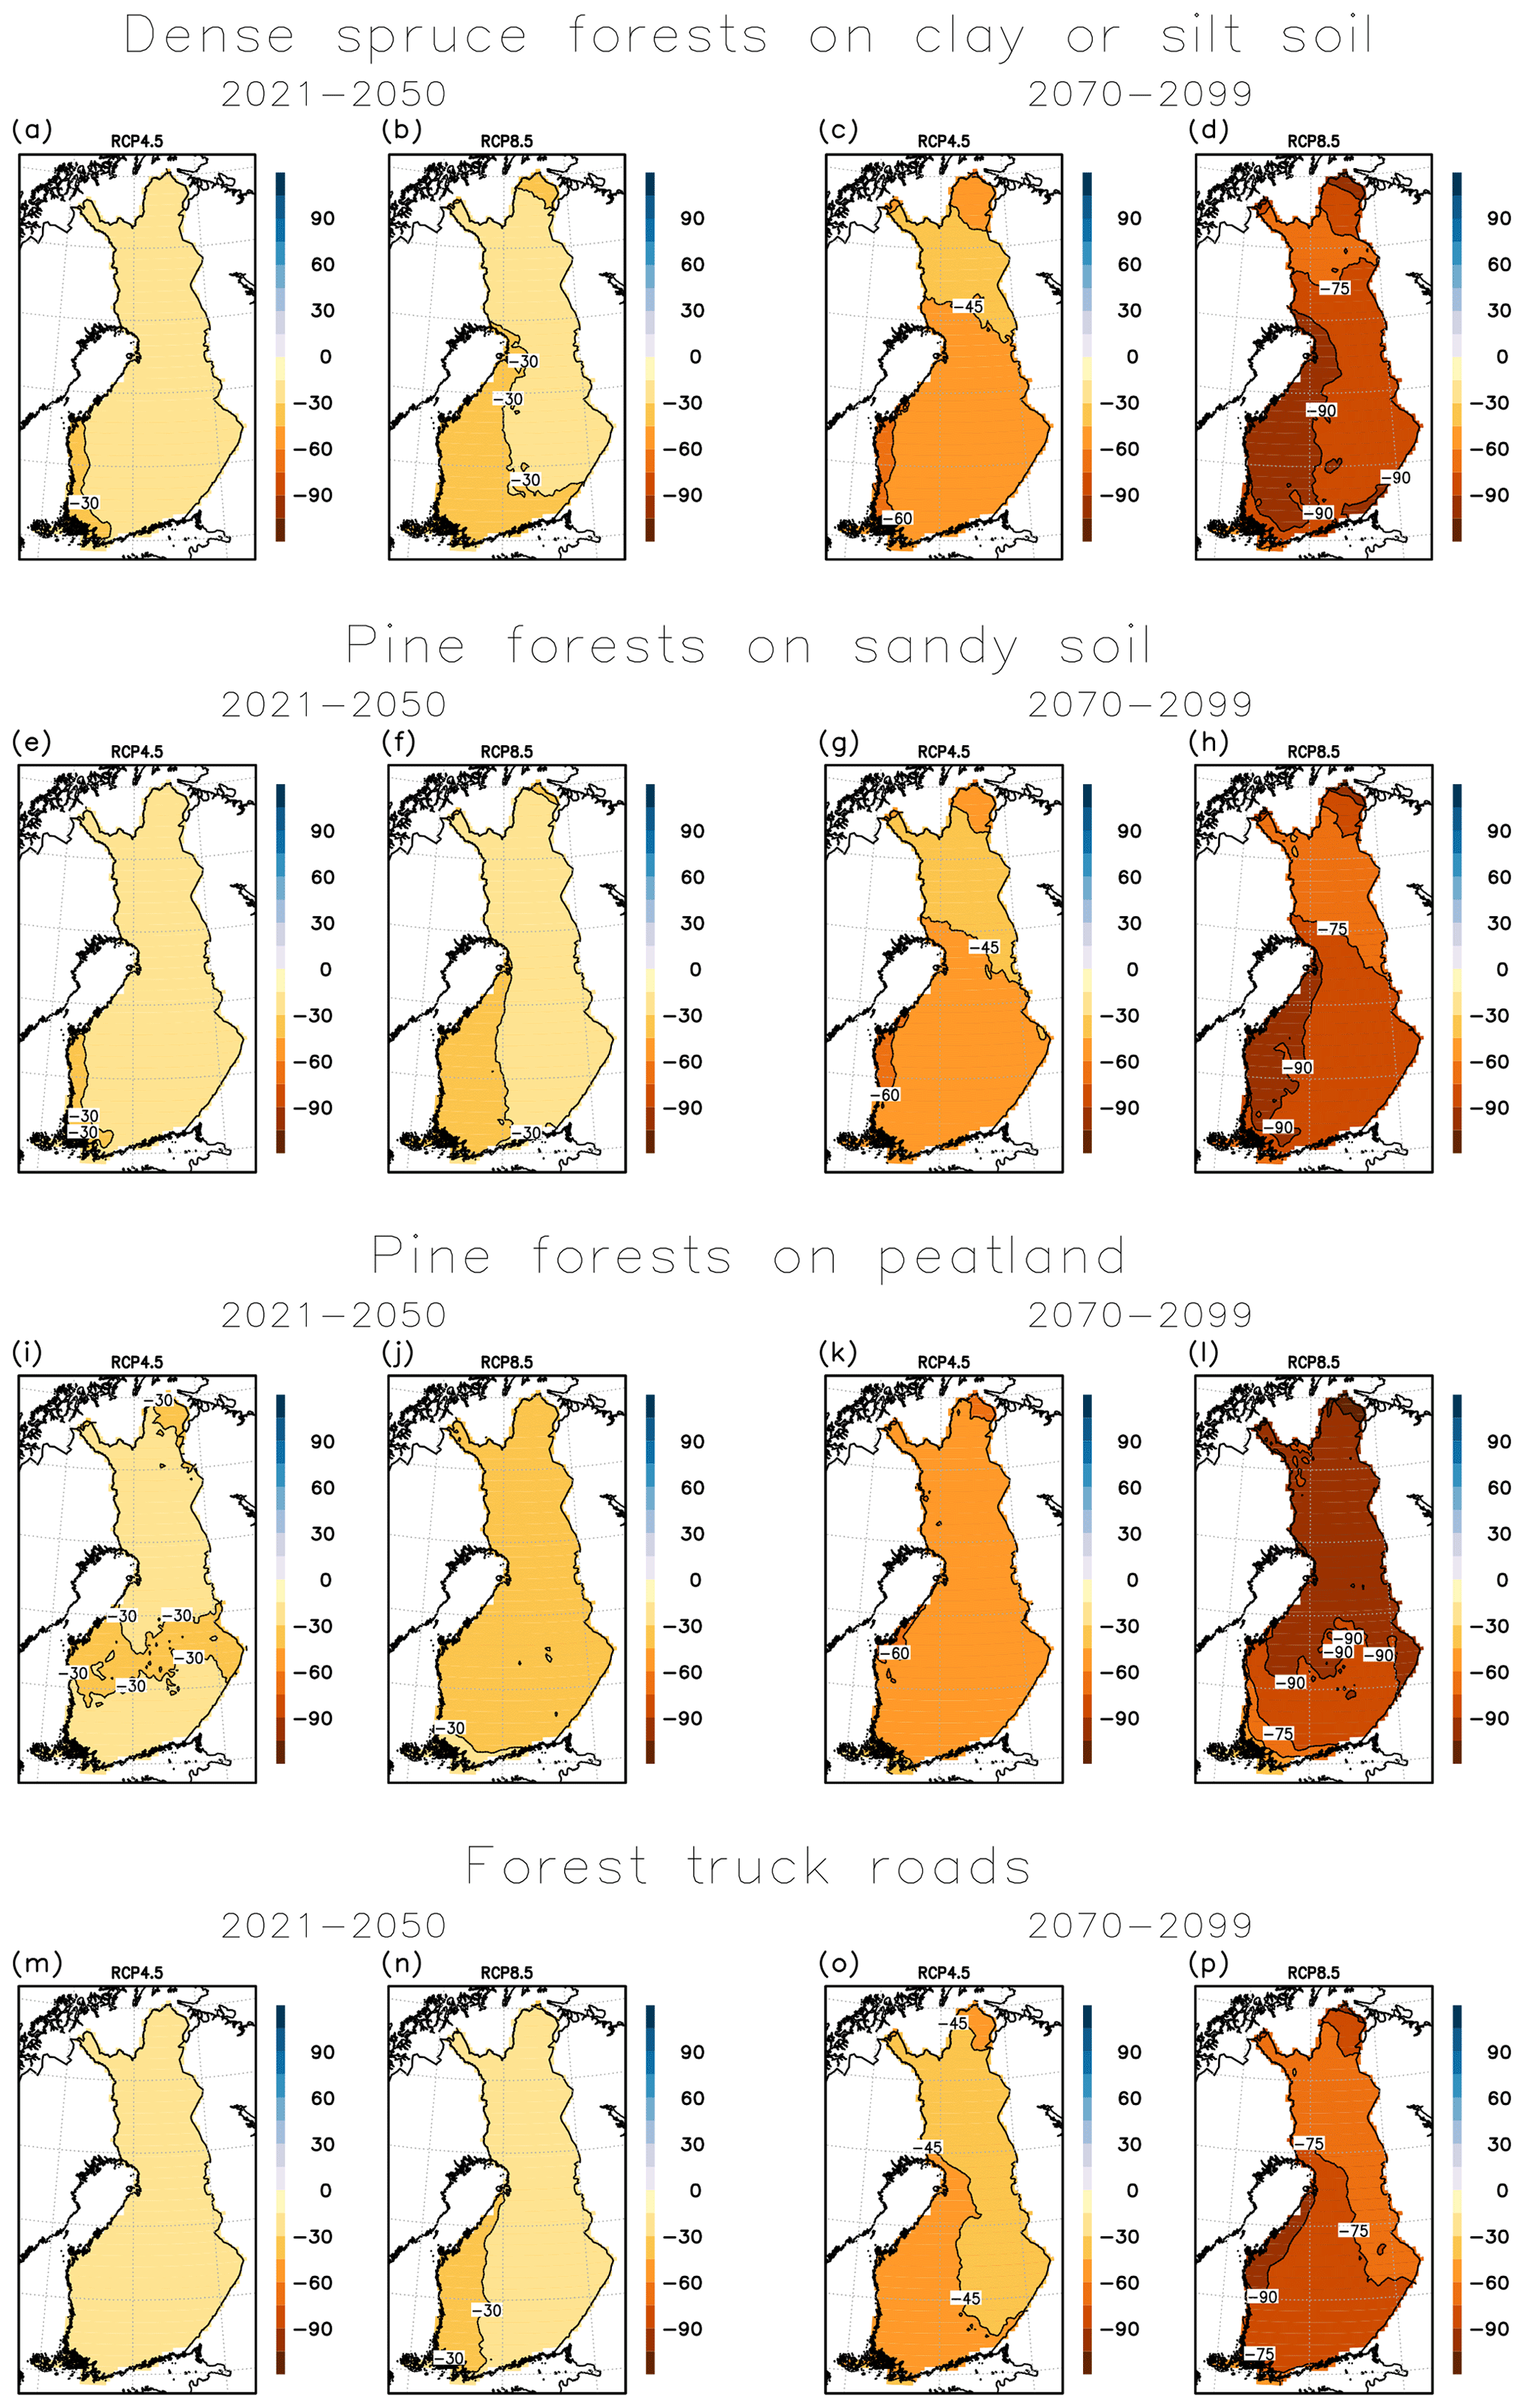
Figure 3Projected multi-GCM mean change in the annual number of days with good bearing capacity in three different forest and soil types and in forest truck roads from 1981–2010 to 2021–2050 and to 2070–2099 under the RCP4.5 and RCP8.5 scenarios.
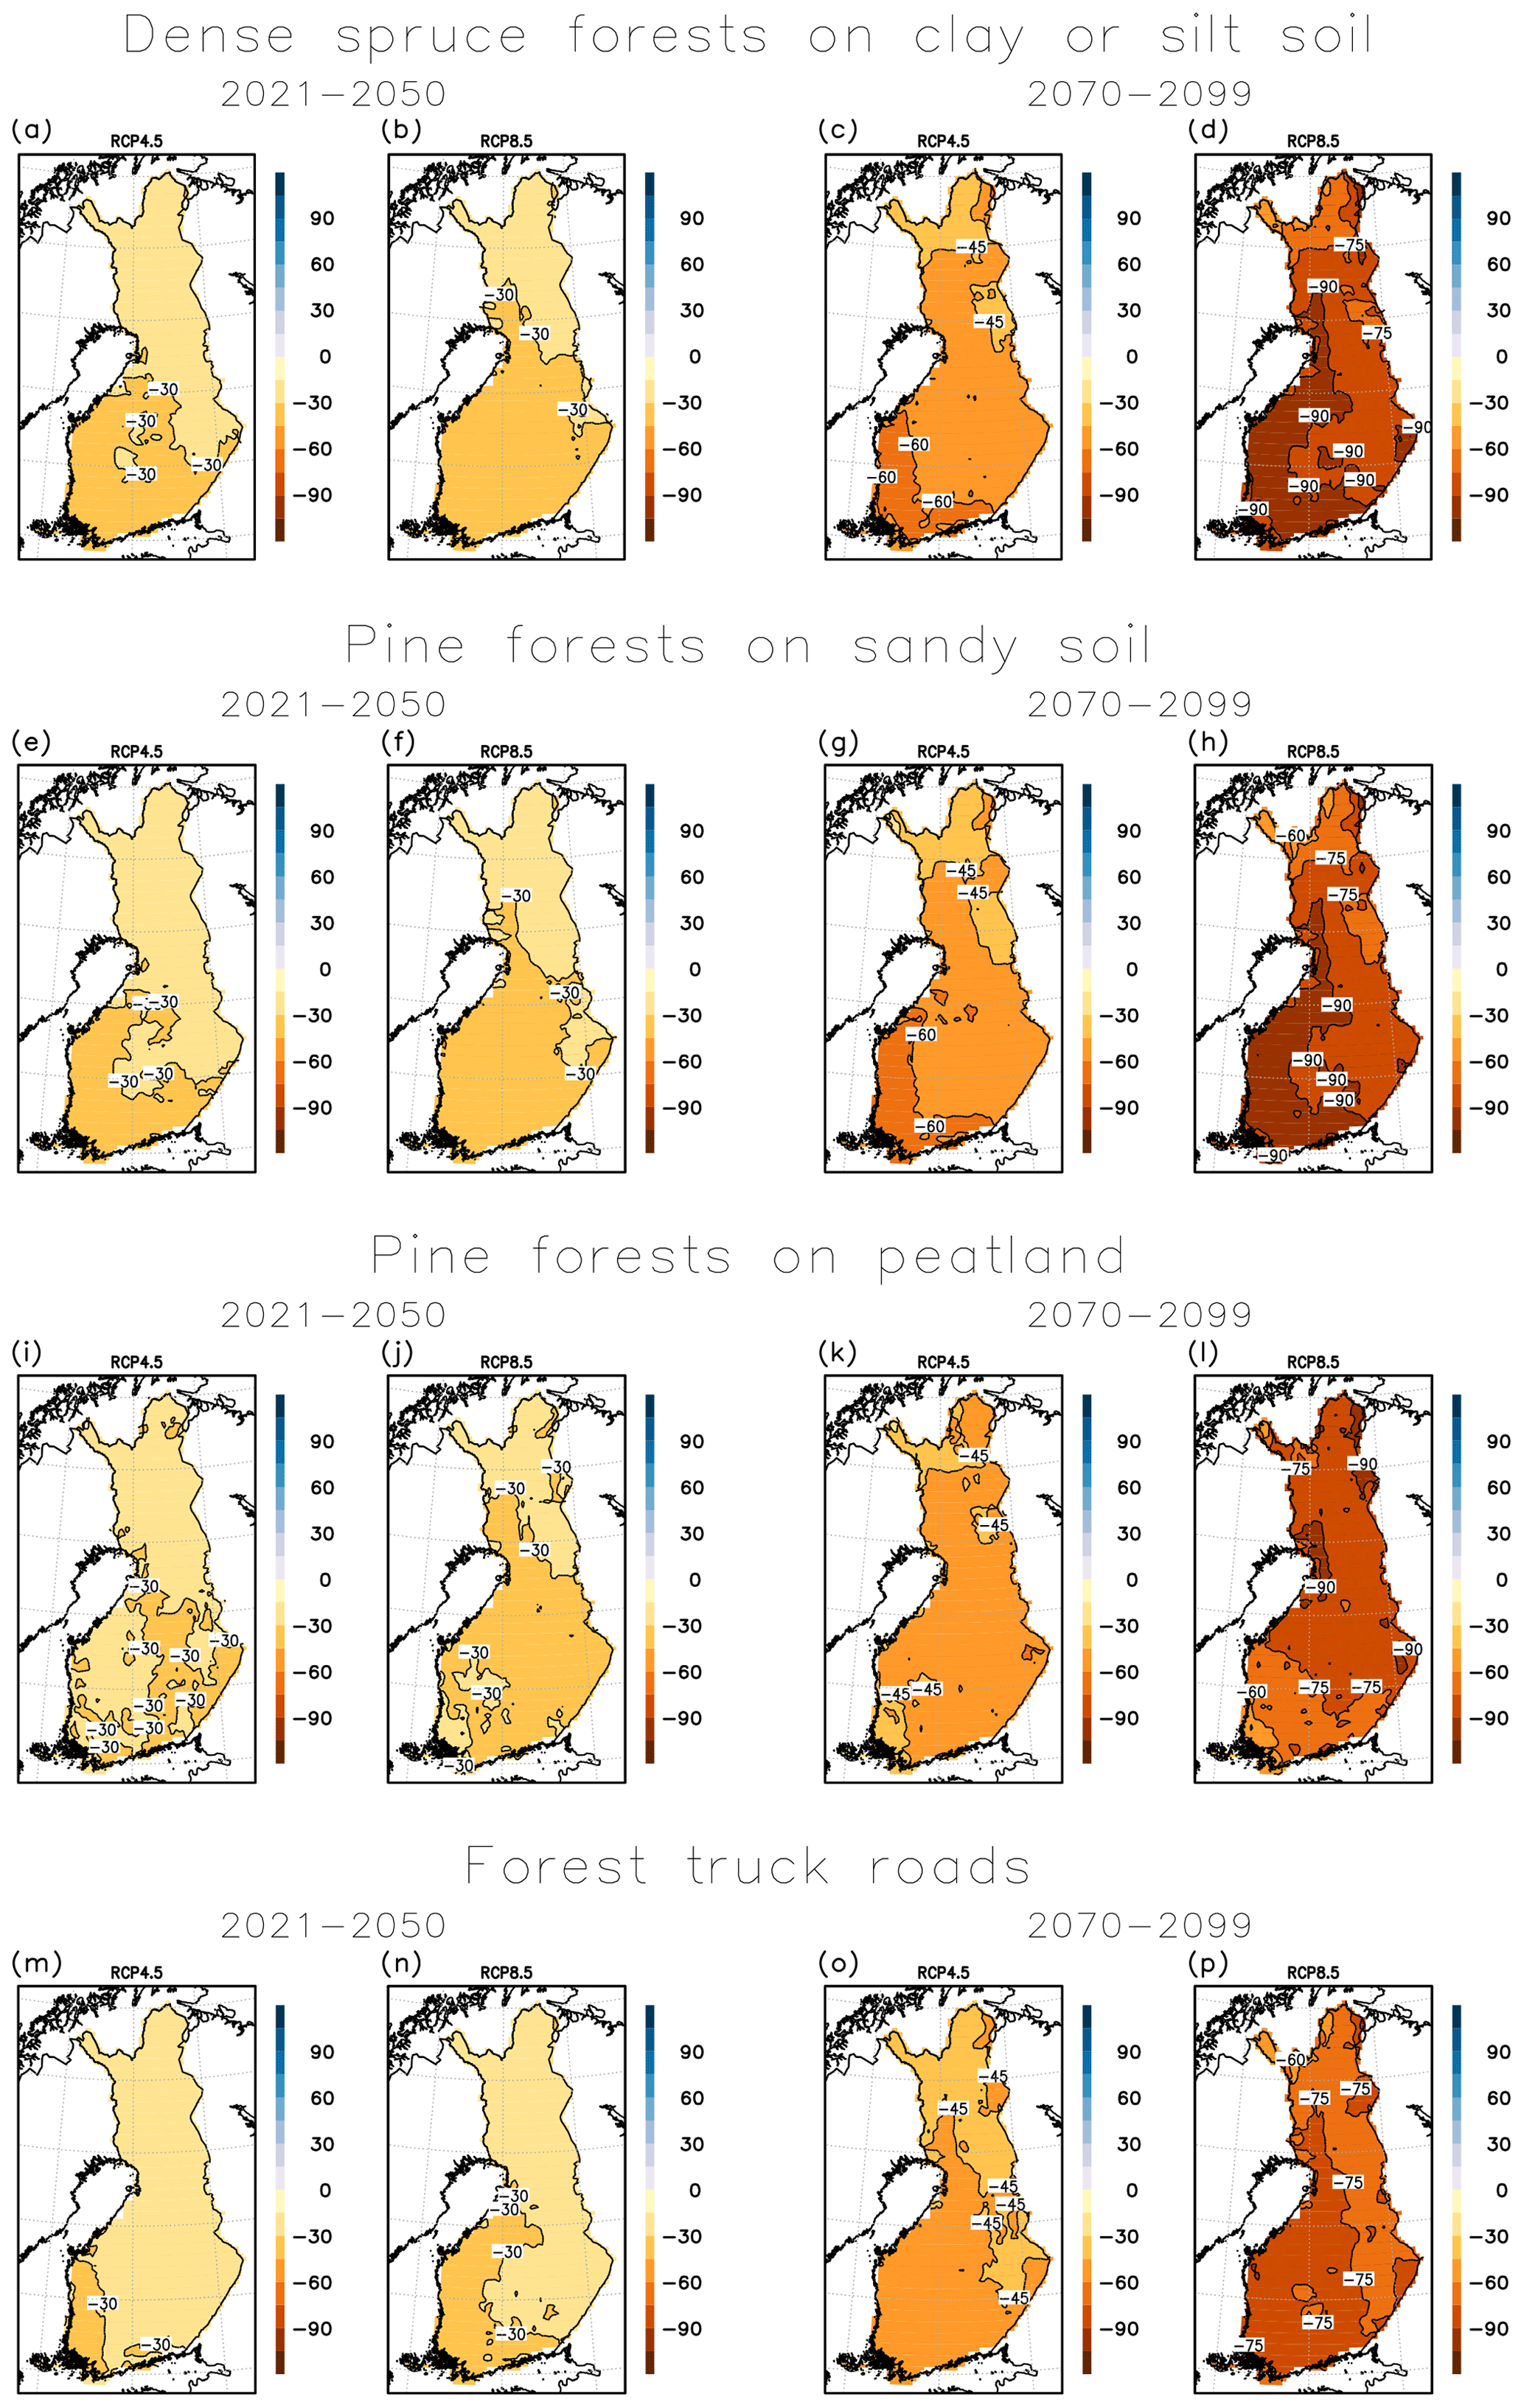
For the far-future period 2070–2099 the projected shortening of the wintertime bearing season is clearly more pronounced. In addition, the difference in the magnitude of change between the two forcing scenarios becomes larger. If the high-emission RCP8.5 scenario is realized, the bearing season may shorten by more than 3 months over large parts of the country. On drained peatlands, the change remains smaller in southern Finland, as the bearing season there already lasts less than 3 months per winter during the baseline period. On the other hand, in upland forests on sandy and clay or silt soil types the projected shortening of bearing season is largest in southern and western Finland. In these areas, the bearing season is also projected to shorten by about 2 months under the RCP4.5 scenarios.
The projected change in the wintertime bearing season length on forest truck roads accompanies the projected change on different forest types, especially on sandy and clay or silt soil types. By mid-century, the wintertime bearing season on forest truck roads may shorten by more than 1 month in western Finland. At the end of the 21st century, the bearing season on forest truck roads that may last even on average only about 1 month per winter in the southwestern parts of the country of the RCP8.5 scenario will be realized.
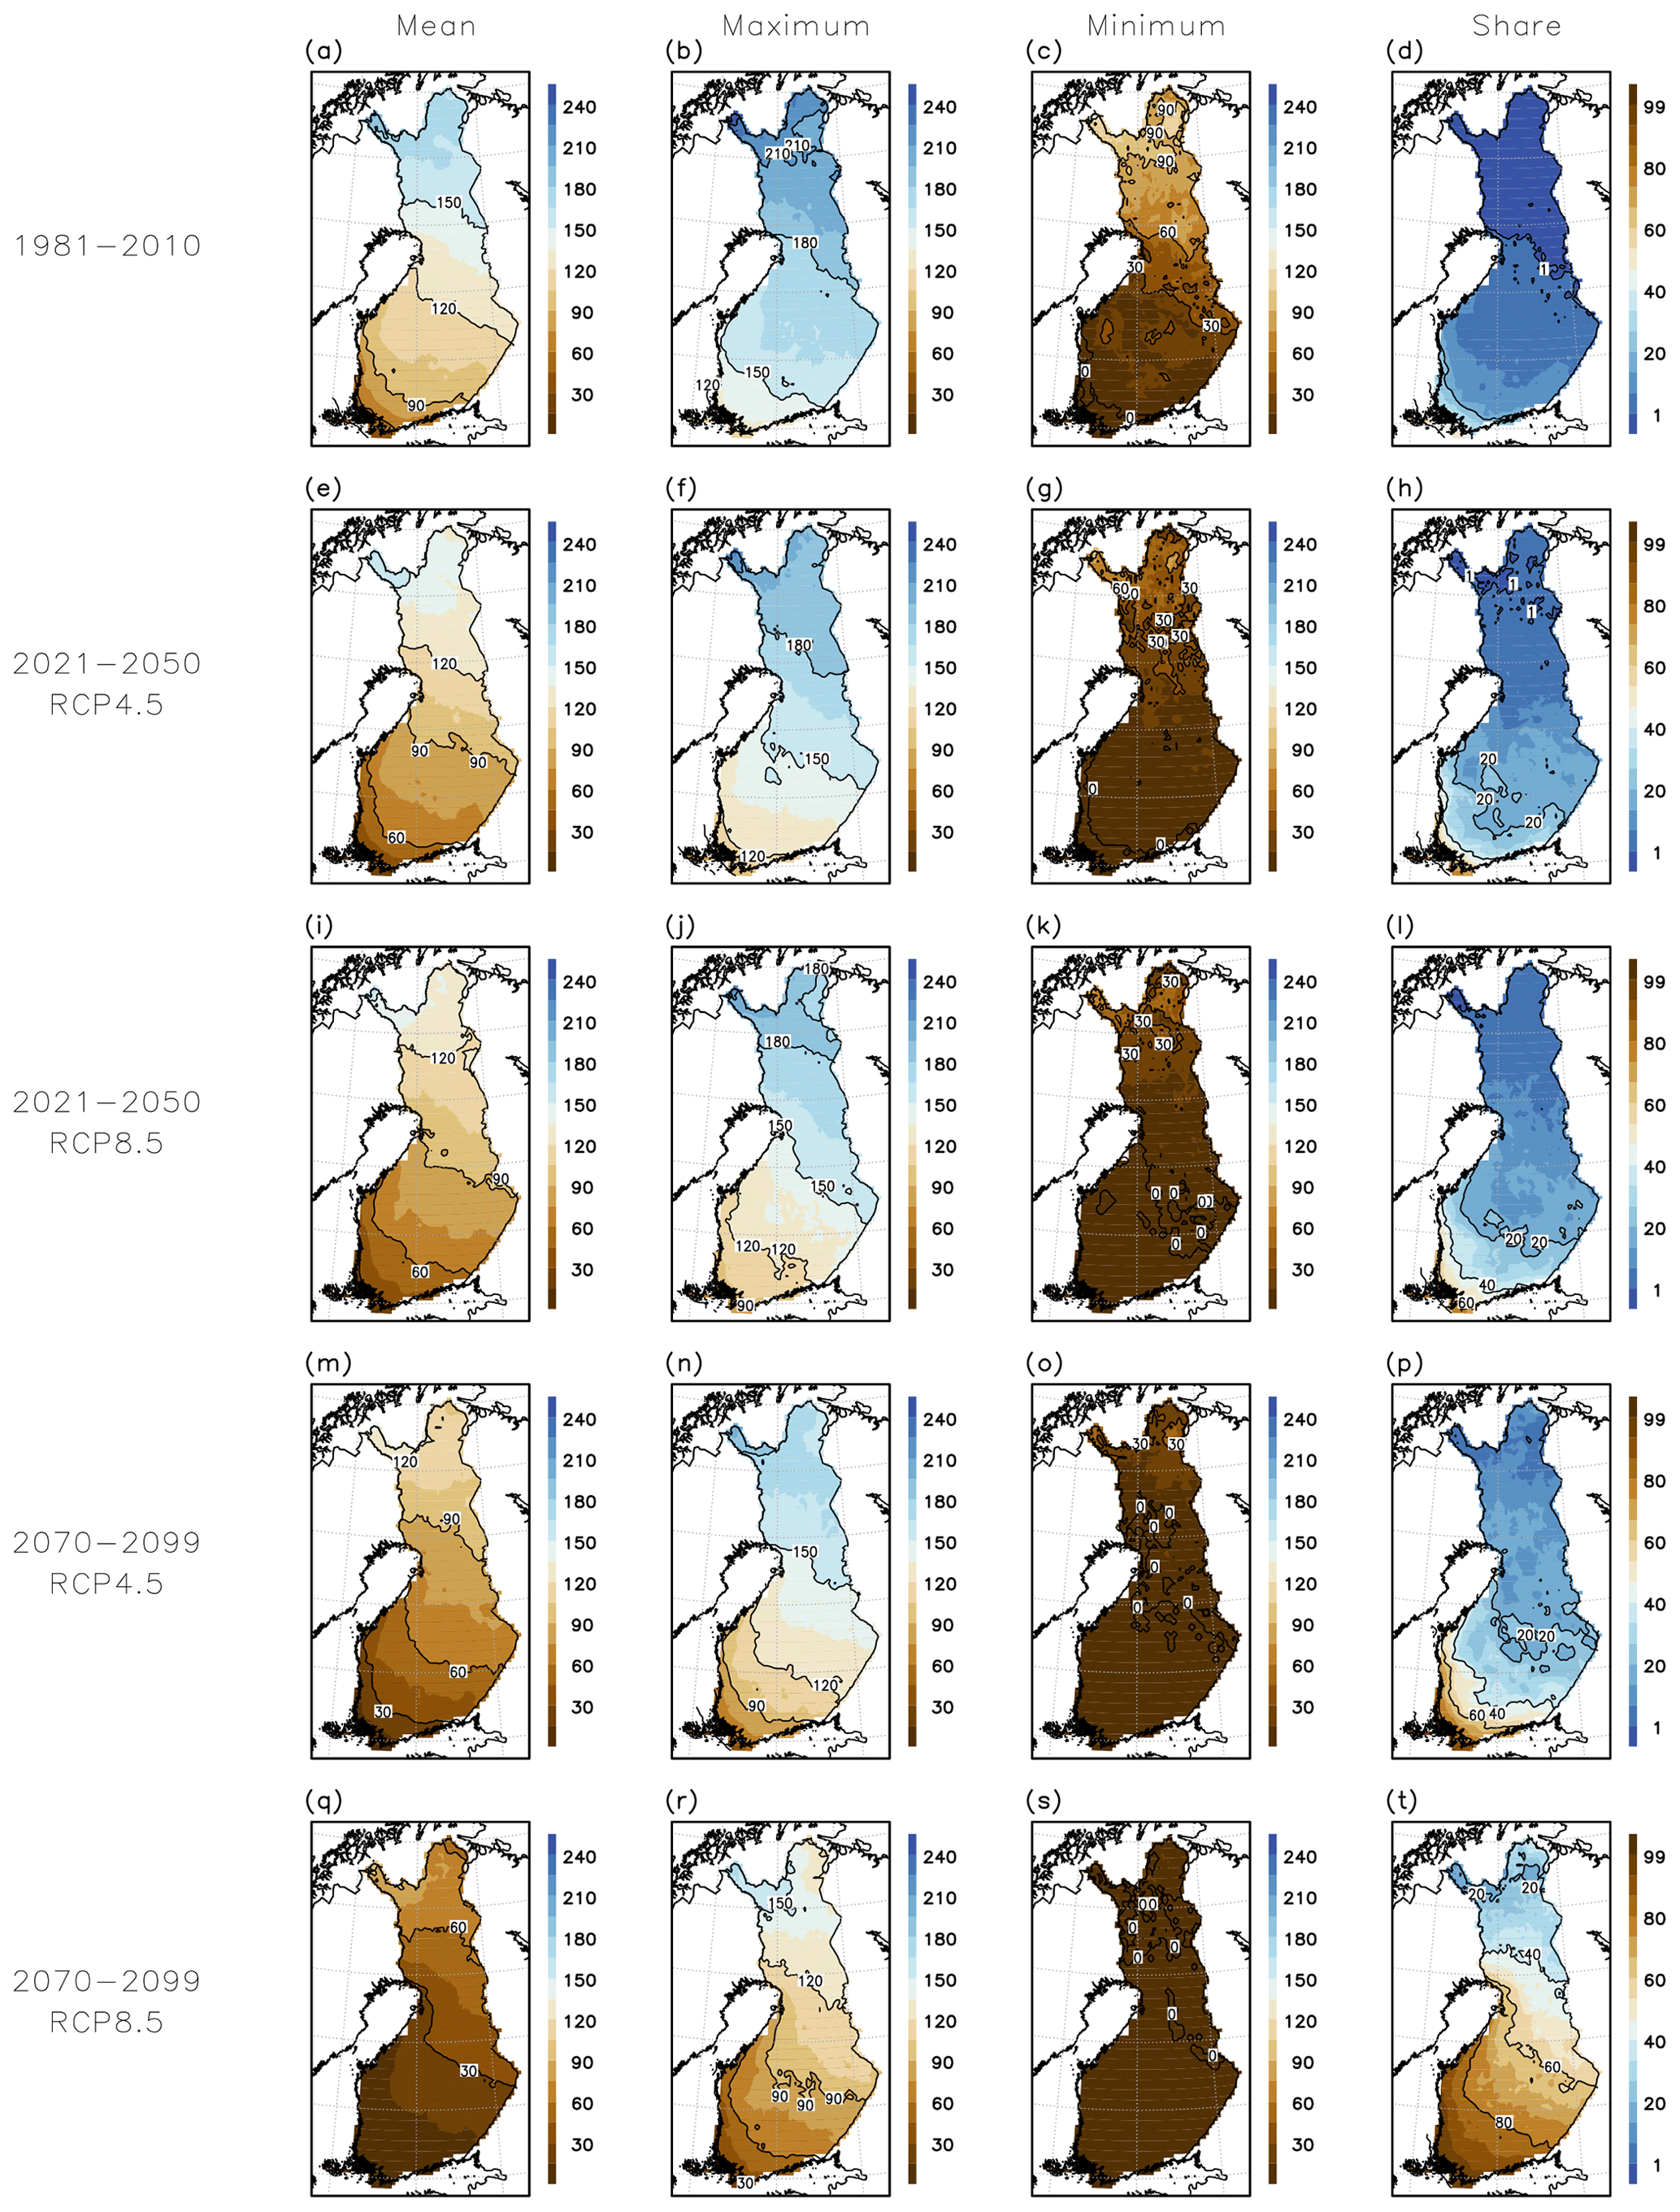
Figure 5Modelled multi-GCM annual mean number of days with good bearing capacity in drained pine-dominated peatland forests during 1981–2010, 2021–2050 and 2070–2099 under the RCP4.5 and RCP8.5 scenarios (left column). The second and third column from the left show the modelled annual number of days with good bearing capacity during the winter with the most (the second column) and least (the third column) of such days within the 30-year periods based on the same multi-GCM mean. The last column shows the share of winters (%) with less than 30 modelled days of good bearing capacity based on the multi-GCM mean.
3.3 Interannual variability in the wintertime bearing season length
Interannual variability in the wintertime bearing season length is illustrated in Fig. 5. Here we show only the results derived from the GCM ensemble and only for pine forests on drained peatlands, as they are the most difficult sites for forest harvesting. During the baseline period, the bearing season length exceeds 1 month in more than 80 % of the winters, except in the coastal areas in southern and southwestern Finland (Fig. 5d). In Lapland, the bearing season lasts 2–3 months even in the mildest winters, but at the southwestern coast, the mildest winters do not express good bearing capacity on any day (Fig. 5c). During the near-future period 2021–2050, the share of winters with less than 1 month of good bearing capacity is projected to somewhat increase, particularly in southern and western Finland (Fig. 5h and l). However, over most of Finland a large majority of winters still have a sufficient amount of days with good bearing capacity, although the conditions during the mildest winters are projected to become more difficult. For the far-future period, 2070–2099, the situation is projected to change more considerably, particularly if the RPC8.5 scenario is realized (Fig. 5q–t). Based on the multi-GCM mean, only a few winters express longer than 1 month bearing season in southern and western Finland (Fig. 5t). Even in eastern Finland and southwestern Lapland, the bearing season length is projected to exceed 1 month only approximately in every other winter. During the mildest winters, soil frost may penetrate to 20 cm or snow depth exceed 40 cm only in localized areas in northern Finland.
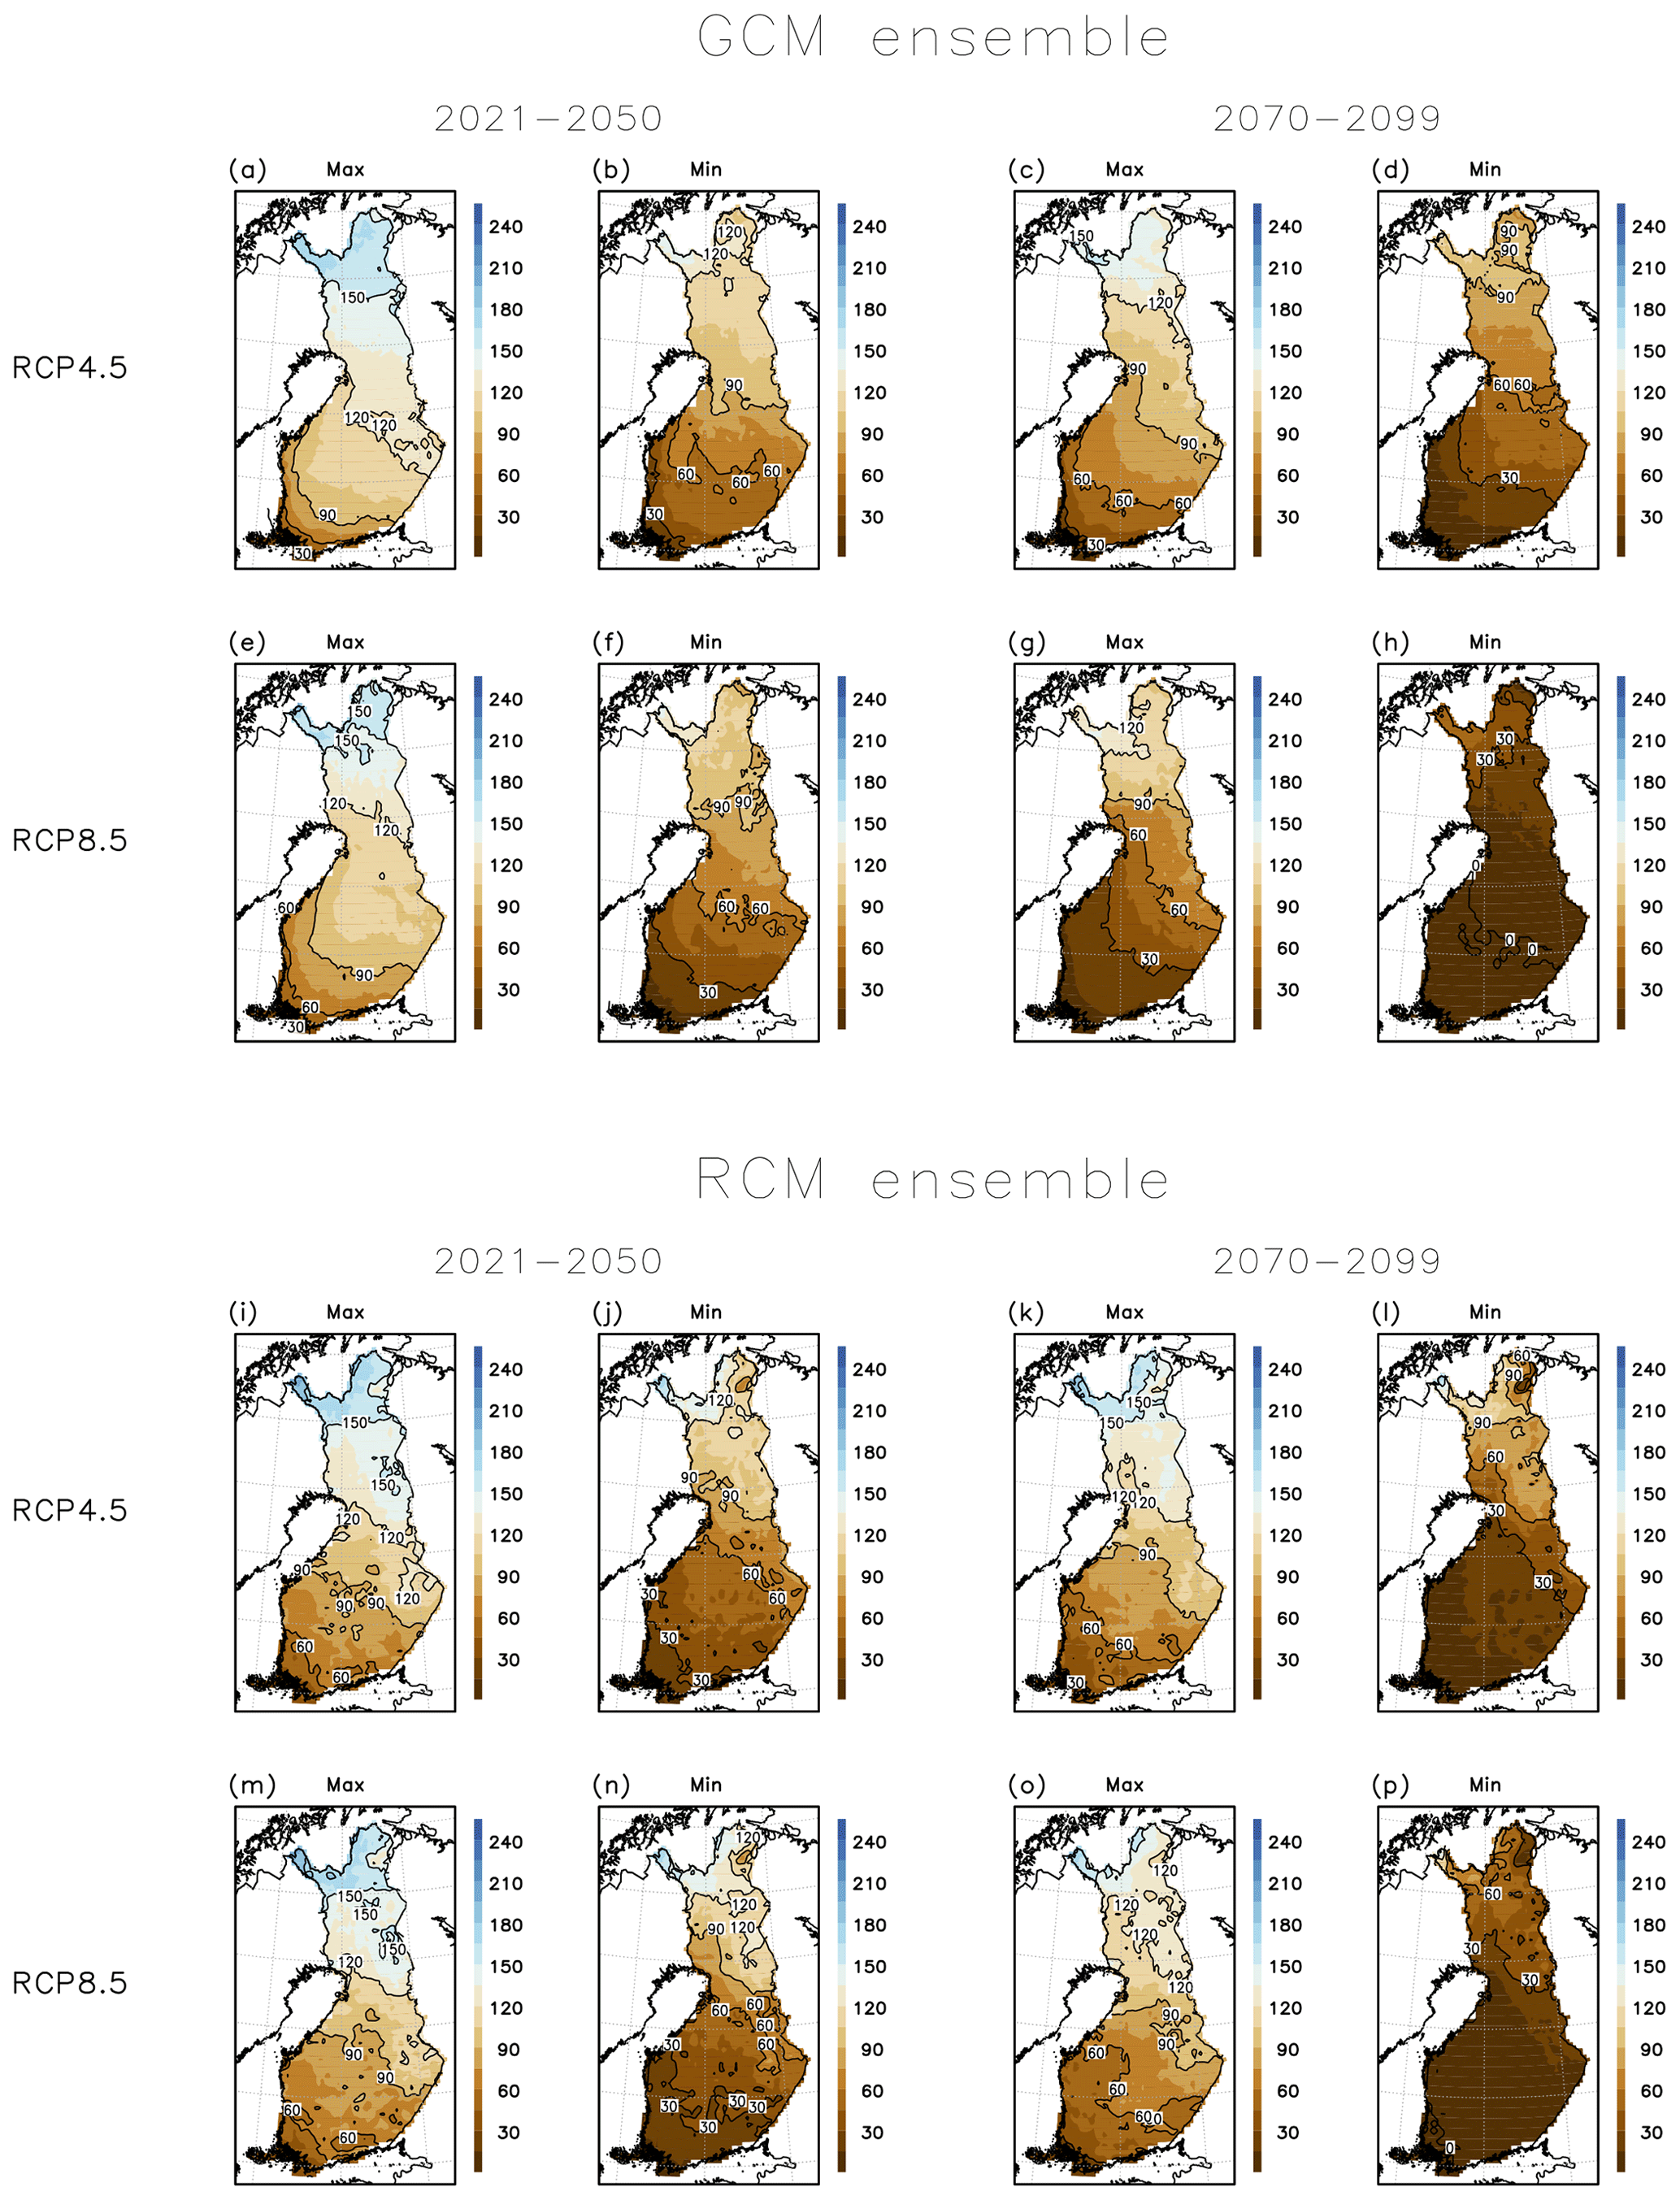
Figure 6Range of modelled annual mean number of days with good bearing capacity in drained pine-dominated peatland forests during the periods 2021–2050 and 2070–2099 under the RCP4.5 and RCP8.5 scenarios among the GCMs and RCMs used in this study. The figures labelled with “Max” and “Min” show the highest and lowest modelled mean number of days with good bearing capacity among the used models for the GCMs and RCMs.
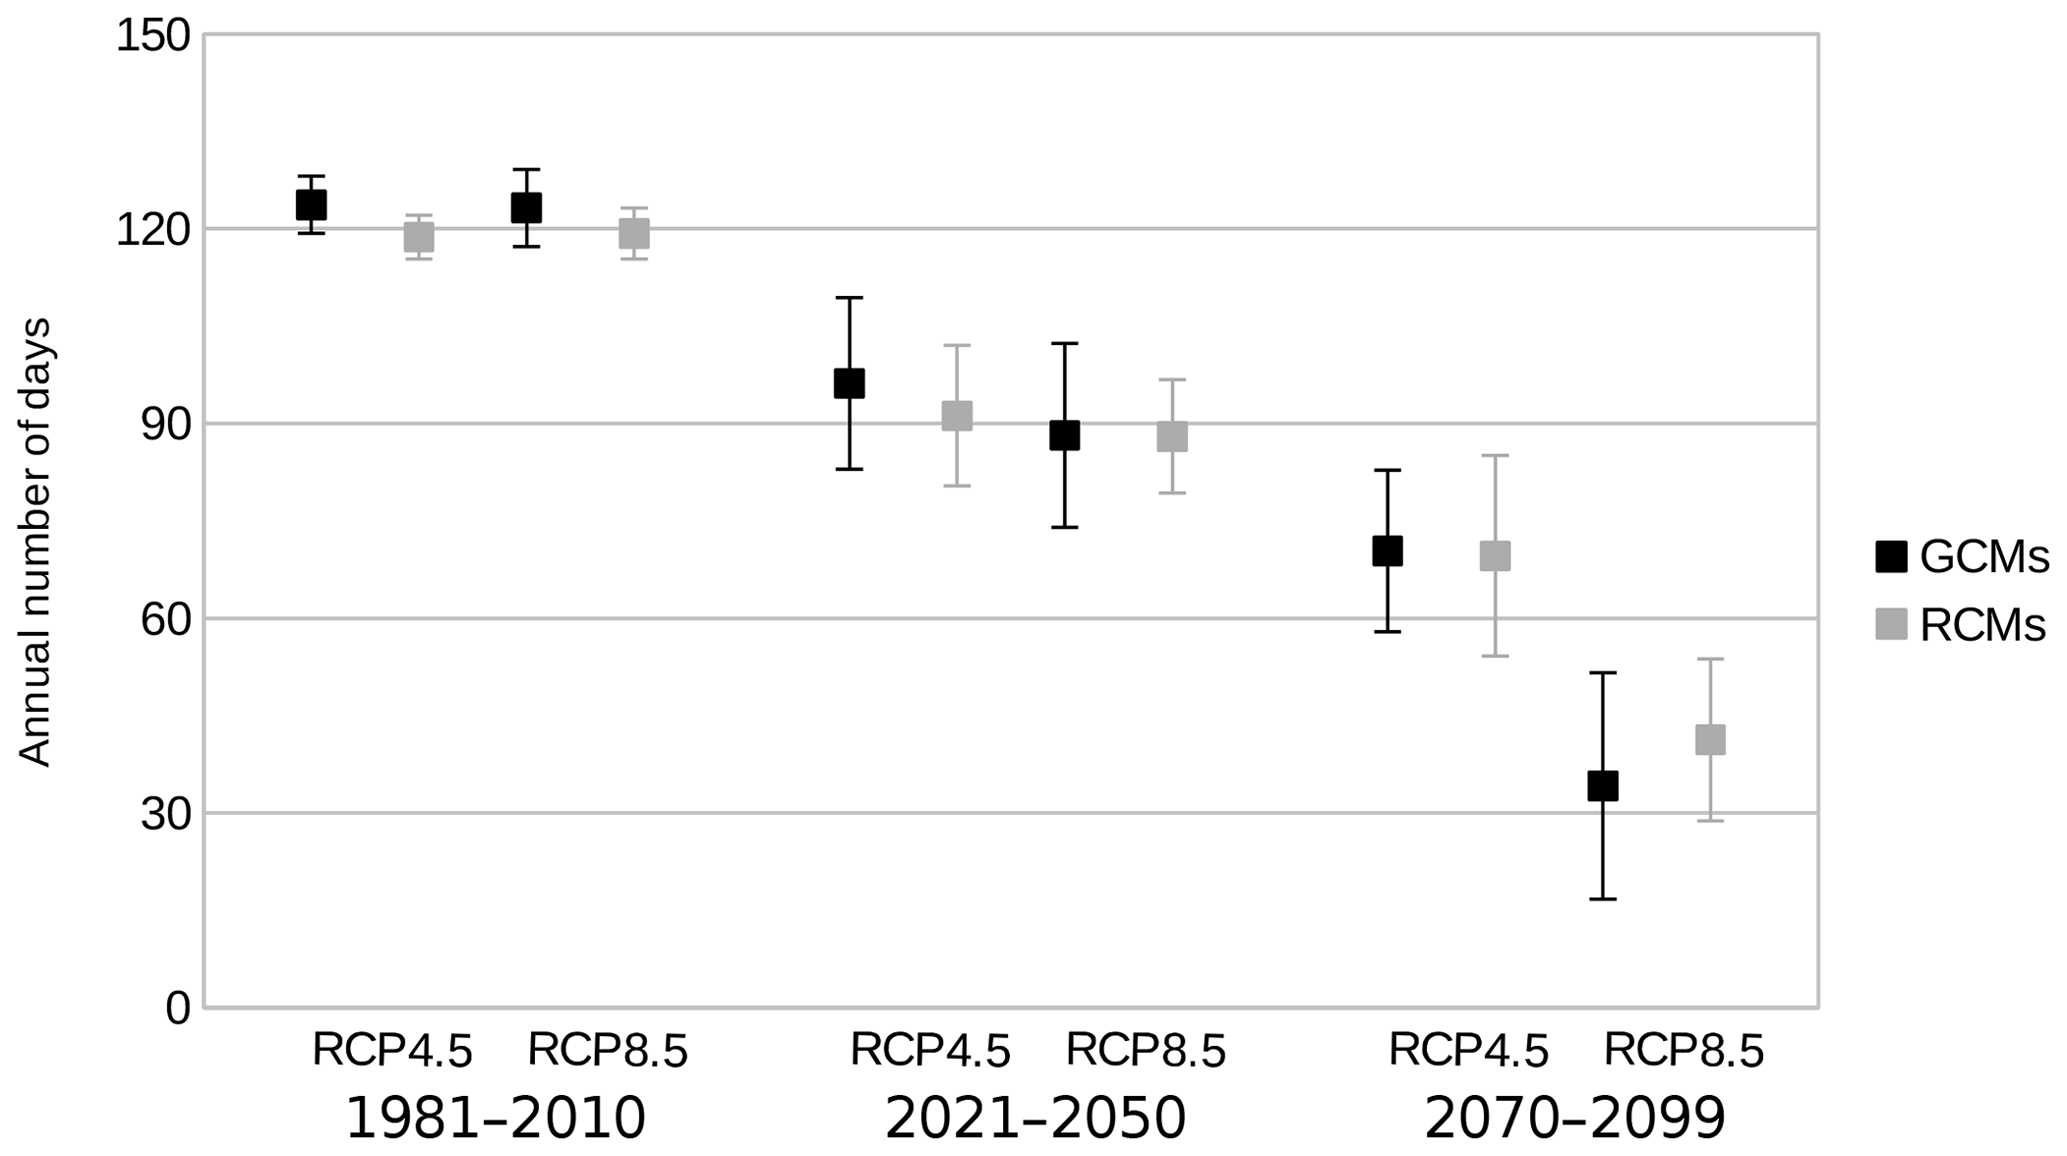
Figure 7Annual mean number of days with good wintertime bearing capacity in drained pine-dominated peatland forests with multi-model standard deviations as averaged over the whole of Finland separately for the GCM and RCM ensembles during the periods 1981–2010, 2021–2050 and 2070–2099 under the RCP4.5 and RCP8.5 scenarios.
3.4 Intermodel variability in the projected wintertime bearing season length
In Figs. 6 and 7 we illustrate the range of possible outcomes between different climate model projections for wintertime bearing season length in pine forests on drained peatlands. Figure 6 shows the highest and lowest annual mean number of days with good wintertime bearing capacity among the used climate models on each grid cell over the two 30-year future periods under the two forcing scenarios, shown separately for the 6 GCMs and for the 11 RCMs. Figure 7 displays, for the both model ensembles, the annual mean number of days with good wintertime bearing capacity with multi-model standard deviations as averaged over the whole of Finland. It is visible that during the near-future period 2021–2050, the projected average wintertime bearing season length already diverges by more than 1 month in both model ensembles. During the far-future period 2070–2099, the range in the average bearing season length among the model projections is typically already more than 2 months. The models with strongest warming even indicate that the average bearing season length in the end of the 21st century might be zero days at the southwestern coast of Finland, meaning that even during the coldest winters, soil frost would not penetrate to 20 cm. The coldest model projections, on the other hand, indicate that the wintertime bearing season length would shorten only by about 1 month by the end of the 21st century. Also Fig. 7 confirms that the projected changes are rather similar in both model ensembles and during the near-future period also under both forcing scenarios.
3.5 Relative importance of soil frost and snow cover in providing good wintertime bearing capacity
As the bearing season length is affected both by soil frost and snow cover, it is worth inspecting projected changes in these two variables separately. During a typical winter, snow depth exceeds the limit of 40 cm in eastern and northern Finland for several months, but in the coastal areas in southern and western parts of the country, snow depth rarely exceeds 40 cm. Thus, in western Finland the bearing season length is mainly controlled by soil frost (Fig. 8). In the east, on the contrary, good bearing capacity is more often provided only due to the thick snow cover. In northern Finland, despite the thick snow cover, soil frost penetrates also in most areas typically deep enough to assure good bearing capacity. The spatial picture is projected to remain similar during the present century, but the cases with deep snow cover with less than 20 cm of soil frost seem to become slightly less abundant and almost non-existent in western Finland.

Figure 8The share of modelled bearing season length (%) when the modelled soil frost depth exceeded 20 cm in drained pine-dominated peatland forests during the periods 1981–2010, 2021–2050 and 2070–2099 under the RCP4.5 and RCP8.5 scenarios among the GCMs and RCMs used in this study.
4.1 Evaluation of methodology
The bearing capacity of forest soils was evaluated on the basis of the soil temperature model that had been previously applied successfully in Finnish and Swedish conditions (Rankinen et al., 2004; Jungqvist et al., 2014). In this study, the model parameters were calibrated separately for three different soil types based on soil temperature observations. Typically the model explained 90 %–99 % of the observed soil temperature variability. However, in most of the locations the model tended to overestimate the frost formation and soil temperature variations near the surface. Thus, the relative importance of snow cover in providing good wintertime bearing capacity is assumedly larger than that shown in Fig. 8.
Several assumptions were made in this study in order to simplify the calculations. Firstly, 20 cm depth of soil frost or 40 cm depth of snow cover may not be sufficient for good bearing capacity in all soil conditions. This is because the required soil frost depth is dependent on soil wetness, for example. In this study, we assumed constant water content in the soil. In dry soil conditions more than 50 cm of soil frost may be required to carry 10 t trucks (Shoop, 1995). However, in the present study the main focus was on carrying capacity of drained peatlands, which are the wettest forest environments in Finland and are thus the most difficult for harvesting wood in summer. Besides the experiment-based estimate of Eeronheimo (1991), about 20 cm depth of soil frost has been found sufficient in ensuring the bearing capacity of soil for forest harvesters in Finnish conditions in model-based studies, too (Suvinen et al., 2006; Kokkila, 2013).
The effect of forest density on soil frost formation was taken into account in our study in the modelling of snow depth. The snow model was first calibrated for open areas similarly as the soil temperature model. The effect of forest density on the snow depth was then evaluated based on literature. As we did not have any snow depth measurements from forested sites, the modelled snow depths for forested areas were susceptible to biases. In general, snow depth decreases with increasing forest density. In our calculations this led to somewhat enhanced soil frost formation in denser forests. However, the differences between different forest types were small. In reality, forest vegetation also acts as an insulator. Thus, open areas often have deeper soil frost than forests despite of having also deeper snowpack, but the results from different sites are contradictory (Soveri and Varjo, 1977). According to Yli-Vakkuri (1960) soil frost penetrates particularly deep in dense spruce forests due to their large canopy cover, leading to shallow snow depths.
The climate change impact on wintertime bearing capacity of forest soils was taken into account by using climate model simulations. The climate models usually poorly simulate soil frost penetration (e.g. Sinha and Cherkauer, 2010). Moreover, in northern Europe most of the GCMs and RCMs have a cold bias in winter (Cattiaux et al., 2013; Kotlarski et al., 2014). Thus we did not apply soil temperature or snow depth outputs directly from the models but first bias corrected and downscaled the climate model data onto a (approximately 10 km ×10 km) grid. Then, we used a relatively simple land surface model that could be calibrated for different soil types and implemented it with the available data to calculate the soil temperatures. By combining the soil and vegetation information with the soil frost calculations, the expected changes in timber harvesting conditions can be evaluated on a relatively small scale. However, in reality there is considerable variability in the soil frost conditions also within relatively similar soil and vegetation types. For example, the level of groundwater has a substantial impact on the soil frost depth (Soveri and Varjo, 1977). These kind of small-scale variations could not be taken into account in our approach, although the results are presented in a relatively high-resolution grid.
In all, there are several sources of uncertainty in the results of this study. The calibrated parameters describing different soil types are not exact, and in reality they are never exactly equal in different locations. Moreover, a model with almost equally good fit could be constructed with a very different set of parameters if the parameter values are adjusted conveniently. This is because there is no single best model parameter set, but many model state descriptions can generate equally good calibration outputs (Beven, 2006; Jungqvist et al., 2014). However, in many locations the model performed reasonably well even with the wrong soil type (Table S2), and as the stations used in calibrating the model are located in different parts of Finland, we assume that possible future changes in soil characteristics, including thermal conductivity, do not crucially change the results.
Despite many uncertainties in the soil frost modelling mentioned above, our results were in general reasonable. For instance, based on station observations of soil frost and snow cover depths, Eeronheimo (1991) stated that the length of the transporting season in peatland forests varies in Finland between approximately 60 and 190 days as defined by the requirement of 20 cm of soil frost or 40 cm of snow cover on unfrozen ground. When comparing this to our results for bearing season length during the baseline period in drained pine-dominated peatland forests (Fig. 2g), it can be seen that the difference is mainly less than 15 days.
Considering the future projections, the two used climate model ensembles we used yielded rather similar results (Figs. 3 and 4), including increasing scatter among the model projections towards the end of the century (Fig. 6). The RCM ensemble using WFDEI forcing data set (Weedon et al., 2014) in bias correction had some differences in spatial small-scale features of the bearing season length pattern compared to the GCM ensemble that used the gridded Finnish climate data set in bias correction (Aalto et al., 2016). Most notably, the RCMs produced longer soil frost periods along the coast of Bothnian Bay. Nevertheless, both model ensembles reproduced the general large-scale pattern of bearing season length satisfactorily after the bias correction when compared to the results calculated from observation-based gridded climate data (Fig. 2).
4.2 Evaluations of main results and their implications on forestry
In accordance with previous studies (Venäläinen et al., 2001a, b; Kellomäki et al., 2010), our results suggest that climate warming will lead to shorter soil frost periods, reducing wintertime ground-bearing capacity. Also a reduction in snow cover contributes to decreasing bearing capacity (Räisänen and Eklund, 2012). The projected decrease in the wintertime bearing season length was similar in the two climate model ensembles studied. Most likely the bearing season length in winter will decrease by about 1 month until the mid-21st century and by about 1.5–3 months until 2100. Nevertheless, there is considerable variation in the rate of the projected change among the individual climate model simulations.
In relative terms, the decrease in the wintertime bearing season length is most prominent in southern and western Finland. That is because in Lapland the season is typically 3 months longer than at the southern coast, and thus even the most extreme projections do not lead to a complete loss of the ground frost there. Similarly, abilities for wintertime logging on drained peatlands are expected to worsen more than on upland soil types. Based on our results it is evident that in the latter half of the century, on drained peatlands, logging cannot be expected to be conducted during frozen soil conditions in most parts of Finland. On the other hand, shortening the soil frost season leads to an earlier transition to summer conditions. This leads to a reduced soil moisture content in spring, and in summer, the soil moisture content is also projected as being most likely to decrease (Ruosteenoja et al., 2018). Consequently, possibilities for summertime logging may improve.
Our results considering the climate change impact on the conditions of forest harvesting and logistics provide urgently needed support for the planning of wood harvesting and transportation in different time spans and regions. During the last couple of decades, there has also been a trend towards heavier machinery in forest harvesting (Ala-Ilomäki et al., 2011), and the allowed maximum weight of timber trucks has increased (e.g. Malinen et al., 2014). The forest truck roads in Finland have been mainly constructed between 1960 and 1990, and many of them need major renovation before timber haulage can take place (Kaakkurivaara et al., 2005). Hence, maintaining sufficient bearing capacity in the forest truck road network is also important. Fortunately, there are several possibilities for improving mobility of forest machinery on poorly bearing conditions. For example, the carrying surface can be extending by using auxiliary wheels, width of individual wheels can be widened, tyre pressure can be reduced or wider tracks can be used (Airavaara et al., 2008). One possibility is also using two-stage wood harvesting. In this method, the cutting is conducted when the soil is still unfrozen, but wood stacks are extracted later in winter when the soil is frozen (Heikkilä, 2007). Logging residues can be placed on the forwarding trails to improve the soil bearing capacity as is done in northern Scotland in peatland harvesting (Röser et al. 2011). This, however, reduces the volume of harvestable logging residues for energy use. Nevertheless, as there is a pressure to increase wood harvesting in drained peatlands in the future with simultaneous decrease in the ground-bearing capacity, there is a clear need to develop new cost-effective solutions for peatland harvesting, taking into account this anticipated decrease in ground-bearing capacity.
4.3 Conclusions
The results of this study indicate clearly that the soil frost period in Finland will become shorter as climate becomes warmer. Hence, it is evident that a larger share of logging needs to be carried out under unfrozen soil conditions. Particularly this holds for drained peatlands, as the soil frost period there is shortest due to the insulating effect of peat. In southern and western Finland, drained peatlands might remain virtually frost-free in most of winters during the latter half of the current century. By 2050, the winters with only short frost periods will already become more common. The projected decrease in the bearing capacity, particularly in drained peatlands, with simultaneously increasing demand for the wood utilization from peatlands, induces a clear need for the development of new sustainable and efficient logging practices. To foster the use of our results, the data showing the average bearing season length in different combinations of soil and forest types during different study periods will be made publicly available.
The results presented here will also serve as a basis for several future analysis. The effects of changing climate on timber procurement in different regions of Finland should be analysed in more detail. In addition, the kind of supply technology development that needs exist concerning logging machinery, transportation fleet, and information systems managing and monitoring the raw material flows in the future should be analysed. These soil frost calculations can be also applied in studying climate change impacts on wind damage risks to forests, as soil frost makes trees more resistant for uprooting by anchoring them effectively to the ground (Peltola et al., 1999; Saad et al., 2017). With regard to harvesting logistics, it would be interesting to also study whether clear-cutting facilitates the transformation of some peatland stands marked for cutting in winter into stands marked for cutting in summer (Ala-Ilomäki et al. 2011; Sirén et al. 2013; Laitila et al., 2016). This is because, compared to thinning, clear-cutting allows greater freedom in the location of forwarding routes on-site as well as in organizing route schedules (Uusitalo et al., 2015b).
The climate model data used in this study can be downloaded from the CMIP5 and CORDEX archives, e.g. at https://esgf-node.ipsl.upmc.fr/projects/esgf-ipsl/ (last access: 14 March 2019). The observational gridded Finnish climate data from 1961 onwards can be downloaded from the Paituli spatial data download service at http://avaa.tdata.fi/web/paituli/metadata (last access: 14 March 2019). The soil temperature observations from the stations listed in Table 1 are available on request from the corresponding author. The spatial data describing the multi-GCM mean wintertime bearing season length in different combinations of soil and forest types over the studied periods can be downloaded from the Paituli spatial data download service at https://avaa.tdata.fi/web/paituli/latauspalvelu?data_id=il_soil_conditions_ 1981_txt_wgs (last access: 14 March 2019).
The supplement related to this article is available online at: https://doi.org/10.5194/hess-23-1611-2019-supplement.
AV, AA and HG designed the study. MK made the downscaling and bias correction for the GCM data. IL made the calculations and wrote the paper together with AV, AA, JL, PA and HP.
The authors declare that they have no conflict of interest.
This research has been supported by the Strategic Research Council at the Academy of Finland through the FORBIO (Sustainable, climate-neutral, and resource-efficient forest-based bioeconomy) research project (grant numbers 293380 and 314224). We acknowledge the World Climate Research Programme's Working Group on Regional Climate and Working Group on Coupled Modelling, the former being the coordinating body of the CORDEX project and the latter being responsible for CMIP. We are moreover grateful to all the modelling groups (listed in Tables S3 and S4 in the Supplement of this paper) for producing and making their model outputs available. The model data used in this work were obtained from the Earth System Grid Federation portal. For CMIP the US Department of Energy's Program for Climate Model Diagnosis and Intercomparison provided coordinating support and led development of software infrastructure in partnership with the Global Organization for Earth System Science Portals. Kimmo Ruosteenoja is acknowledged for downloading and preprocessing the GCM data. Olle Räty and Jouni Räisänen from Department of Physics, University of Helsinki, are acknowledged for developing the bias correction software applied to the GCM data. Annalea Lohila is acknowledged for providing soil temperature observations for Lettosuo, Kaamanen and Lompolojänkkä stations.
This paper was edited by Patricia Saco and reviewed by Jørn Kristiansen and two anonymous referees.
Aalto, J., Pirinen, P., and Jylhä, K.: New gridded daily climatology of Finland: Permutation-based uncertainty estimates and temporal trends in climate, J. Geophys. Res.-Atmos., 121, 3807–3823, https://doi.org/10.1002/2015JD024651, 2016.
Airavaara, H., Ala-Ilomäki, J., Högnäs, T., and Sirén, M.: Nykykalustolla turvemaiden puunkorjuuseen [Equipping conventional wheeled forwarders for peatland operations], Working Papers of the Finnish Forest Research Institute 80, 46 pp., 2008.
Ala-Ilomäki, J., Högnäs, T., Lamminen, S., and Siren, M.: Equipping a conventional wheeled forwarder for peatland operations, International Journal of Forest Engineering, 22, 7–13, 2011.
Anderson, E. A.: National Weather Service Forecast System-Snow Accumulation and Ablation model, NOAA Technical Memorandum NWS HYDRO-17, U.S. Dept. of Commerce, Silver Spring, MD, 217 pp., 1973.
Asikainen, A., Mutanen, A., Kangas, A., Vehmasto, E., Verkasalo, E., Ylitalo, E., Hynynen, J., Viitanen, J., Backman, J., Laitila, J., Korhonen, K.T., Finér, L., Neuvonen, M., Kurttila, M., Peltoniemi, M., Salminen, O., Peltonen-Sainio, P., Peltola, R., Korpinen, R., Kurppa, S., Räty, T., Saksa, T., Sievänen, T., Packalen, T., Saarinen, V.-M., Kankaanhuhta, V., and Kolttola, L.: Vihreä biotalous: 100-vuotiaan Suomen hyvinvoinnin ja kilpailukyvyn perusta, edited by: Jaakkonen, A.-K. and Ylitalo, E., Luonnonvara- ja biotalouden tutkimus 59/2016, 25 pp., 2016.
Aurela, M., Laurila, T., and Tuovinen, J.-P.: Seasonal CO2 balances of a subarctic mire, J. Geophys. Res., 106, 1623–1637, https://doi.org/10.1029/2000JD900481, 2001.
Aurela, M., Lohila, A., Tuovinen, J.-P., Hatakka, J., Penttilä, T., and Laurila, T.: Carbon dioxide and energy flux measurements in four northern-boreal ecosystems at Pallas, Boreal Environ. Res., 20, 455–473, 2015.
Barrere, M., Domine, F., Decharme, B., Morin, S., Vionnet, V., and Lafaysse, M.: Evaluating the performance of coupled snow-soil models in SURFEXv8 to simulate the permafrost thermal regime at a high Arctic site, Geosci. Model Dev., 10, 3461–3479, https://doi.org/10.5194/gmd-10-3461-2017, 2017.
Beven, K.: A manifesto for the equifinality thesis, J. Hydrol., 320, 18–36, https://doi.org/10.1016/j.jhydrol.2005.07.007, 2006.
Carroll, M. J., Dennis, P., Pearce-Higgins, J. W., and Thomas, C. D.: Maintaining northern peatland ecosystems in a changing climate: effects of soil moisture, drainage and drain blocking in craneflies, Glob. Change Biol., 17, 2991–3001, https://doi.org/10.1111/j.1365-2486.2011.02416.x, 2011.
Cattiaux, J., Douville, H., and Peings, Y.: European temperatures in CMIP5: origins of present-day biases and future uncertainties, Clim. Dynam., 41, 2889–2907, https://doi.org/10.1007/s00382-013-1731-y, 2013.
Collins, M., Knutti, R., Arblaster, J., Dufresne, J.-L., Fichefet, T., Friedlingstein, P., Gao, X., Gutowski, W. J., Johns, T., Krinner, G., Shongwe, M., Tebaldi, C., Weaver, A. J., and Wehner, M.: Long-term climate change: projections, commitments and irreversibility, in: The Physical Science Basis, Contribution of Working Group I to the Fifth Assessment Report of the Intergovernmental Panel on Climate Change, edited by: Stocker, T. F., Qin, D., Plattner, G.-K., Tignot, M., Allen, S. K., Boschung, J., Nauels, A., Xia, Y., Bex, V., and Midgley, P. M., Cambridge University Press, Cambridge and New York, 1029–1136, 2013.
Eeronheimo, O.: Suometsien puunkorjuu – Forest harvesting on peatlands, Folia Forestalia 779, The Finnish Forest Research Institute, 29 pp., available at: https://core.ac.uk/download/pdf/52273561.pdf (last access: 12 December 2017), 1991.
Finnish Forest Research Institute: State of Finland's Forests 2011, Based on the Criteria and Indicators of Sustainable Forest Management, Ministry of Agriculture and Forestry and Finnish Forest Research Institute 5a/2011, Suomen Graafiset Palvelut Oy, Kuopio, 96 pp., 2011.
Finnish Forest Research Institute: Finnish Statistical Yearbook of Forestry, Tammerprint, Tampere, 428 pp., 2014.
Flato, G., Marotzke, J., Abiodun, B., Braconnot, P., Chou, S. C., Collins, W., Cox, P., Driouech, F., Emori, S., Eyring, V., Forest, C., Gleckler, P., Guilyardi, E., Jakob, C., Kattsov, V., Reason, C., and Rummukainen, M.: Evaluation of Climate Models, in: Climate Change 2013: The Physical Science Basis. Contribution of Working Group I to the Fifth Assessment Report of the Intergovernmental Panel on Climate Change, edited by: Stocker, T. F., Qin, D., Plattner, G.-K., Tignor, M., Allen, S. K., Boschung, J., Nauels A., Xia, Y., Bex, V., and Midgley, P. M., Cambridge University Press, Cambridge and New York, 741–866, 2013.
Gregow, H., Peltola, H., Laapas, M., Saku, S., and Venäläinen, A.: Combined occurrence of wind, snow loading and soil frost with implications for risks to forestry in Finland under the current and changing climatic conditions, Silva Fenn., 45, 35–54, 2011.
Gurevich, M. I.: Dependence of the snow melting rate on air temperature, Meteorology and Hydrology (Meteorologiya i gidrologiya), No. 3, 44–48, 1950.
Hankimo, J.: Sateen olomuodon prediktoreista, Finnish Meteorological Institute, tutkimusseloste 57, 1976.
Hedstrom, N. R. and Pomeroy, J. W.: Measurements and modelling of snow interception in the boreal forest, Hydrol. Process., 12, 1611–1625, https://doi.org/10.1002/(SICI)1099-1085(199808/09)12:10/11<1611::AID-HYP684>3.0.CO;2-4, 1998.
Heikinheimo, M. and Fougstedt, B.: Statistics of soil temperature in Finland 1971–1990, Meteorological Publications, Finnish Meteorological Institute, Painatuskeskus Oy, Helsinki, 75 pp., 1992.
Heikkilä, J.: Turvemaiden puun kasvatus ja korjuu – nykytila ja kehittämistarpeet [Silviculture and harvesting of peatland forests – the current state and future development needs], Working Papers of the Finnish Forest Research Institute 43, 29 pp., 2007.
Hiitiö, M.: Lumen sulannasta ja sen aiheuttaman valunnan arvioinnista, M.Sc. thesis, Department of Civil Engineering, Helsinki University of Technology, Finland, 96 pp., 1982.
Houle, D., Bouffard, A., Duchesne, L., Logan, T., and Harvey, R.: Projections of future soil temperature and water content for three southern Quebec forested sites, J. Climate, 25, 7690–7701, https://doi.org/10.1175/JCLI-D-11-00440.1, 2012.
Jacob, D., Petersen, J., Eggert, B., Alias, A., Christensen, O. B., Bouwer, L. M., Braun, A., Colette, A., Déqué M., Georgievski, G., Georgopoulou, E., Gobiet, A., Menut, L, Nikulin, G., Haensler, A, Hempelmann, N., Jones, C., Keuler, K., Kovats, S., Kröner, N., Kotlarski, S., Kriegsmann, A., Martin, E., van Meijgaard, E., Moseley, C., Pfeifer, S., Preuschmann, S., Radermacher, C., Radtke, K., Rechid, D., Rounsevell, M., Samuelsson, P., Somot, S., Soussana, J.-F., Teichmann, C., Valentini, R., Vautard, R., Weber, B., and Yiou, P.: EURO-CORDEX: new high-resolution climate change projections for European impact research, Reg. Environ. Change, 14, 563–578, https://doi.org/10.1007/s10113-013-0499-2, 2014.
Jansson, P.-E.: CoupModel: model use, calibration, and validation, T. ASABE, 55, 1335–1344, 2012.
Jungqvist, G., Oni, S. K., Teutschbein, C., and Futter, M. N.: Effect of climate change on soil temperature in Swedish boreal forests, PLoS ONE, 9, e93957, https://doi.org/10.1371/journal.pone.0093957, 2014.
Kaakkurivaara, T., Vuorimies, N., Kolisoja, P., and Uusitalo, J.: Applicability of portable tools in assessing the bearing capacity of forest roads, Silva Fenn., 49, 1239, https://doi.org/10.14214/sf.1239, 2015.
Kellomäki, S., Maajärvi, M., Strandman, H., Kilpeläinen, A., and Peltola, H.: Model computations on the climate change effects on snow cover, soil moisture and soil frost in the boreal conditions over Finland, Silva Fenn., 44, 213–233, https://doi.org/10.14214/sf.455, 2010.
Kokkila, M.: Ilmastonmuutoksen vaikutus puunkorjuun talvikauden korjuuoloihin hienojakoisella kivennäismaalla, Metsätieteen aikakauskirja, 1/2013, 5–18, https://doi.org/10.14214/ma.6028, 2013.
Komulainen, V.-M., Tuittila, E.-S., Vasander, H., and Laine, J.: Restoration of drained peatlands in southern Finland: initial effects on vegetation change and CO2 balance, J. Appl. Ecol., 36, 634–648, https://doi.org/10.1046/j.1365-2664.1999.00430.x, 1999.
Korkiakoski, M., Tuovinen, J.-P., Aurela, M., Koskinen, M., Minkkinen, K., Ojanen, P., Penttilä, T., Rainne, J., Laurila, T., and Lohila, A.: Methane exchange at the peatland forest floor – automatic chamber system exposes the dynamics of small fluxes, Biogeosciences, 14, 1947–1967, https://doi.org/10.5194/bg-14-1947-2017, 2017.
Kotlarski, S., Keuler, K., Christensen, O. B., Colette, A., Déqué, M., Gobiet, A., Goergen, K., Jacob, D., Lüthi, D., van Meijgaard, E., Nikulin, G., Schär, C., Teichmann, C., Vautard, R., Warrach-Sagi, K., and Wulfmeyer, V.: Regional climate modeling on European scales: a joint standard evaluation of the EURO-CORDEX RCM ensemble, Geosci. Model Dev., 7, 1297–1333, https://doi.org/10.5194/gmd-7-1297-2014, 2014.
Kozlowski, T.: Some factors affecting supercooling and the equilibrium freezing point in soil–water systems, Cold Reg. Sci. Technol., 59, 25–33, https://doi.org/10.1016/j.coldregions.2009.05.009, 2009.
Knutti, R. and Sedláček, J.: Robustness and uncertainties in the new CMIP5 climate model projections, Nat. Clim. Change, 3, 369–373, https://doi.org/10.1038/nclimate1716, 2013.
Laitila, J., Väätäinen, K., and Asikainen, A.: Comparison of two harvesting methods for complete tree removal on tree stands on drained peatlands, Suo, 64, 77–95, 2013.
Laitila, J., Niemistö, P., and Väätäinen, K.: Productivity of multi-tree cutting in thinnings and clear cuttings of young downy birch (Betula pubescens) dominated stands in the integrated harvesting of pulpwood and energy wood, Balt. For., 22, 116–131, 2016.
Lundberg, A. and Koivusalo, H.: Estimating winter evaporation in boreal forests with operational snow course data, Hydrol. Process., 17, 1479–1493, https://doi.org/10.1002/hyp.1179, 2003.
Malinen, J., Nousiainen, V., Palojärvi, K., and Palander, T.: Prospects and challenges of timber trucking in a changing operational environment in Finland, Croat. J. For. Eng., 35, 91–100, 2014.
Maraun, D. and Widmann, M.: Statistical downscaling and bias correction for climate research, Cambridge University Press, Cambridge, 347 pp., 2018.
Ministry of Employment and the Economy, Ministry of Agriculture and Forestry, and Ministry of the Environment: Sustainable growth from bioeconomy – The Finnish bioeconomy strategy, Edita Prime Ltd, 17 pp., available at: http://biotalous.fi/wp-content/uploads/2014/08/The_Finnish_Bioeconomy_Strategy_110620141.pdf (last access: 12 December 2017), 2014.
Natural Resources Institute Finland: Forest industries' wood consumption 2016, available at: http://stat.luke.fi/en/forest-industries-wood-consumption-2016_en, last access: 12 December 2017a.
Natural Resources Institute Finland: Finnish roundwood harvests to a record level in 2016, available at: https://www.luke.fi/en/news/finnish-roundwood-harvests-record-level-2016/, last access: 12 December 2017b.
Nugent, C., Kanali, C., Owende, P. M. O., Nieuwenhuis, M., and Ward, S.: Characteristic site disturbance due to harvesting and extraction machinery traffic on sensitive forest sites with peat soils, Forest Ecol. Manag., 180, 85–98, https://doi.org/10.1016/S0378-1127(02)00628-X, 2003.
Oni, S. K., Mieres, F., Futter, M. N., and Laudon, H.: Soil temperature responses to climate change along a gradient of upland-riparian transect in boreal forest, Climatic Change, 143, 27–41, https://doi.org/10.1007/s10584-017-1977-1, 2017.
Park, S. K., Sungmin, O., and Cassardo, C.: Soil temperature response in Korea to a changing climate using a land surface model, Asia-Pac. J. Atmos. Sci., 53, 457–470, https://doi.org/10.1007/s13143-017-0048-x, 2017.
Pärn, J., Verhoeven, J. T. A., Butterbach-Bahl, K., Dise, N. B., Ullah, S., Aasa, A., Egorov, S., Espenberg, M., Järvenoja, J., Jauhiainen, J., Kasak, K., Klemedtsson, L., Kull, A., Laggoun-Défarge, F., Lapshina, E. D., Lohila, A., Lõhmus, K., Maddison, M., Mitsch, W. J., Müller, C., Niinemets, Ü, Osborne, B., Pae, T., Salm, J.-O., Sgouridis, F., Sohar, K., Soosaar, K., Storey, K., Teemusk, A., Tenywa, M. M., Tournebize, J., Truu, J., Veber, G., Villa, J. A., Zaw, S. S., and Mander, Ü.: Nitrogen-rich organic soils under warm well-drained conditions are global nitrous oxide emission hotspots, Nat. Commun., 9, 1135, https://doi.org/10.1038/s41467-018-03540-1, 2018.
Peltola, H., Kellomäki, S., and Väisänen, H.: Model computations of the impact of climatic change on the windthrow risk of trees, Climatic Change, 41, 17–36, https://doi.org/10.1023/A:1005399822319, 1999.
Pitkänen, A., Turunen, J., Tahvanainen, T., and Simola, H.: Carbon storage change in a partially forestry-drained boreal mire determined through peat column inventories, Boreal Environ. Res., 18, 223–234, 2013.
Pohjankukka, J., Riihimäki, H., Nevalainen, P., Pahikkala, T., Ala-Ilomäki, J., Hyvönen, E., Varjo, J., and Heikkonen, J.: Predictability of boreal forest soil bearing capacity by machine learning, J. Terramechanics, 68, 1–8, https://doi.org/10.1016/j.jterra.2016.09.001, 2016.
Räisänen, J. and Eklund, J.: 21st century changes in snow climate in Northern Europé: a high-resolution view from ENSEMBLES regional climate models, Climate Dynamics, 38, 2575–2591, https://doi.org/10.1007/s00382-011-1076-3, 2012.
Räisänen, J. and Räty, O.: Projections of daily mean temperature variability in the future: cross-validation tests with ENSEMBLES regional climate models, Clim. Dynam., 41, 1553–1568, https://doi.org/10.1007/s00382-012-1515-9, 2013.
Räisänen, J. and Ylhäisi, J. S.: CO2-induced climate change in northern Europe: CMIP2 versus CMIP3 versus CMIP5, Clim. Dynam., 45, 1877–1897, https://doi.org/10.1007/s00382-014-2440-x, 2015.
Rankinen, K., Karvonen, T., and Butterfield, D.: A simple model for predicting soil temperature in snow-covered and seasonally frozen soil: model description and testing, Hydrol. Earth Syst. Sci., 8, 706–716, https://doi.org/10.5194/hess-8-706-2004, 2004.
Rasmus, S., Gustafsson, D., Koivusalo, H., Laurén, A., Grelle, A., Kauppinen, O.-K., Lagnvall, O., Lindroth, A., Rasmus, K., Svensson, M., and Weslien, P.: Estimation of winter leaf area index and sky view fraction for snow modelling in boreal coniferous forests: consequences on snow mass and energy balance, Hydrol. Process., 27, 2876–2891, https://doi.org/10.1002/hyp.9432, 2013.
Räty, O., Räisänen, J., and Ylhäisi J. S.: Evaluation of delta change and bias correction methods for future daily precipitation: intermodel cross-validation using ENSEMBLES simulations, Clim. Dynam., 42, 2287–2303, https://doi.org/10.1007/s00382-014-2130-8, 2014.
Röser, D., Sikanen, L., Asikainen, A., Parikka, H., and Väätäinen, K.: Productivity and cost of mechanized energy wood harvesting in Northern Scotland, Biomass Bioenerg., 35, 4570–4580, https://doi.org/10.1016/j.biombioe.2011.06.028, 2011.
Ruosteenoja, K., Jylhä, K., and Kämäräinen, M.: Climate projections for Finland under the RCP forcing scenarios, Geophysica, 51, 17–50, 2016.
Ruosteenoja, K., Markkanen, T., Venäläinen, A., Räisänen, P., and Peltola, H.: Seasonal soil moisture and drought occurrence in Europe in CMIP5 projections for the 21st century, Clim. Dynam., 50, 1177–1192, https://doi.org/10.1007/s00382-017-3671-4, 2018.
Saad, C., Boulanger, Y., Beaudet, M., Gachon, P., Ruel, J.-C., and Gauthier, S.: Potential impact of climate change on the risk of windthrow in eastern Canada's forests, Climatic Change, 143, 487–501, https://doi.org/10.1007/s10584-017-1995-z, 2017.
Shoop, S. A.: Vehicle bearing capacity of frozen ground over a soft substrate, Can. Geotech. J., 32, 552–556, https://doi.org/10.1139/t95-057, 1995.
Simola, H., Pitkänen, A., and Turunen, J.: Carbon loss in drained forestry peatlands in Finland, estimated by resampling peatlands surveyed in the 1980s, Eur. J. Soil Sci., 63, 798–807, https://doi.org/10.1111/j.1365-2389.2012.01499.x, 2012.
Sinha, T. and Cherkauer, K. A.: Impacts of future climate change on soil frost in the Midwestern United States, J. Geophys. Res., 115, D08105, https://doi.org/10.1029/2009JD012188, 2010.
Sirén, M., Ala-Ilomäki, J., Mäkinen, H., Lamminen, S., and Mikkola, T.: Harvesting damage caused by thinning of Norway spruce in unfrozen soil, International Journal of Forest Engineering, 24, 60–75, https://doi.org/10.1080/19132220.2013.792155, 2013.
Soveri, J. and Varjo, M.: Roudan muodostumisesta ja esiintymisestä Suomessa vuosina 1955–1975, Publications of the Water Research Institute, National Board of Waters, Valtion Painatuskeskus, Helsinki, 66 pp., 1977.
Stähli, M. and Gustafsson, D.: Long-term investigations of the snow cover in a subalpine semi-forested catchment, Hydrol. Process., 20, 411–428, https://doi.org/10.1002/hyp.6058, 2006.
Style, R. W., Peppin, S. S. L., Cocks, A. C. F., and Wettlaufer, J. S.: Ice-lens formation and geometrical supercooling in soils and other colloidal materials, Phys. Rev. E, 84, 041402, https://doi.org/10.1103/PhysRevE.84.041402, 2011.
Suvinen, A.: A GIS-based simulation model for terrain tractability, J. Terramechanics, 43, 427–449, https://doi.org/10.1016/j.jterra.2005.05.002, 2006.
Svenson, G. and Fjeld, D.: The impact of road geometry and surface roughness on fuel consumption of logging trucks, Scand. J. Forest Res., 31, 526–536, https://doi.org/10.1080/02827581.2015.1092574, 2016.
Taskinen, A. and Söderholm, K.: Operational correction of daily precipitation measurements in Finland, Boreal Environ. Res., 21, 1–24, 2016.
Taylor, K. E., Stouffer, R. J., and Meehl, G. A.: An overview of CMIP5 and the experimental design, B. Am. Meteorol. Soc., 93, 485–498, https://doi.org/10.1175/BAMS-D-11-00094.1, 2012.
Uusitalo, J. and Ala-Ilomäki, J.: The significance of above-ground biomass, moisture content and mechanical properties of peat layer on the bearing capacity of ditched pine bogs, Silva Fenn., 47, 993, https://doi.org/10.14214/sf.993, 2013.
Uusitalo, J., Salomäki, M., and Ala-Ilomäki, J.: Variation of the factors affecting soil bearing capacity of ditched pine bogs in Southern Finland, Scand. J. Forest Res., 30, 429–439, https://doi.org/10.1080/02827581.2015.1012110, 2015a.
Uusitalo, J., Salomäki, M., and Ala-Ilomäki, J.: The effect of wider logging trails on rut formation in the harvesting of peatland forests, Croat. J. For. Eng., 36, 125–130, 2015b.
van Vuuren, D. P., Edmonds, J., Kainuma M., Riahi, K., Thomson, A., Hibbard, K., Hurtt, G. C., Kram, T., Krey, V., Lamarque, J.-F., Masui, T., Meinshausen, M., Nakicenovic, N., Smith, S. J., and Rose, S. K.: The representative concentration pathways: an overview, Climatic Change, 109, 5–31, https://doi.org/10.1007/s10584-011-0148-z, 2011.
Varhola, A., Coops, N. C., Weiler, M., and Dan Moore, R.: Forest canopy effects on snow accumulation and ablation: An integrative review of empirical results, J. Hydrol., 392, 219–233, https://doi.org/10.1016/j.jhydrol.2010.08.009, 2010.
Vehviläinen, B.: Snow cover models in operational watershed forecasting, Publications of the Water and Environment Research Institute, National Board of Waters and the Environment, Valtion Painatuskeskus, Helsinki, 112 pp., 1992.
Venäläinen, A., Tuomenvirta, H., Heikinheimo, M., Kellomäki, S., Peltola, H., Strandman, H., and Väisänen, H.: Impact of climate change on soil frost under snow cover in a forested landscape, Clim. Res., 17, 63–72, https://doi.org/10.3354/cr017063, 2001a.
Venäläinen, A., Tuomenvirta, H., Lahtinen, R., and Heikinheimo, M.: The influence of climate warming on soil frost on snow-free surfaces in Finland, Climatic Change, 50, 111–128, https://doi.org/10.1023/A:1010663429684, 2001b.
Vrac, M., Noël, T., and Vautard, R.: Bias correction of precipitation through Singularity Stochastic Removal: Because occurrences matter, J. Geophys. Res.-Atmos., 121, 5237–5258, https://doi.org/10.1002/2015JD024511, 2016.
Weedon, G. P., Balsamo, G., Bellouin, N., Gomes, S., Best, M. J., and Viterbo, P.: The WFDEI meteorological forcing data set: WATCH Forcing Data methodology applied to ERA-Interim reanalysis data, Water Resour. Res., 50, 7505–7514, https://doi.org/10.1002/2014WR015638, 2014.
Yang, D., Goodison, B. E., Metcalfe, J. R., Louie, P., Leavesley, G., Emerson, D., Hanson, C. L., Golubev, V. S., Elomaa, E., Gunther, T., Pangburn, T., Kang, E., and Milkovic, J.: Quantification of precipitation measurement discontinuity induced by wind shields on national gauges, Water Resour. Res., 35, 491–508, https://doi.org/10.1029/1998WR900042, 1999.
Yin, X. W. and Arp, P. A.: Predicting forest soil temperatures from monthly air temperature and precipitation records, Can. J. Forest Res., 23, 2521–2536, https://doi.org/10.1139/x93-313, 1993.
Yli-Vakkuri, P.: Metsiköiden routa- ja lumisuhteista, Acta Forestalia Fennica, 71, 7114, https://doi.org/10.14214/aff.7114, 1960.