the Creative Commons Attribution 4.0 License.
the Creative Commons Attribution 4.0 License.
 | 08 Apr 2019
Anthropogenic and catchment characteristic signatures in the water quality of Swiss rivers: a quantitative assessment
Paolo Burlando
Simone Fatichi
The hydrological and biogeochemical response of rivers carries information about solute sources, pathways, and transformations in the catchment. We investigate long-term water quality data of 11 Swiss catchments with the objective to discern the influence of major catchment characteristics and anthropic activities on delivery of solutes in stream water. Magnitude, trends, and seasonality of water quality samplings of different solutes are evaluated and compared across catchments. Subsequently, the empirical dependence between concentration and discharge is used to classify the solute behaviors.
While the anthropogenic impacts are clearly detectable in the concentration of certain solutes (i.e., Na+, Cl−, NO3, DRP), the influence of single catchment characteristics such as geology (e.g., on Ca2+ and H4SiO4), topography (e.g., on DOC, TOC, and TP), and size (e.g., on DOC and TOC) is only sometimes visible, which is also because of the limited sample size and the spatial heterogeneity within catchments. Solute variability in time is generally smaller than discharge variability and the most significant trends in time are due to temporal variations of anthropogenic rather than natural forcing. The majority of solutes show dilution with increasing discharge, especially geogenic species, while sediment-bonded solutes (e.g., total phosphorous and organic carbon species) show higher concentrations with increasing discharge. Both natural and anthropogenic factors affect the biogeochemical response of streams, and, while the majority of solutes show identifiable behaviors in individual catchments, only a minority of behaviors can be generalized across the 11 catchments that exhibit different natural, climatic, and anthropogenic features.
- Article
(5493 KB) -
Supplement
(1506 KB) - BibTeX
- EndNote


Hydrological and biogeochemical responses of catchments are essential for understanding the dynamics and fate of solutes within the catchment, as material transported with water carries information about water sources, residence time, and biogeochemical transformations (Abbott et al., 2016). A quantitative description of water quality trends can also shed light on the consequences of anthropogenic changes in the catchment as well as on the possibilities for preventive or remedial actions (Turner and Rabalais, 1991). Concerning changes in watershed land use or management practices, for example, the United States Geological Survey (USGS) established the Hydrologic Benchmark Network (HBN) (Leopold, 1962), a long-term monitoring system of dissolved concentrations in 59 differently impacted sites across the United States with the goal of quantifying the human influence on the ecosystems (Beisecker and Leifeste, 1975). Water quality monitoring and assessment are also crucial for stream and catchment restoration, which has been widely practiced in the USA and Europe for several decades and still represents an important challenge of river basin management. However, the system responses to restoration often contradict a priori expectations, and the lack of adequate monitoring and assessment of basin functioning before the application of restoration measures is considered to be one of the main reasons for this discrepancy (Hamilton, 2011).
The relationship between observed in-stream solute concentrations and discharge has been explored in various catchments and with different methods in the last decades (Langbein and Dawdy, 1964; Johnson et al., 1969; Hall, 1970, 1971; White and Blum, 1995; Evans and Davies, 1998; Calmels et al., 2011). One emerging postulate is that concentration–discharge (C–Q) relations represent the quantitative expression of the interaction between catchment geomorphology, land use, hydrological processes, and the solute releases, thus reflecting in lumped form the complex mixing process taking place along flow paths of variable lengths and residence time (Chorover et al., 2017). Therefore, C–Q relations have been studied with reference to hydrological variables, e.g., hydrologic connectivity and residence time (Herndon et al., 2015; Baronas et al., 2017; Duncan et al., 2017a; Gwenzi et al., 2017; Torres et al., 2017); biological processes (Duncan et al., 2017a); catchment characteristics, e.g., catchment topography, land use, catchment size, and lithological properties (Musolff et al., 2015; Baronas et al., 2017; Diamond and Cohen, 2017; Hunsaker and Johnson, 2017; Moatar et al., 2017; Wymore et al., 2017); and anthropic activities (Basu et al., 2010; Thompson et al., 2011; Musolff et al., 2015; Baronas et al., 2017).
In a log (C)–log (Q) space, C–Q relations have been observed to be usually linear (Godsey et al., 2009), so that the empirical relations can be well approximated by a power law, , where a and b are fitting parameters (Godsey et al., 2009; Basu et al., 2010; Thompson et al., 2011; Moquet et al., 2015; Moatar et al., 2017; Musolff et al., 2017). A very common metric, relevant also for this study, is based on the value of the b exponent, the slope of the regression in the log (C)–log (Q) plot, because it is related to the concept of “chemostasis” (Godsey et al., 2009) or “biogeochemical stationarity” (Basu et al., 2010). A catchment shows “chemostatic” behavior when, despite a sensible variation in discharge, solute concentrations show a negligible variability, i.e., b≅0. Conversely, positive slopes (i.e., increasing concentrations with increasing discharge) would support an enrichment behavior when the solute amount grows with discharge, and negative slopes (i.e., decreasing concentrations with increasing discharge) support a dilution behavior with solute mass that does not increase proportionally to the growing discharge. A solute is typically defined as transport-limited if it is characterized by enrichment, while it is called source-limited in cases where it dilutes (Duncan et al., 2017a).
The exact mechanisms leading to C–Q relations are, to a large extent, an open question, but these relations are providing insights on solute and/or catchment behavior (Godsey et al., 2009; Moatar et al., 2017). The concept of chemostasis emerged in studies that explored the C–Q power law with the aim of demonstrating the similarities in the export behavior of nutrients (Basu et al., 2010, 2011) and geogenic solutes (Godsey et al., 2009) across a range of catchments (Musolff et al., 2015). These studies were mostly carried out in agricultural catchments, where a “legacy storage” was supposed to exist due to antecedent intensive fertilization practices (Basu et al., 2010, 2011; Hamilton, 2011; Sharpley et al., 2013; Van Meter and Basu, 2015; Van Meter et al., 2016a, b). This storage of nutrients might have long-memory effects, and it was considered to buffer the variability in concentrations in streams, leading to the emergence of biogeochemical stationarity (Basu et al., 2011). However, biogeochemical stationarity has been questioned outside of agriculturally impacted catchments (Thompson et al., 2011), and a unifying theory explaining catchment-specific C–Q behavior is not available yet, considering that solutes can show different behaviors in relation to landscape heterogeneity (Herndon et al., 2015) and to the spatial and temporal scales of measurement (Gwenzi et al., 2017). Therefore, approaching the study of solute export and C–Q relations requires the separate analysis of several solutes in as many catchments as possible with the aim of finding, at least, some general behavior that can be characteristic of a given region or solute. The recent literature is moving toward this direction (Herndon et al., 2015; Wymore et al., 2017) with the aim of sorting out the relative influence of climatic forcing, solute properties, and catchment characteristics on solute behavior in search for generalizations across different catchments.
This study contributes to this line of research investigating a unique dataset of long-term water quality data in 11 catchments in Switzerland, where multiple solutes were observed at the biweekly (every 2 weeks) scale for multiple decades with limited gaps. We perform the analysis focusing mainly on the temporal domain and by quantifying magnitude, temporal trends, and seasonality of the in-stream concentrations with the goal of highlighting the long-term behavior differences across the 11 catchments and investigating the drivers of such differences. Specifically, we focus on the following research objectives: (i) investigating to which extent the solute concentrations are influenced by anthropic activities; (ii) exploring the dependence of solute concentrations on catchment characteristics; and (iii) generalizing, if possible, the behaviors of selected solutes across different catchments by means of the slope in the C–Q relations.
Observations used in this study are obtained from the Swiss National River Monitoring and Survey Program (NADUF, 2019), which represents the Swiss long-term surface water quality monitoring program. This database includes in total 26 monitoring stations located in different catchments. To ensure representativity and robustness of the analysis we focus only on those stations with at least 10 consecutive years of water quality measurements. This restricts the database to 11 catchments, the corresponding locations of which are shown in Fig. 1. The resulting case studies include five main catchments (Thur, AN; Aare, BR; Rhine, WM; Rhone, PO; and Inn, SA), three sub-catchments (Rhone, PO; Rhine, RE; and Rhine, DI), and two small headwater catchments (Erlenbach, ER; and Lümpenenbach, LU).
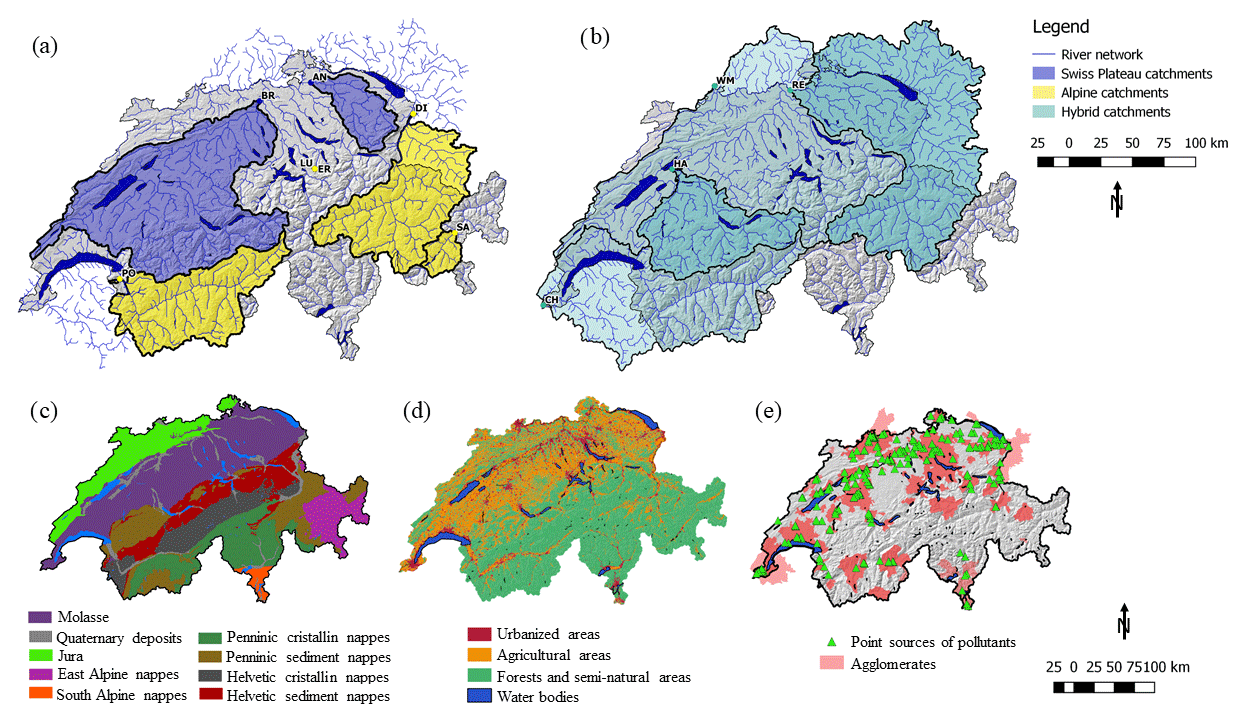
Figure 1Map of NADUF monitoring stations and description of the study area. The upper panel represents the studied catchments. (a) Swiss Plateau (blue) and the Alpine catchments (yellow); (b) the catchments spanning both regions, hybrid catchments (light blue). The bottom panel describes the study sites in terms of (c) macro-geological classes, (d) land cover, and (e) anthropic pressure.
Measurements have a temporal resolution of 14 days, which is similar to the resolution of other studies that analyzed long-term water quality data. In the literature, the temporal resolution of water quality observations ranges namely from weekly (Duncan et al., 2017a, b; Gwenzi et al., 2017; Moatar et al., 2017; Wymore et al., 2017) to 14-day (Hunsaker and Johnson, 2017) to monthly (Basu et al., 2010; Thompson et al., 2011; Musolff et al., 2015; Mora et al., 2016; Moatar et al., 2017) or even coarser resolution (Godsey et al., 2009). In fact, only very rarely higher-frequency databases are collected and thus analyzed (e.g., Neal et al., 2012, 2013; von Freyberg et al., 2017).
Stream water is analyzed only twice per month but is collected continuously, thus providing samples that represent a flow-proportional integral of the preceding 14 days. River water is lifted continuously by a submersible pump into a closed overflow container (25 L) in the station, at a flow rate of 25–75 L min−1. From the container, samples are transferred in 1 mL portions to sampling bottles. The frequency for the transfer of 1 mL samples is proportional to the discharge monitored continuously by the gauging device in the same station. The discharge-proportional sampling device is designed to collect 1–3 L of sample per bottle in each period. The sampling mechanism also allows the simultaneous collection of up to four integrated samples.
A 14-day sampling frequency is not sufficient for an evaluation of short-term biogeochemical and transport processes, which might involve solute transformation (e.g., biological processes, in-stream chemical reactions). These are simply accounted for in a lumped form in the flow-proportional average concentrations collected in a 2-week interval. Conversely, the dataset is especially suitable for the investigation of long-term trends, due to the length of the time series, which spans from 11 to 42 years (Table 1). Data are collected following ISO/EN conform methods for water analysis and are subsequently validated by means of an extensive quality control as described in Zobrist et al. (2018). In addition, we inspected the data to take into account possible errors deriving from fixed detection limits, e.g., deleting the values below the detection thresholds (see Sect. S1 in the Supplement).
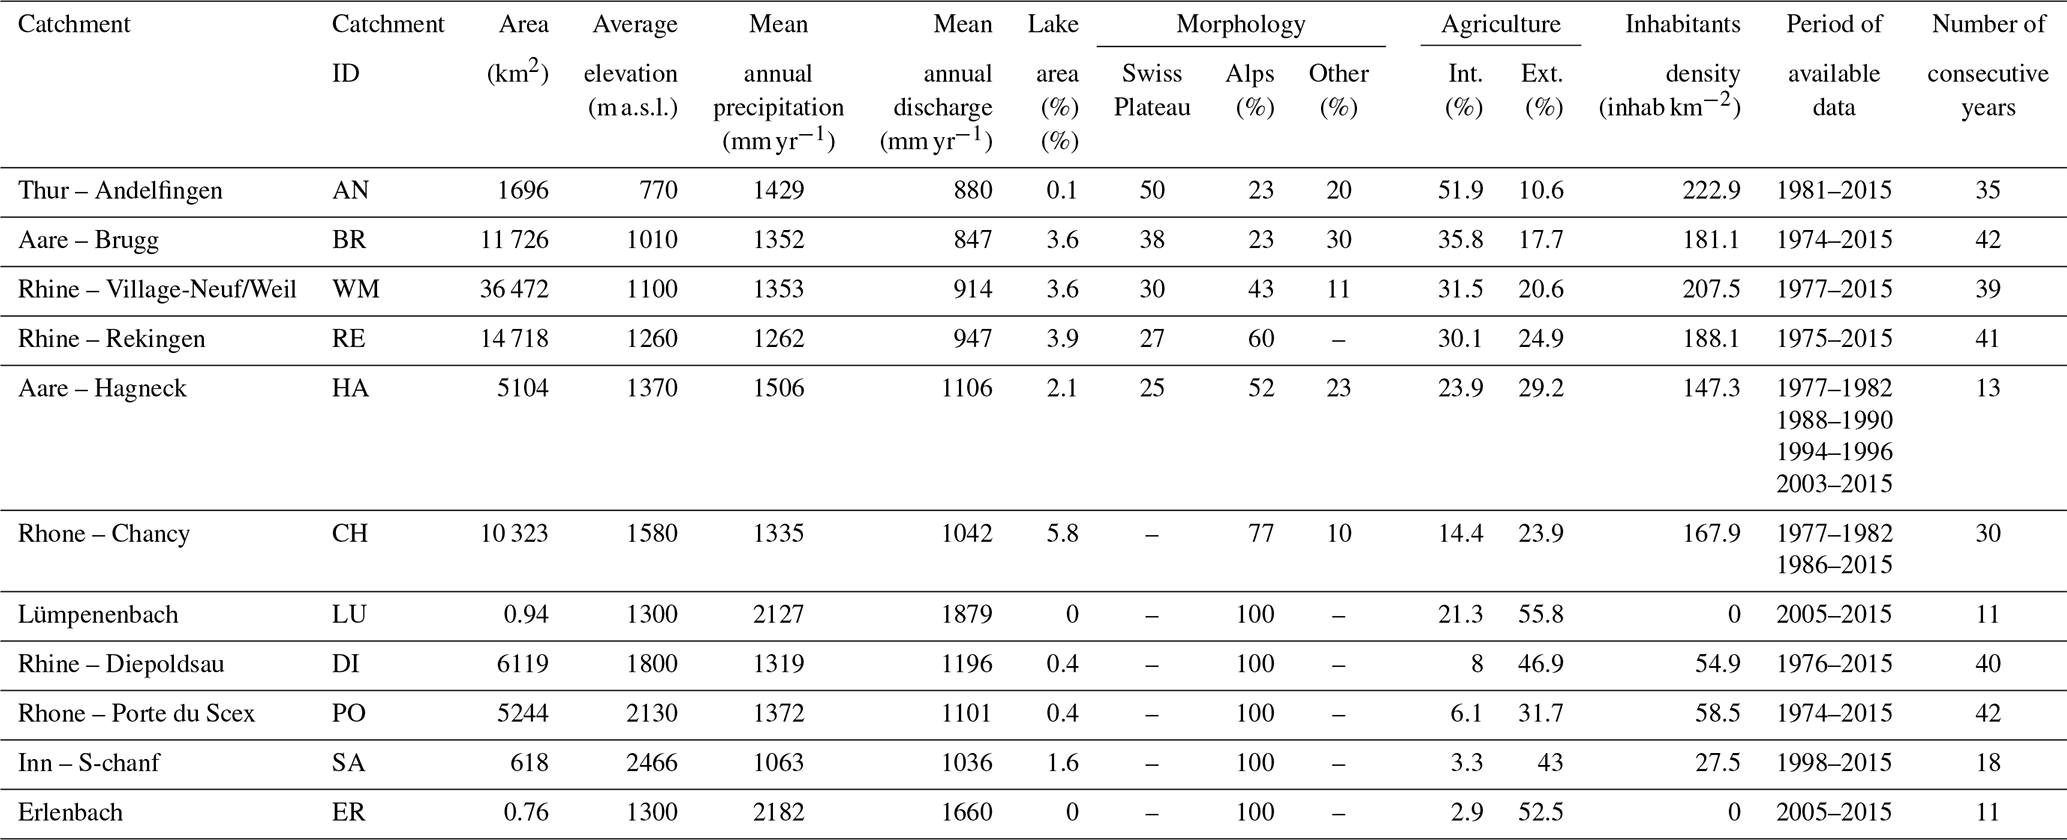
Table 1Description of the catchments. The selected catchments are characterized by different size, elevation, and average yearly precipitation. Four catchments are entirely Alpine (ER, PO, DI, SA), while the others encompass different morphologies (Swiss Plateau and pre-Alpine areas). The data are sourced by the catchment descriptions included in the NADUF database.
The concentrations reported in the database concern the following solute types: (i) geogenic solutes, originating mainly form rock weathering, such as calcium (Ca2+), magnesium (Mg2+), sodium (Na+), silicic acid (H4SiO4), and potassium (K+); (ii) deposition-derived solutes, such as chloride (Cl−); (iii) nitrogen species (nitrate, NO3; and total nitrogen, TN); (iv) phosphorus species (dissolved reactive phosphorus, DRP; and total phosphorus, TP); and (v) organic carbon species (dissolved organic carbon, DOC; and total organic carbon, TOC). The time series of these concentrations are used in the analyses carried out in this study. Furthermore, the dataset includes also the average discharge, computed as the mean value over the period between two water quality analyses, as well as other parameters such as water temperature, hardness (), alkalinity (H+), and pH.
The selected catchments cover most of the Swiss territory. This is characterized by dissimilarities in terms of morphology, land use, and anthropic pressure, with the latter being intended as activities (e.g., fertilization of agricultural lands, domestic and industrial waste water treatments, industrial sewage disposal into water), which are expected to have an impact on the river biogeochemistry and to alter the natural background concentrations and their seasonality. Figure 1 shows the catchments analyzed in this study as identified by the ID reported in Table 1. Catchments are divided into three categories depending on the morphological zone where they are mainly located: the Swiss Plateau, a lowland region in the north, the mountainous Alpine area in the center and south, and a third category that includes catchments spanning both morphologic zones. The choice of this classification criterion is discussed in the Sect. 3.1. Geology also differs from one region to another (Fig. 1c). The bedrock of northern Switzerland, the Jura region, is mainly composed of calcareous rocks, while in the Alpine area crystalline silicic rocks are dominant (Fig. 1c). The Swiss Plateau region is instead characterized by the “molasse” sedimentary rocks (Fig. 1c), consisting in conglomerates and sandstones of variable composition (e.g., detrital quartz, feldspars, calcite, dolomite, and gypsum) (Kilchmann et al., 2004). The relative chemical weathering of carbonate rock and of gypsum are respectively 12 and 40 times higher than the weathering rate of granite or gneiss (Meybeck, 1987), thus suggesting that it is a good proxy to consider the Swiss Plateau area as characterized mainly by a calcareous bedrock (e.g., Zobrist et al., 2018). As the maps in Fig. 1d and 1e show, the prevalent land use in the Swiss Plateau area is agriculture, while the Alpine area is mainly covered by forests and grasslands. Table 1 specifies if the share of agricultural land is cultivated either intensively, i.e., with significant fertilizer applications, or extensively, e.g., Alpine grasslands, bush land, and parks, which are mostly unfertilized (Zobrist et al., 2018). The main urban centers are concentrated in northern Switzerland, together with most of the industrial activities, which represent potential point sources of pollution. The agricultural activities, especially intensive agriculture, residential, and industrial areas are referred to in this study as “anthropic pressure”, indicating that the sources of solutes originated from these activities are other than natural. Given the much higher presence of these anthropogenic factors in northern Switzerland, the anthropic pressure follows a south–north gradient, although patches of anthropic pressure are found also within the Alpine valleys.
3.1 Magnitude, seasonality, and trends
The magnitude of a solute is evaluated through basic statistics (i.e., median, 25th and 75th percentiles, minimum and maximum values). These are computed for each solute in each catchment, with the goal of highlighting differences across catchments, which are the result of catchment heterogeneities and natural and anthropogenic factors affecting the quantity of a given solute.
The seasonality of discharge and of solute concentrations is analyzed and cross-compared to highlight differences and similarities of controls that are related to the climatic seasonality and seasonality of man-induced impacts. For this analysis, catchments are subdivided into the three above-mentioned categories: Swiss Plateau, Alpine, and hybrid catchments (Fig. 1). The Swiss Plateau and Alpine catchments have substantially different hydrological regimes (Fig. S1 in the Supplement, upper and bottom panels) and represent the main classes of the clusterization proposed by Weingartner and Aschwanden (1992). Some of the selected catchments with large draining area include both typologies and are therefore defined as “hybrid catchments”. They are characterized by a seasonality, which is intermediate between the two end-members (Fig. S1, central panel) because the timing of the peak is similar to the one of Alpine catchments, but the magnitude is less pronounced as in the Swiss Plateau catchments. For this reason, they have to be treated separately from the other two classes. The hybrid catchments have the highest percentage of lake surface area in their domains (Table 1), although non-negligible lake fractions are also found in the two other categories. Large lakes represent a discontinuity in the river network, reducing the fraction of catchment area directly (without major water mixing effects) contributing to the observed discharge and solute dynamics. The presence of large lakes contributes to the dampening of the hydro-chemical signal, but its exact quantification is not straightforward. Aware of the confounding role of large lakes, we apply this classification in order to test if the seasonality of solutes is related to the seasonality of discharge. With such an analysis we aim at isolating the effect of the discharge seasonality versus the seasonality of solute concentrations. More specifically, whenever a solute shows a seasonality different from the one imposed by climate, we investigate the potential reasons for such a difference, with it being either related to specific catchment characteristics or to anthropic activities.
The comparison between the seasonality of solute and discharge is made through an index of variability defined as the ratio between the mean monthly deviations from the mean of solute concentration and discharge respectively, where the deviation is determined as the average difference between the monthly means and the annual average value, resulting in the following equation:
where i represents the month of the year, from 1 to 12, and n is the number of the catchments belonging to the specific catchment class for which the index of variability is computed. In other words, an index of variability larger than 1 suggests that the seasonality of the solute is more pronounced than that of discharge, and vice versa for an index of variability smaller than 1.
Finally, we evaluated the occurrence of trends in the long-term concentration time series at monthly and annual scale using the monthly average concentration of each solute in each catchment and each year for the entire period. The statistical significance of trends was tested with the Mann–Kendall test modified to account for the effect of autocorrelation (Hamed and Rao, 1998; Kendall, 1975; Mann, 1945), fixing a significance level of 0.05. Trends are investigated and compared across catchments in order to understand if they are consistent across Switzerland, thus suggesting the presence of clear drivers underlying the trend, or if they are just occurring in a subset of catchments. The time series span different periods of time, so the results might be impacted by the natural variability in discharge over the different years. This might be a potential issue, but we observed that in cases with a trend in discharge present (e.g., in the CH catchment, not shown) the patterns of concentrations do not show any different behavior compared to those observed in other catchments, which our analysis attributes to external forcing (e.g., anthropic activities).
3.2 Concentration–discharge relations
The empirical relation between solute concentration and discharge was explored separately for each solute and for each catchment with the objective of investigating solute behaviors across catchments and whether this behavior can be generalized. The two variables are expected to exhibit a linear relation in a log–log scale, expressed by means of the two regression parameters a, the intercept with the same dimensions of the concentration, and b, the dimensionless exponent representing the slope of the interpolating line. We focus our attention on the latter, which determines the behavior of the solute. The Student's t test was applied to verify the statistical significance of having a b exponent different from zero. The level of significance α was set at 0.05. When the p value was lower than α, the slope identifying the log-linear C–Q relation was considered significant and quantified by b, otherwise the slope was considered indistinguishable from zero, thus suggesting no evidence of a dependence of concentration on discharge.
In each catchment, the time series of discharge were divided into two subsets using the median daily discharge q50 to separate flow below the median (low flows) and flows above the median (high flows). Hourly discharge time series were available from the Swiss Federal Office for the Environment (FOEN) at the same river sections and for the same period of the time series of water quality provided by the NADUF monitoring program. The median daily discharge was computed from the hourly series, which were aggregated to obtain daily resolution.
Determining the C–Q relations separately for high and low flows allows a finer classification of the solute behavior into different categories (Moatar et al., 2017) than considering only the dependence on the entire range of discharge. The three main behaviors – enrichment or removal (i.e., positive slope), chemostatic (i.e., near-zero slope), and dilution (i.e., negative slope) – can indeed be the result of mechanisms controlling the runoff formation and the transport mechanism. Accordingly, we have in total nine different combinations characterizing the C–Q relation across high- and low-flow regimes, which allow assigning distinct behaviors to a given solute.
For solutes that showed long-term trends over the monitoring period, we also investigated the evolution of the b exponent in time. In this case, the concentration and discharge time series were divided into decades and the C–Q relations over all discharge values were computed separately for each decade. The behavioral classification is performed on a single b (i.e., not divided into low- and high-flow b), since, differently from the previous analysis of C–Q relations, the focus is on the detection of long-term trends in solute behavior rather than on the understanding of the processes leading to differences between high and low flows.
4.1 Magnitude
Among the geogenic solutes, Ca2+ is the most abundant, most likely due to the composition of the bedrock present in most of the catchments (calcite, dolomite, and anhydrite/gypsum; Rodríguez-Murillo et al., 2014). In absolute terms, geogenic solutes and Cl− have the highest concentrations (≈10–50 mg L−1), while phosphorus species concentrations (≈0.01–0.1 mg L−1) are on average 1 to 2 orders of magnitude less abundant than nitrogen species (≈0.5–1.5 mg L−1) and organic carbon (≈1.5–5 mg L−1).
Some solutes are constituents of other species, like in the case of nutrients NO3 of TN and DRP of TP. NO3 is often introduced in catchments as an inorganic fertilizer, such as DRP, which represents a readily available nutrient for crops. We computed the ratio between the solute and its component for the two couples (NO3∕TN, DRP∕TP) and observed their pattern across the catchments (Fig. 2). We take as reference values the ratios in the ER catchment, since, due to limited anthropogenic pressure, it represents the background concentrations of nutrients (Zobrist, 2010). Variations compared to ER values might provide an indication of the ratio of nutrients coming from anthropic activities. NO3 is the major constituent of TN, since it is about 85 % of TN, while DRP contributes much less to TP, being only 35 % of TP. Both have a decreasing pattern with decreasing catchment anthropogenic disturbances, although in DRP∕TP this pattern is more evident. DRP∕TP spans from a maximum of 65 % in WM to a minimum of 22 % in ER, while NO3∕TN has a maximum of 93 % in AN and it is 63 % in ER.
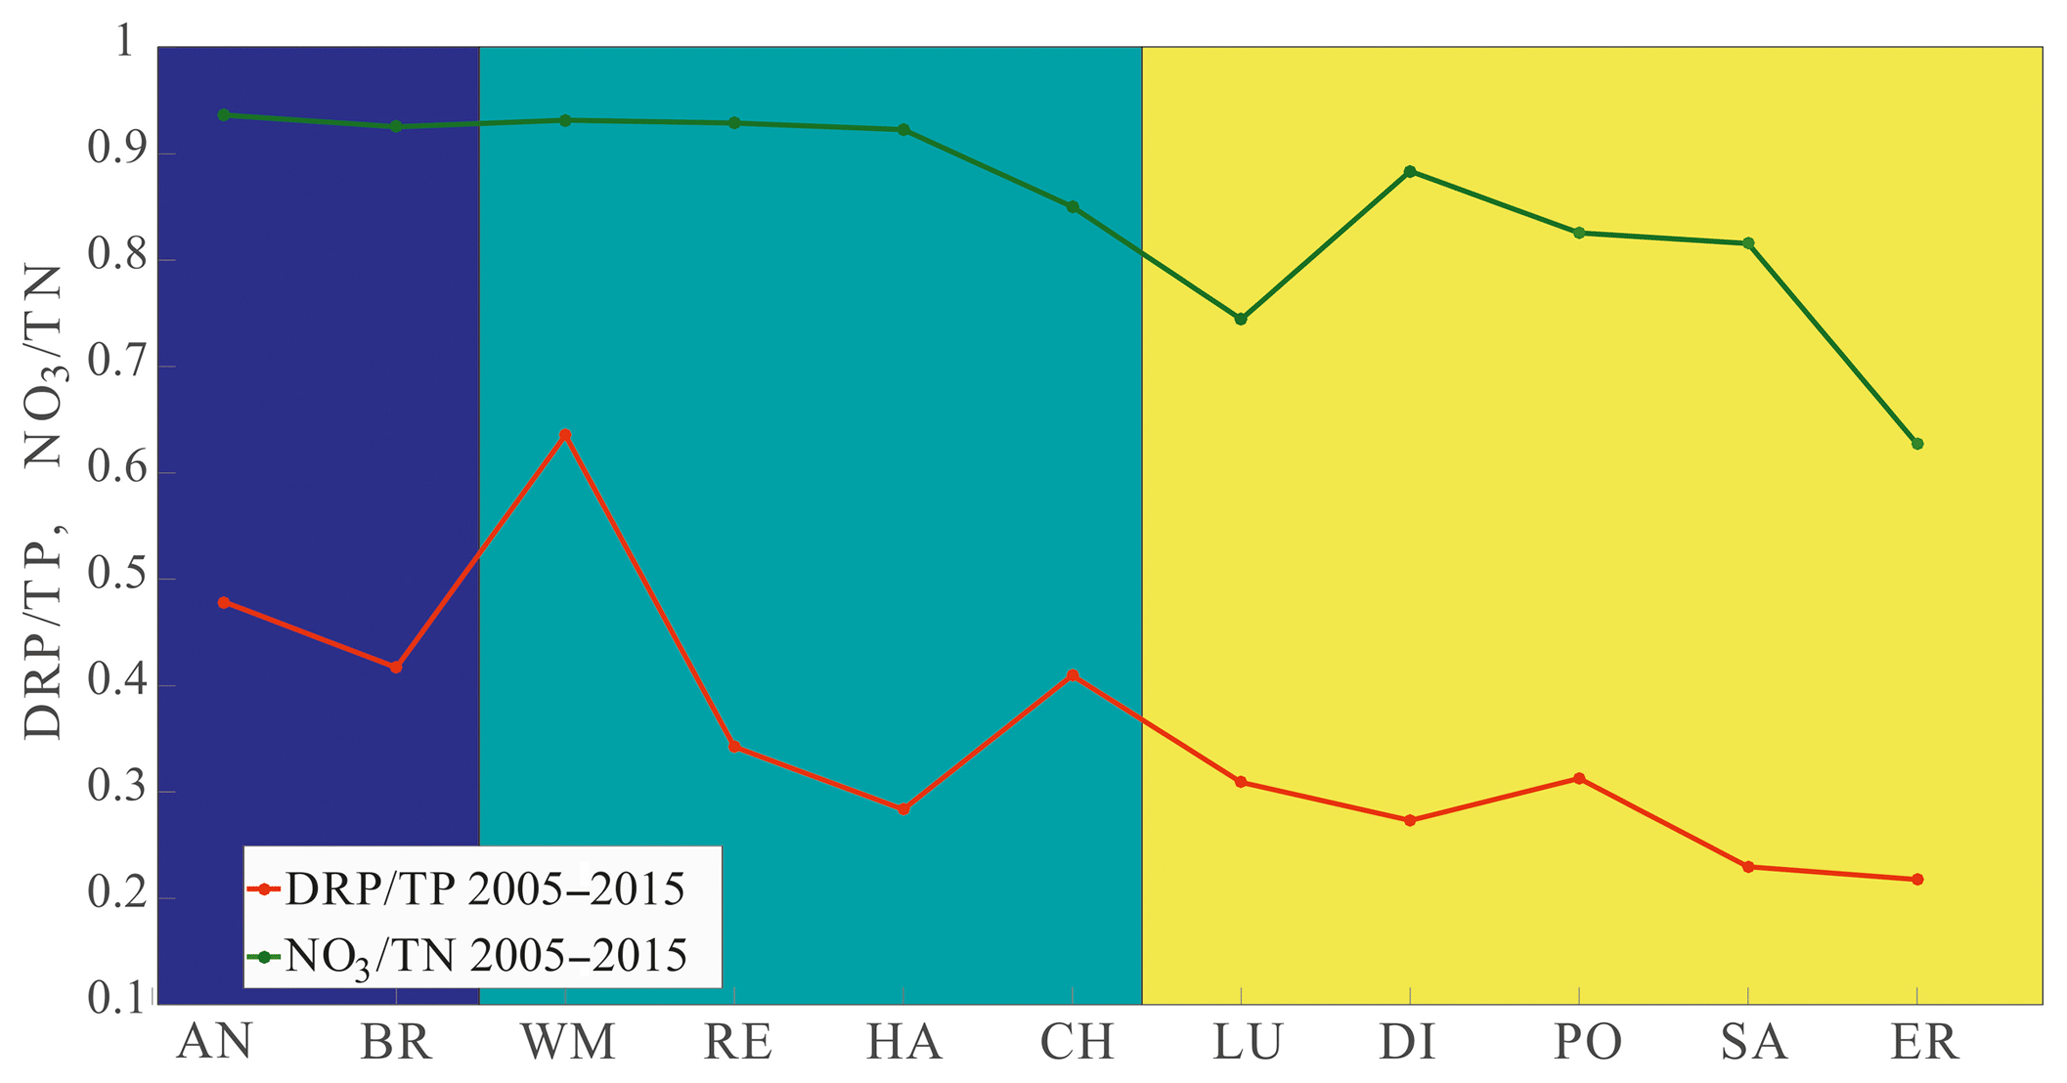
Figure 2Ratios of DRP∕TP (red) and NO3∕TN (green) across catchments computed on the period 2005–2015. Both patterns show a decreasing trend from more to less anthropogenically affected catchments (left to right of x axes). This pattern is more evident for phosphorus. Background colors refer to the catchment classification explained in Sect. 3.1.
Effects of catchment characteristics and human activities on the observed stream solute concentrations can be seen for certain solutes as shown by Fig. 3, where each box shows the measured concentrations in the 11 catchments and the last box on the right refers to all the catchments grouped together. The catchments, expressed by the corresponding acronym (see Table 1), are ordered, from left to right, from the most impacted by human activity – i.e., higher percentage of catchment area used for intensive agriculture – to the least impacted, which is almost equivalent to considering a south-to-north gradient. The most evident effect of catchment characteristics refers to the presence of Ca2+ and H4SiO4 in the stream water (Fig. 3a). Despite the lower solubility of silicic rocks compared to the calcareous rocks, H4SiO4 concentrations in the southern Alpine catchments of Inn (SA), Rhine (DI), and Rhone (PO) are significantly higher than the median value across catchments. The impact of human activities, instead, is more evident in Na+ and Cl− concentrations. These are showing, basically, the same pattern across catchments (Fig. 3b), indicating that they are most likely influenced by the same driver, which is the spreading of salt on roads during winter months for deicing purposes. We consider the spreading of deicing salt an anthropic activity related to the presence of inhabitants in a catchment. DOC and TOC concentrations are very high in the Lümpenenbach (LU) and Erlenbach (ER) catchments (Fig. 3c), which are the smallest catchments with the highest average yearly precipitation rate and very low anthropic presence. The Thur (AN) and Aare (BR) catchments also show DOC and TOC concentrations higher than the average, but in these catchments the presence of wastewater treatment plants can influence TOC concentrations. Finally, nutrients, such as nitrogen species and phosphorus species, which are connected with anthropic activities (fertilization, wastewater treatment plants), show a relatively clear decreasing median concentrations from the most to the least impacted catchment (Fig. 3d). Indeed, regressing median solute concentration with the percentage of intensive agricultural land and the inhabitant density (Table S1a in the Supplement) gives a statistically significant dependence for some nutrients (i.e., NO3, TN, DRP). Because the catchments that are mostly impacted by agricultural activities are mainly located in the Swiss Plateau, a significant positive correlation between nutrients and the percentage of the Swiss Plateau area of the catchment exists; conversely, we observe a significant negative correlation with the percentage of the Alpine area. One should note, however, that the correlation is performed on 11 catchments only, so that a lack of significance should be interpreted with care. Indeed, if we extend the correlation analysis to the b exponent derived from the C–Q relations analysis – thus implicitly accounting for the complex interactions between catchment geomorphology, land use, hydrological processes, and solute releases – with the same catchment characteristics (e.g., Moatar et al., 2017) the correlation becomes weaker and, basically, not significant for any solute (Table S1b and c).
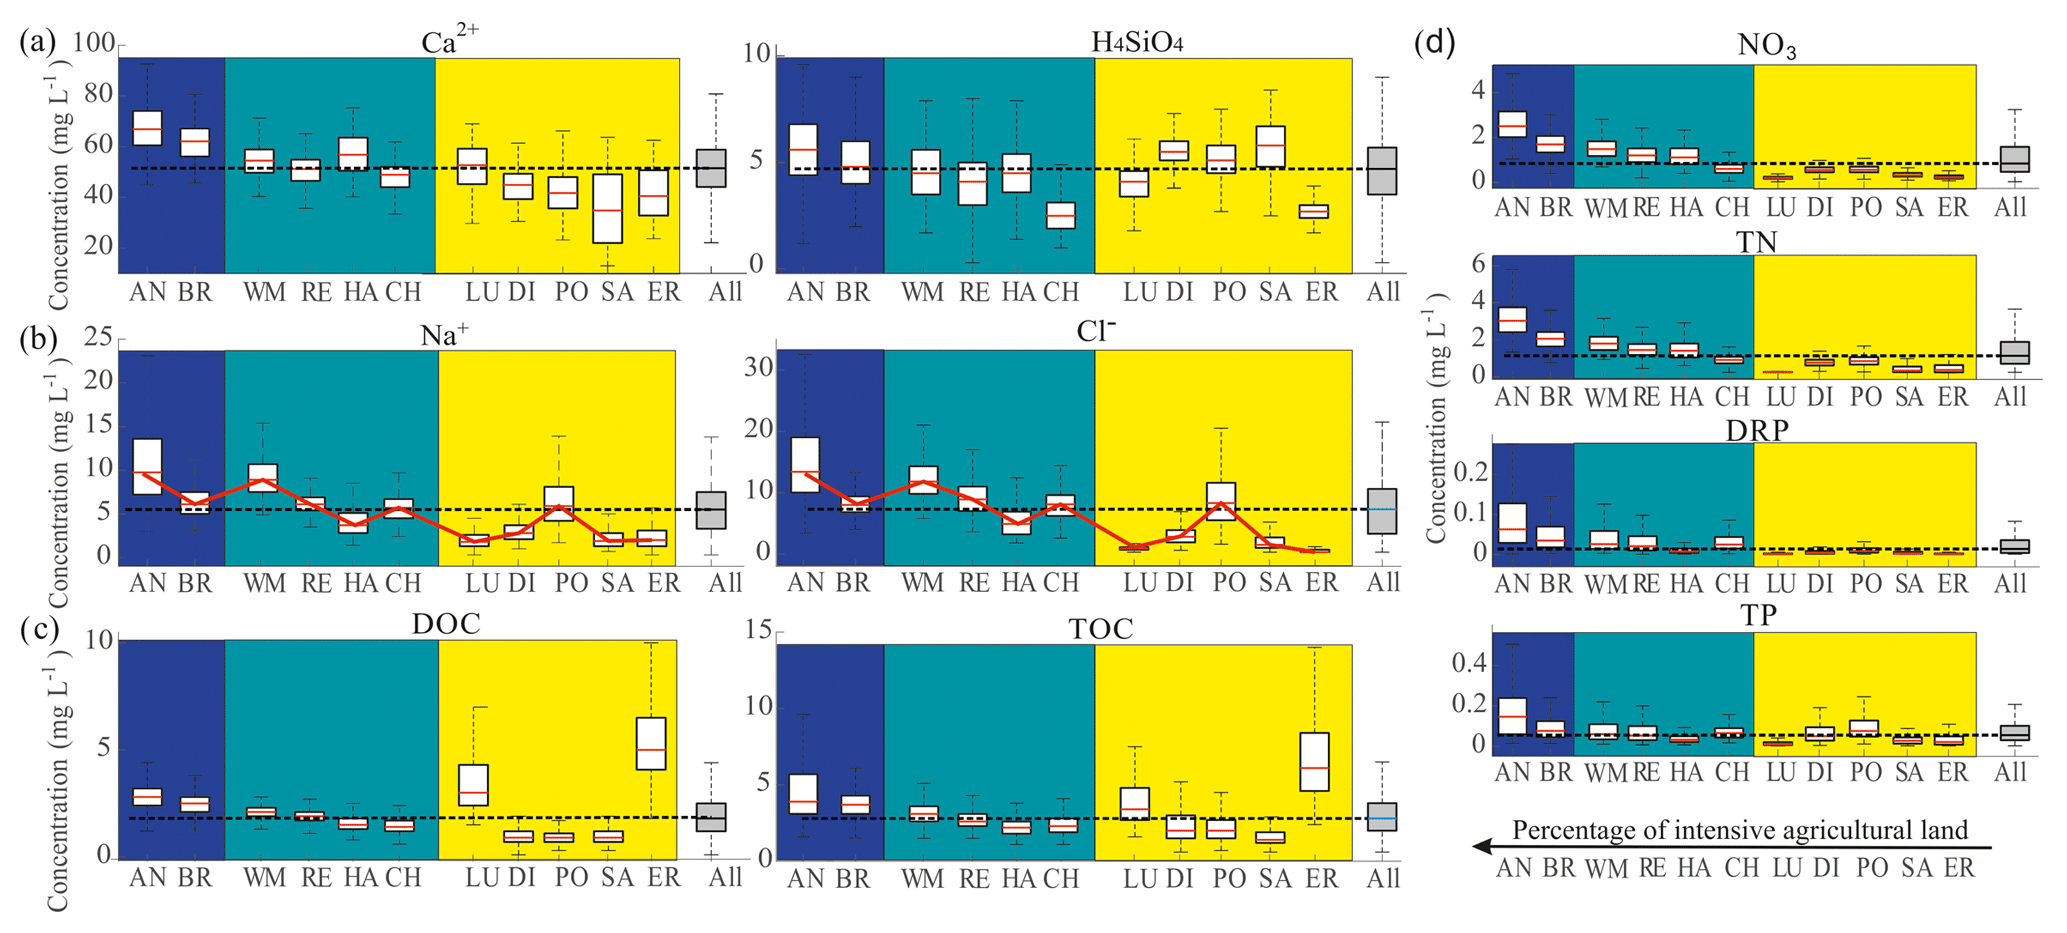
Figure 3Box plot of measured concentrations across catchments. The grey box on the right of each subplot refers to the concentrations computed from all the observations of all the catchments. The black horizontal dashed line represents the median of all the measurements across all the catchments. (a) shows the effect of bedrock geological composition on Ca2+ and H4SiO4 concentrations. (b) shows the pattern of Na+ and Cl− concentrations across catchments. (c) shows the DOC and TOC concentrations. (d) shows the decreasing trend of the nutrients' median concentrations. The catchments are ordered by increasing percentage of land used for intensive agriculture, as shown in the bottom table, and the background colors refer to the catchment classes: Swiss Plateau (blue), hybrid (light blue), and Alpine (yellow) catchments.
4.2 Seasonality
Different climates and catchment topographies determine various hydrological responses, as we can observe in Fig. S1 from the analysis of discharge seasonality across the 11 catchments, expressed through the monthly average streamflow normalized by its long-term average. We present the results with the catchments divided into three groups as previously explained. The partition into these classes helps in highlighting the effects of topography, climatic gradient, and somehow also the impact of anthropic activities since it follows a similar south to north gradient. The seasonality of streamflow in Swiss Plateau catchments is determined by a combination of precipitation and snowmelt. The peak flow is typically observed in spring and is not much higher than the average in the other months. Alpine catchments, instead, show stronger seasonality induced by snowmelt and ice melt in spring and summer, which generates higher streamflows than in the other months. Hybrid catchments exhibit flow peaks in June–August similarly to the Alpine ones, but the deviation from the average value is less pronounced.
The deviations of discharge and concentration are compared using the index of variability (Sect. 3.1) for each morphological class of catchments (Fig. 4). Only few solutes show a value of the index higher than 1. This indicates that seasonality of solute concentrations is generally lower or much lower than the seasonality of streamflow. This is especially true for the Alpine catchments, where the marked seasonality of streamflow seems to dominate the variability in concentrations. For TP the index of variability is higher than 1 in Alpine catchments and also the highest compared to the other two typologies. In Swiss Plateau and hybrid catchments, instead, only solutes impacted by human activity (Na+, Cl−, nitrogen species, and DRP) show a ratio close or even higher than 1.

Figure 4Bar plot of the index of variability. Each bar represents the average monthly variability in concentration relative to discharge variability per catchment class. The colors of the bars differentiate catchment morphologies: blue for Swiss Plateau, aqua-green for hybrid, and yellow for Alpine catchments. A–C represent the observable patterns of the index of variability across the three classes. Type A is the result of the different seasonality of discharge dominating the response. Type B refers to those solutes with an index of variability much lower in the hybrid catchments than in the others. Type C represents solutes with the index of variability lower in Alpine catchments than in the other classes.
DOC and TOC concentrations are characterized by low indexes of variability, especially in the hybrid catchments. The patterns of the index of variability across different morphologies can be classified into three categories, represented by the symbols A–C in Fig. 4. The monotonic line in type A refers to those solutes, the variability index of which changes across morphologies solely as a result of the seasonality of streamflow (Ca2+, Na2+, K+, and Cl−). The type B solute (Mg2+, TP, DOC, and TOC) response shows a lower variability index in hybrid catchments compared to the other catchments and suggests that, among the factors controlling the seasonality of the biogeochemical response, there are factors that are specific to the Alpine environment, which are discussed in Sect. 5.2. The type C pattern, instead, refers to solutes related to fertilization (NO3, TN, and DRP) and to H4SiO4, which is a product of weathering and only minimally involved in biological processes. These solutes are characterized by a much lower variability index in Alpine catchments than in hybrid and Swiss Plateau catchments. Differences in their regime are further discussed in Sect. 4.
The analyzed solutes show different intra-annual dynamics. For instance, despite the quite pronounced streamflow seasonality of the Rhine river at Rekingen (hybrid catchment used as a representative example), solute concentration patterns show different seasonal cycles (Fig. S2). Ca2+, Mg2+, Na+, K+, Cl−, NO3, and TN concentrations peak in February–March and have lower values during the spring–summer period, showing a pattern opposite to that of streamflow. H4SiO4, instead, has a shifted seasonality compared to the other solutes, peaking in December–January. Phosphorus species together with organic carbon species do not show any consistent seasonality over the year.
4.3 Trends
Long-term trends in the concentration time series are investigated with respect to the seasonal cycle for each year separately (Fig. S2). One catchment (Rhine – Rekingen) is taken as an example for illustration purposes, but the generality of trend results is discussed in the following.
Focusing on the long-term horizon, different dynamics can be observed across various solutes. Some of them show visible trends: for instance Cl− has increased from the 1970s to 2015, while phosphorus species have decreased considerably. Some solutes have different trends across different catchments. A generalization of long-term patterns is shown in Fig. 5 for the three main detected behaviors. The upper panel represents the occurrence of an evident trend, either increasing (as in the example of Cl−) or decreasing (e.g., TP). Na+, Cl−, DRP, and TP belong to this category. While Na+ and Cl− have increased in time, DRP and TP have decreased in the monitoring period, as the monthly trends in Table S1a show (see Fig. 6 for DRP only).
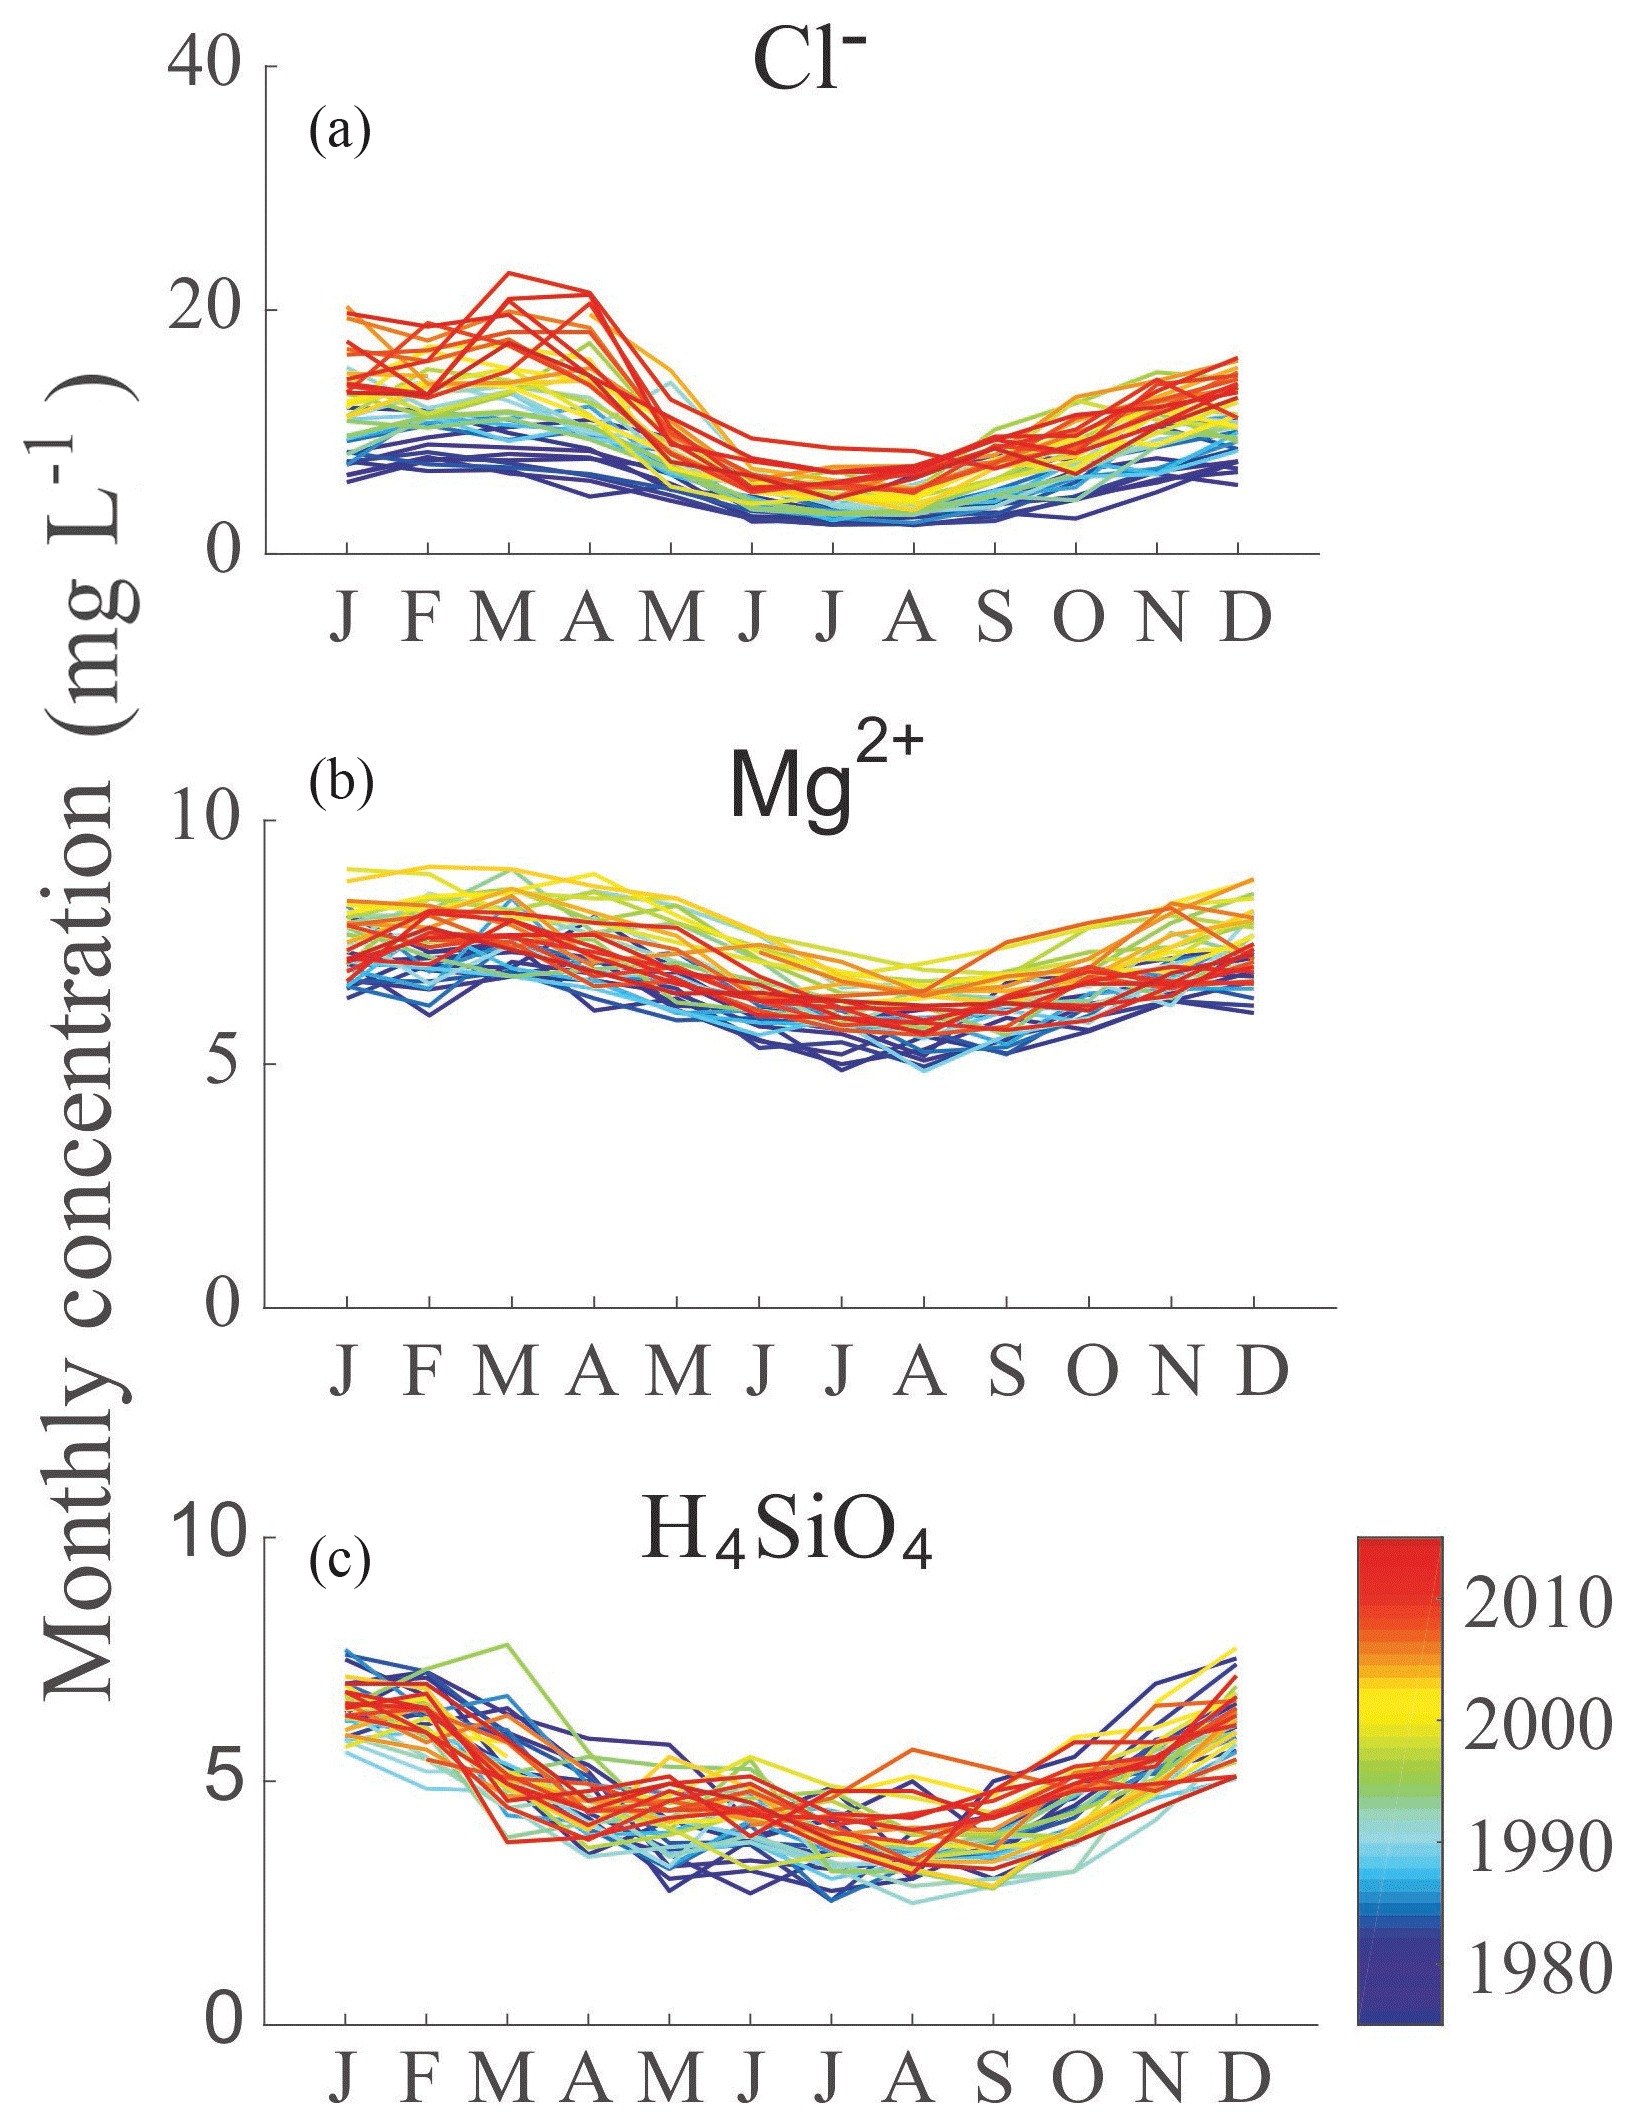
Figure 5Three example long-term patterns of solute concentrations. (a) represents a clear increasing trend, (b) a non-monotonic trend (firstly increasing and then decreasing), and (c) shows the absence of any trend. The patterns are shown for the station of Aare – Brugg as an example case.
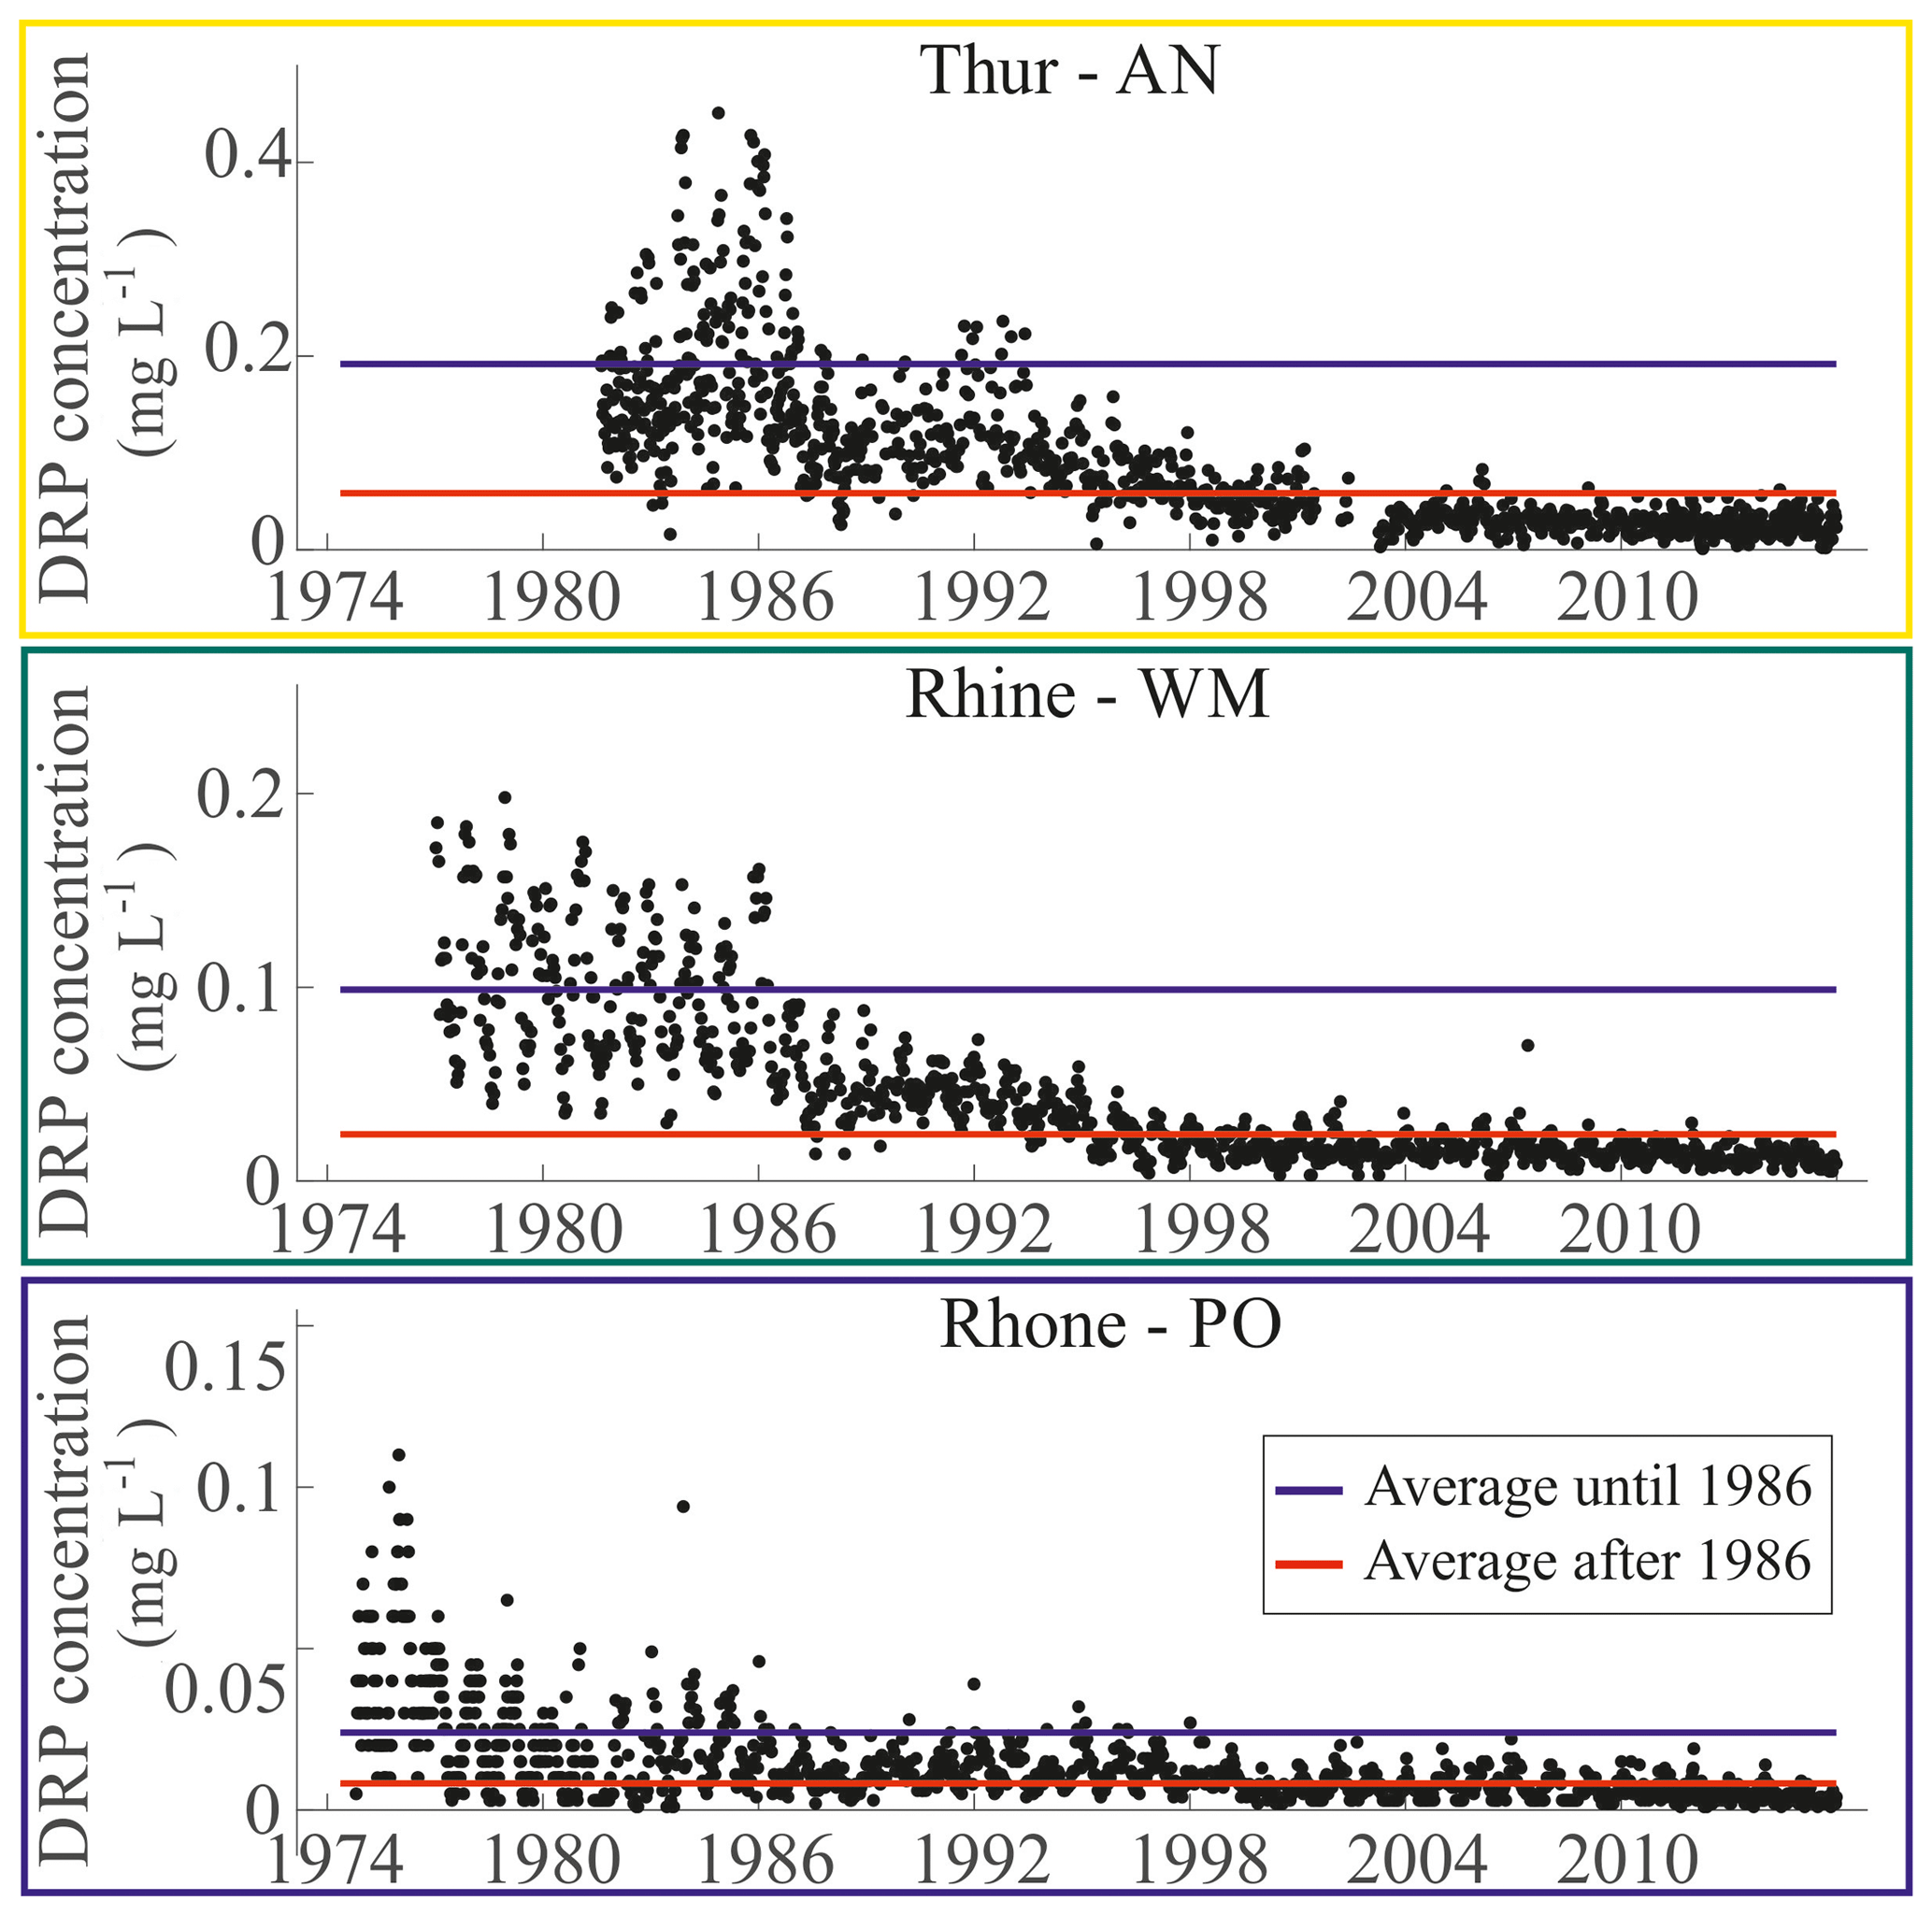
Figure 6Observed DRP concentrations in three catchments characterized by different classes (i.e., Thur, AN; Rhine, WM; and Rhone, PO). The blue line represents the mean until 1986, whereas the red line represents the mean after 1986 and until the end of the monitoring period. After the introduction of the phosphate ban in 1986, the DRP concentrations have shown an evident decrease.
The middle panel shows a non-monotonic trend. This is typical of Mg2+, which first increased in most catchments (1970s–1990s) and then decreased (1990s–2015). K+, TN and TOC also show this type of trend in most catchments. Finally, the lower panel of Fig. 5 shows a number of solutes (Ca2+, H4SiO4, NO3 and DOC) that do not exhibit any long-term trend, although analysis on a monthly base revealed some significant trends (Table S1c).
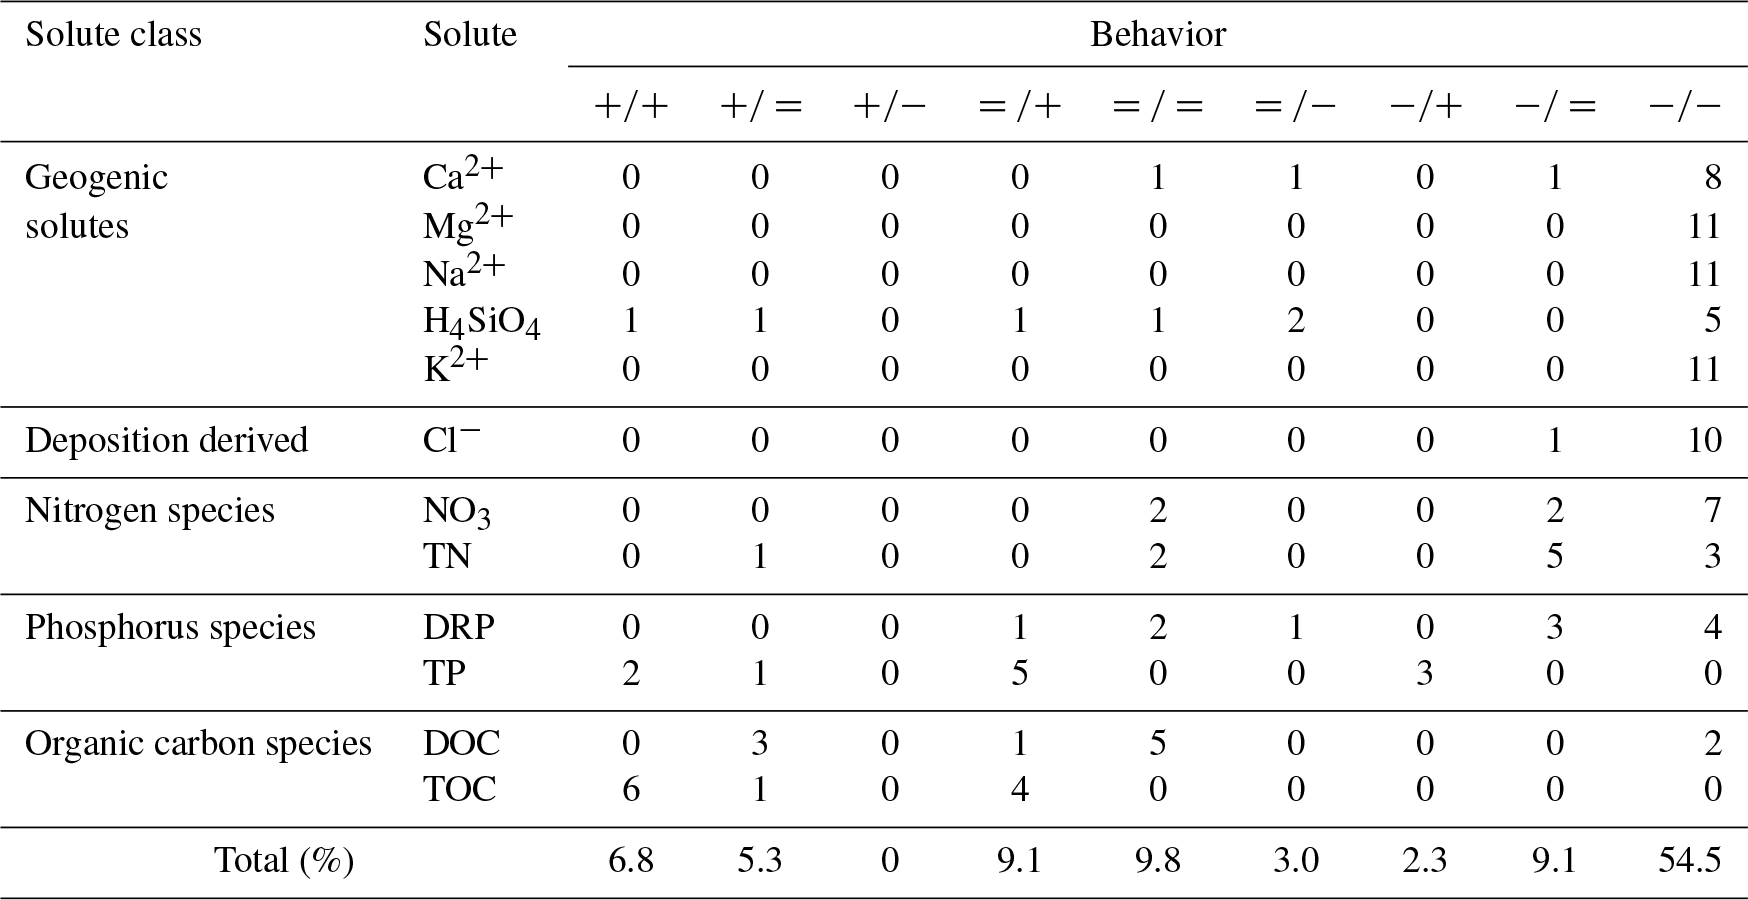
Table 2Results of the C–Q relations analysis. The symbols “+”, “−”, and “=” refer to the possible behavior combinations described in Fig. 7, while the numbers indicate how many catchments exhibit a specific behavior for each solute. The solutes are classified as reported in the first column.
4.4 C–Q relations
Concentration–discharge relations were computed for all the solutes across all the catchments as summarized in Table 2. For each solute, we computed the number of catchments showing a given specific behavior, which we denoted with the combination of the symbols “+” (i.e., enrichment/removal), “−” (i.e., dilution), and “=” (i.e., chemostatic behavior) for discharge above and below the median.
Geogenic solutes are mostly characterized by dilution. The only exception is H4SiO4, which shows six different behaviors across the 11 catchments, making it impossible to identify the most representative behavior for this solute. This is the case also of other species (nitrogen species, TP, and organic carbon species), which show at least three different behaviors across catchments. Silicon is mainly generated through rock weathering, but it is also involved in biological processes, which might influence its behavior across catchments.
Overall, dilution is dominant for all solutes in both low- and high-flow conditions, as it occurs respectively in 65 % and 57 % of the catchments. Therefore, even in low-flow conditions, the solute transport is mainly source-limited across catchments. Only sediment-related solutes (i.e., TP, TOC) show a marked transport-limited behavior. The label “sediment-related solutes” comes from the fact that phosphorus and organic carbon are bonded to soil particles and, when soil is eroded, carbon- and phosphorus-rich soil particles are mobilized by flowing water. In such conditions, soil erosion becomes one of the main contributors to the phosphorus and organic carbon load into the rivers. We investigated also C–Q relations for suspended sediment concentrations and they show increasing slope across all the catchments, indicating, as expected, higher erosion rates in the presence of high-flow conditions. Only 29 % of the catchment–solute combinations have different behaviors between low- and high-flow conditions, and therefore the C–Q relations are represented by bent lines, having different slopes between low- and high-flow conditions.
NO3 and DOC represent a conspicuous component of TN and TOC respectively, but NO3 shows almost the same behaviors of TN, in spite of a different distribution across catchments, while DOC and TOC behave differently. Phosphorus species also show different behaviors, which is consistent with the fact that DRP represents only a small fraction of TP.
Since in the trend analysis we identified four species (Na+, Cl−, DRP, and TP) that are characterized by remarkable long-term trends, we investigated if such a significant change in magnitude has an effect on the C–Q relation analyzing the temporal changes in the b exponent. The changes in the value of b across all catchments with record length longer than 30 years during different decades are shown in Fig. 8a–d, whereas Fig. 8e–h show an example of the variation of the TP C–Q relations across decades for the human-impacted catchment of Aare (BR) and the Alpine catchment of Rhone (PO). Although the observed concentrations of all four solutes – Na+, Cl−, DRP, and TP – are characterized by the presence of evident trends in time, the behaviors in the C–Q relation differ. Na+ and Cl− have a constant b exponent across decades, while phosphorous species show increasing b, which, in some catchments, leads to a switch from a behavior of dilution to one of enrichment.
5.1 Influences of human activities on solute concentrations
The cause–effect relation between the observed in-stream concentrations and the anthropic activities is sometimes evident in the concentration magnitude, seasonality, and long-term trends. Phosphorus and nitrogen are the main nutrients applied for agricultural fertilization, and a decreasing pattern of their magnitude from mostly intensive agricultural catchments to forested catchments is observed (Fig. 3d). Indeed, taking the concentrations of NO3 and DRP registered at ER as reference background of natural concentrations (Zobrist, 2010), corresponding to 0.20 mg L−1 of NO3, 0.38 mg L−1 of TN, 0.002 mg L−1 of DRP, and 0.02 mg L−1 of TP, the concentrations in all the other catchments are significantly higher. For example, the most impacted AN catchment recorded median concentrations of 2.50 mg L−1 of NO3, 3.03 mg L−1 of TN, 0.06 mg L−1 of DRP, and 0.15 mg L−1 of TP. Following the stoichiometric composition of plants, nitrogen species concentrations are 1 order of magnitude higher than phosphorus species concentrations (Fig. 3d). Nitrogen is the main nutrient required for crop growth (Addiscott, 2005; Bothe, 2007; Galloway et al., 2004; Zhang, 2017), and indeed NO3 is one of the main components of fertilizers applied in agriculture. NO3 represents a large fraction of TN (Fig. 2). The variability in the ratio between average NO3 and TN concentrations across the different catchments is comparable with that estimated by Zobrist and Reichert (2006), who observed a variation from 55 % in Alpine rivers to 90 % for rivers in the Swiss Plateau. Both the NO3-to-TN ratio and the DRP-to-TP ratio show a decreasing trend from more to less anthropic-impacted catchments, with the range of variability being, however, higher for phosphorus species (from about 0.6 in the Thur river to about 0.2 in the Inn river). The DRP∕TP ratios across catchments can be explained as the result of the cumulative effect of two main factors: the lower DRP input due to less intensive agricultural activity in the Alpine zone and the higher share of phosphorus sourced by suspended sediments contributing to TP in Alpine catchments due to generally higher erosion rates.
Anthropic activities affect also the seasonality of certain solutes. In Fig. 4, we assigned the pattern “C” to those solutes (i.e., H4SiO4, NO3, TN and DRP) characterized by a much lower index of variability in Alpine catchments than in hybrid and Swiss Plateau catchments. For those solute concentrations, the variability in Swiss Plateau and hybrid catchments is comparable to or higher than streamflow variability, while in Alpine catchments streamflow seasonality is much stronger than solute seasonality. A non-negligible fraction of these solutes is introduced through agricultural practices or by means of other human activities. Their input is characterized by its own seasonality, which influences the solute dynamics and makes it comparable to or larger than the discharge seasonality – a behavior that is not observable for most geogenic solutes (Fig. 4). Additional evidence supporting this result is represented by the patterns of the average monthly discharge and solute load (computed as the product between concentration and discharge) normalized by the respective average value. This representation is made for Ca2+, originating from rock weathering, and NO3, mainly of anthropic origin (Fig. S3a and b). The plot, inspired by the analysis of Hari and Zobrist (2003), shows how the seasonality of Ca2+ load follows the seasonality of discharge across all catchments well, while NO3 load has its own seasonality in the catchments with the largest agriculture extent, especially in the first part of the year. Indeed, in the case of NO3, there is no correspondence between the seasonality of discharge and load (e.g., the time of maximum discharge does not coincide with the time of maximum or minimum load), thus suggesting that the input is characterized by an independent seasonality.
Anthropic activities do not only influence the average solute concentrations and the seasonality, but also the long-term dynamics. Na+ and Cl− show a clear positive trend in time (Table S1a), largely because of the increasing application of deicing salt (NaCl) (Gianini et al., 2012; Novotny et al., 2008; Zobrist and Reichert, 2006). A clue of the cause–effect relation between deicing salt application and increased Na+ and Cl− concentrations in stream water comes from stoichiometry. The molar ratio between Na+ and Cl− in salt is 1:1; therefore, the closer the ratio computed on observed in-stream concentrations is to 1, the more likely it is that the deicing salt may be the driver. Figure S4 shows the box plot of the Na:Cl molar ratio across catchments, and it is clear that catchments with higher population density show values closer to 1. However, the Erlenbach (ER) and Lümpenenbach (LU) catchments, which do not show any increasing long-term trend neither in Na+ nor in Cl− concentrations, show Na:Cl values higher than 1, which is consistent with the catchments with a low population density (i.e., Rhone, PO; Rhine, DI; and Inn, SA). In this respect, Müller and Gächter (2011) analyzed the phenomenon of increasing Cl− concentrations in Lake Geneva basing their analysis on the NADUF data at the Rhine – Diepoldsau (DI) station. The concentrations detected by the water quality monitoring station are much lower than the amount of the input of salt declared by the cantonal authorities, and the increasing trend characterizes the whole year and not only the winter months. These two factors suggest that an accumulation effect with a long memory in the system might exist. The salt could be stored somewhere in the soil or in the groundwater and could be progressively delivered to the streams over years. However, this is difficult to assert conclusively since the salt input is uncertain. Indeed, estimating the input of salt used for deicing purposes is not trivial, due to the lack of reliable data (Müller and Gächter, 2011). Official sources (EAWAG, 2011) state that improved technologies have enabled a sensible decrease in the specific amount of spread salt (from 40 g m−2 in the 1960s to 10–15 g m−2 today), but the total amount of salt still shows an increasing trend, likely because it is spread more often and on wider surfaces. The recent study of Zobrist et al. (2018) uses as a proxy for salt consumption the salt production by Swiss salt refineries and claims an increase from 360 Gg NaCl yr−1 in the 1980s to 560 Gg NaCl yr−1 in the present, thus supporting the observed positive trend.
A positive cause–effect relation between anthropic activity and solute concentration in terms of trend is also shown for phosphorus species, which have decreased consistently since 1986 (Fig. 6), when the phosphate ban in laundry detergents was introduced in Switzerland (Jakob et al., 2002; Rodríguez-Murillo et al., 2014; Prasuhn and Sieber, 2005; Zobrist and Reichert, 2006; Zobrist, 2010).
A non-monotonic trend emerged from the analysis of long-term data for Mg2+, K+, TN, and TOC (Fig. 5). Considering for example Mg2+, Zobrist (2010) focuses the trend analysis over the period 1975–1996 on Alpine catchments and observes a similar non-monotonic increasing–decreasing pattern. Zobrist (2010) attributes this pattern to an increase in water temperature, which is evident for the Rhine and Rhone rivers. For the Rhine and Rhone rivers, our results support the conclusion of Zobrist (2010) because a reverse increasing–decreasing trend in Ca2+ corresponds to the decreasing–increasing trend of Mg2+. This is consistent with the temperature dependence in calcite solubility. However, in the Thur catchment (AN and HA catchments) which is mainly agricultural, the non-monotonic trend of Mg2+ does not correspond to a trend in Ca2+. Since Mg2+ can cumulate through fertilizer applications and carbonate weathering (i.e., Mg2+ production) can be affected by N fertilizers and manure application (Hamilton et al., 2007; Brunet et al., 2011), we hypothesize that fertilizers might also have an impact on the Mg2+ long-term dynamic. In this respect, the analysis of monthly trends of Mg2+ (Table S1b) shows a more evident increasing trend for agricultural than for non-agricultural catchments. For K+ the difference across the gradient of agricultural pressure is not as remarkable as for Mg2+. Monthly trends of TN and DOC revealed an increasing tendency in the first months of the year (January–April) and decreasing ones in the last part of the year (August–December), thus suggesting that they are induced either by streamflow trends (Birsan et al., 2005) or by biogeochemical processes, which have a pronounced seasonality related to temperature and moisture controls rather than to human activities.
In summary, the anthropogenic signature is clearly detectable in the water quality of catchments with an important fraction of intensive agriculture and relatively high population density, especially in the magnitude of concentrations of nutrients (i.e., nitrogen and phosphorous species); in the increasing long-term trends of Na+ and Cl−; and, a positive outcome of environmental regulations, in the decreasing long-term trends of phosphorous species. Moreover, the seasonality of nutrients differs considerably from the seasonality of naturally originated solutes (e.g., geogenic solutes).
5.2 Influence of catchment characteristics on magnitude and trends of solute concentrations
A statistically robust link between catchment characteristics and river biogeochemical signatures is not straightforward, because the spatial heterogeneity in river catchments and the limited sample size make the search for cause–effect relations between catchment characteristics and in-stream concentrations challenging. However, catchment characteristics play a role for certain solutes, and we found evidence of their impact especially in the magnitude and seasonality of solute concentrations. First, the geological composition of the bedrock influences the weathering products, increasing Ca2+ concentrations in mostly calcareous catchments (northern Switzerland) and of H4SiO4 in silicic catchments (Alpine catchments in central and southern Switzerland). The catchments DI, PO, and SA, which are entirely located in the Alpine area (Table 1) and mainly lie on crystalline bedrock (Fig. 1c), have a higher concentration of silicic acid (Fig. 3a) along with a lower concentration of Ca2+ in comparison to the other catchments, with the AN in the Swiss Plateau area (Table 1) being an exception, which is characterized by a concentration of silicic acid that is comparable to that of Alpine catchments. The influence of lithology was identified before in the literature, with, for instance, high Ca2+ concentrations in one of the tributaries of the Amazon River attributed to the presence of a more-carbonate-rich lithology in the corresponding catchment (Baronas et al., 2017; Rue et al., 2017; Torres et al., 2017).
In the seasonality analysis, the classification of catchments into classes helps in highlighting the impact of the topography on the solute variability. In the Alpine catchments, discharge seasonality generally dominates the seasonality of solute concentrations, except for TP, which is related to the presence of suspended sediments in the streamflow caused by higher erosion rates (Haggard and Sharpley, 2007). Indeed, suspended sediment concentrations, coming from erosion, are much higher in Alpine catchments, excluding the two small headwater catchments LU and ER, than in the others (Fig. S5). Furthermore, erosion represents a source also for DOC and TOC (Schlesinger and Melack, 1981). TP, DOC, and TOC together with Mg2+ have been classified as solutes belonging to the “B” class (Fig. 4); i.e., their concentration patterns show lower variability in hybrid catchments than across other classes. The driver of Mg2+ variability is, however, less clear than for the others. The higher variability in its concentrations in Alpine catchments in comparison to other catchments might be due to the presence of glaciers. The Rhone, Rhine, and Inn rivers include considerable glaciated areas in their catchments, and this might have an effect on magnesium concentration in stream water. The chemistry of glacier water is generally characterized by low water–rock contact times because the volume of water and the flow rate are high that the time water molecules interact with sediments is relatively short (Wimpenny et al., 2010b). Therefore, water sourced by glacier melt can have a dilution effect in terms of Mg2+, and this explains why Mg2+ concentrations are significantly higher during low-flow periods than during high-flow periods. This is also consistent with the observations of other studies, e.g., Ward et al. (1999) and Wimpenny et al. (2010a, b). Weathering processes in Alpine environments are also studied using isotope data (e.g., Tipper et al., 2012; von Strandmann et al., 2008). Results underlie the uncertainty on the processes determining weathering products as Mg2+. Besides the contribution of glacier-sourced water to streamflow and biological processes affecting Mg2+ concentrations (Wimpenny et al., 2010b), the dissolution of bedrock that is not proportional to its composition (Kober et al., 2007), which is likely to take place in the presence of carbonate-poor glacial sediments (McGillen and Fairchild, 2005), might also play a role. Carbonate rocks might dissolve with preferential release of Mg2+, which therefore contributes strongly to solute fluxes in rivers. This phenomenon has been observed also in the Swiss Alps (Haut Glacier d'Arolla), where carbonate contents of sediments are of the order of 1 % (Brown et al., 1996; Fairchild et al., 1999), but their contribution to solute fluxes is much higher (McGillen and Fairchild, 2005).
Catchment size or precipitation might also influence river solute concentrations. This is evident from the behavior of the Lümpenenbach (LU) and Erlenbach (ER) catchments, which are 3 orders of magnitude smaller than the other catchments considered in the study and show median concentrations lower than those of the other catchments. This is true for all solutes, except DOC and TOC, the concentrations of which are the highest in the Erlenbach (ER) and Lümpenenbach (LU) rivers. These catchments are situated in the Alptal valley, which is characterized by more humid climate (double annual precipitation) compared to other catchments. Recently, Von Freyberg et al. (2018) analyzed isotope data of 22 catchments across Switzerland, including LU and ER; computed the young water fraction (i.e., the proportion of catchment outflow younger than approximately 2–3 months) across 22 Swiss catchments; and tested its correlation with a wide range of landscape and hydro-climatic indices. They inferred that hydrological transport in LU and ER is dominated by fast runoff flow paths, given the humid conditions and low storage capacity when compared to other catchments. DOC exports have typically been associated with near-surface hydrologic flow paths (Boyer et al., 1997; Tunaley et al., 2016; Zimmer and McGlynn, 2018), thus offering a possible explanation for the higher concentration of DOC and TOC in these catchments.
In summary, the comparison among catchments highlighted differences in magnitude of silicic acid and calcium, likely due to the different underlying lithology. Steeper morphologies show higher sediment transport in surface water, which is consistent with the observation of the pronounced seasonality of sediment-binding solutes (i.e., TOC and TP) in the Alpine catchments. The headwater catchments ER and LU, which are smaller and wetter than the other case studies, show a peculiar behavior with enhanced DOC and TOC concentrations, likely as a consequence of humid conditions, near-surface and/or surface flow, and low storage capacity.
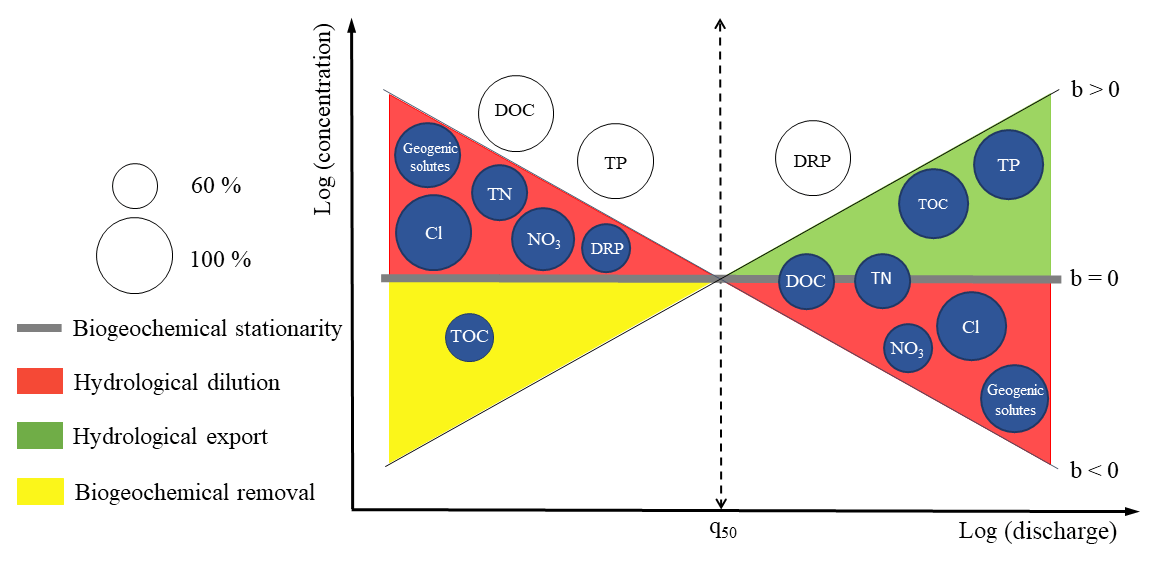
Figure 7Solute behavior classification in the log (C)–log (Q) space. The definitions are derived from the classification of Moatar et al. (2017), which is based on the value of b, the slope of the regression line in the log (C)–log (Q) space. The discharge time series is divided into low-flow and high-flow events based on q50, the median daily discharge. Red areas represent hydrological dilution behavior, yellow areas represent biogeochemical removal for low flows, and green areas represent hydrological export behavior. The grey horizontal line crossing the axes origin represents the near-zero slope area, i.e., it is representative of biogeochemical stationarity. The colorless solutes outside these areas do not show any dominant behavior. The dimension of circles represents the percentage of catchments in which the dominant behavior is observed (from 60 %to 100 %).
5.3 Consistency of solute behaviors across catchments
This study showed that concentration–discharge relations reveal nearly chemostatic behavior for most of the considered solutes across catchments; i.e., analyzed solute concentrations vary a few orders of magnitude less than discharge (Fig. S6). This outcome agrees with other studies (e.g., Godsey et al., 2009; Diamond and Cohen, 2017; Kim et al., 2017; McIntosh et al., 2017). We found that the in-stream biogeochemical signal is highly dampened, which is consistent with other studies (Kirchner et al., 2000; Kirchner and Neal, 2013), but different behaviors of solutes could be nonetheless detected in the log (C)–log (Q) space, thus allowing a partition into four categories, as suggested by Moatar et al. (2017). A representation of such partitioning is offered in Fig. 7, where the space between the negative-slope line and the near-horizontal line represents the dilution behavior, and the space delimited by the positive-slope line and the near-horizontal line represents the enrichment or removal behavior. In fact for low-flow conditions (i.e., q<q50) this is typically associated with biogeochemical processes of solute removal (e.g., nitrification), while for high-flow conditions (i.e., q>q50) it is generally associated with the capacity of the flow to entrain particles containing the solute. Such a description provides a different point of view of C–Q relations compared to the existing literature since the subdivision between low- and high-flow conditions allows for a more detailed investigation of the processes potentially determining the observed solute behaviors. However, the 14-day frequency sampling does not allow a direct detection of short-scale processes and especially fast flood waves. This limitation could contribute to the low percentage, only 29 %, of cases in which a solute switches the behavior between low-flow and high-flow conditions. The additional uncertainty is due to the choice of the median daily discharge as a breaking point for the curves. However, in a recent study, Diamond and Cohen (2017) tested various breaking points for the C–Q relations of different solutes with most of the breaking points centered on approximately the median flow supporting our choice. In search for generalizations, we assigned a solute to each specific class if the same behavior was observed in at least 60 % of the analyzed catchments. Geogenic solutes are grouped in a single circle since almost all of them show a dilution behavior. Only H4SiO4 does not show a clear signal, probably because it is involved, although to a minor extent, in complex dynamics related to biological processes (Tubaña and Heckman, 2015), which can affect its behavior. The diluting behavior of geogenic solutes is a quite well consolidated fact in the literature (Godsey et al., 2009; Thompson et al., 2011; Baronas et al., 2017; Diamond and Cohen, 2017; Hunsaker and Johnson, 2017; Kim et al., 2017; Moatar et al., 2017; Winnick et al., 2017; Wymore et al., 2017), and this study contributes to this body of knowledge confirming this behavior. Residence time is a fundamental hydrological variable for weathering products, since it is related to the weathering rates and therefore to the resulting solute concentration (Maher, 2010). Catchments that show chemostatic behavior (e.g., BR for Ca2+ or WM for H4SiO4) likely have average water residence times that exceed the time required to reach chemical equilibrium, while a dilution behavior is expected when residence times are generally shorter than required to approach chemical equilibrium (Maher, 2011). Our results suggest that the concentrations of geogenic solutes across the catchments are far from the equilibrium, which is likely due to the relatively fast hydrological response of Alpine and subalpine catchments also associated with substantial precipitation amounts. However, it is very likely that the residence time and the flow pathways are highly heterogeneous in Alpine catchments, with water from different sources having different biogeochemical characteristics (Torres et al., 2017; Baronas et al., 2017). Therefore, flow paths with a sufficiently long residence time for reaching chemical equilibration must exist, but they do not leave a major signature on the examined geogenic solutes. In conclusion, there is a quite-high confidence in claiming that geogenic solutes are characterized by a dilution behavior.
The Cl− solute is also clearly characterized by dilution and our results are in agreement with other studies (Thompson et al., 2011; Hoagland et al., 2017; Hunsaker and Johnson, 2017).
NO3 relations with discharge are less clear (Aguilera and Melack, 2018; Butturini et al., 2008; Diamond and Cohen, 2017; Hunsaker and Johnson, 2017), but this study highlighted a dilution behavior also for NO3 in the majority of catchments for both low-flow and high-flow conditions. This result partially agrees with the observations of Wymore et al. (2017), who claimed that NO3 shows variable responses to increasing discharge. In fact, we observed that while dilution is evident in 80 % of the catchments for low-flow conditions, this percentage drops to 63 % for high-flow conditions. Although NO3 is one of the main components of TN (Fig. 2), TN does not show the same behavior. For low flows, TN is also characterized by dilution, but for high flows TN shows chemostatic behavior in about 70 % of catchments.
The behavior of phosphorus and its compounds is not clear. For low flows, DRP behaves chemostatically in about 40 % of catchments but dilutes in about 60 % of catchments. TP behavior could not be classified due to its variability across catchments for low flows, whereas for high flows it clearly shows hydrological export in 90 % of catchments, because of increased suspended sediment concentration. In-stream sediments can be, however, both source and sink for phosphorus (Haggard and Sharpley, 2007), as high suspended sediment concentrations in rivers favor the sorption of phosphorus to particles, thus lowering DRP concentrations (Zobrist et al., 2010). For high-flow conditions, we observed various DRP behaviors across catchments (about 45 % of dilution, 45 % chemostatic, and 10 % enrichment), so that a clear classification is not possible. The weak correlation between DRP and suspended sediment concentration suggests that the sorption of phosphorus to particles is not the only and most influencing factor of the DRP dynamic.
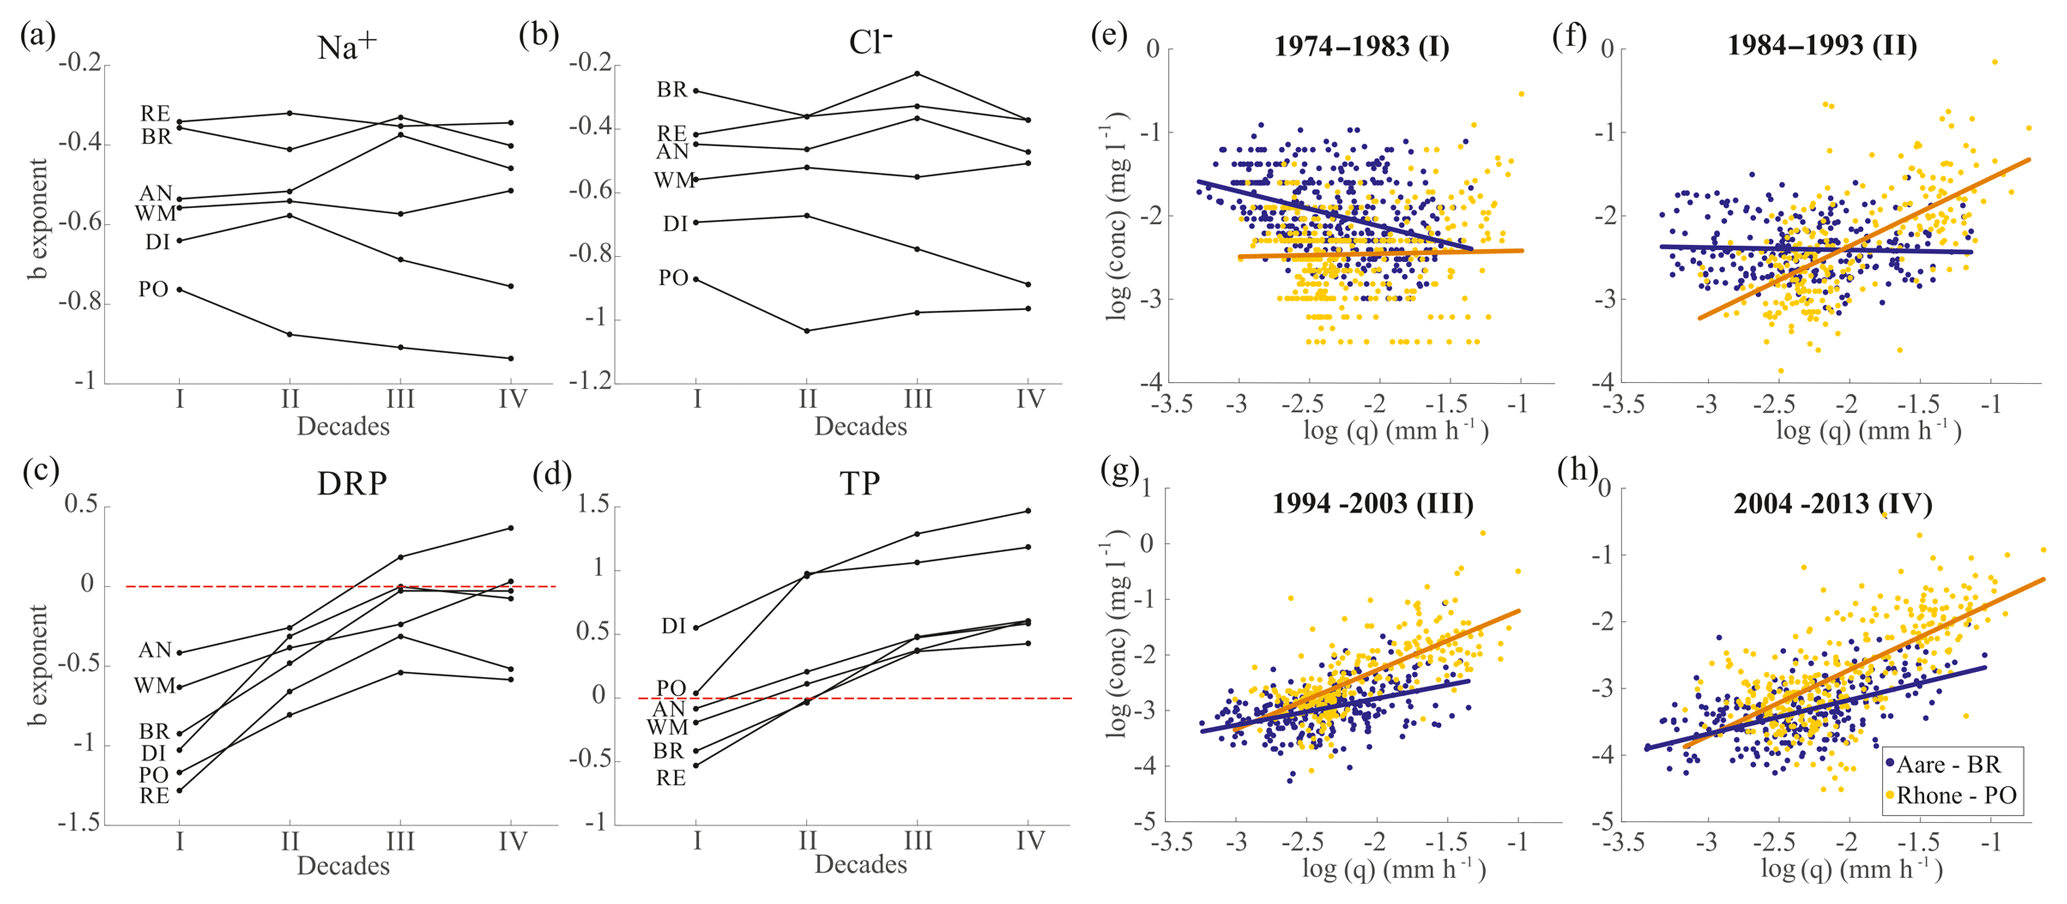
Figure 8Analysis of temporal variations of the b exponent. (a–d) represent the values of the b exponent of the C–Q empirical relation (C=aQb) of (a) Na+, (b) Cl−, (c) DRP, and (d) TP across four decades from 1974 to 2013 – (i) 1974–1983, (ii) 1984–1993, (iii) 1994–2003, and (iv) 2004–2013 – across all the catchments with monitoring period longer than 30 years. The dashed red line represents the zero threshold (i.e., biogeochemical stationarity). (e–h) represents two examples of how the C–Q relations vary across the decades (e) 1974–1983, (f) 1984–1993, (g) 1994–2003, and (h) 2004–2013. The C–Q relations refer to the catchments BR (Swiss Plateau, in blue) and PO (Alpine, in yellow) for the total phosphorus.
TOC is the only solute characterized by enrichment in both low-flow and high-flow conditions. DOC was proved by a set of studies to exhibit an enrichment behavior (e.g., Boyer et al., 1996, 1997; Butturini et al., 2008; Hornberger et al., 1994; McGlynn and McDonnell, 2003; Pedrial et al., 2014; Wymore et al., 2017), but our results are in this respect highly uncertain for low flows and suggest a chemostatic behavior for high flows. Wymore et al. (2017), for instance, analyzed the biogeochemical response in the Luquillo catchment in Puerto Rico and detected an enrichment behavior. This catchment is mainly covered by the tropical forest and characterized by very wet conditions (≈4500 mm yr−1 of rainfall). This is the likely reason leading to higher DOC concentration with increasing streamflow. The underlying mechanism could be that of a larger share of streamflow coming in wet conditions from shallower soil pathways (von Freyberg et al., 2018), which are generally more organic-rich than the deeper horizons hosting lower DOC quantities (Evans et al., 2005). Our study seems to confirm this hypothesis, as the wettest catchments analyzed in this study (Erlenbach, ER; and Lümpenenbach, LU) show enrichment of DOC at least for low-flow conditions. These are likely mainly dominated by subsurface flow, thus confirming the impact of soil wetness in the unsaturated zone on DOC behavior for undisturbed catchments characterized by wet conditions.
The results of this study also showed that the variability in solute magnitude in the long term can play a role in the definition of the solute behavior. Na+ and Cl− show dilution during the entire monitoring period, despite the increasing concentrations through time (Fig. 8). However, DRP and TP switch from the highly negative b exponent of the C–Q power law relation to the even positive b (Fig. 8), after the time when the measures to reduce the phosphate input were introduced (Fig. 6). Such measures (Zobrist and Reichert, 2006) lead to a conspicuous decrease in DRP concentration and partially also in TP. Therefore, the fraction of DRP in TP decreased in time (Fig. S7) and the other TP components became more important than DRP in the definition of TP behavior. Among these, the component carried with sediments might be responsible for the switch, which took place in all the analyzed catchments, from dilution to enrichment across the last four decades. DRP also shows an increasing trend of the b exponent of the C–Q relations across decades, but the behavior only switches from dilution to enrichment in two catchments (AN, WM). This means that when DRP inputs were higher, the transport was not source-limited, while decreasing the input forced DRP to have a more chemostatic behavior, probably because the input became so low that the phosphorus transport was controlled by a legacy of phosphorus stored in the soil, which was accumulated during the years of undisciplined agricultural practices (Sharpley et al., 2013; Powers et al., 2016; Van Meter et al., 2016a).
The long-term water quality data analysis of this study was designed for understanding the signature of catchment characteristics and the influence of anthropic activities on solute concentrations observed in Swiss rivers. The analysis of magnitude, seasonality, and temporal trends revealed clear cause–effect relation between human activities and certain solute concentrations (i.e., Na+, Cl−, NO3, DRP). Indeed, changes in the anthropic forcing (e.g., phosphate ban or increased deicing salt) overwhelm the natural climatic variability and are clearly reflected by changes in magnitude of solutes like DRP, TP, Na+, and Cl−. The seasonality of anthropogenic-related solutes (i.e., NO3, TN, DRP, and TP) in the catchments in the Swiss Plateau, more impacted by human activities, is clearly altered compared to the seasonality of Alpine catchments.
The detection of the signature of catchment characteristics is less straightforward and can only be captured in a quantitative but not statistically significant way due to the spatial heterogeneity of catchment characteristics and the relatively small sample size (11 catchments). Although the solute export is the result of multiple complex processes, catchment topography, geology, and size are expected to have a role in determining solute concentrations, especially of weathering solutes, whose concentrations are influenced by the bedrock composition, and sediment-binding substances (i.e., TP, TOC, and DOC) which have an enrichment behavior in catchments characterized by steeper morphologies and higher erosion rates. While we see evidence for a role of catchment characteristics, these influences are relatively minor in our analysis.
The analysis of the empirical C–Q power laws was used to investigate and possibly obtain a generalizable classification of solute behaviors. Repeating the analysis for low-flow and high-flow conditions provides a more detailed description of solute behaviors in comparison to most of the previous literature. The variability in solute concentration is generally much smaller than that of streamflow, which, as a first step of the analysis, would support a chemostatic behavior. However, the overall dominant behavior across solutes and catchments is dilution. For many solutes, this result is consistent with other studies (i.e., geogenic solutes and Cl−). Sediment-binding substances (TP, DOC, and TOC) show, however, an enrichment during high-flow events, while for other solutes it is not possible to define a clear behavior (e.g., DRP).
Finally, we observed that anthropic activities affect not only the magnitude of concentrations of solutes in rivers, but also their seasonality and long-term dynamics. Remarkable variation in long-term dynamics, moreover, might also determine changes in solute behavior in time, as we demonstrated for DRP and TP. This time-varying perspective of solute behaviors represents a novelty in the literature and gives clear quantitative evidence that anthropic activities might also influence the C–Q relations. Together with the small sample size, one of the main limitations of the study is the coarse temporal resolution of the water quality data that prevents the direct analysis of (solute) fast response times associated with flood dynamics. Luckily, the advancement of technologies in high-resolution concentration measurement research (von Freyberg et al., 2017) will alleviate this limitation in the future. Despite these limitations, the above results reinforce and extend the current knowledge on the biogeochemical responses of rivers, demonstrating that long-term observations allow identifying various aspects of anthropic activities on the solute inputs to rivers.
The NADUF database can be downloaded from https://www.eawag.ch/en/department/wut/main-focus/chemistry-of-water-resources/naduf/ (EAWAG, 2016).
The supplement related to this article is available online at: https://doi.org/10.5194/hess-23-1885-2019-supplement.
SF and MB conceived the original idea, and the discussion with PB contributed to its development. MB developed the analysis code and performed the analysis. SF and PB contributed to the interpretation of the results and shaping the research and discussed results. MB wrote the paper with the contributions of all the co-authors.
The authors declare that they have no conflict of interest.
We acknowledge Ursula Schoenenberger for providing the database used for making Fig. 1 and Stephan Hug for the information about the NADUF program. River discharge and water quality data were kindly provided by the Swiss River Survey Programme (NADUF; http://www.naduf.ch, last access: October 2016). We acknowledge Marius Floriancic for providing the macro-geology classes map and for the fruitful scientific discussion. This study was supported by the DAFNE project (https://dafne.ethz.ch/, last access: March 2019), funded by the Horizon 2020 programme WATER 2015 of the European Union (grant agreement no. 690268).
This paper was edited by Laurent Pfister and reviewed by two anonymous referees.
Abbott, B. W., Baranov, V., Mendoza-Lera, C., Nikolakopoulou, M., Harjung, A., Kolbe, T., Balasubramanian, M. N., Vaessen, T. N., Ciocca, F., Campeau, A., Wallin, M. B., Romeijn, P., Antonelli, M., Gonçalves, J., Datry, T., Laverman, A. M., de Dreuzy, J. R., Hannah, D. M., Krause, S., Oldham, C., and Pinay, G.: Using multi-tracer inference to move beyond single-catchment ecohydrology, Earth-Sci. Rev., 160, 19–42, https://doi.org/10.1016/j.earscirev.2016.06.014, 2016.
Addiscott, T. M.: Nitrate, Agriculture and the Environment, CAB International, Wallingford, 2005.
Aguilera, R. and Melack, J. M.: Concentration-discharge responses to storm events in coastal California watershed, Water Resour. Res., 54, 407–424, https://doi.org/10.1002/2017WR021578, 2018.
Baronas, J., Torres, M., Clark, K., and West, A.: Mixing as a driver of temporal variations in river hydrochemistry: 2. Major and trace element concentration dynamics in the Andes–Amazon, Water Resour. Res., 53, 3120–3145, https://doi.org/10.1002/2016WR019737, 2017.
Basu, N. B., Destouni, G., Jawitz, J. W., Thompson, S. E., Loukinova, N. V., Darracq, A., Zanardo, S., Yaeger, M., Sivapalan, M., Rinaldo, A., and Rao, P. S. C.: Nutrient loads exported from managed catchments reveal emergent biogeochemical stationarity, Geophys. Res. Lett., 37, L23404, https://doi.org/10.1029/2010GL045168, 2010.
Basu, N. B., Rao, P. S. C., and Thompson, S. E.: Hydrologic and biogeochemical functioning of intensively managed catchments: A synthesis of top-down analyses, Water Resour. Res., 47, W00J15, https://doi.org/10.1029/2011WR010800, 2011.
Beisecker, J. E. and Leifeste, D. K.: Water quality of hydrologic bench marks: An indicator of water quality in the natural environment, USGS Circular 460-E, US Geological Survey, Reston, Virginia, 1975.
Birsan, M. V., Molnar, P., Burlando, P., and Pfaundler, M.: Streamflow trends in Switzerland, J. Hydrol., 314, 312–329, https://doi.org/10.1016/j.jhydrol.2005.06.008, 2005.
Bothe, H.: Biology of the Nitrogen Cycle, 1st Edn., Elservier, Amsterdam, the Netherlands, 2007.
Boyer, E. W., Hornberger, G. M., Bencala, K. E., and McKnight, D.: Overview of a simple model describing variation of dissolved organic carbon in an upland catchment, Ecol. Model., 86, 183–188, 1996.
Boyer, E. W., Hornberger, G. M., Bencala, K. E., and McKnight, D.: Response characteristics of DOC flushing in an alpine catchment, Hydrol. Process., 11, 1635–1647, 1997.
Brown, G. H., Sharp, M., and Tranter, M.: Subglacial chemical erosion: seasonal variations in solute provenance, Haute Glacier d'Arolla, Valais, Switzerland, Ann. Glaciol., 22, 25–31, https://doi.org/10.3189/1996AoG22-1-25-31, 1996.
Brunet, F., Potot, C., Probst, A., and Probst, J. L.: Stable carbon isotope evidence for nitrogenous fertilizer impact on carbonate weathering in a small agricultural watershed, Rapid Commun. Mass Spectrom., 25, 2682–2690, https://doi.org/10.1002/rcm.5050, 2011.
Butturini, A., Alvarez, M., Bernal, S., and Vazquez, E.: Diversity and temporal sequences of forms of DOC and NO3-discharge responses in an intermittent stream: Predictable or random succession?, J. Geophys. Res., 113, G03016, https://doi.org/10.1029/2008JG000721, 2008.
Calmels, D., Galy, A., Hovius, N., Bickle, M., West, A. J., Chen, M. C., and Chapman, H.: Contribution of deep groundwater to the weathering budget in a rapidly eroding mountain belt, Taiwan, Earth Planet. Sc. Lett., 303, 48–58, https://doi.org/10.1016/j.epsl.2010.12.032, 2011.
Chorover, J., Derry, L. A., and McDowell, W. H.: Concentration-discharge relations in the critical zone: Implications for resolving critical zone structure, function, and evolution, Water Resour. Res., 53, https://doi.org/10.1002/2017WR021111, 2017.
Diamond, J. S. and Cohen, M J.: Complex patterns of catchment solute-discharge relationships for coastal plain rivers, Hydrol. Process., 32, 388–401, 2017.
Duncan, J. M., Band, L. E., and Groffman, P. M.: Variable nitrate Concentration–Discharge Relationships in a Forested Watershed, Hydrol. Process., 31, 1817–1824, https://doi.org/10.1002/hyp.11136, 2017a.
Duncan, J. M., Welty, C., Kemper, J. T., Groffman, P. M., and Band, L. E.: Dynamics of nitrate concentration-discharge patterns in a urban watershed, Water Resour. Res., 53, 7349–7365, https://doi.org/10.1002/2017WR020500, 2017b.
EAWAG: Häufig gestellte Fragen zur Strassensalzung, EAWAG, Dübendorf, 2011.
EAWAG: NADUF – National long-term surveillance of Swiss rivers, available at: https://www.eawag.ch/en/department/wut/main-focus/chemistry-of-water-resources/naduf/, last access: 28 October 2016.
Evans, C. and Davies, T. D.: Causes of concentration/discharge hysteresis and its potential as a tool for analysis of episode hydrochemistry, Water Resour. Res., 34, 129–137, 1998.
Evans, C. D., Monteith, D. T., and Cooper, D. M.: Long-term increases in surface water dissolved organic carbon: Observations, possible causes and environmental impacts, Environ. Pollut., 137, 55–71, https://doi.org/10.1016/j.envpol.2004.12.031, 2005.
Fairchild, I. J., Killawee, J. A., Hubbard, B., and Dreybrodt, W.: Interactions of calcareous suspended sediment with glacial meltwater: field test of dissolution behaviour, Chemical Geology, 155(3-4), 243-263, 1999.
Galloway, J. N., Dentener, F. J., Capone, D. G., Boyer, E. W., Howarth, R. W., Seitzinger, S. P., Asner, G. P., Cleveland, C. C., Green, P. A., Holland, E. A., Karl, D. M., Michaels, A. F., Porter, J. H., Townsend, A. R., and Vörösmarty, C. J.: Nitrogen cycles: past, present, and future, Biogeochemistry, 70, 153–226, 2004.
Gianini, M. F. D., Gehrig, R., Fischer, A., Ulrich, A., Wichser, A., and Hueglin, C.: Chemical composition of PM10 in Switzerland: an analysis for 2008/2009 and changes since 1998/1999, Atmos. Environ., 54, 97–106, https://doi.org/10.1016/j.atmosenv.2012.02.037, 2012.
Godsey, S. E., Kirchner, J. W., and Clow, D. W.: Concentration–discharge relationships reflect chemostatic characteristics of US catchments, Hydrol. Process., 23, 1844–1864, 2009.
Gwenzi, W., Chinyama, S. R., and Togarepi, S.: Concentration-discharge patterns in a small urban headwater stream in a seasonally dry water-limited tropical environment, J. Hydrol., 550, 12–25, https://doi.org/10.1016/j.jhydrol.2017.04.029, 2017.
Haggard, B. E. and Sharpley, A. N.: Phosphorus transport in streams: processes and modelling considerations, in Modelling phosphorus in the environment, edited by: Radcliff, D. E. and Cabrera, M. L., CRC Press, Boca Raton, 105–130, 2007.
Hall, F. R.: Dissolved solids-discharge relationships 1. Mixing models, Water Resour. Res., 6, 845–850, 1970.
Hall, F. R.: Dissolved solids-discharge relationships 2. Applications to field data, Water Resour. Res., 7, 591–601, 1971.
Hamed, K. H. and Rao, A. R.: A modified Mann-Kendall trend test for autocorrelated data, J. Hydrol., 204, 182–196, https://doi.org/10.1016/S0022-1694(97)00125-X, 1998.
Hamilton, S. K.: Biogeochemical time lags that may delay responses of streams to ecological restoration, Freshwater Biol., 57, 43–57, https://doi.org/10.1111/j.1365-2427.2011.02685.x, 2011.
Hamilton, S. K., Kurzman, A. L., Arango, C., Jin, L., and Robertson, G. P.: Evidence for carbon sequestration by agricultural liming, Global Biogeochem. Cy., 21, GB2021, https://doi.org/10.1029/2006GB002738, 2007.
Hari, R. and Zobrist, J.: Trendanalyse der NADUF – Messresultate 1974 bis 1998, Schriftenreihe der Eawag No. 17, available at: http://www.naduf.ch (last access: January 2017), 2003.
Herndon, E. M., Dere, A. L., Sullivan, P. L., Norris, D., Reynolds, B., and Brantley, S. L.: Landscape heterogeneity drives contrasting concentration–discharge relationships in shale headwater catchments, Hydrol. Earth Syst. Sci., 19, 3333–3347, https://doi.org/10.5194/hess-19-3333-2015, 2015.
Hoagland, B., Russo, T. A., Gu, X., Hill, L., Kaye, J., Forsythe, B., and Brantley, S. L.: Hyporheic zone influences on concentration–discharge relationships in a headwater sandstone stream, Water Resour. Res., 53, 4643–4667, https://doi.org/10.1002/2016WR019717, 2017.
Hornberger, G. M., Bencala, K. E., and McKnight, D. M.: Hydrological controls on dissolved organic carbon during snowmelt in the Snake River near Montezuma, Colorado, Biogeochemistry, 25, 147–165, 1994.
Hunsaker, C. T. and Johnson, D. W.: Concentration-discharge relationships in headwater streams of the Sierra Nevada, California, Water Resour. Res., 53, 7869–7884, https://doi.org/10.1002/2016WR019693, 2017.
Jakob, A., Binderheim-Bankay, E., and Davis, J. S.: National long-term surveillance of Swiss rivers, Verhandlungen der Internationalen Vereinigung für Theoretische und Angewandte Limnologie, 28, 1101–1106, 2002.
Johnson, N. M., Likens, G. E., Bormannn, F. H., Fisher, D. W., and Pierce, R. S.: A working model for the variation in stream water chemistry at the Hubbard Brook experimental forest, New Empshire, Water Resour. Res., 5, 1353–1363, 1969.
Kendall, M. G.: Rank correlation methods, 2nd Edn., Oxford, England, 1955.
Kilchmann, S., Waber, H. N., Parriaux, A., and Bensimon, M.: Natural tracers in recent groundwaters from different Alpine aquifers, Hydrogeol. J., 12, 643–661, 2004.
Kim, H., Dietrich, W. E., Thurnhoffer, B. M., Bishop, J. K. B., and Fung, I. Y.: Controls on solute concentration-discharge relationships revealed by simultaneous hydrochemistry observations of hillslope runoff and stream flow: the importance of critical zone structure, Water Resour. Res., 53, 1424–1443, https://doi.org/10.1002/2016WR019722, 2017.
Kirchner, J. W. and Neal, C.: Universal fractal scaling in stream chemistry and its applications for solute transport and water quality trend detection, P. Natl. Acad. Sci. USA, 110, 12213–12218, https://doi.org/10.1073/pnas.1304328110, 2013.
Kirchner, J. W., Feng, X., and Neal, C.: Fractal stream chemistry and its implications for contaminant transport in catchments, Nature, 403, 524–527, 2000.
Kober, B., Schwalb, A., Schettler, G., and Wessels, M.: Constraints on paleowater dissolved loads and in catchment weathering over the past 16 ka from 87Sr∕86Sr ratios and chemistry of freshwater ostracode tests in sediments of Lake Constance, Central Europe, Chem. Geol., 240, 361–376, https://doi.org/10.1016/j.chemgeo.2007.03.005, 2007.
Langbein, W. B. and Dawdy, D. R.: Occurrence of dissolved solids in surface waters, US Geological Survey Professional Papers 501-D, US Geological Survey, D115–D117, 1964.
Leopold, L. B.: A National Network of Hydrologic Bench Marks, Geological Survey Circular 460-B, United States Department of the Interior, Geological Survey, Washington, D.C., 1962.
Maher, K.: The dependence of chemical weathering rates on fluid residence time, Earth Planet. Sc. Lett., 294, 101–110, 2010.
Maher, K: The role of fluid residence time and topographic scales in determining chemical fluxes from landscapes, Earth Planet. Sc. Lett., 312, 48–58, 2011.
Mann, H.: Nonparametric tests against trend, Econometrica, 13, 245–259, https://doi.org/10.2307/1907187, 1945.
McGillen, M. R. and Fairchild, I. J.: An experimental study of incongruent dissolution of CaCO3 under analogue glacial conditions, J. Glaciol., 51, 383–390, https://doi.org/10.3189/172756505781829223, 2005.
McGlynn, B. L. and McDonnell, J. J.: Role of discrete landscape units in controlling catchment dissolved organic carbon dynamics, Water Resour. Res., 39, 1090, https://doi.org/10.1029/2002WR001525, 2003.
McIntosh, J. C., Schaumberg, C., Perdrial, J., Harpold, A., Vázquez-Ortega, A., Rasmussen, C., Vinson, D., Zapata-Rios, X., Brooks, P. D., Meixner, T., Pelletier, J., Derry, L., and Chorover, J.: Geochemical evolution of the Critical Zone across variable time scales informs concentration–discharge relationships: Jemez River Basin Critical Zone Observatory, Water Resour. Res., 53, 4169–4196, https://doi.org/10.1002/2016WR019712, 2017.
Meybeck, M.: Global chemical weathering of surficial rocks estimated from river dissolved loads, Am. J. Sci., 287, 401–428, 1987.
Moatar, F., Abbott, B. W., Minaudo, C., Curie, F., and Pinay, G.: Elemental properties, hydrology, and biology interact to shape concentration-discharge curves for carbon, nutrients, sediment, and major ions, Water Resour. Res., 53, 1270–1287, https://doi.org/10.1002/2016WR019635, 2017.
Moquet, J. S., Guyot, J. L., Crave, A., Viers, J., Filizola, N., Martinez, J. M., Oliveira, T. C., Sánchez, L. S. H., Lagane, C., Casimiro, W. S. L., Noriega, L., and Pombosa, R.: Amazon River dissolved load: temporal dynamics and annual budget from the Andes to the ocean, Environ. Sci. Poll. Res., 23, 11405–11429, https://doi.org/10.1007/s11356-015-5503-6, 2015.
Mora, A., Mahlknecht, J., Baquero, J. C., Laraque, A., Alfonso, J. A., Pisapia, D., and Balza, L.: Dynamics of dissolved major (Na, K, Ca, Mg, and Si) and trace (Al, Fe, Mn, Zn, Cu, and Cr) elements along the lower Orinoco River, Hydrol. Process., 31, 597–611, https://doi.org/10.1002/hyp.11051, 2016.
Müller, B. and Gächter, R.: Increasing chloride concentrations in Lake Constance: characterization of sources and estimation of loads, Aquat. Sci., 74, 101–112, 2012.
Musolff, A., Schmidt, C., Selle, B., and Fleckenstein, J. H.: Catchment controls on solute export, Adv. Water Resour., 86, 133–146, 2015.
Musolff, A., Fleckenstein, J. H., Rao, P. S. C., and Jawitz, J. W.: Emergent archetype patterns of coupled hydrologic and biogeochemical responses in catchments, Geophys. Res. Lett., 44, 4143–4151, 2017.
Neal, C., Reynolds, B., Rowland, P., Norris, D., Kirchner, J. W., Neal, M., Sleep, D., Lawlor, A., Woods, C., Thacker, S., Guyatt, H., Vincent, C., Hockenhull, K., Wickham, H., Harman, S., and Armstrong, L.: High-frequency water quality time series in precipitation and streamflow: From fragmentary signals to scientific challenge, Sci. Total Environ., 434, 3–12, https://doi.org/10.1016/j.scitotenv.2011.10.072, 2012.
Neal, C., Reynolds, D., Kirchner, Rowland, P., Norris, D., Sleep, D., Lawlor, A., Woods, C., Thacker, S., Guyatt, H., Vincent, Lehto, K., Grant, S., Williams, J., Neal, M., Wickham, H., Harman, S., and Armstrong, L.: High-frequency precipitation and stream water quality time series from Plynlimon, Wales: an openly accessible data resource spanning the periodic table, Hydrol. Process., 27, 2531–2539, https://doi.org/10.1002/hyp.9814, 2013.
Novotny, E. V., Murphy, D., and Stefan, H. G.: Increase of urban lake salinity by road deicing salt, Sci. Total Environ., 406, 131–144, https://doi.org/10.1016/j.scitotenv.2008.07.037, 2008.
Pedrial, J. N., McIntosh, J., Harpold, A., Brooks, P. D., Zapata-Rios, X., Ray, J., Meixner, T., Kanduc, T., Litvak, M., Troch, P. A., and Chorover, J.: Stream water carbon controls in seasonally snow-covered mountain catchments: impact of inter-annual variability of water fluxes, catchment aspect and seasonal processes, Biogeochemistry, 118, 273–290, https://doi.org/10.1007/s10533-013-9929-y, 2014.
Powers, S. M., Bruulsema, T. W., Burt, T. P., Chan, N. I., Elser, J. J., Haygarth, P. M., Howden, N. J. K., Jarvie, H. P., Lyu, Y., Peterson, H. M., Sharpley, A. N., Shen, J., Worrall, F., and Zhang, F.: Long-term accumulation and transport of anthropogenic phosphorus in three river basins, Nat. Geosci., 9, 353–356, https://doi.org/10.1038/NGEO2693, 2016.
Prasuhn, V. and Sieber, U.: Changes in diffuse phosphorus and nitrogen inputs into surface waters in the Rhine watershed in Switzerland, Aquat. Sci., 67, 363–371, 2005.
Rodríguez-Murillo, J., Zobrist, J., and Filella, M.: Temporal trends in organic carbon content in the main Swiss rivers, 1974–2010, Sci. Total Environ., 502, 206–217, 2014.
Rue, G. P., Rock, N. D., Gabor, R. S., Pitlick, J., Tfaily, M., and McNight, D. M.: Concentration-discharge relationsips during an extreme event: contrasting behavior of solutes and changes to chemical quality of dissolved organic material in the Boulder Creek Watershed during the September 2013 flood, Water Resour. Res., 53, 5278–5297, https://doi.org/10.1002/2016WR019708, 2017.
Schlesinger, W. H. and Melack, J. M.: Transport of organic carbon in the world's rivers, Tellus, 33, 172–187, https://doi.org/10.3402/tellusa.v33i2.10706, 1981.
Sharpley, A., Jarvie, H. P., Buda, A., May, L., Spears, B., and Kleinman, P.: Phosphorus legacy: Overcoming the effects of past management practices to mitigate future water quality impairment, J. Environ. Qual., 42, 1308–1326, https://doi.org/10.2134/jeq2013.03.0098, 2013.
Thompson, S. E., Basu, N. B., Lascurain, J. J., Aubeneau, A., and Rao, P. S. C.: Relative dominance of hydrology versus biogeochemical factors on solute export across impact gradients, Water Resour. Res., 47, W00J05, https://doi.org/10.1029/2010WR009605, 2011.
Tipper, E. T., Lemarchand, E., Hindshaw, R. S., Reynolds, B. C., and Bourdon, B.: Seasonal sensitivity of weathering processes: Hints from magnesium isotopes in a glacial stream, Chem. Geol., 312, 80–92, 2012.
Torres, M. A., Baronas, J. J., Clark, K. E., Feakins, S. J., and West, A. J.: Mixing as a driver of temporal variations in river hydrochemistry: 1. Insights from conservative tracers in the Andes-Amazon transition, Water Resour. Res., 53, 3102–3119, https://doi.org/10.1002/2016WR019733, 2017.
Tubaña, B. S. and Heckman, J. R.: Silicon in soils and plants, in: Silicon and plant diseases, edited by: Rodrigues, F. A. and Datnoff, L. E., Springer, Switzerland, https://doi.org/10.1007/978-3-319-22930-0_2, 2015.
Tunaley, C., Tetzlaff, D., Lessels, J., and Soulsby, C.: Linking high-frequency DOC dynamics to the age of connected water sources, Water Resour. Res., 52, 5232–5247, 2016.
Turner, R. E. and Rabalais N. N.: Changes in Mississippi River Water Quality This Century, BioScience, 41, 140–147, https://doi.org/10.2307/1311453, 1991.
Van Meter, K. J. and Basu N. B.: Catchment legacies and time lags: a parsimonious watershed model to predict the effects of legacy stores on nitrogen export, PLoS ONE, 10, e0125971, https://doi.org/10.1371/journal.pone.0125971, 2015.
Van Meter, K. J., Basu, N. B., Veenstra, J. J., and Burras, C. L.: The nitrogen legacy: emerging evidence of nitrogen accumulation in anthropogenic landscapes, Environ. Res. Lett., 11, 035014, https://doi.org/10.1088/1748-9326/11/3/035014, 2016a.
Van Meter, K. J., Basu, N. B., and Van Cappellen, P.: Two centuries of nitrogen dynamics: Legacy sources and sinks in the Mississippi and Susquehanna River Basins, Global Biogeochem. Cy., 31, 2–23, https://doi.org/10.1002/2016GB005498, 2016b.
von Freyberg, J., Studer, B., and Kirchner, J. W.: A lab in the field: high-frequency analysis of water quality and isotopes in stream water and precipitation, Hydrol. Earth Syst. Sci., 21, 1721–1739, https://doi.org/10.5194/hess-21-1721-2017, 2017.
von Freyberg, J., Allen, S. T., Seeger, S., Weiler, M., and Kirchner, J. W.: Sensitivity of young water fractions to hydro-climatic forcing and landscape properties across 22 Swiss catchments, Hydrol. Earth Syst. Sci., 22, 3841–3861, https://doi.org/10.5194/hess-22-3841-2018, 2018.
von Strandmann, P. A. E. P., Burton, K. W:, James, R. H., van Calsteren, P., Gislason, S. R., and Sigfusson, B.: The influence of weathering processes on riverine magnesium isotopes in basaltic terrain, Earth Planet. Sci. Lett., 276, 187–197, 2008.
Ward, J. V., Malard, F., Tockner, K., and Uehlinger, U.: Influence of ground water on surface water conditions in a glacial flood plain of the Swiss Alps, Hydrol. Process., 13, 277–293, 1999.
Weingartner, R. and Aschwanden, H.: Abflussregimes als Grundlage zur Abschätzung von Mittelwerten des Abflusses, in: Gruppe für Hydrologie, Universität Bern: Hydrologischer Atlas der Schweiz, plate 5.2, Landeshydrologie, Bundesamt für Wasser und Geologie, Berne, 1992.
White, A. F. and Blum A. E.: Effects of climate on chemical weathering in watersheds, Geochim. Cosmochimi. Ac., 59, 1729–1747, 1995.
Wimpenny, J., James, R. H., Burton, K. W., Gannoun, A., Mokadem, F., and Gislason, S. R.: Glacial effects on weathering processes: new insights from the elemental lithium isotopic composition of West Greenland rivers, Earth Planet. Sc. Lett., 290, 427–437, 2010a.
Wimpenny, J., Burton, K. W., James, R. H., Gannoun, A., Mokadem, F., and Gislason, S. R.: The behaviour of magnesium and its isotopes during glacial weathering in an ancient shield terrain in West Greenland, Earth Planet. Sc. Lett., 304, 260–269, 2010b.
Winnick, M. J., Carroll, R. W. H., Williams, K. H., Maxwell, R. M., Dong, W., and Maher, K.: Snowmelt controls on concentration–discharge relationships and the balance of oxidative and acid-base weathering fluxes in an alpine catchment, East River, Colorado, Water Resour. Res., 53, 2507–2523, https://doi.org/10.1002/2016WR019724, 2017.
Wymore, A. S., Brereton R. L., Ibarra, D. E., Maher, K., and McDowell, W. H.: Critical zone structure controls concentration-discharge relationships and solute generation in forested tropical montane watersheds, Water Resour. Res., 53, 6279–6295, 2017.
Zhang, X.: Biogeochemistry: a plan for efficient use of nitrogen fertilizers, Nature, 543, 322–323, https://doi.org/10.1038/543322a, 2017.
Zimmer, M. A. and McGlynn, B. L.: Lateral, vertical, and longitudinal source area connectivity drive runoff and carbon export across watershed scales, Water Resour. Res., 54, 1576–1598, 2018.
Zobrist, J.: Water chemistry of Swiss Alpine rivers, in: Alpine Waters, edited by: Bundi, U., Springer, Berlin, Heidelberg, 95–118, 2010.
Zobrist, J. and Reichert, P.: Bayesian estimation of export coefficients from Diffuse and Point Sources of Swiss Watersheds, J. Hydrol., 329, 207–223, 2006.
Zobrist, J., Schoenenberger, U., Figura, S., and Hug, S. J.: Long-term trends in Swiss rivers sampled continuously over 39 years reflect changes in geochemical processes and pollution, Environ. Sci. Poll. Res., 25, 16788–16809, 2018.