the Creative Commons Attribution 4.0 License.
the Creative Commons Attribution 4.0 License.
 | 26 Apr 2019
Exposure of tourism development to salt karst hazards along the Jordanian Dead Sea shore
Simone Fiaschi
Killian Paenen
Mohammad Al-Awabdeh
Damien Closson
The Dead Sea shore is a unique, young and dynamic salt karst system. Development of the area began in the 1960s, when the main water resources that used to feed the Dead Sea were diverted towards deserts, cities and industries. During the last decade, the water level has fallen by more than 1 m per year, causing a hydrostatic disequilibrium between the underground fresh waters and the base level. Thousands of underground cavities have developed as well as hectometre-sized landslides. Despite these unfavourable environmental conditions, large tourism development projects have flourished along the northern coast of the Jordanian Dead Sea. In this work, which is based on a multi-method approach (analyses of radar and optical satellite data, in situ observations, and public science), we show that a 10 km long strip of coast that encompass several resorts is exposed to subsidence, sinkholes, landslides and flash floods. Geological discontinuities are the weakest points where the system can re-balance and where most of the energy is dissipated through erosional processes. Groundwater is moving rapidly along fractures to reach the dropping base level. The salt that fills the sediments matrix is dissolved along the water flow paths favouring the development of enlarged conduits, cavities and then the proliferation of sinkholes. The front beaches of the hotels, the roads and the bridges are the most affected infrastructure. We point out the importance for the land planners to include in the Dead Sea development schemes the historical records and present knowledge of geological hazards in the area.


The Dead Sea (DS) is a terminal lake located in a pull-apart basin which lies in a complex transform fault plate boundary. This tectonically active zone has been historically exposed to destructive earthquakes (Garfunkel et al., 1981; Abou Karaki, 1987, 1993; Bonnin et al., 1988; Galli, 1999; Klinger et al., 2015). In the last two decades, most of the coastal segments of the lake turned into a young and dynamic salt karst system. Subsidence and sinkholes developed very quickly and disrupted the economic development of the area (El-Isa et al., 1995; Salameh and El-Naser, 2000, 2005, 2008; Arkin and Gilat, 2000; Parise et al., 2015; Abou Karaki et al., 2017; Al-Halbouni et al., 2017; Ezersky et al., 2017; Fiaschi et al., 2017; Polom et al., 2018; Salameh et al., 2019 and references therein). Since the 1960s, the DS level has dropped at an accelerating pace. From 1960 (397 m below mean sea level – b.m.s.l.) to 2018 (432 m b.m.s.l.), the level dropped by 35 m due to the transfer of the Tiberias Lake water (located around 100 km north of the DS), the damming of the main tributaries (e.g. the Jordan river) and the exploitation of the DS brine itself for industrial purposes. More recently, a persistent drought has further aggravated the situation.
This drastic change in the hydrogeological setting of the area and its aftermath, led the DS region to become a natural laboratory for studies of the Anthropocene (Abou Karaki et al., 2016 and references therein). The expectation of economic growth based on natural DS resources comes face-to-face with the reality of the human-induced geological hazards.
The environmental impact of water scarcity in the region is so high that during the last decade, the Jordanian, Israeli and Palestinian authorities agreed to work on a mega-engineering project, the Red Sea–Dead Sea Water Conveyance. The project seeks to promote the development of the area, stop the degradation of the environment and solve problems related to the need for fresh water. One of the project's anticipated outcomes is the raising and stabilization of the DS water level to 410 m b.m.s.l. However, given that the target year for completion is 2050, the subsidence phenomena and sinkhole proliferation will continue. As such, it is becoming more and more necessary to systematically delineate, monitor and model hazardous areas.
Studies concerning the DS sinkholes started in the mid-1990s, concomitant with increasing occurrences of decametre-sized collapses. The southern part of the lake was first affected (Fig. 1: Lisan Peninsula, LP, and Ghor Al-Haditha, GAH). In the 2000s, the western coast was progressively covered by dozens of sinkhole clusters (Abelson et al., 2006, 2017; Ezersky et al., 2017). The opposite eastern side was not affected because it comprises rocky cliffs plunging directly into the DS. Noticeably, the northern part of the terminal lake was less exposed during most of that period (Abou Karaki and Closson, 2012). It is only during the last 10 years that the number of hazardous events has increased. The pace remains low, but the type of incident has changed. Landslides, with or without the occurrence of sinkholes, are now predominant.
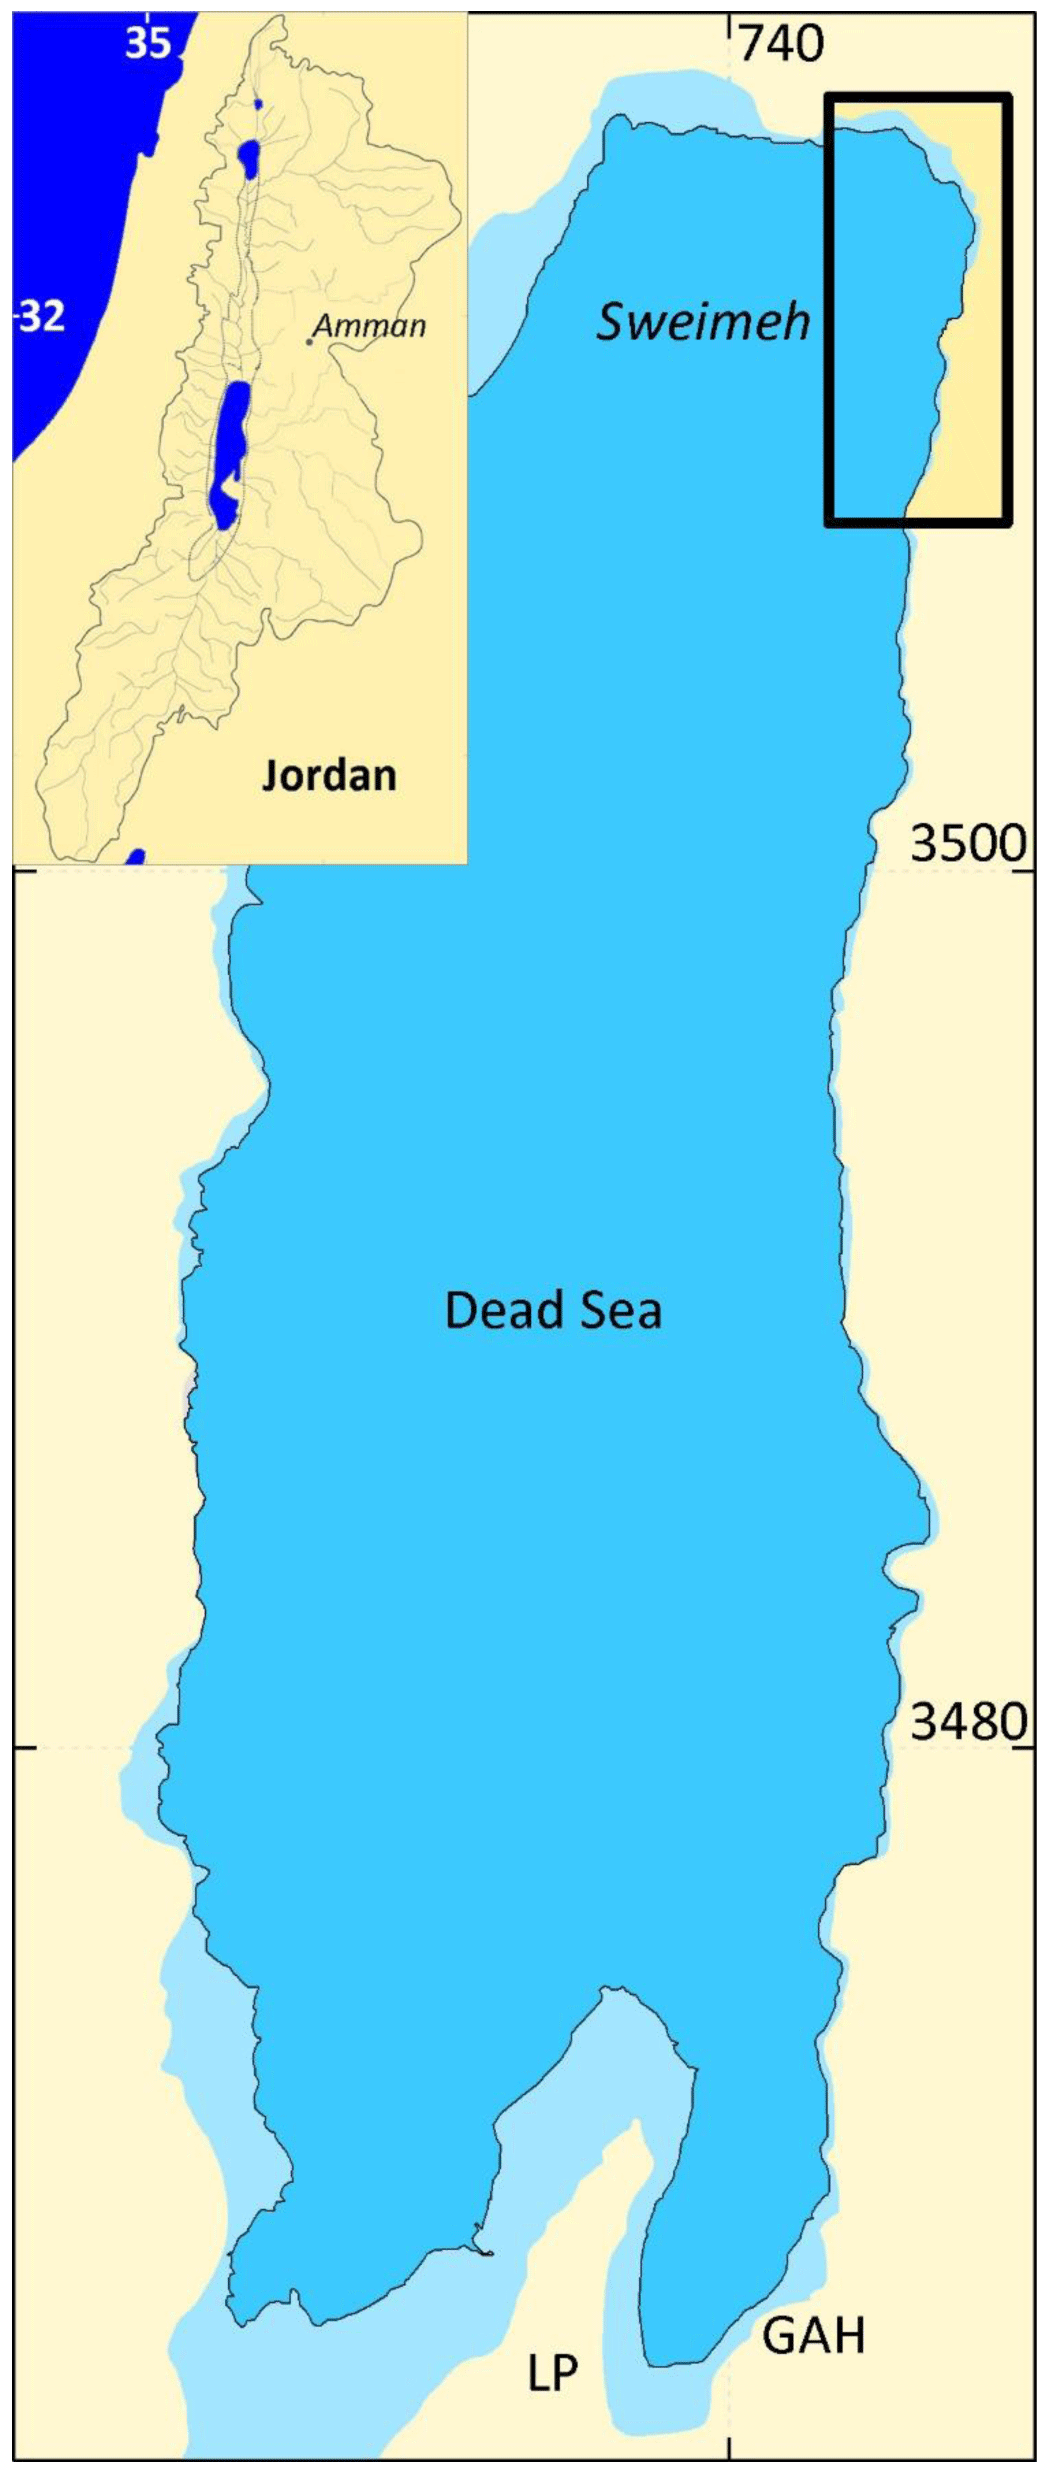
Figure 1Inset: the Dead Sea watershed (coordinates in degrees). Main map: location and extent of the Dead Sea. The study area (Sweimeh) is located in the north-east (black box). The extent of the lake in the 1960s appears in light blue colour. The black line indicates the shoreline in 2018. In the south are located two main sinkhole sites: the Lisan Peninsula (LP) and Ghor Al-Haditha (GAH) (coordinates in UTM 36 (km), WGS 84).
Geological and geophysical surveys carried out in the southern DS have highlighted the main conditions associated with the formation of sinkholes:
-
The seaward migration of the underground interface between fresh and salt water causes the lake-ward shifting of a dissolution front (El-Isa et al., 1995; Salameh and El-Naser, 2000; Ezersky and Frumkin, 2013).
-
Along the western coast, a salt layer (∼11 000 years in age) has been identified as the main source of the underground cavities leading to ground collapses (e.g. Yechieli et al., 1993; Abelson et al., 2003; Ezersky et al., 2017). Below the LP wave-cut platform (Fig. 1), a thick salt layer has been identified by Arab Potash Company (APC) security engineers dealing with grouting operations for the stability of earthen dikes (Ziad Mansour, personal communications, 2015, 2017). In the eastern part of the DS, the existence of this salt layer is still in debate, due to the lack of boreholes with unquestionable dated rock samples. An alternative model developed by Al-Halbouni et al. (2017) suggests a mechanism based on numerous salt lenses and layers dispersed into the alluvial fan sediments.
-
Sinkholes are developing in elongated clusters following geological discontinuities and underground flow paths (Abelson et al., 2003; Closson and Abou Karaki, 2009). Faults and fractures act as conduits that facilitate the displacement of the underground water towards the base level (Ezersky and Frumkin, 2013; Abou Karaki et al., 2016).
-
The difference in elevation between the riparian fresh groundwater and the base level leads to the circulation of underground water with high erosional capabilities (both chemical and mechanical) and increasing velocity along interconnected subsurface channels. One of the consequences is that dissolution can take place below the DS water level (Abou Karaki et al., 2016).
-
Recent studies (e.g. Abelson et al., 2017) have highlighted a connection between the rainfall regime in the recharge zones surrounding the DS basin and the development of sinkholes along the western shore. The co-existence and interactions between these five conditions resulted in the development of a hydro-mechanical model that explains the majority of the sinkholes occurring in the coastal zones (e.g. Ezersky et al., 2017). However, this model encountered some difficulties to convincingly explain a number of observations (Al-Halbouni et al., 2017; Ezersky et al., 2017), especially in Sweimeh, located along the DS north-eastern coast, which is the area of interest of this work (Fig. 1). The fundamental reason is the presence of different aquifer systems along the DS coast that do not react in the same way to the base level drop. Repeated field surveys in the northern DS have shown that sinkholes are not only associated with subsidence but also with hectometre-wide landslides (Closson et al., 2010).
The Sweimeh area is singular in the context of the DS geo-hazards because of the higher number of exposed people and assets with respect to the rest of the Jordanian DS area. In the mid-1990s, the Jordanian authorities invested in infrastructure (e.g. roads, bridges, water pipelines) to create a favourable nest for private investments in the tourism sector. Framed as part of the “Dead Sea Master Plan”, dozens of five-star hotels were built along a ∼10 km long stretch of the coast. Although the urbanization occurred concomitantly with a sporadic development of destructive landslides and sinkholes, no adaptations or remediation measures were taken. In the mid-2000s, it became obvious that the sustainability of private and public investments in tourist resorts and infrastructure along the DS shoreline was questionable.
In this paper, we present and discuss a selection of observations collected in the Sweimeh area in the last two decades. We describe the main features obtained by combining field observations, Synthetic Aperture Radar Interferometry (InSAR) techniques, both Differential (D-InSAR) and Advanced Differential (A-DInSAR), and the analysis of thematic maps and ancillary data in a Geographical Information System (GIS). Following this approach, we deduce that the development and application in the DS area of an early warning system (EWS), based on the detection of precursory deformations (Closson et al., 2003), is necessary to monitor the proliferation of geological hazards and to provide warning signals prior to the occurrence of ground failures.
The Sweimeh area corresponds to a stretch of coast, about 2 km wide and 10 km long, situated along the north-eastern part of the DS (Figs. 1 and 2). The landscape is shaped by Pleistocene to Holocene sediments overlying a thick Mesozoic sequence of Triassic and Cretaceous rocks. The Triassic is represented by the Zarqa Ma'in Group (dolomitic limestone and marls, massive limestones, sandstones and shales). The Cretaceous sequence, composed of sandstones, limestones and dolomitic limestones, overlays the Triassic Zarqa Ma'in group.
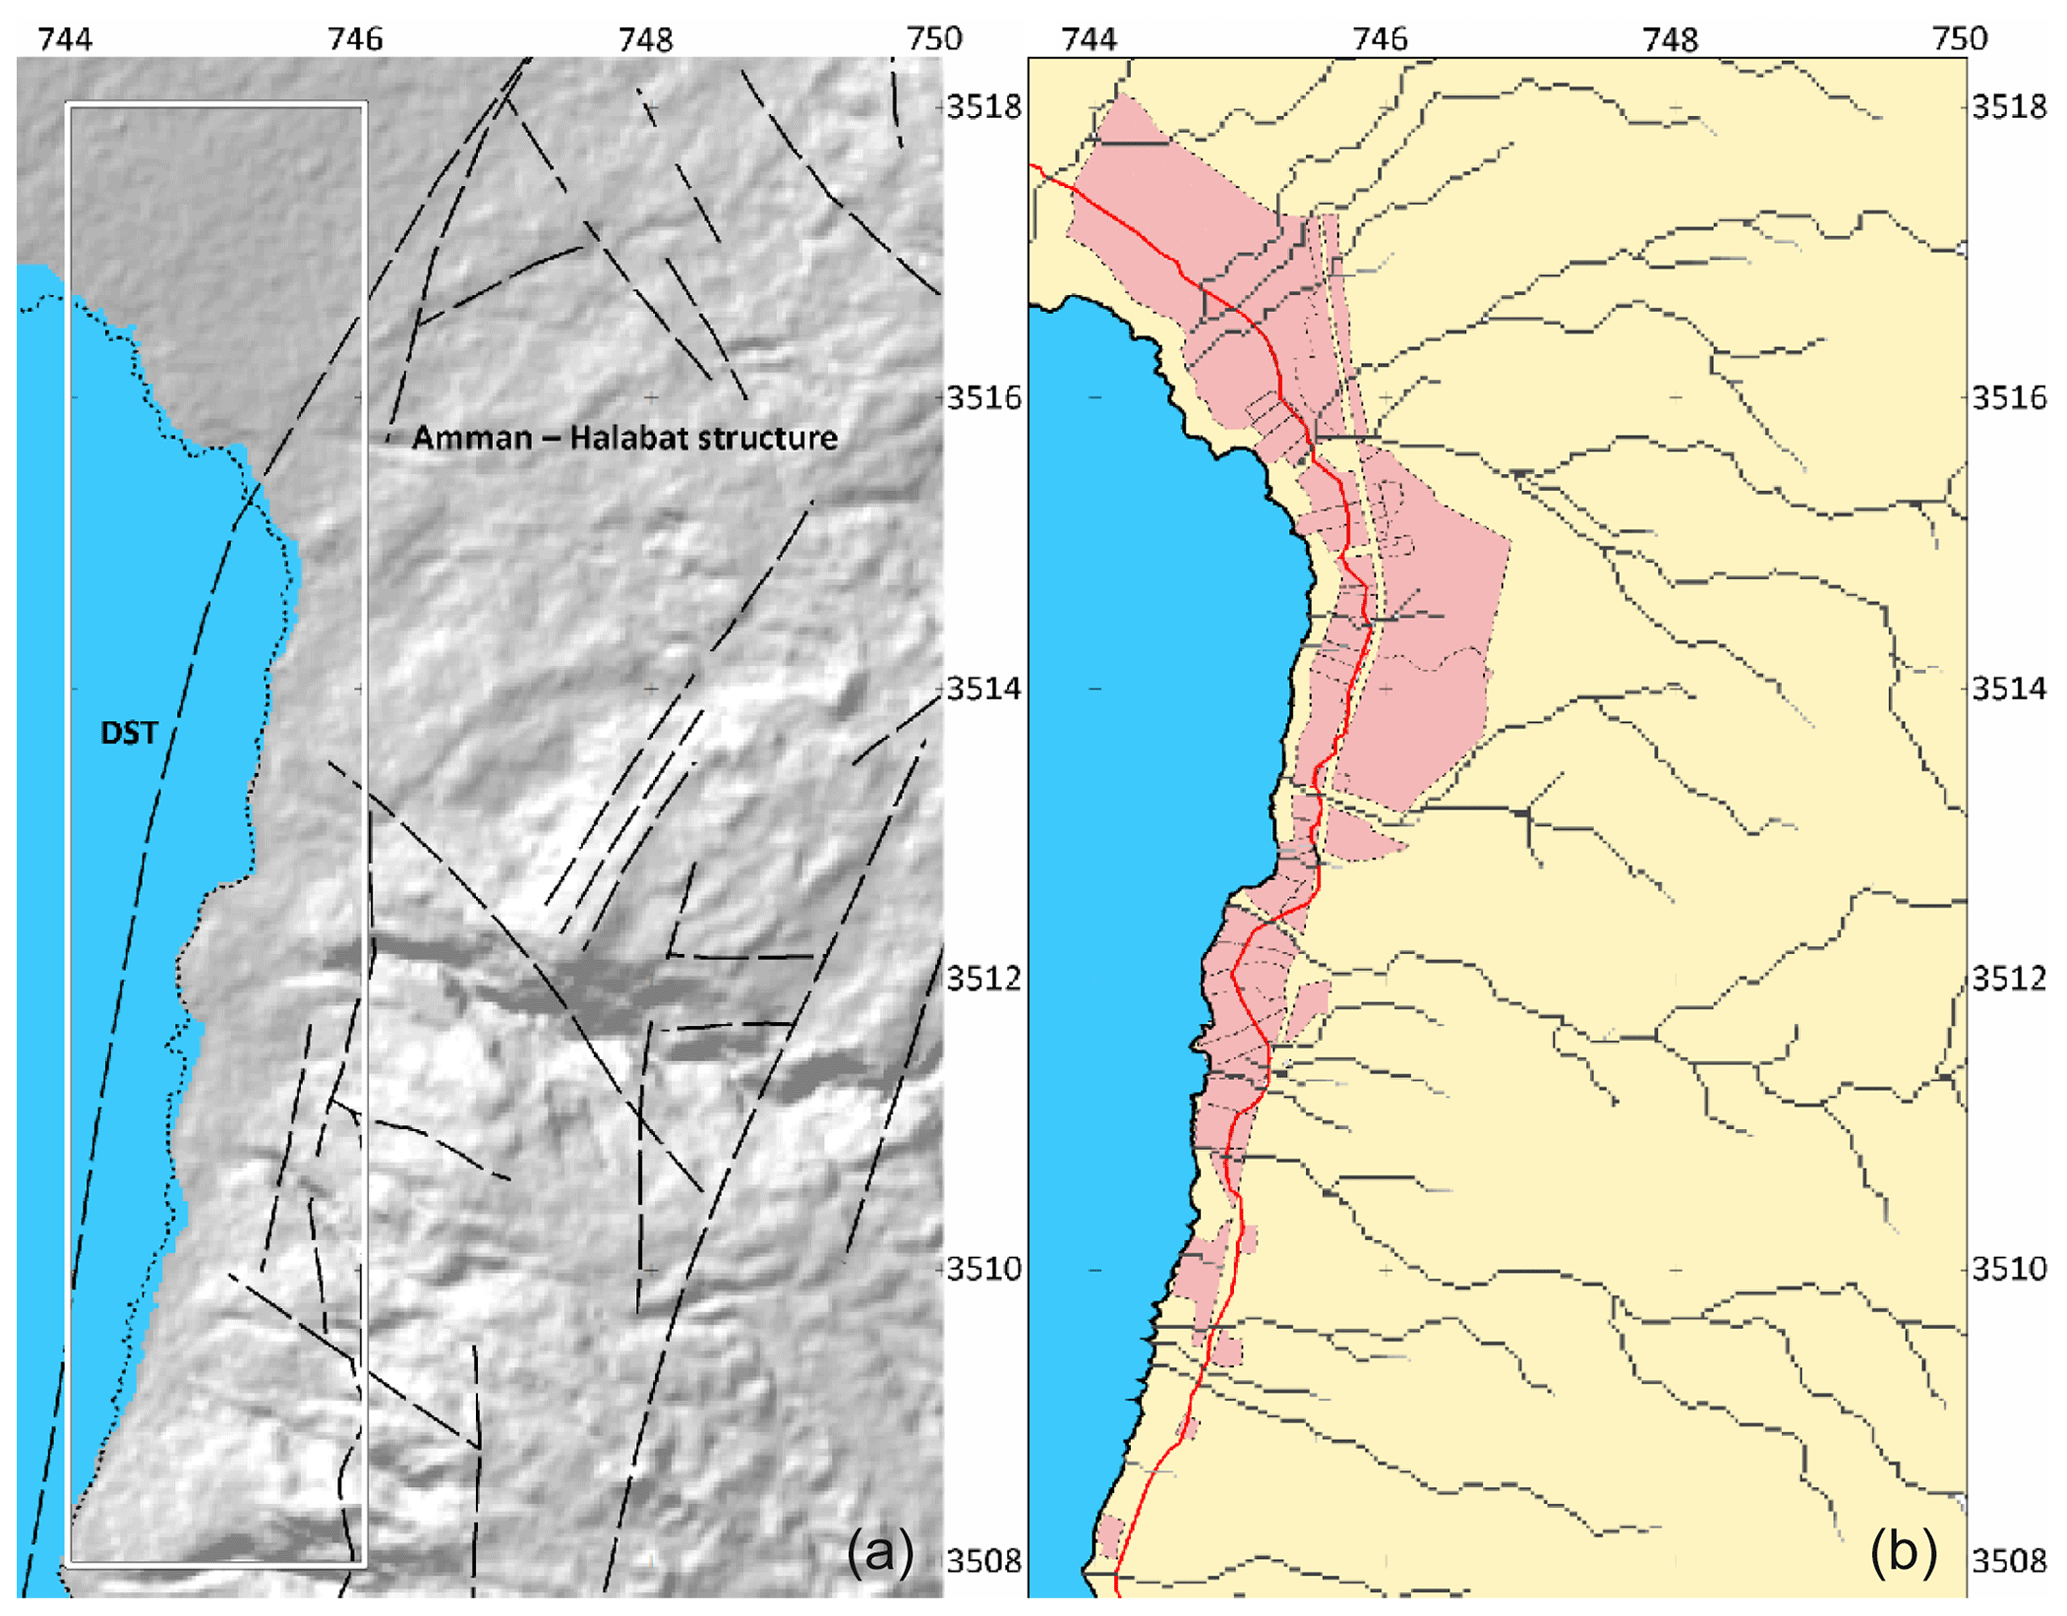
Figure 2Hydrogeological setting of the Sweimeh area. Coordinates system: UTM 36 (km), WGS84. (a) Main structural features (from Al-Awabdeh, 2015). The Dead Sea Transform (DST) crosses the study area (white rectangle). The black dotted line is the coastline in 2018. The hill shade relief derived from the SRTM digital elevation model shows the coastline in February 2000. (b) The red line shows the coastline in 1959. The pink colour represents the cadastral parcels that are either already built or that are selected for future urban development. The black lines represent the thalwegs network.
The Middle to Late Pleistocene is represented by the Lisan Formation that is made of lacustrine sediments (sandstone, marl and claystone) of the Lisan lake, yielding ages from 70 to 12 kyr (Landmann et al., 2002). On top of the sequence, Holocene sediments are made of gravels and soils that cover broad areas in the Jordan valley. The Sweimeh Formation (Shawabkeh, 1993, 2001) comprises massive and bedded Anisian dolomitic limestone interlayered with colourful Scythian sandstone (Bandel and Abu Hamad, 2013). The Kurnub sandstone and the Naur dolomitic limestone (Lower to Middle Cretaceous) overlaying these strata crop out in the central and north-eastern parts of the study area, while the Lisan Formation and the Holocene colluvial sediments overlay the Triassic and the Lower Cretaceous in the northern part.
Regarding the structural setting, the eastern branch of the Dead Sea Transform (DST) fault emerges and reactivates the Amman–Hallabat Structure (AHS) in its southernmost tip (Al-Awabdeh et al., 2016a) (Fig. 2). The AHS is an 80 km fold-bend fault striking NE–SW and running from the easternmost corner of the DS up to central Jordan (Diabat, 2009; Al-Awabdeh et al., 2012; Al-Awabdeh, 2015).
The DST is an active structure (e.g. Al-Awabdeh et al., 2016b). Conjugated normal and normal dextral fault systems are being developed in NW–SE direction. Fracture systems in Sweimeh point to compressional stresses in N–S and NNE–SSW directions and, in return, tensional stresses in NW–SE directions. These fractures and active faults are concordant with the current stress configuration.
In terms of hydro-geological setting, the highly fractured Sweimeh area contributes to the rainfall percolation from the Moab plateau (around 346 mm per year) to the DS base level (east, not visible in Fig. 2). This fact is attested to by the large number of pumping wells located along the fault zone (Goode et al., 2013). The extracted water is essential for irrigation needs.
Regarding groundwater data and volume, the natural outflow was 300 million cubic metres per year for the whole east coast of the DS before the lake level began falling. Currently, the natural outflow measures at 500 million cubic metres. For Sweimeh, 15 million cubic metres per year of natural outflow has been calculated by the Natural Resources Authority of Jordan (NRA, 1966) and through field measurements carried out by the University of Jordan during the last 20 years. This estimation also includes the underwater springs.
Concerning surface water, flash floods initiated by heavy rainstorms are common in the area. They damage infrastructure and are potentially lethal. On the 25 October 2018, in two separate places, 21 people were killed and a bridge collapsed as a result of flash floods. Most of the energy released during such catastrophic events dissipates through incisions into weak mud deposits.
The methods used to understand the dynamics of the geological hazards in the DS, and to derive maps of the most exposed areas, are based on a combination of inputs coming from three independent data sets:
-
Images acquired by satellite SAR sensors are used for the mapping of ground displacements. Differential interferograms and velocity maps computed from multi-temporal A-DInSAR analysis have been used to delineate ground deformations. These observations have also served to prepare field validation campaigns.
-
Satellite optical images were used for the detection of the shoreline's positions through time, the infrastructure (building footprints, roads, bridges), the soil moisture gradient, and the vegetation appearance or disappearance, especially in the recently emerged areas.
-
Since the early 1990s, field surveys have been carried out to complement and/or confirm satellite observations and to map additional information such as wall repairs and cracks in the facades that are otherwise impossible to capture with space-borne sensors.
All available information was geocoded and imported in a GIS to perform further analyses.
3.1 SAR data sets and derived products
The available SAR images used in this study consist of 68 Sentinel-1A/B (S1-A/B) images acquired in vertical co-polarization (VV) and descending orbit from 20 September 2015 to 9 September 2017. Further specifications of the S1-A/B images are presented in Table 1. The scenes have been processed with the small baseline subset (SBAS) technique (Berardino et al., 2002) implemented in the Sarscape™ software in order to retrieve information of the spatial distribution and rates of the displacements along the DS eastern coastline. In total, 463 interferometric pairs have been connected by using 1 % for the geometric baseline threshold (with respect to the critical baseline) and 120 d for the temporal baseline threshold. A coherence threshold of 0.40 was used to unwrap the interferograms. A detailed description of the adopted SBAS processing workflow is available in Fiaschi et al. (2017). The products derived from the standard DInSAR analysis, consisting of geocoded intensity and coherence maps, and differential interferograms are used to check, in particular dates, the displacements and changes in the geophysical properties of the ground surface. They were also used to better assess the possible cause of specific ground failure events.
Table 1Specifications of the Sentinel-1A/B images used in this study.

The processing results were supported by field observations and visual interpretation of optical images. Ancillary data, such as the location of the pumping stations and the fault and fracture data sets, were integrated in the analysis to get an overview of the ground deformation dynamics.
3.2 Optical data sets and derived products
Three data sets derived from space-borne optical sensors have been used to get knowledge of the landscape evolution:
-
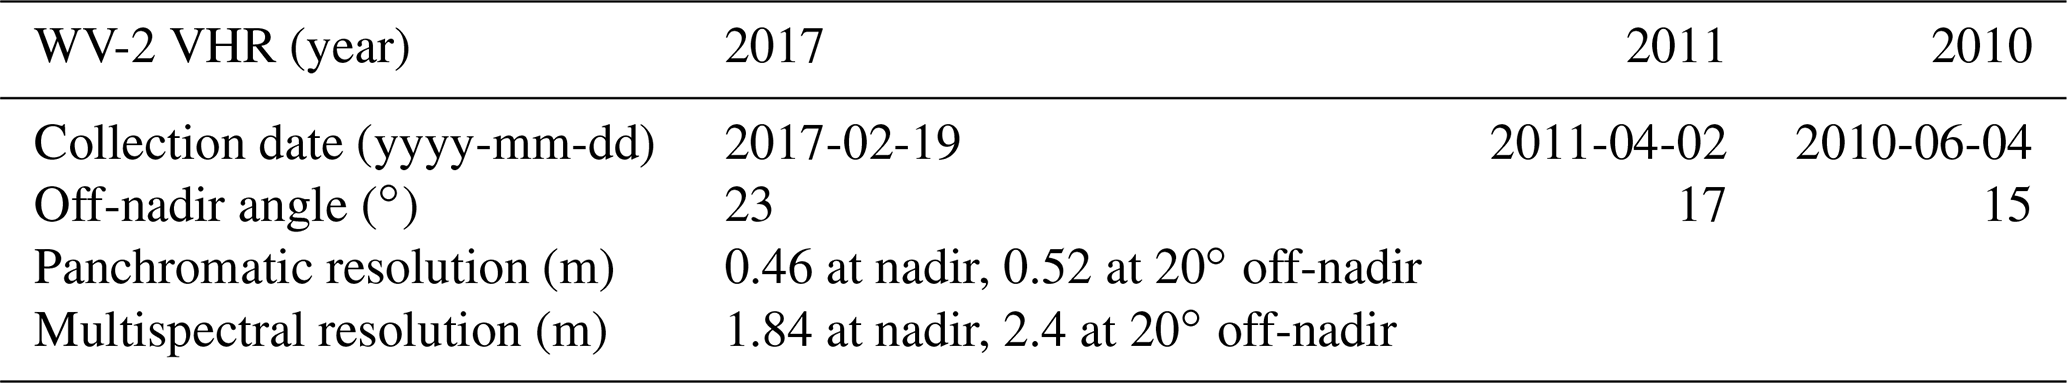
Very high resolution (VHR) WorldView-2 (WV-2) images (Digital Globe™) have been processed to extract information of the shoreline position, the building footprints, the vegetation, the soil moisture and of geomorphological features such as depressions located below the water level, generally associated with the presence of underwater springs.
The WV-2 images consist of one VHR panchromatic band at 0.46 m resolution and eight spectral bands at 1.86 m resolution, coastal, blue, yellow, green, red, red edge, near-infrared (NIR), and NIR2. Image fusion algorithms implemented in ENVI™ and Erdas Imagine™ were applied to create pan-sharpened images, i.e. an image with colour information but at 0.46 m resolution. Such processed images are very efficient for the extraction, interpretation and validation of information related to infrastructure, vegetation, etc. Further specifications are found in Table 2.
-
LANDSAT and Sentinel-2 imagery was used to monitor the position of the DS shoreline and the vegetation development along the coast from 1973 to 2019. The most recent LANDSAT data are at 15 m spatial resolution in panchromatic and 30 m in optical-NIR spectral bands. Pan-sharpening techniques were applied to work at higher resolution with colours. Sentinel-2 images are at 10 m resolution for the optical-NIR bands. In this case, there was no need to apply pan-sharpening methods.
-
Declassified CORONA scanned pictures dating back to the late 1960s were interpreted to map the shoreline prior to the base level drop. At that time, a relative equilibrium existed in the coastal environment as attested, for example, by the river profiles. Additionally, the vegetation had colonized almost the totality of the shore. According to the CORONA mission designator, the best ground resolution (BGR) achievable was 2.74 m. After a careful geocoding of the scanned pictures, and without resampling the original data from the USGS, a resolution of around 10 m was found.
The extraction of data about the landscape's changes was performed by computing two basic indices over Worldview-2, Sentinel-2 and Landsat-8 images: the normalized difference vegetation index (NDVI = (R − IR)/(R + IR)) and the normalized difference water index (NDWI = (G − IR)/(G + IR)). They were applied to map the vegetation cover and the emerged areas between two acquisition dates. Changes have been computed based on a simple difference between pairs of images acquired by the same sensor. The classification of the results was based on the standard deviation. Emphasis was given to the extreme classes corresponding to the appearance of vegetation.
The interpretation of these data sets allowed for the detection of springs and shallow water flow paths in the lands that have emerged as the water levels have fallen. With less than 100 mm of rainfall per year, the growth and decline of vegetation in the DS depends on small variations in the groundwater elevation, which in turn depends on the elevation of the base level. Thus, the study of the vegetation and of the soil moisture provides information about changes in underground water circulation close to the shoreline. These observations were also used to prepare field campaigns.
The building footprints have been digitized manually. The boundaries of the hotels' parcels were derived from the interpretation of the VHR satellite images and compared to the available land planning maps.
3.3 Field surveys and ancillary data
Since the beginning of the 1990s, our research team has been photographically documenting the induced geological hazards in the whole Jordanian DS area. Field surveys served to validate the observations derived from satellites' imagery and to delineate more accurately the areas exposed to geological hazards. The location of each observation was recorded over topographic maps and later on with a GPS system.
Dozens of field surveys were carried to monitor the development of fissures, landslides and sinkholes. During the last 15 years, the emergence of photo repositories on the Internet has made new original data sources accessible. More and more, the photographs are correctly geo-tagged, which helps to speed up the work of archiving those images.
The geo-tagged images have been collected and archived to allow a multi-temporal analysis in a GIS system. The delineation of affected zones through time relies also on this source of data and has supported the delineation of hazardous areas inside the cadastral plots. Web Map Service (WMS) servers have provided a large number of ancillary data such as VHR images from Bing and Open Street Map.
The Shuttle Radar Topography Mission (SRTM) digital elevation model (DEM) with a spatial resolution of 30 m × 30 m was used to position all observations into a 3-D environment and to remove the topographic phase in the InSAR processing. The SRTM DEM corresponds to the landscape of February 2000 (DS elevation of −413 m), and therefore there is no topographic data for the coastal zones that have emerged after that date (DS elevation of −432 m in 2018). Taking into consideration the thalwegs delineated with hydrological tools in ArcGIS™, the missing information for the landscape that has emerged after 2000 was created from the visual interpretation of the more recent VHR images.
Geological data have been collected from the existing published sources at 1:50 000 scale (1980s) and complemented by more recent studies at 1:10 000 scale (e.g. Al-Awabdeh, 2015).
The “Master-Plan Development Strategy of the Jordan Valley” (Tegler, 2007) was used to extract and digitize the cadastral maps matching the area of interest, in order to obtain a more precise mapping and classification of the damage to the infrastructure in the study area.
Well data have been collected to support the interpretation of the differential interferograms. The underground water resources in the Jordan Valley are pumped for agricultural purposes. The ground deformations related to the extraction of water are generally localized around the pumping stations and are not related to those resulting from the lowering of the DS level, which affects larger areas along the coastline. The inventory of pumping stations is, therefore, important for the interpretation of subsidence zones. Some of the wells managed by the Jordan Ministry of Water and Irrigation (MWI) were monitored in conjunction with the US Geological Survey (USGS) to extract groundwater levels and salinity trends (Goode et al., 2013). Groundwater level data from 30 of these wells were available for the northern DS, among which only 3 are located in the Sweimeh area.
3.4 Method for mapping exposure of tourism infrastructure
In this study, we focused on the exposure to geological hazards (landslides, sinkholes, subsidence and rivers' incision) of the DS's tourist infrastructure (buildings, roads, front beaches, bridges, walls, buildable cadastral plots) created over the last 20 years. Exposure is the first variable that ranks areas in order of priority. Depending on the criteria used to determine this priority, high-, medium- or low-exposure areas have been considered.
The exposure maps are produced by classifying the damage at cadastral plot level based on the combination of field observations, security engineers' and employees' testimonies, and remote sensing diachronic results. The assessment of the parcels' exposure includes the spatial extent of the observed damage, the period and frequency at which a particular asset is affected, and its position with respect to critical factors such as the distance from the shoreline. The polygons were drawn manually after a careful analysis of all pieces of evidence. The contribution of the photographic documentation was essential because it provided information not accessible with remote sensing techniques. The damage to the buildings is categorized into eight classes from 0 (minimum) to 7 (maximum). Visible signs on buildings gradually increase from hairline cracking (rank 1) to total collapse (rank 7) (Cooper, 2008). A similar approach was successfully applied previously in two cases: the forecast of the Numeira Salt Factory destruction more than 1 year before being swallowed by sinkholes, and the prediction of the collapse of a 3 km long section of APC “dike 18” (Abou Karaki et al., 2016) 1 year before the amputation of the affected segment from saltpan SP-0A. The workflow that was used to create the exposure maps is presented in Fig. 3. SAR images are used to generate time series of ground deformation. A-DInSAR is one of the main techniques used to quantify the changes in the coastal areas. The obtained results are checked during regular field observations. The ground deformations (i.e. subsidence) related to water pumping are excluded from the process, while those related to DS level decline are used as the main input of the study. All the information is combined and is associated with five cadastral plots in a GIS environment.

Figure 3Flow chart of the methodology applied in this research (black rectangles). Rectangles coloured in grey indicate the future targets of the research.
Optical imagery also plays an important role in providing information about the landscape modifications that range from the appearance or disappearance of springs to the construction of new urban areas. NDVI and other indices are used to capture some specific elements related to the vegetation distribution and its stress, as well as major changes in the soil moisture corresponding to the emergence of new springs (prior to the development of vegetation).
The NDVI has been correlated to long-term water stress (e.g. Martin et al., 2005) and should be considered as a measurement of amalgamated plant growth that reflects various plant growth factors (Verhulst and Govaerts, 2010). The physical characteristics detected by the index are likely related to some measure of canopy density or total biomass. The underlying factor for variability in a typical vegetation index cannot be blindly linked to a specific input without some knowledge of the primary factor that limits growth. For example, in the DS coastal zone, the limiting factor can be the drop of the groundwater level caused by the base level lowering.
Well data and field observations are useful to obtain information about the status of the water table level and the groundwater flow dynamic and position, as well as about the variations in the salinity of the springs, which may correspond to variations in the salt dissolution processes.
The exposure map of touristic cadastral plots includes a combination of evidence that an ongoing threat is emerging. The main causes of the occurrence of sinkholes, subsidence and landslides are mainly related to the underground water circulation: flow rates, saturation with respect to salt and the lateral variation of facies in the DS alluvial–colluvial environment. This information can be obtained only by direct borehole measurements, which are lacking in the study area. For this reason, in this study we postulated that the water table depth can be extrapolated by combining different sources of information including stream and spring locations, vegetation cover types, structural features, and ground displacements. For other elements some assumptions should be made: thalwegs are mostly dried up, but water is still present beneath the surface at a depth of ∼1 m; spring elevation indicates the intersection of the water table with the surface; elevation of water residing in sinkholes is another source of direct observation; root characteristics of different vegetation types can be used to map the water table level at 1–2 m of depth, depending on the type of plant; the subsidence detected with InSAR could occur in areas where the water table presents a higher gradient with respect to the surroundings.
This cost-effective approach for the mapping of areas exposed to geo-hazards has already proved to be efficient several times in the southern DS with the predictions of the destruction of the Numeira Salt factory at Ghor Al-Haditha and the deterioration of the southern part of “dike 18” of the APC network (Parise et al., 2015). The same approach also helped explain the phenomena responsible for the destruction of “dike 19” (i.e. sinkholes and strong subsidence).
4.1 Ground deformations derived from A-DInSAR
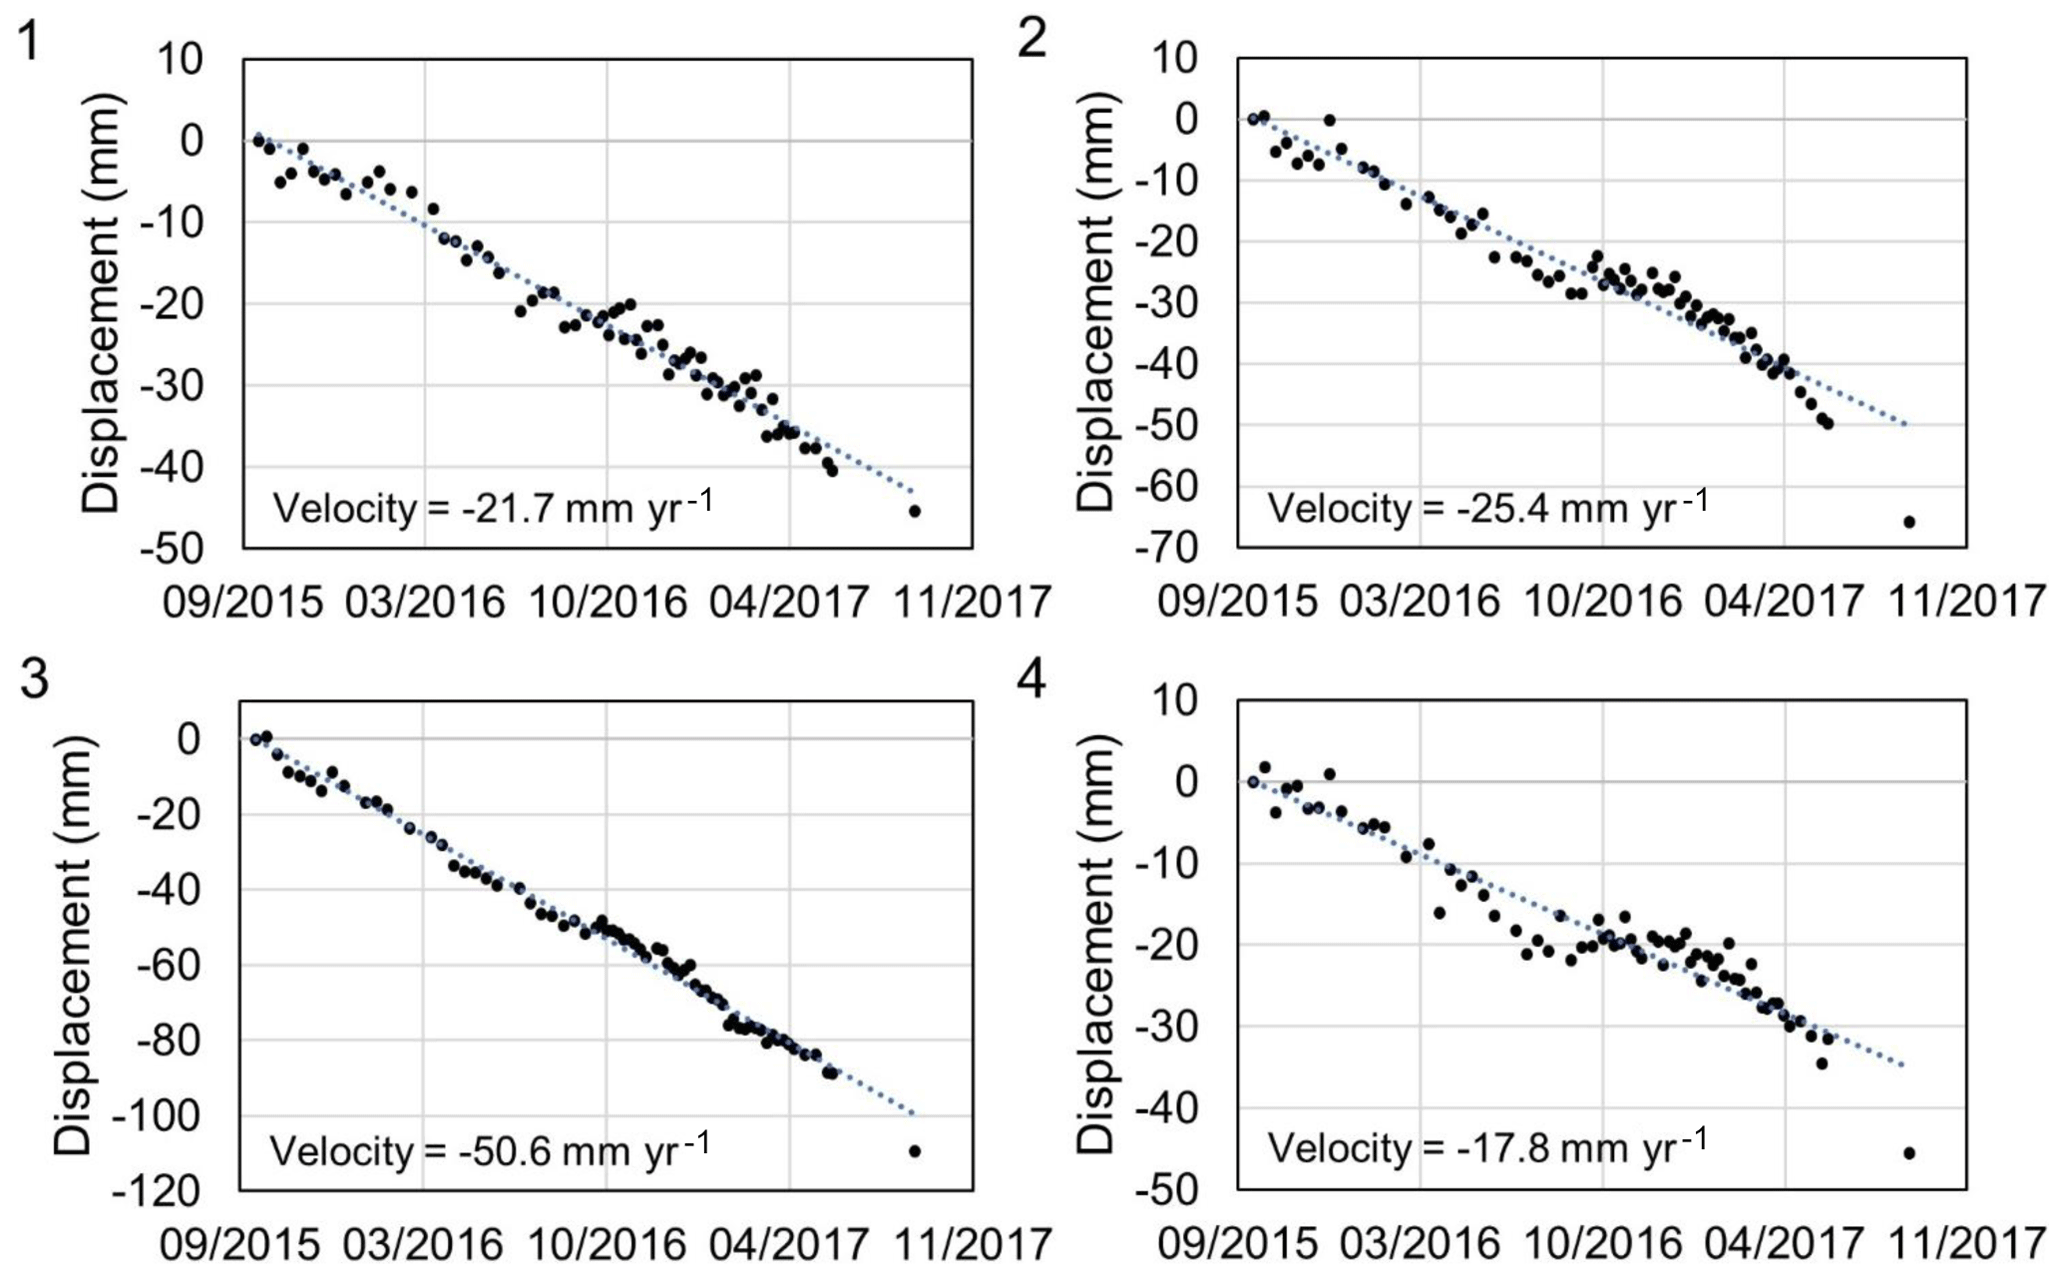
The processing of the available S-1A/B images with the SBAS approach resulted in a detailed (∼15 m × 15 m pixels size) vertical velocity map of the entire study area (Fig. 4). In total, it was possible to retrieve the displacement time series of 52 340 points. The obtained results indicate that all the areas west of the 1959 shoreline (Fig. 4, red line) are affected by high rates of subsidence (red and purple areas). Highest subsidence velocities up to −130 mm per year. are found in seepage areas along the coastline and in the exposed muddy plains. The front beaches of the parcels A, B and D are the most affected, with velocities reaching −25, −36 and −68 mm per year. Examples of the displacement time series extracted at the hotels' location are presented in Fig. 5. Field observations have confirmed that sinkholes and landslides affect these areas over a distance of between 100 and 200 m landwards. Subsidence also affects some areas east of the former 1959 shoreline (yellow and orange areas), in particular between parcels A and B. This zone corresponds to the damage fault zone associated with the Amman–Hallabat Structure. A possible explanation for this subsidence could be the permeability increase (fractures) that allows a more important underwater flow than in the surrounding areas. The same phenomenon occurs also between parcels C and E.
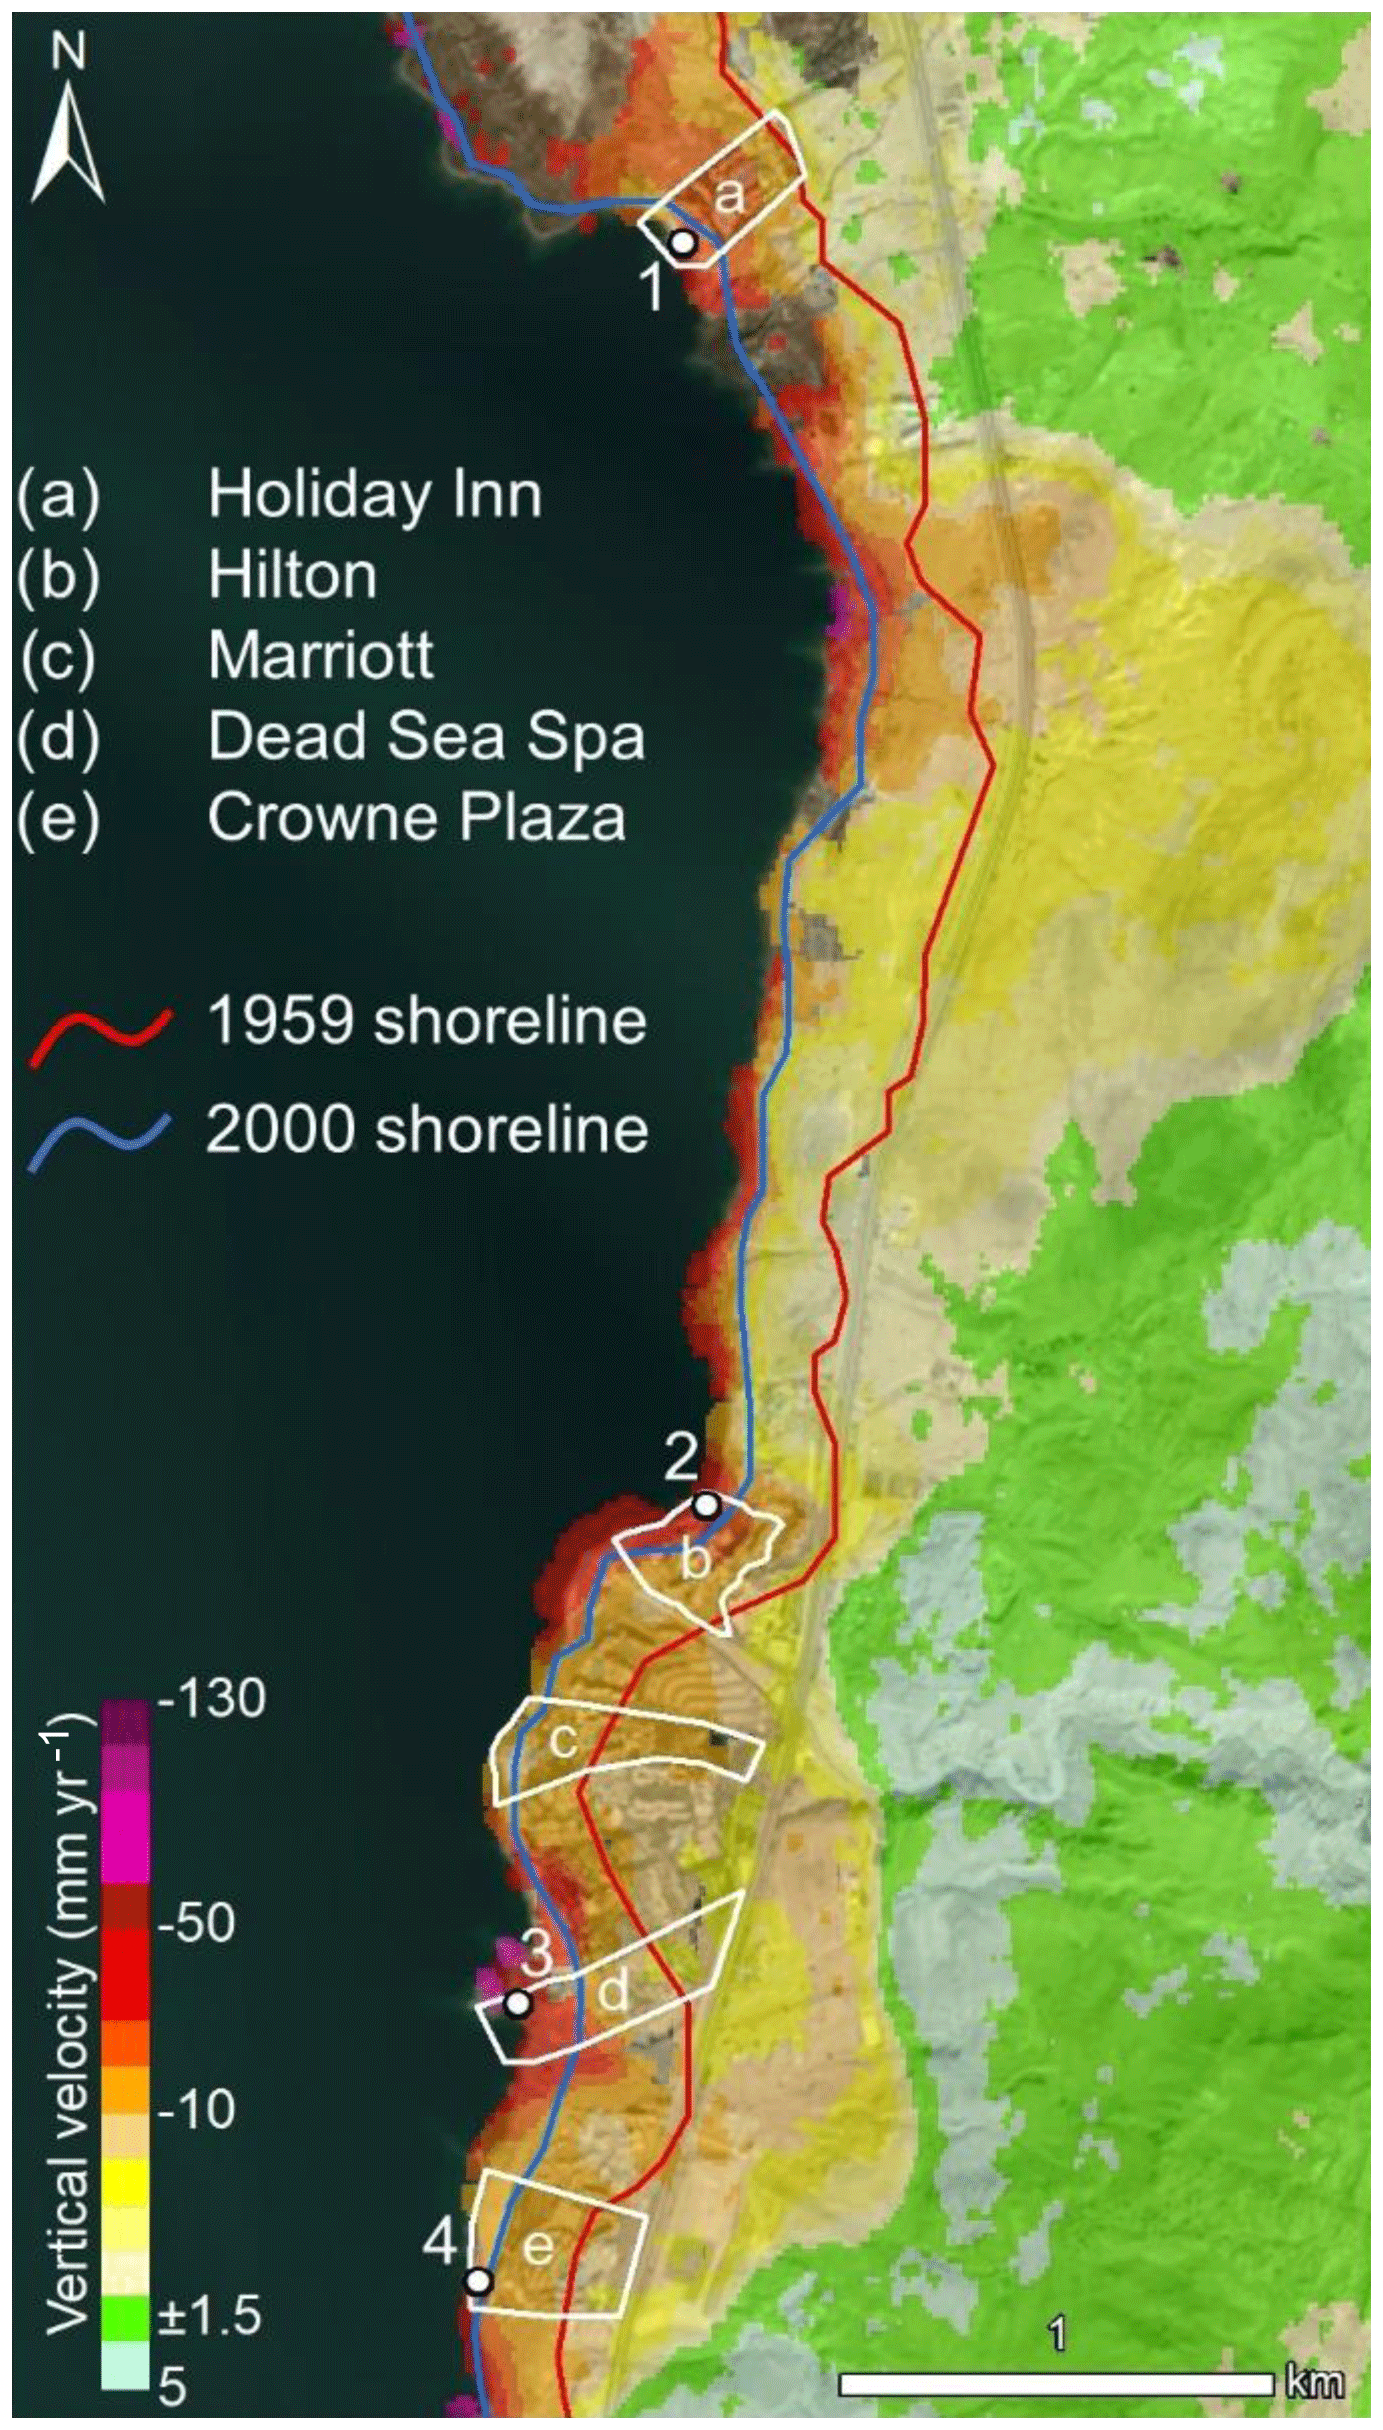
Figure 4Vertical velocity map of the study area obtained from the SBAS processing of Sentinel-1A/B images. The white dots labelled with numbers are the points selected to extract the displacement time series presented in Fig. 5.
4.2 Vegetation dynamics derived from optical imagery
Figures 6 and 7 illustrate the contribution of the vegetation mapping to the identification of areas prone to landslides and sinkholes. Figure 6 displays side by side a major landslide observed with optical imagery and its equivalent using the NDVI index. The vegetation appears in green while the salty mud is in yellow. The DS is in the lower left corner (dark in colour). The growth of Tamarix bushes at the landslide crown underlines the presence of seepage zones. Areas covered by reeds are also found in the downstream sections of the landslide.
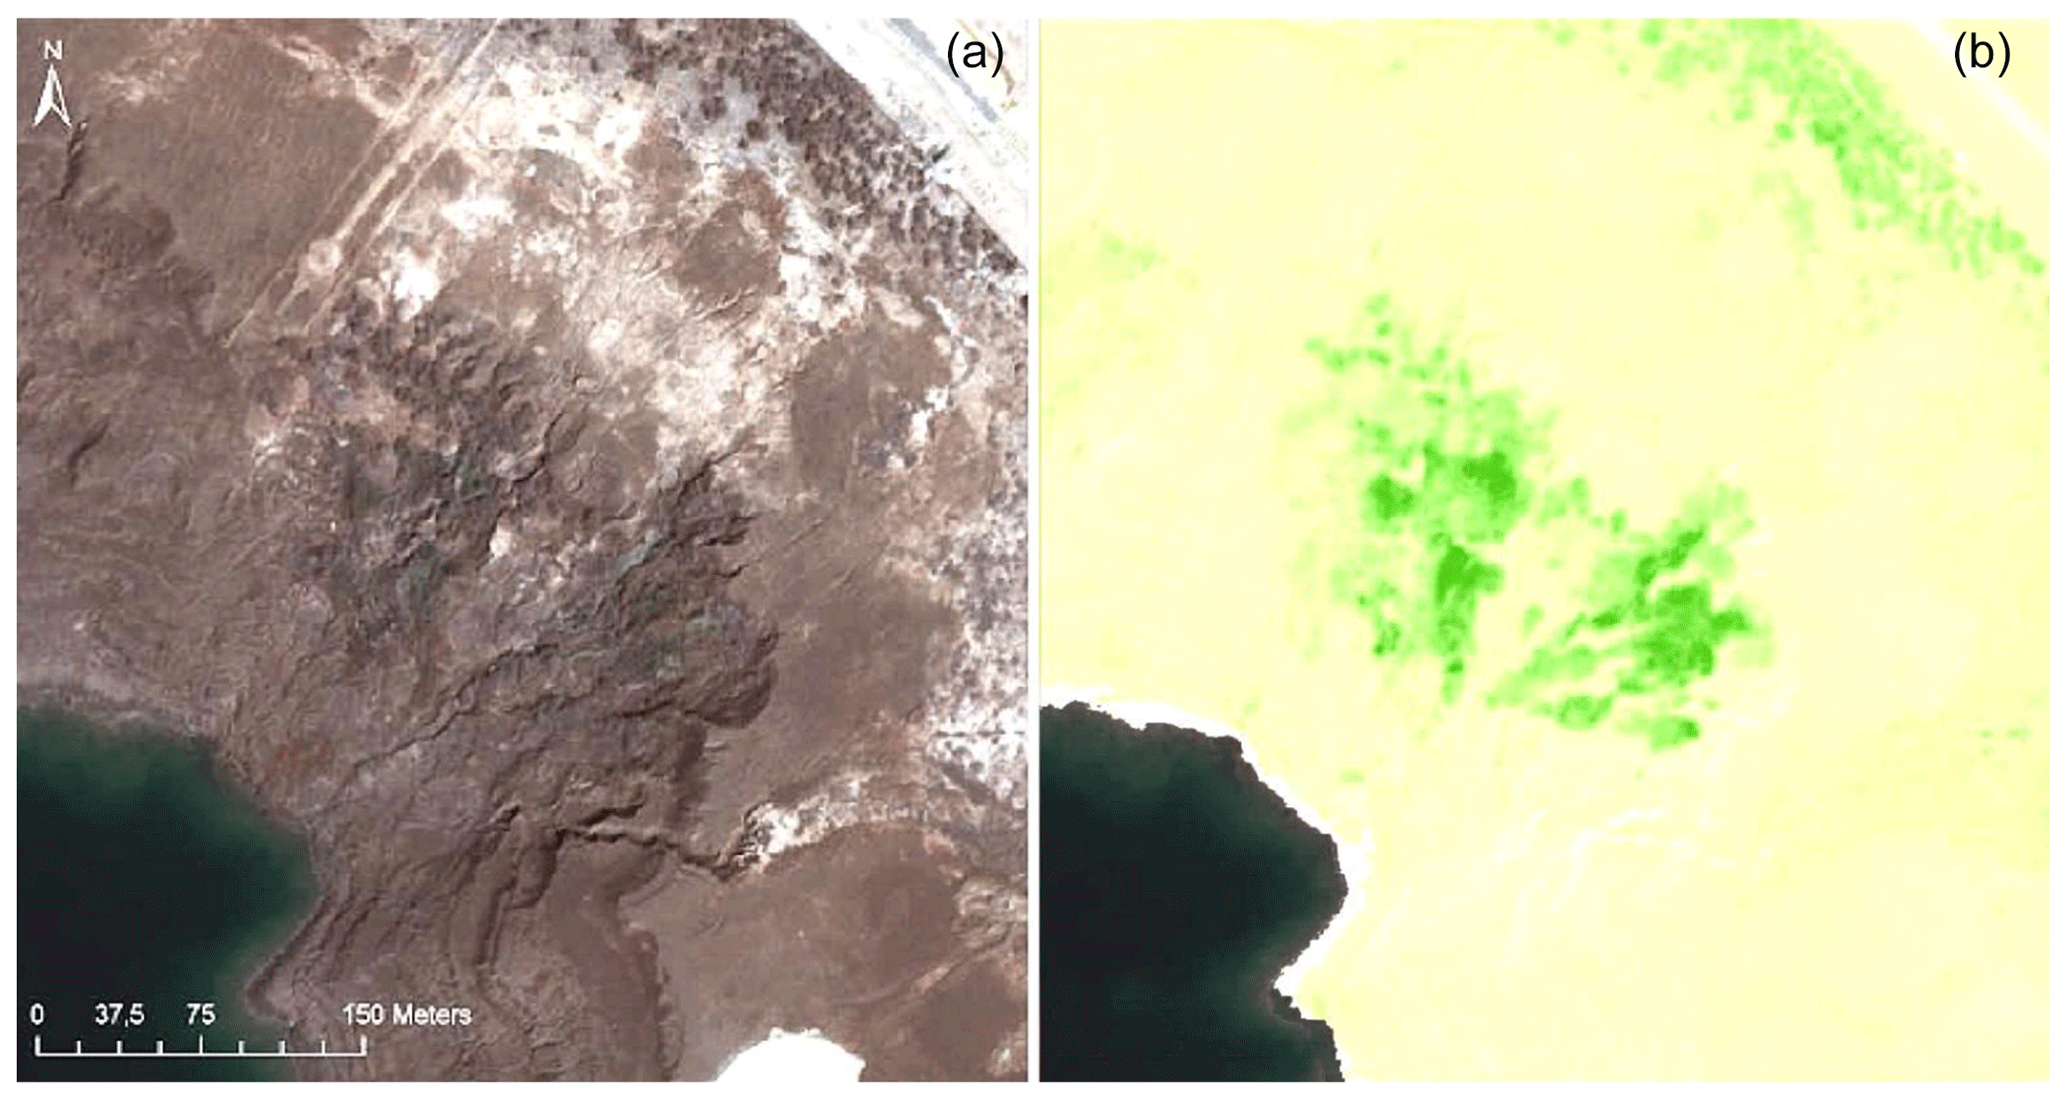
Figure 6Comparison between optical and NDVI images over a landslide area. (a) Optical image (RGB) showing a seepage area. The muddy sediments impregnated with water and salt (white patches) flowed towards the lake and created an amphitheatre. (b) Evidence of the vegetation (green) that develops only near the springs.
The springs are located at the intersection between the top of the water table and the ground surface. They are generally found several metres above the base level. This difference in elevation is proportional to the disequilibrium in the hydrogeological system. In the 1950s–1960s, the springs appeared more or less at the same level of the lake. Figure 7 shows the reclassified vegetation change values obtained from the difference between the 2010 and 2017 NDVI maps. The areas characterized by growth of vegetation are in green, while in red are the areas that show vegetation loss. On the 18 November 2018, a 120 m wide landslide occurred at the same elevation as four former landslides.
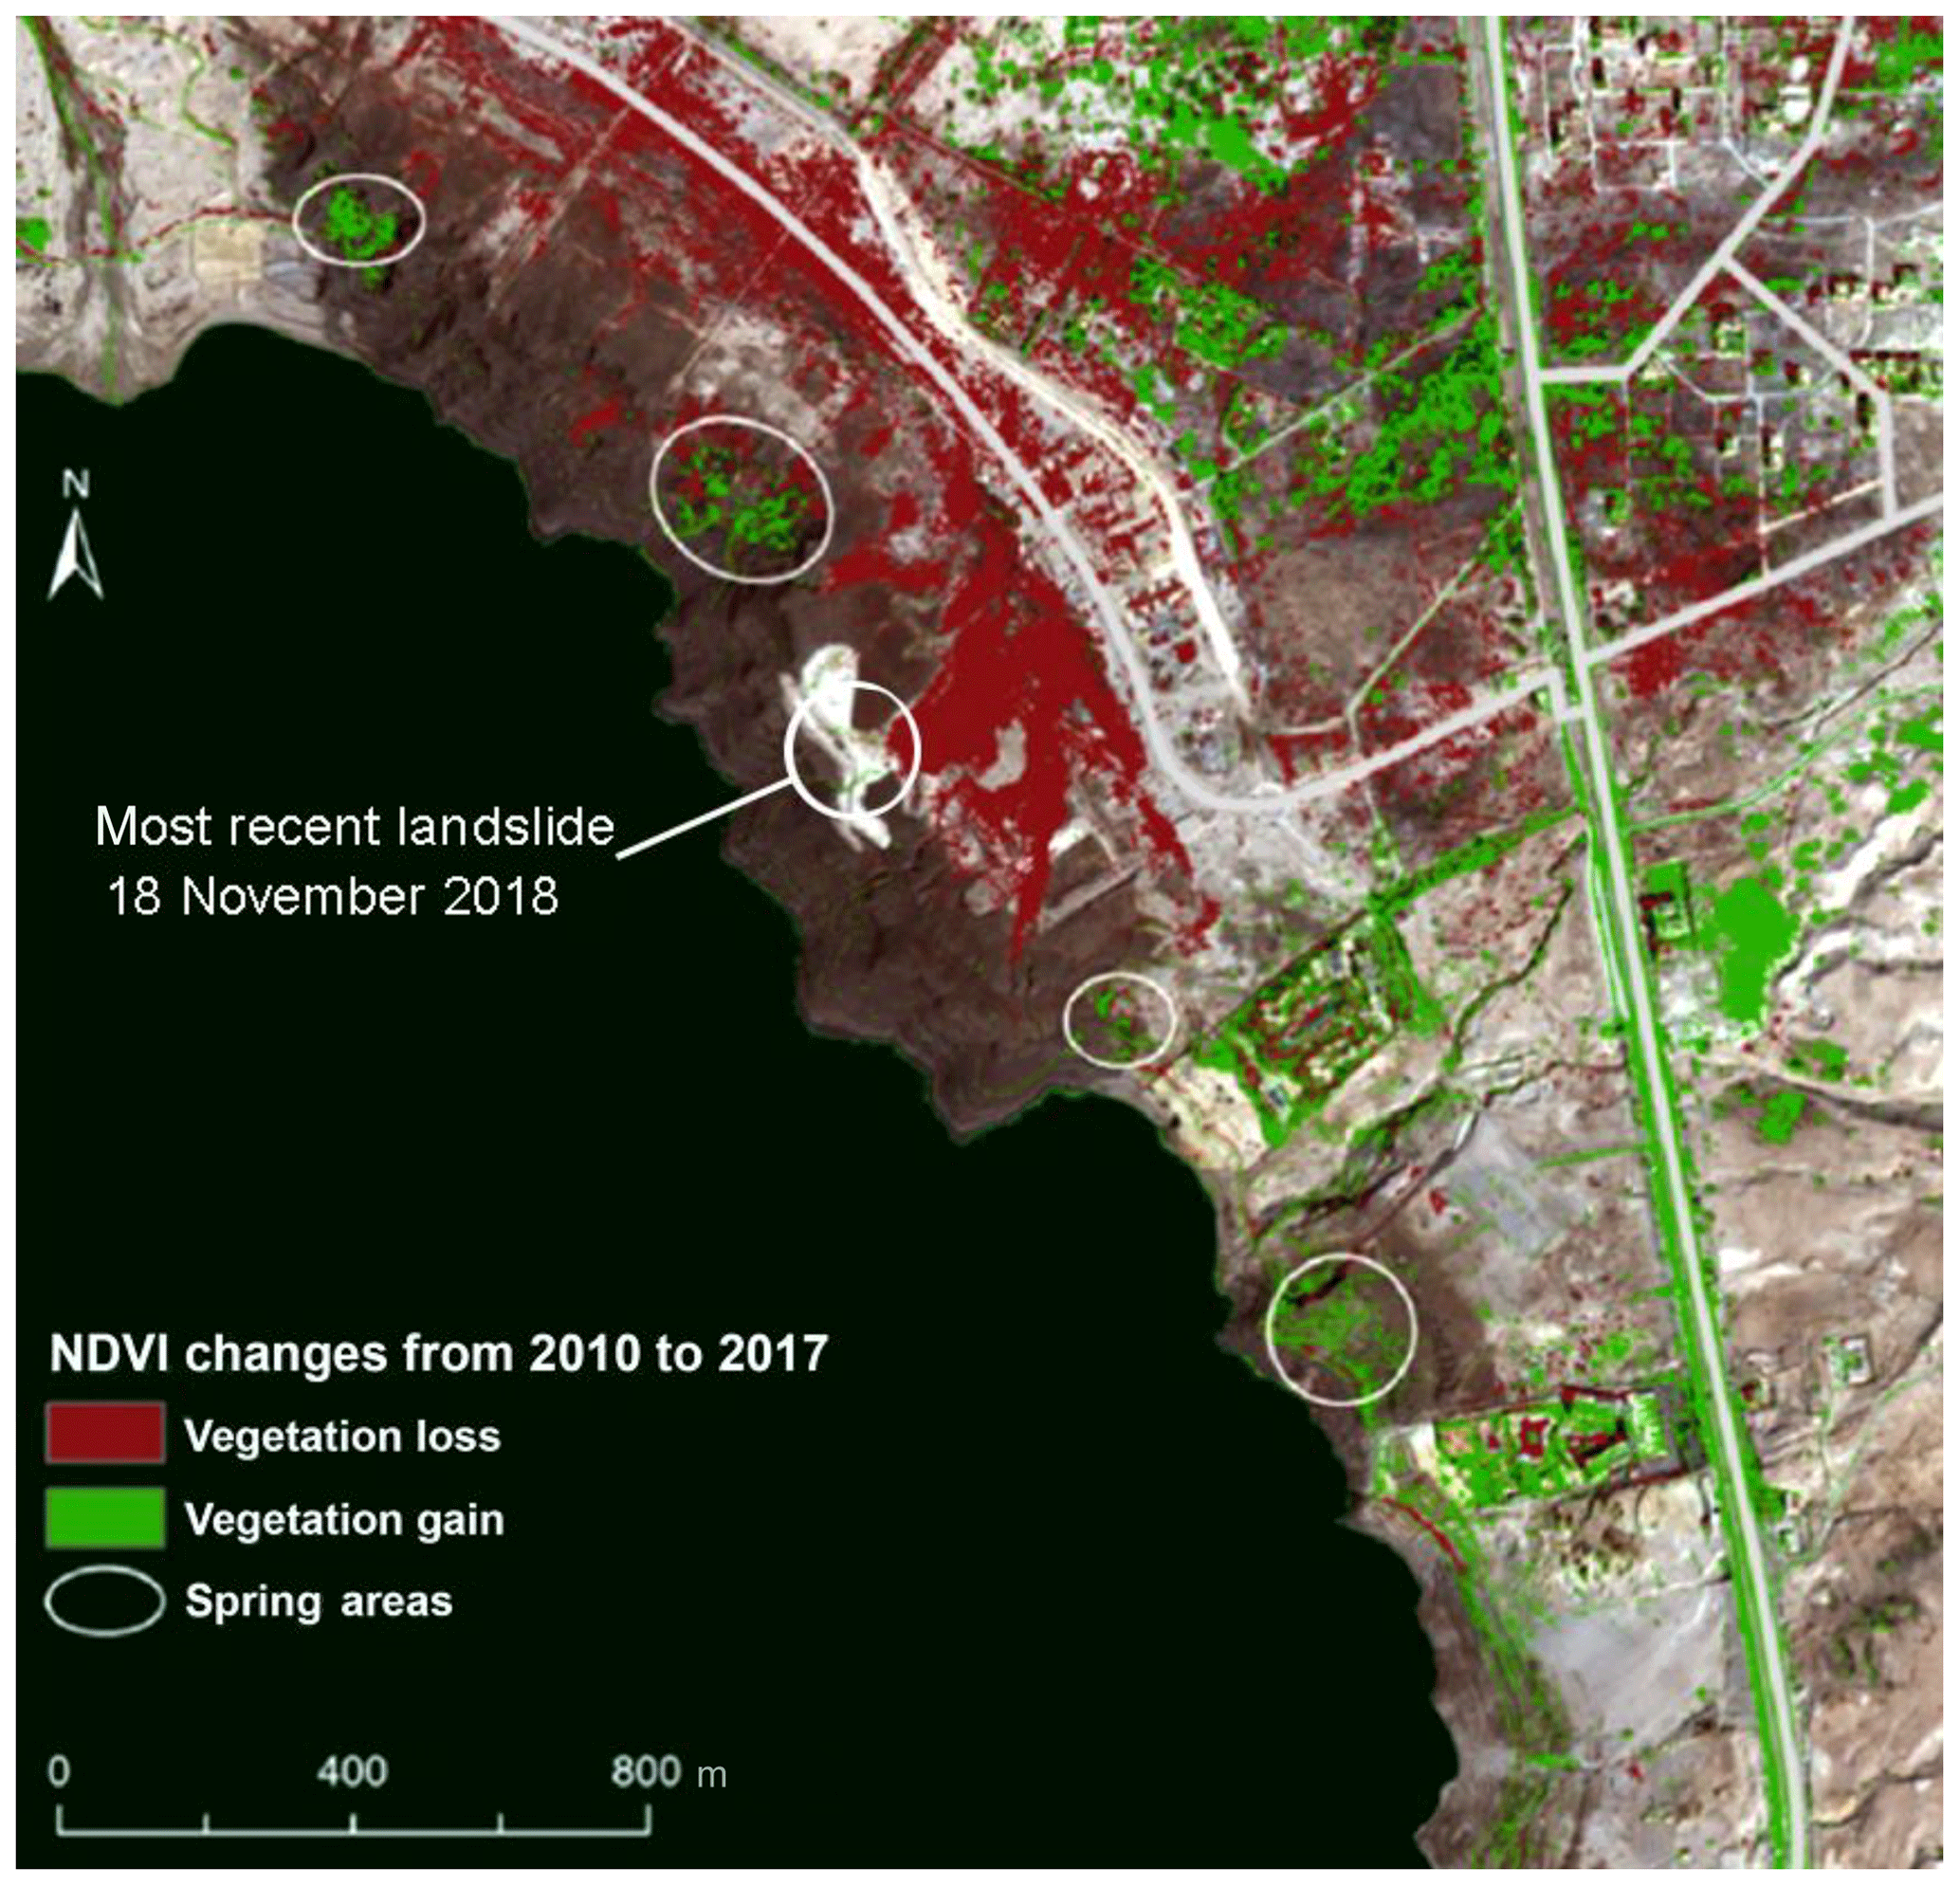
Figure 7Vegetation change detection map obtained from NDVI difference between 2010 and 2017 in the north-eastern part of the study area. The white circles highlight the areas along the coastline where new springs appeared in correspondence with vegetation increases.
The largest part of the vegetation loss can be attributed to the development of tourism infrastructure. The development of new vegetation comes from the presence of fresh or brackish water at or just below the surface. Four main zones with major vegetation development where mudslides occurred have been observed in the study area (Fig. 7, white circles). The emergence of springs at the beachfront of the hotels could represent a substantial hazard for the stability of the ground and the infrastructure (Fig. 8c). Since early 2016, we observed two distinct places where reeds have developed at the Holiday Inn beachfront (Fig. 8d). These areas have been fenced off by the security engineers, as sinkholes developed some metres upstream.
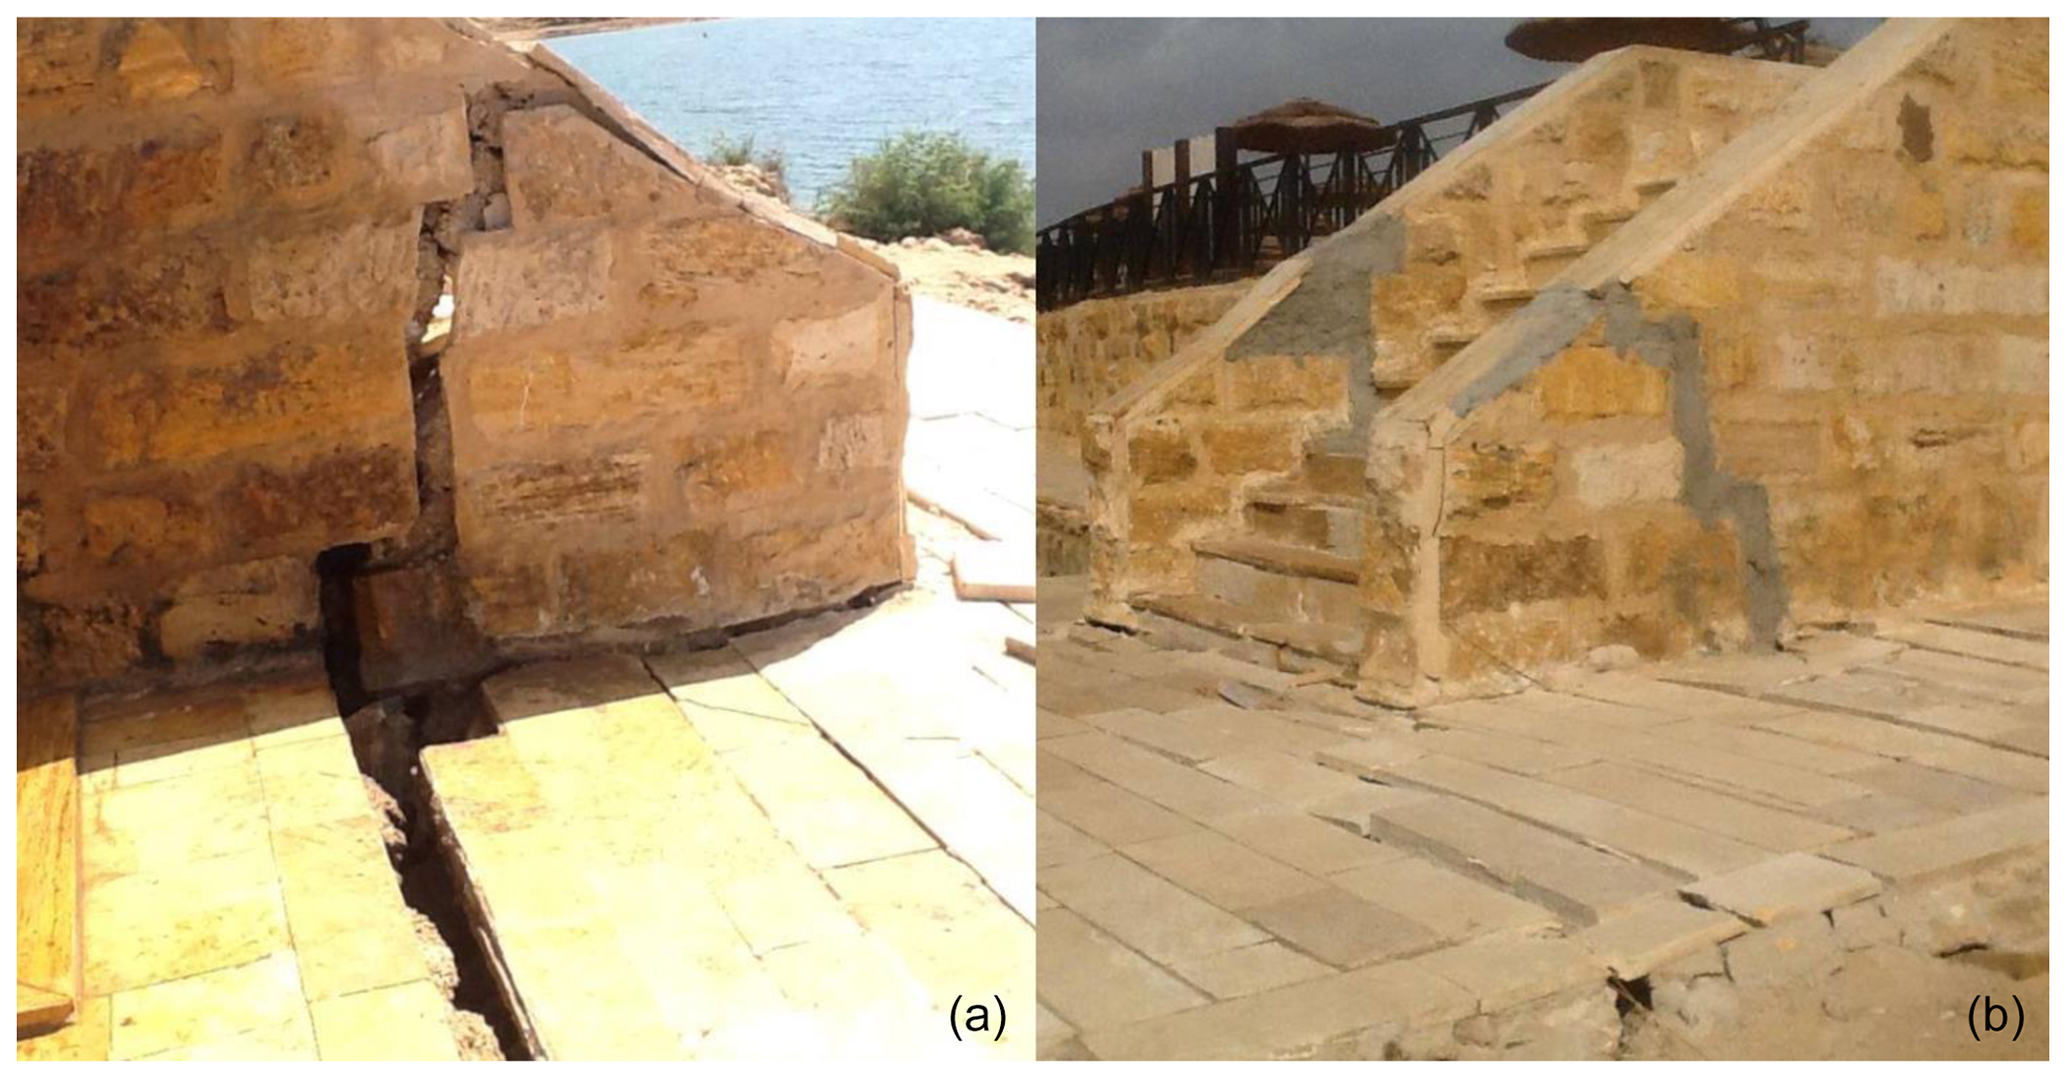
Figure 8Examples of damage (a) and of quick repair (b) that are common at the beachfront of the hotels along the DS coastline.
4.3 Field observations
During the last decade, regular field inspections were carried out approximately biannually to follow and monitor the deteriorations of the DS shore in Sweimeh. All areas show surface deformations reflecting the ongoing subsurface dissolution processes. Cracks occur very frequently on land, on walls, in swimming pools and in other man-made structures (Fig. 8). No effort was generally made by investors to investigate the causes of the damage or define a reasonable strategy to deal with the quite visible deteriorations. Instead, these were “repaired” hastily, inefficiently and superficially on a nearly daily basis. Land cracks are still being systematically filled with sand, while cracks affecting structures are being filled with concrete. Most of these cracks are likely to be associated with the subsidence occurring in the area, as measured with the SBAS analysis. Some of the monitored infrastructure are affected on two fronts (e.g. Fig. 9): the river incision that causes lateral slope displacement, and the emergence of springs in the beach areas that are connected to the development of ground collapses. Heavy engineering work is, in this case, needed to stabilize the river profile and to avoid the undermining of slopes during flash flood events. The strong effects of river incision on the stability of infrastructure are obvious, especially on bridges located hundreds of metres away from the DS shore (Fig. 10).
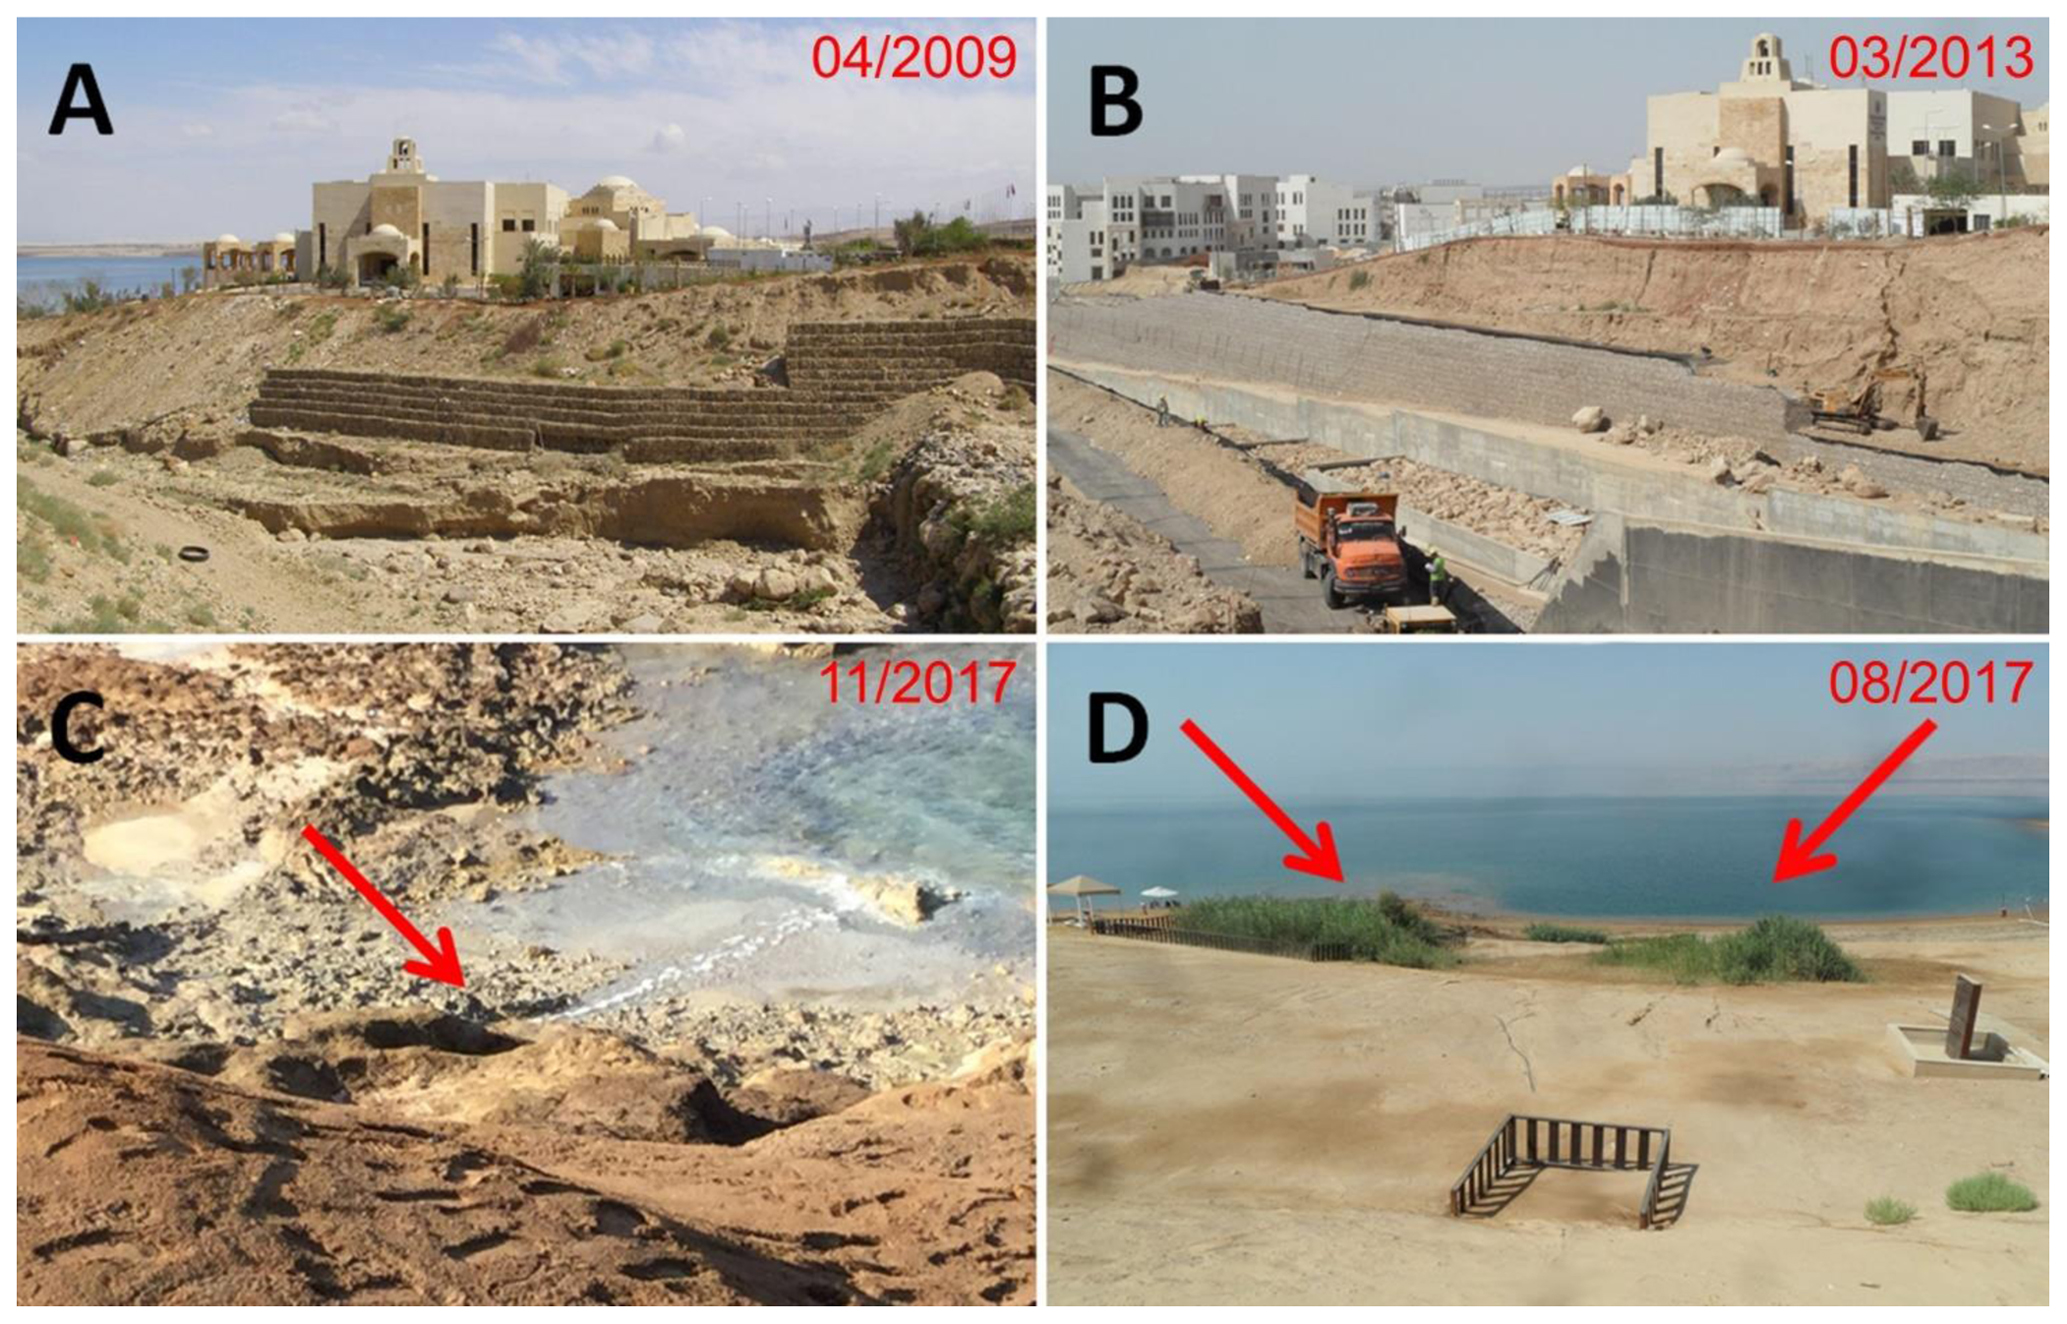
Figure 9The King Hussein bin Talal convention centre and surrounding areas. (a, b) The river next to the conference centre is entrenching at the same pace as the DS level lowering. Frequent works are needed to stabilize the slopes in the area. (c) Groundwater flowing under the convention centre. (d) When the flow path remains stable and the water is unsaturated with respect to salt, then vegetation can grow.
The King Hussein bin Talal convention centre, located between plots B and C (Fig. 4), is a three-storey building featuring 27 conference halls often used for winter World Economic and Scientific Forums, major exhibitions, conferences and meetings. The convention centre is capable of hosting up to several thousand participants at a time. The recent state of the centre and the repair works done in order to protect it are shown in Fig. 9a and b. Efforts seem to be focused on large-scale engineering measures designed to attenuate the erosion effects of flash floods on the slopes. However, field evidence on the shore front highlights the presence of water seepage, possibly coming from beneath the centre. In the medium term (years) and long term (decades), this water flow may increase the geological hazard of the area, which could be exposed to subsidence, sinkholes and landslides, as has already occurred in the near-coastal zones. As mentioned above, the presence of springs is one factor that may indicate the possible occurrence of ground instability. Figure 9d illustrates the growth of vegetation around such springs at the beachfront of the Holiday Inn. This area has been hit at least 3 times by hectometre-sized landslides, in September 1999, May 2009 and August 2012.
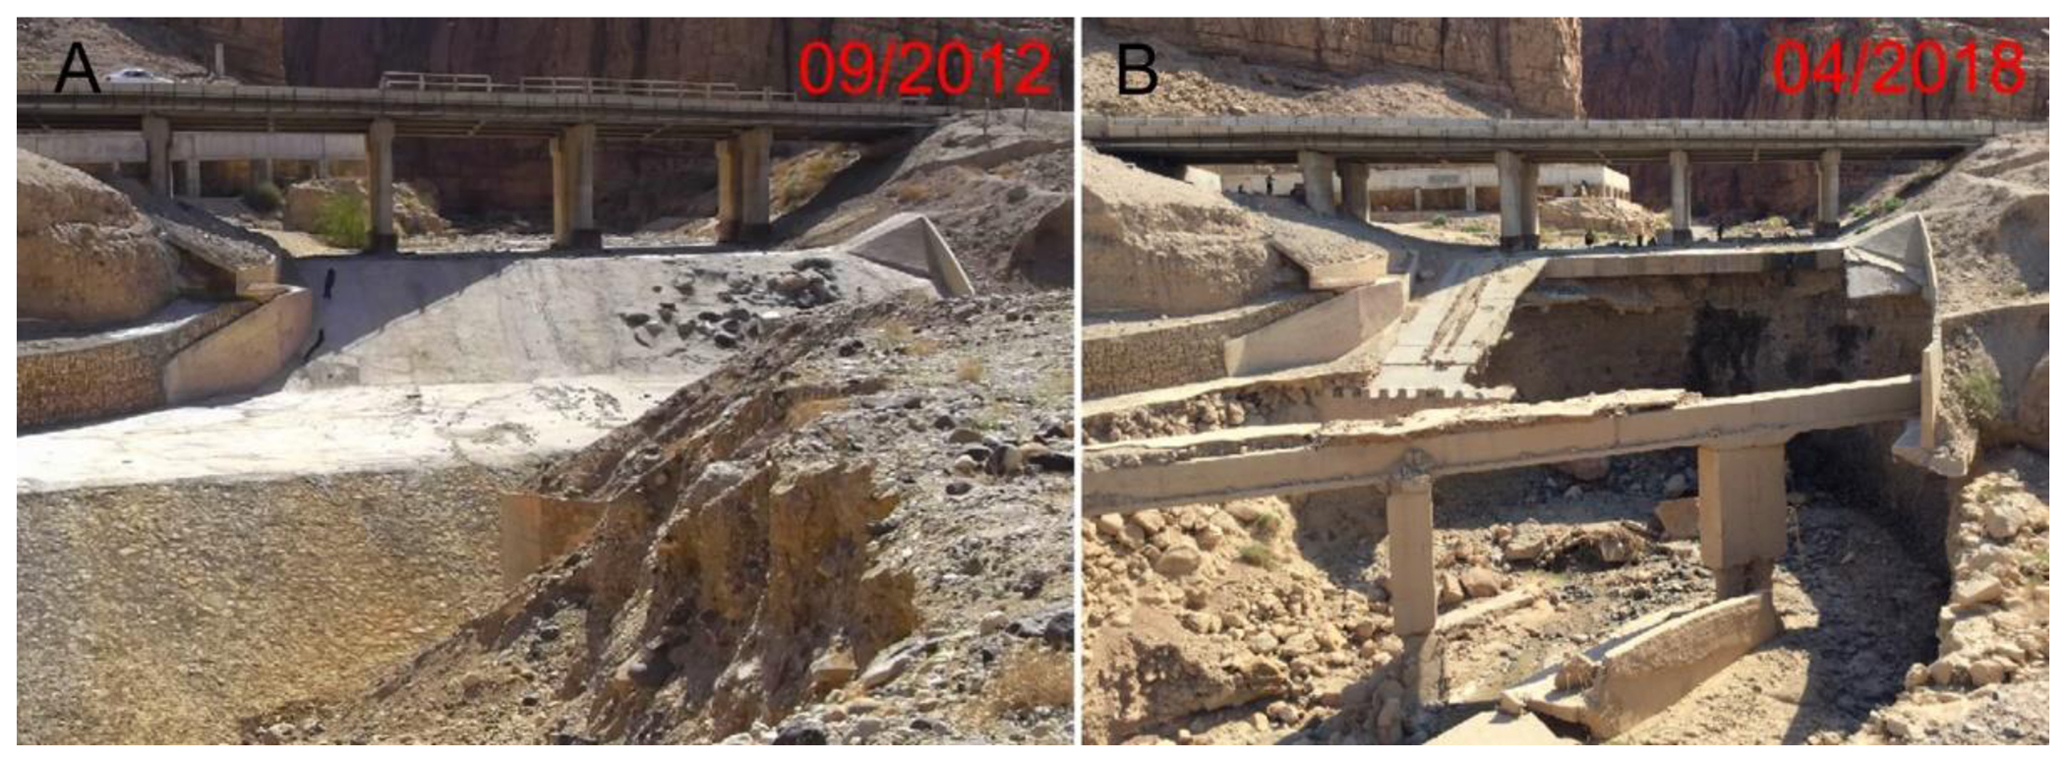
Figure 10Example of a bridge along the Dead Sea motorway damaged by progressive erosion of the sediments. All bridges along the Dead Sea coast are affected by the rapid incision of the river bed.
There are several major bridges on the DS highway, all suffering the effects of the DS water level decline, especially vertical erosion processes. In October 2017, one of these bridges located 3 km south of parcel E, was heavily damaged and lost one of its supporting pillars. Another bridge that suffered significant damage as a consequence of vertical soil erosion is the Zara–Ma'in Bridge, situated just a few kilometres south of the study area. Figure 10 shows the extent of the evolution of the damage affecting the western side of the Zara–Ma'in Bridge on the highway between 2012 (renovated bridge) and 2018. Most of the other bridges on the eastern DS highway also show advanced signs of deteriorations.

Figure 11Damage exposure map of five main hotels in the study area: (a) Holiday Inn, (b) Hilton, (c) Marriott, (d) Dead Sea Spa and (e) Crowne Plaza.
4.4 Exposure maps
Exposure maps were produced for the five main touristic infrastructure located along the DS coastline in Sweimeh (Fig. 11 – a: Holiday Inn; b: Hilton; c: Marriott; d: Dead Sea Spa; and e: Crown Plaza). The colour chart ranges from green to red, indicating increasing structural damage observed in each plot. In the Holiday Inn plot, during the 1960s, the shoreline was in the area now occupied by the main swimming pools. Therefore, most of the infrastructure developed over areas exposed in recent years, which are susceptible to geo-hazards. The beach area (Fig. 4a) has been affected by landslides and sinkholes since 1999. Because the beach is constantly worked on and repaired to offer tourists a pristine sandy beach, cracks are not clearly visible there. The red polygon corresponds to a landslide, while the orange one has fewer observable features. North-west of the orange zone, the beach is not affected by cosmetic work and fissures are apparent. Close to the shoreline, several springs of brackish water and areas covered by reeds are found. In the upstream part of the orange zone, the presence of sinkholes suggests groundwater circulation towards the springs. The part of the hotel next to the beach is marked by a large number of cracks in the pavements (yellow and orange polygons). Here the size of the cracks is smaller and their number lower with respect to the beach area. The main section of the hotel has no visible cracks, but the main entrance of the building is subsiding with significant damage to the walls (in green).
The Hilton plot (Fig. 11b) is affected by geo-hazards on two sides. The beach area, in red, is directly exposed to a landslide that has its crown upstream, in orange. Also in this case, the beach area is entirely covered with sand and regularly worked on. During field surveys, cracks related to strong subsidence were evident. North of the plot, cracks were much more visible and extended hundreds of metres northwards, parallel to the shore. In this area, it appears that the whole coastal zone is sliding. The obtained InSAR results confirmed these observations. The access road to the beach is located next to the landscaped Wadi Mukheris. This road shows important fissures that indirectly delineate the lack of stability of Wadi Mukheris' northern slope.
South of Wadi Mukheris, the Marriott plot (Fig. 11c) is strongly affected by recurrent landslides. The entire beach area is in red and/or orange, depending on the density and size of the damage. The red colour corresponds to active landslides, and the orange colour indicates areas where engineers managed to stabilize hazardous ground. The exposed zone corresponds to the steepest part of Wadi Mukheris delta that has emerged with the decline of the DS water level.
The area of the Dead Sea Spa in its entirety (Fig. 11d) presents a high number of fissures. The beach area shows numerous cracks and is affected by sinkholes. Different parts of the plot are sliding towards the DS at different rates. The presence of underwater circulation is demonstrated by ground displacements (subsidence and lateral movements), vegetation (reeds) and sinkholes.
The beach of the Crowne Plaza Hotel (Fig. 11e) presents many cracks and springs of brackish water. Walls separating terraced gardens outside the hotel are either fissured or partially collapsed. The south-east part of the plot is also affected by underground water circulation related to the Wadi ad Dardur delta. Repeated field investigations suggest that although the river bed has been diverted southwards, groundwater circulation follows the direction prior to its diversion.
Before the 1960s, the DS water level had remained relatively stable for decades, at ∼395 m b.m.s.l. It fluctuated by approximately 2 m per year due to rainfall variations in the watershed. On average, the lake body and the surrounding aquifers were in equilibrium. When the DS level started to decline, the groundwater level adapted accordingly, leading to an increase in groundwater discharge. With the movement of the groundwater interface, sediments rich in halite began to dissolve, leaving voids that iteratively increased until they became unstable. Because the northern DS is generally a muddy area, the ground gradually sinks, causing structural deformations. The ground deformations (subsidence) occurring all along the coastline can be explained because of the lateral shift of the interface between the DS brine and fresh water. Investigations carried out in the southern DS in relation to the collapse of APC “dike 19”, have suggested that subsidence may be the result of chemical erosion, while landslides and sinkholes may be the results of mechanical erosion produced by groundwater flows (Abou Karaki et al., 2016).
The results obtained from the SBAS analysis of the S1-A/B SAR images (Fig. 4) show rates and spatial distribution of the mean ground deformations along the north-eastern DS coastline from 2015 to 2017. The ground subsidence detected extends well beyond the coastline of the 1960s. We interpreted this outgrowth as a repercussion of the continuous decline of the DS level over the groundwater discharge several kilometres inland. This landward extension of subsidence could be a result of a greater permeability of certain zones characterized by an increased density of fractures. This zone co-occurs with the Amman–Hallabat Structure, in which frequent fractures have been observed (Al-Awabdeh, 2015). The magnitude of ground deformations decreases as the distance from the shoreline increases. The zone along the shoreline is the most affected, and the highest intensity is generally found where the water table intersects with the ground surface. This intersection zone materializes with the presence of vegetation, major ground failures, sinkholes and landslides. This assertion is based on both repeated field surveys carried out in the hotel area of Sweimeh over two decades, and on interpretation of optical satellites imagery. For example, the first landslide occurred in the Holiday Inn area in September 1999. Two others occurred in May 2009 and in August 2012. What is interesting about this series of landslides is the time of year in which they occurred. If we were to consider rainfall the main triggering mechanism of these landslides, we would expect to see landslides with more frequency during the wet season and with less frequency during the dry season. However, here, the origin of such instabilities could be the lateral injection of fresh water into soft sediments on a slope balance profile created under the DS level. One hypothesis is that the injection is favoured by the drop in the DS level that usually occurs during the dry period (see Fig. 3b of Sirona et al., 2016).
The DS area is one of three poles of major tourism development projects in Jordan; these also include Amman, the capital and the southern port of Aqaba at the northern tip of the Red Sea. The amount of new investment in the DS and Aqaba areas was estimated to be about USD 22.6 billion. By the year 2022, the tourism industry is expected to generate USD 8.6 billion to the national economy (Ennab, 2017, 2018). Studies of the technical decision-making process for land use and land planning in Jordan have highlighted weaknesses in the general framework in which industrial projects originate, are designed and are realized (Abou Karaki et al., 2016). Four categories of stakeholders can be distinguished. (i) Funding providers and developers of industrial projects who want a rapid return on their investments, especially in areas of potential multivariable conflicts. Environmental constraints are often considered a secondary issue and very seldom properly taken into account. (ii) Engineers, architects and planners who are generally working on a range of global projects and are in charge of project design. This latter group's knowledge of the environmental setting of any remote local project in particular is generally poor, or at best based on a limited data set centred over the parcels in question. These data tend to minimize geomorphologic constraints. The real geomorphological conditions of an area are thus often neglected or reshaped without taking into account the dynamic nature of ongoing deformations. (iii) Companies qualified to construct infrastructure, which are a mixture of local and international enterprises. In general, local workers are more informed about environmental issues in their work areas. However, their main objective is to realize a project, not to plan or question it, even if they have any opinion to express. (iv) Security engineers in charge of preserving projects after completion, who are locals fully aware of the environmental degradation processes, although they lack a synoptic view and sound understanding of the underlying geomorphological mechanism.
Security engineers in charge of five parcels were consulted regarding the inspection of their area of interest. They provided a large amount of relevant data regarding the intensity and frequency of the repair works done. Their knowledge, complemented by our own data collection (field observations guided by InSAR deformation maps), has been summarized in the produced exposure maps. In late 2017, to turn those maps into operational documents, several meetings and workshops were held in Amman, Jordan, with the participation of the primary governmental and private stakeholders.
In November 2017, an extended special session of the World Science Forum 2017 devoted to DS environmental issues was held at the King Hussein Convention Centre in Sweimeh. It was the first scientific forum to be held in the area affected by these phenomena and deformations. These exchanges and discussions highlighted the absence of appropriate awareness about ongoing karst development (Abou Karaki et al., 2017).
Currently there is essentially no strategy in the “Dead Sea Master Plan” to manage the geological hazards resulting from the decline in DS water levels in relation to tourism development. The lessons learned from these meetings and discussions are as follows: all business related to major touristic infrastructure in karst environment (i.e. hotels, roads, dams, etc.) depends on decisions made by the national tourism authorities, land planners, architects, civil engineers and private investors; the very nature of these decisions is affected by the quality, the completeness and the immediacy of the information available to decision makers. Access to the information needed for the decision-making process is strongly influenced by how business knowledge is managed. The ability to leverage expert knowledge, especially in matters of the environment, is a critical yet significantly underutilized asset. Explicit knowledge, codified into repositories, is more easily accessed but still requires a level of interpretation.
From the field surveys carried out in the study area, we observed that most of the damage to structures was repaired soon after it appeared. However, the repair and remediation work was carried out without any consideration or knowledge of the underlying causes of the damage, and without thought to what might happen in the near future (re-occurrence of the damage) or on the adjacent parcels (extension of the damage). In the framework of large infrastructure planning and construction, it is necessary to consider the geological and geomorphological factors that shape and modify the territory in order to avoid or reduce damage and economic losses. Most of the accidents involving the heavy damage or destruction of man-made structures are related to inadequate knowledge of the geotechnical conditions under which the construction took place, and to the absence of a monitoring system capable of apprehending ground deformations such as collapses, subsidence and landslides. For a given project, the principle “observe–plan–do–check–adjust” should be applied each time a new stakeholder is involved. Based on the habits of the new generation of stakeholders, each project should ideally have traceability for the common good and enable stakeholders to learn from failures.
In the karst terrain more than elsewhere, every project should have a platform on which different stakeholders can communicate and share relevant information in complete transparency. The implementation of indices like the Karst Disturbance Index and Karst Sustainability Index (Van Beynen and Townsend, 2005; North et al., 2009; Van Beynen et al., 2012; Mazzei and Parise, 2018), specifically developed for karst, will represent an important step in accurately defining problems related to this fragile environment, and developing proper land use planning and management techniques.
In this work, we presented results obtained from the integration of several different data sets over the Sweimeh area (eastern DS shore). Thanks to this approach, we were able to map the subsidence occurring along the Dead Sea shoreline and quantify the hazard exposure of five main tourism infrastructure. The results obtained from the analysis of S1-A/B SAR images with the SBAS approach revealed subsidence rates of up to −130 mm per year. In particular, infrastructure built on lands that have emerged in the last 40 to 50 years are both the most affected by subsidence and the most exposed to sinkhole and landslide phenomena. The monitoring of natural vegetation growth permitted locating the water sources along the coastline and deducing the presence of groundwater flowing close to or beneath the hotels. This information is important for predicting the occurrence of potential ground failures and for underlining the most vulnerable areas.
The importance of this work is evident in a series of catastrophic events that occurred near the DS in 2018: a Jordanian teenager died after falling into a sinkhole in Ghor Al-Haditha, south-eastern DS, Jordan. Some months later, south of Sweimeh, a single flash flood event killed a group of 21 children and their teachers. A bridge collapsed during the same flash flood event. On 18 November 2018, a landslide 120 m wide destroyed a recreation area close to the Holiday Inn.
This sequence of events underlines the necessity of considering the study of geological hazards related to the DS level decline a priority for sustainable development in the area. Appropriate measures for risk mitigation should also be taken to avoid further lethal incidents. This is especially true in the Sweimeh area, where the population exposed to these hazards is higher than other places along the DS shore. The mapping of exposure areas at the cadastral parcel level presented in this study is the very first step towards the computation of vulnerability and risk, and eventually towards the development of an early warning system. The exposure maps are a combination of information coming from different sources such as optical and radar data, direct field observations (structural geology), and interviews with security engineers and hotel managers. The approach presented in this paper is pragmatic but efficient, and its robustness mainly relies on multi-source and multi-temporal analysis.
Human activities have left signatures on the Earth for millennia, and the magnitude of this fingerprint is currently growing, with clear impacts upon morphology, ecosystems and climate. It is now widely accepted that the world is changing quickly and at a pace that could become a serious issue for business development. The tourism sector could be negatively impacted in the near future as well. Geological hazards in karst areas have been feared by engineers since the 19th century (Milanovic, 2000, 2002; Stevanovic, 2015; Parise et al., 2015, 2018 and references therein). In the next few decades a sharp increase in karst geo-hazards is expected due to the increasing scarcity of global water resources, leading to the decline of water tables, and consequently the proliferation of subsidence areas, sinkholes and related phenomena. To avoid exposure of people and assets to these hazards, land planners and investors need an overview of the environmental situation. Presently, recognition and analysis of environmental changes is a considerable challenge for sustainable development and for the profitability of major tourism projects.
A full set of data is available upon request to the authors. Landsat imagery and the SRTM DEM are freely available from USGS Earth Explorer online archive. Sentinel images (both optical and radar) are freely available from ESA's Open Access Hub.
NAK, DCL and MAA carried out the field surveys from 2004 to 2019. DCL and SF led the preparation of the paper. SF, KP and DCL undertook the data analysis and prepared the figures. The SAR imagery processing was carried out by SF and DCL. SF, DCL and NAK reviewed and commented on the paper. The financial contribution comes from NAK.
The authors declare that they have no conflict of interest.
This article is part of the special issue “Environmental changes and hazards in the Dead Sea region (NHESS/ACP/HESS/SE inter-journal SI)”. It is not associated with a conference.
Part of Najib Abou Karaki's contribution was done during two sabbatical years supported by the Deanship of scientific research – The University of Jordan. Two field works have been performed in the frame of the European Space Agency (ESA) contract no. 4000120391/17/NL/US. EU Copernicus services provided Sentinel data. The authors thank Simone Popperl for revising the English of an earlier version of the paper.
This paper was edited by Christian Siebert and reviewed by Mario Parise and two anonymous referees.
Abelson, M., Baer, G., Shtivelman, V., Wachs, D., Raz, E., Crouvi, O., Kurzon, I., and Yechieli, Y.: Collapse-sinkholes and radar interferometry reveal neotectonics concealed within the Dead Sea basin, Geophys. Res. Lett., 30, 1545, https://doi.org/10.1029/2003GL017103, 2003.
Abelson, M., Yechieli, Y., Crouvi, O., Baer, G., Wachs, D., Bein, A., and Shtivelman, V.: Evolution of the DS sinkholes, in: New frontiers in Dead Sea paleo environmental research, edited by: Enzel, Y., Agnon, A., and Stein, M., Geological Society of America Special Paper, 241–253, https://doi.org/10.1130/2006.2401(16), 2006.
Abelson, M., Yechieli, Y., Baer, G., Lapid, G., Behar, N., Calvo, R., and Rosensaft, M.: Natural versus human control on subsurface salt dissolution and development of thousands of sinkholes along the Dead Sea coast, J. Geophys. Res.-Earth, 122, 1262–1277, https://doi.org/10.1002/2017JF004219, 2017.
Abou Karaki, N.: Synthèse et carte sismotectonique des pays de la bordure orientale de la Méditerranée: Sismicité du system de failles du Jourdain – Mer Morte, PhD thesis, Université Louis Pasteur de Strasbourg, Institut de Physique du Globe, IPGS, France, 417 pp., 1987.
Abou Karaki, N., Dorbath, L., and Haessler, H.: La Crise sismique du golfe d'Aqaba de 1983: Implications tectoniques, Comptes Rendus de l'Académie des Sciences de Paris, 317, 1411–1416, 1993.
Abou Karaki, N. and Closson D. (Eds.): Workshop on Dead Sea Sinkholes, causes, effects & solutions, Field Guidebook, European Association of Geoscientists & Engineers publication, 2012.
Abou Karaki, N., Fiaschi, S., and Closson, D.: Sustainable development and Anthropogenic induced geomorphic hazards in subsiding areas, Earth Surf. Proc. Land., 41, 2282–2295, https://doi.org/10.1002/esp.4047, 2016.
Abou Karaki, N., Closson, D., Fiaschi, S., Calve P. J., Al-Awabdeh, M., and Paenen, K.: Can Science save the Dead Sea? World Science Forum Conference, King Hussein Bin Talal Convention Centre, Dead Sea, Jordan, 7–11 November 2017, 2017.
Al-Awabdeh, M.: Active tectonics of the Amman-Hallabat and Shueib structures (NW of Jordan) and their implication in the Quaternary evolution of the Dead Sea Transform Fault system, PhD thesis, University of Grenada, Spain, 207 pp., 2015.
Al-Awabdeh, M., Azañón, J., and Pérez-Peña, J.: Recent tectonic activity in the intersection between the Amman-Hallabat structure and the Dead Sea Transform Fault (Jordan), Geotemas, 12, 469–472, 2012.
Al-Awabdeh, M., Perez-Pena, J. V., Azanon, J. M., Booth-Rea, G., Abed, A., Atallah, M., and Galve, J.P.: Quaternary tectonic activity in NW Jordan: Insights for a new model of transpression – transtension along the southern Dead Sea Transform Fault, Tectonophysics, 693, 465–473, https://doi.org/10.1016/j.tecto.2016.04.018, 2016a.
Al-Awabdeh, M., Perez-Pena, J. V., Azanon, J. M., Booth-Rea, G., Abed, A., Atallah, M., and Galve, J. P.: Stress analysis of NW Jordan: New episode of tectonic rejuvenation related to the Dead Sea transform fault, Arab. J. Geosci., 9, 264, https://doi.org/10.1007/s12517-015-2239-z, 2016b.
Al-Halbouni, D., Holohan, E. P., Saberia, L., Alrshdan, H., Sawarieh, A., Closson, D., Waltera, T. R., and Dahm, T.: Sinkholes, subsidence and subrosion on the eastern shore of the Dead Sea as revealed by a close-range photogrammetric survey, Geomorphology, 285, 305–324, https://doi.org/10.1016/j.geomorph.2017.02.006, 2017.
Arkin, Y. and Gilat, A.: Dead Sea sinkholes – an ever-developing hazard, Environ. Geol., 39, 711–722, https://doi.org/10.1007/s002540050485, 2000.
Bandel, K. and Abu Hamad, A. M. B.: Permian and Triassic Strata of Jordan, in: The Triassic System, edited by: Anner, L. H., Spielmann, J. A., and Lucas, S. G., New Mexico Museum of Natural History and Science, 61, 31–41, 2013.
Berardino, P., Fornaro, G., Lanari, R., and Sansosti, E.: A new algorithm for surface deformation monitoring based on small baseline differential interferograms, IEEE T. Geosci. Remote, 40, 112375–2383, https://doi.org/10.1109/TGRS.2002.803792, 2002.
Bonnin, J., Cara, M., Cisternas, A., and Fantechi, A. (Eds.): Seismic Hazard in Mediterranean Regions, Springer Science & Business Media, ISBN 978-90-277-2779-4, 1988.
Closson, D., Abou Karaki, N., Hansen, H., Derauw, D., Barbier, C., and Ozer, A.: Space-borne radar interferometric mapping of precursory deformations of a dike collapse, Dead Sea area, Jordan, Int. J. Remote Sens., 24, 4, 843–849, https://doi.org/10.1080/01431160210147388, 2003.
Closson, D. and Abou Karaki, N.: Salt karst and tectonics: sinkholes development along tension cracks between parallel strike-slip faults, Dead Sea, Jordan, Earth Surf. Proc. Land., 34, 10, 1408–1421, https://doi.org/10.1002/esp.1829, 2009.
Closson, D., Abou Karaki, N., and Hallot, F.: Landslides along the Jordanian Dead Sea coast triggered by the lake level lowering, Environ. Earth Sci., 59, 1417–1430, https://doi.org/10.1007/s12665-009-0128-z, 2010.
Cooper, A. H.: The classification, recording, data basing and use of information about building damage caused by subsidence and landslides, Q. J. Eng. Geol. Hydroge., 41, 409–424, https://doi.org/10.1144/1470-9236/07-223, 2008.
Diabat, A. A.: Structural and stress analysis based on fault-slip data in the Amman area, Jordan, J. Afr. Earth Sci., 54, 155–162, https://doi.org/10.1016/j.jafrearsci.2009.03.011, 2009.
El-Isa, Z. H., Rimawi, O., Jarrar, G., Abou Karaki, N., Atallah, M., Seifed-din, N., Taqieddin, S., and Al-Saed, A.: Assessment of the hazard of subsidence and sinkholes in Ghor Al-Haditha area, Final Report, Center for Consultation, Technical Services and Studies, University of Jordan, 141 pp., 1995.
Ennab, L. (Jordanian Ministry of Tourism): available at: http://www.ammonnews.net/article/3311458, last access: 25 April 2017.
Ennab, L. (Jordanian Ministry of Tourism): available at: http://www.ammonnews.net/article/384012, last access: 11 July 2018.
Ezersky, M. and Frumkin, A.: Fault-Dissolution front relations and the Dead Sea sinkhole problem, Geomorphology, 201, 35–44, https://doi.org/10.1016/j.geomorph.2013.06.002, 2013.
Ezersky, M., Legchenko, A., Eppelbaum, L., and Al-Zoubi, A.: Overview of the geophysical studies in the Dead Sea coastal area related to evaporite karst and recent sinkhole development, Int. J. Speleol., 46, 277–302, https://doi.org/10.5038/1827-806X.46.2.2087, 2017.
Fiaschi, S., Closson, D., Abou Karaki, N., Pasquali, P., Riccardi, P., and Floris, M.: The complex karst dynamics of the Lisan Peninsula revealed by 25 years of DInSAR observations, Dead Sea, Jordan, ISPRS J. Photogramm., 130, 358–369, https://doi.org/10.1016/j.isprsjprs.2017.06.008, 2017.
Galli, P.: Active tectonics along the Wadi Araba – Jordan valley transform fault, J. Geophys. Res., 104, 2777–2796, 1999.
Garfunkel, Z., Zak, I., and Freund, R.: Active faulting in the Dead Sea rift, Tectonophysics, 80, 1–26, https://doi.org/10.1016/0040-1951(81)90139-6, 1981.
Goode, D. J., Senior, L. A., Subah, A., and Jaber, A.: Groundwater-level trends and forecasts, and salinity trends, in the Azraq, Dead Sea, Hammad, Jordan Side Valleys, Yarmouk, and Zarqa groundwater basins, Jordan, U.S. Geological Survey Open-File Report 2013–1061, 80 pp., https://doi.org/10.3133/ofr20131061, 2013.
Goode, J. R., Buffington, J. B., Tonina, D., Isaak, D. I., Thurow, R. F., Wenger, S., Nagel, D., Luce, C., Tetzlaff, D., and Soulsby, C.: Potential effects of climate change on streambed scour and risks to salmonid survival in snow-dominated mountain basins, Hydrol. Process., 27, 750–765, https://doi.org/10.1002/hyp.9728, 2013.
Klinger, Y., Le Beon, M., and Al-Qaryouti, M.: 5000 yr of paleoseismicity along the southern Dead Sea fault, Geophys. J. Int., 202, 313–327, https://doi.org/10.1093/gji/ggv134, 2015.
Landmann, G., Abu Qudaira, G. M., Shawabkeh, K., Wrede, V., and Kempe, S.: Geochemistry of the Lisan and Damya Formations in Jordan, and implications for paleoclimate, Quatern. Int., 89, 45–57, https://doi.org/10.1016/S1040-6182(01)00080-5, 2002.
Martin, K. L., Hodgen, P. J., Freeman, K. W., Melchiori, R., Arnall, D. B., Teal, R. K., Mullen, R. W., Desta, K., Phillips, S. B., Solie, J. B., Stone, M. L., Caviglia, O., Solari, F., Bianchini, A., Francis, D. I., Schepers, J. S., Hatfield, J., and Raun, W. R.: Plant-to-plant variability in corn production, Agron. J., 97, 1603–1611, 2005.
Mazzei, M. and Parise, M.: On the implementation of environmental indices in karst, in: Karst Groundwater Contamination and Public Health, edited by: White, W. B., Herman, J. S., Herman, E. K., and Rutigliano, M., Advances in Karst Science, Springer, 245–247, ISBN 978-3-319-51069-9, 2018.
Milanovic, P. T. (Ed.): Geological engineering in karst, Zebra, Belgrade, 2000.
Milanovic, P. T.: The environmental impacts of human activities and engineering constructions in karst regions, Episodes, 25, 13–21, 2002.
Natural Resources Authority (NRA): Jordan, Hashemite Kingdom: review of Spring Flow Data prior to October 1965, Technical Paper No. 40, Amman, 1966.
North, L. A., van Beynen, P. E., and Parise, M.: Interregional comparison of karst disturbance: West-central Florida and southeast Italy, J. Environ. Manage., 9, 1770–1781, https://doi.org/10.1016/j.jenvman.2008.11.018, 2009.
Parise, M., Closson, D., Gutierrez, F., and Stevanovic, Z.: Anticipating and managing engineering problems in the complex karst environment, Environ. Earth Sci., 74, 7823–7835, 2015.
Parise, M., Gabrovsek, F., Kaufmann, G., and Ravbar, N. (Eds.): Advances in Karst Research: Theory, Fieldwork and Applications, Geological Society, London, Special Publication 466, 486 pp., ISBN 978-1-78620-359-5, 2018.
Polom, U., Alrshdan, H., Al-Halbouni, D., Holohan, E. P., Dahm, T., Sawarieh, A., Atallah, M. Y., and Krawczyk, C. M.: Shear wave reflection seismic yields subsurface dissolution and subrosion patterns: application to the Ghor Al-Haditha sinkhole site, Dead Sea, Jordan, Solid Earth, 9, 1079–1098, https://doi.org/10.5194/se-9-1079-2018, 2018.
Salameh, E. and El-Naser, H.: The interface configuration of the fresh-/DS water – theory and measurement, Acta Hydroch. Hydrob., 28, 323–328, https://doi.org/10.1002/1521-401X(200012)28:6<323::AID-AHEH323>3.0.CO;2-1, 2000.
Salameh, E. and El-Naser, H.: Retreat of the Dead Sea and its effects on the surrounding groundwater resources and the stability of its coastal deposits. In: sustainable use of water resources along the lower Jordan River, edited by: Hoetzl, H., Karlsruhe, 2005.
Salameh, E. and El-Naser, H.: Restoring the shrinking Dead Sea 75 – the environmental imperative, in: Climatic changes and water resources in the Middle East and North Africa, edited by: Zereini, F. and Hoetzl, H., Springer Publishing Company, Heidelberg, 2008.
Salameh, E., Alraggad M., and Amaireh M.: Degradation processes along the new northeastern shores of the Dead Sea, Environ. Earth Sci., 78, 164, https://doi.org/10.1007/s12665-019-8155-x, 2019.
Shawabkeh, K. F.: The map of Main Area. Map Sheet No. 3153-IIII, Scale 1:50,000. National Resources Authority, Amman, Jordan, 1993.
Shawabkeh, K. F.: Geological map of Al Karama – 3153-IV, 1:50.000, Internal Report of Natural Resources Authority, Amman, Jordan, 2001.
Stevanovic, Z. (Ed.): Karst Aquifers – Characterization and Engineering. Professional Practice in Earth Science Series, Springer, ISBN 978-3-319-12850-4, 2015.
Tegler, B.: Terms of reference for the master plan development strategy in the Jordan Valley, United States Agency for International Development (USAID), 2007.
Van Beynen, P. E. and Townsend, K. M.: A disturbance index for karst environments, Environ. Manage., 36, 101–116, https://doi.org/10.1007/s00267-004-0265-9, 2005.
Van Beynen, P. E., Brinkmann, R., and van Beynen, K. A.: Sustainability index for karst environments, J. Cave Karst Stud., 74, 221–234, https://doi.org/10.4311/2011SS0217, 2012.
Verhulst, N. and Govaerts, B.: The Normalized Difference Vegetation Index (NDVI) GreenSeeker™ Handheld Sensor: Toward the Integrated Evaluation of Crop Management, Part A: Concepts and Case Studies, CIMMYT, Mexico D.F, 2010.
Yechieli, Y., Magaritz, M., Levy, Y., Weber, U., Kafri, U., Woelfli, W., and Bonani, G.: Late Quaternary geological history of the Dead Sea area, Israel, Quaternary Res., 39, 59–67, https://doi.org/10.1006/qres.1993.1007, 1993.