the Creative Commons Attribution 4.0 License.
the Creative Commons Attribution 4.0 License.
 | 24 Jan 2019
Application of environmental tracers for investigation of groundwater mean residence time and aquifer recharge in fault-influenced hydraulic drop alluvium aquifers
Bin Ma
Xing Liang
Jing Li
Investigating groundwater residence time and recharge sources is crucial for water resource management in the alluvium aquifers of arid basins. Environmental tracers (chlorofluorocarbons, 3H, 14C, δ2H, δ18O) and groundwater hydrochemical components are used for assessing groundwater mean residence times (MRTs) and aquifer recharge in fault-influenced hydraulic drop alluvium aquifers in the Manas River basin (China). Aquifers under the Manas River upstream (south of the fault) contains very high 3H activity (41.1–60 TU), implying water recharge affected by the nuclear bomb tests of the 1960s. Carbon-14 groundwater age correlates positively with distance from mountain area (3000–5000 years in the midstream to > 7000 years in the downstream) and groundwater depth, but correlates negatively to a decrease in 3H activity (1.1 TU) and more negative δ18O values. This phenomenon reveals that the source of the deeper groundwater in the semi-confined aquifer is paleo-meteoric recharge. Special attention has been paid to the estimation of MRTs using CFCs and 3H by an exponential piston flow model. The results show that MRTs vary from 19 to 101 years by CFCs and from 19 to 158 years by 3H. MRTs estimated from 3H are much longer than those from CFCs, probably due to the different time lag of liquid (3H) and gas-phase CFCs through the unsaturated zone. The MRTs estimated by CFCs show good correlations with pH and the concentrations of SiO2 and , which can provide a possible approach to estimate first-order proxies of MRTs for groundwater age. The young water fractions are investigated by the CFC binary mixing method in the south and north of the fault. Relatively modern recharge is found in the south of the fault with young (post-1940) water fractions of 87 %–100 %, whereas in the north of the fault the young water fractions vary from 12 % to 91 %. This study shows that the combination of CFCs and 3H residence time tracers can help in analysing the groundwater MRTs and the recharge sources for the different mixing end-members.


Groundwater is the largest available freshwater resource. It supplies freshwater to communities around the world, and it plays an essential role in energy and food security, human health, and ecosystem conservation (Gleeson et al., 2016). Investigating the residence time of groundwater (i.e. the period from recharge to drainage in pumping wells, springs, or streams) reveals information about water storage, mixing, and transport in subsurface water systems (Cartwright et al., 2017; Dreuzy and Ginn, 2016; McGuire and McDonnell, 2006). This is particularly important in alluvium aquifers where groundwater renewability is generally strong (Huang et al., 2017), thus functioning as potable water sources in arid areas. Moreover, alluvium aquifers are increasingly vulnerable to anthropogenic contaminants and land-use changes (Morgenstern and Daughney, 2012).
Because the residence time distribution in subsurface water systems cannot be empirically measured, a commonly used approach is parametric fitting of trial distributions to chemical concentrations (Suckow, 2014). The widely used lumped parameter models (Małoszewski and Zuber, 1982; Jurgens et al., 2012), which commonly assume that the hydrologic system is at a steady state, have been applied to subsurface water systems (Cartwright et al., 2018; McGuire et al., 2005; Morgenstern et al., 2015; Stewart et al., 2010). The groundwater residence time tracers can be classified into three types depending on the time span they measure. The first, isotopes of water (18O, 2H, 3H), are ideal tracers for determining mean residence times (MRTs) shorter than 5 years with stable isotopes (Kirchner et al., 2010; McGuire et al., 2005; Stewart et al., 2010) and up to approximately 100 years with 3H (Beyer et al., 2016; Cartwright and Morgenstern, 2015, 2016; Morgenstern et al., 2010). The second, the atmospheric concentrations of synthetic organic compounds (chlorofluorocarbons, CFC-11, CFC-12, and CFC-113, as well as sulfur hexafluoride, SF6), radioactive solute tracers such as 14C, 36Cl, and noble gases (4He, 85Kr, 39Ar, and 81Kr), are used to determine groundwater MRTs with much wider time spans (decades to millenniums; Aggarwal, 2013). The third, concentrations of major ions such as inert chloride (Cl), determine MRTs in a similar way to stable isotopes depending on the damping of seasonal variation input cycles that pass through a system into the output. MRTs determined through the seasonal tracer cycle method (e.g. stable isotope values or Cl concentrations), which requires detailed time series measurements such as weekly or more frequent time steps, may be more appropriate for water drainage through a catchment and discharging into a stream (Hrachowitz et al., 2009; Kirchner et al., 2010; McGuire et al., 2005). Nevertheless, a strong correlation of major ion concentrations with groundwater age enables hydrochemistry to be used as proxy for age or complementary to age via previously established relationships in closed lithological conditions (Beyer et al., 2016; Morgenstern et al., 2010, 2015).
The age of water can be determined through 3H, a component of the water molecule with a half-life of 12.32 years (Tadros et al., 2014). 3H activity in the Northern Hemisphere is several orders of magnitude higher than that in the Southern Hemisphere (Clark and Fritz, 1997; Tadros et al., 2014) due to the atmospheric thermonuclear tests in 1950s and 1960s, which resulted in mean annual 3H activity peaks reaching several hundred times that of natural levels. The present-day rainfall 3H activity in the Northern Hemisphere is still affected by the tail end of the bomb pulse, particularly in arid northwestern China due to both the continental effect (Tadros et al., 2014) and the Chinese atmospheric nuclear tests from 1964 to 1974. Thus, measurement of a single sample of 3H activity does not accurately assess the groundwater MRTs in the Northern Hemisphere (Cook et al., 2017), and time series of 3H measurements with lumped parameter models are required (Han et al., 2007, 2015).
In contrast to 3H, CFCs degrade slowly in the atmosphere and have longer degradation half-lives, which permit their uniform atmospheric distribution over large areas; however, there is 1–2 years lag for the Southern Hemisphere compared with the Northern Hemisphere (Cartwright et al., 2017; Cook et al., 2017; Darling et al., 2012). The build-up of CFCs in the atmosphere after the 1950s coupled with their solubility in water (despite low solubility) enables them to be commonly used as indicators of groundwater MRTs up to approximately 60 years (Darling et al., 2012; Han et al., 2012). Although the atmospheric concentrations of CFC-11, CFC-12, and CFC-113 declined between 1994 and 2002 (different CFCs peaked at different times; Cook et al., 2017), thereby leaving room for ambiguity in the CFC ratio plots (Darling et al., 2012), the different atmospheric CFC ratios between today and pre-1990s (Plummer et al., 2006b) enable determination of groundwater MRTs using CFCs. Consequently, CFCs have been commonly viewed as an alternative to 3H for calculating groundwater MRTs following the decline in the bomb pulse 3H activity (Cartwright et al., 2017; Cook et al., 2017; Qin et al., 2011). However, groundwater MRTs based on CFCs may not always be accurate. For example, MRTs estimated from CFCs would be underestimated if excess air in the unsaturated zone affects the CFC concentrations during recharge (Cook et al., 2006; Darling et al., 2012), or when CFC inputs are contaminated in urban and industrial environments (Carlson et al., 2011; Han et al., 2007; Mahlknecht et al., 2017; Qin, 2007). On the other hand, groundwater MRTs would be overestimated if CFC inputs are degraded in anaerobic groundwater (most notably CFC-11 and CFC-113; Cook and Solomon, 1995; Horneman et al., 2008; Plummer et al., 2006b).
Additionally, mixing between water of different ages, which occurs within the aquifer or during pumping from long-screened wells (Cook et al., 2017; Custodio et al., 2018; Visser et al., 2013), poses difficulties for estimating MRTs using tracer data. The calculated MRTs will be less than the actual values in the mixed water due to aggregation errors (Cartwright and Morgenstern, 2016; Kirchner, 2016; Stewart et al., 2017). MRT estimation using a multi-model approach based on incorporated residence time tracers would reduce the calculation uncertainty (Green et al., 2016; Visser et al., 2013) and indicate whether MRTs can be realistically estimated (Cartwright et al., 2017).
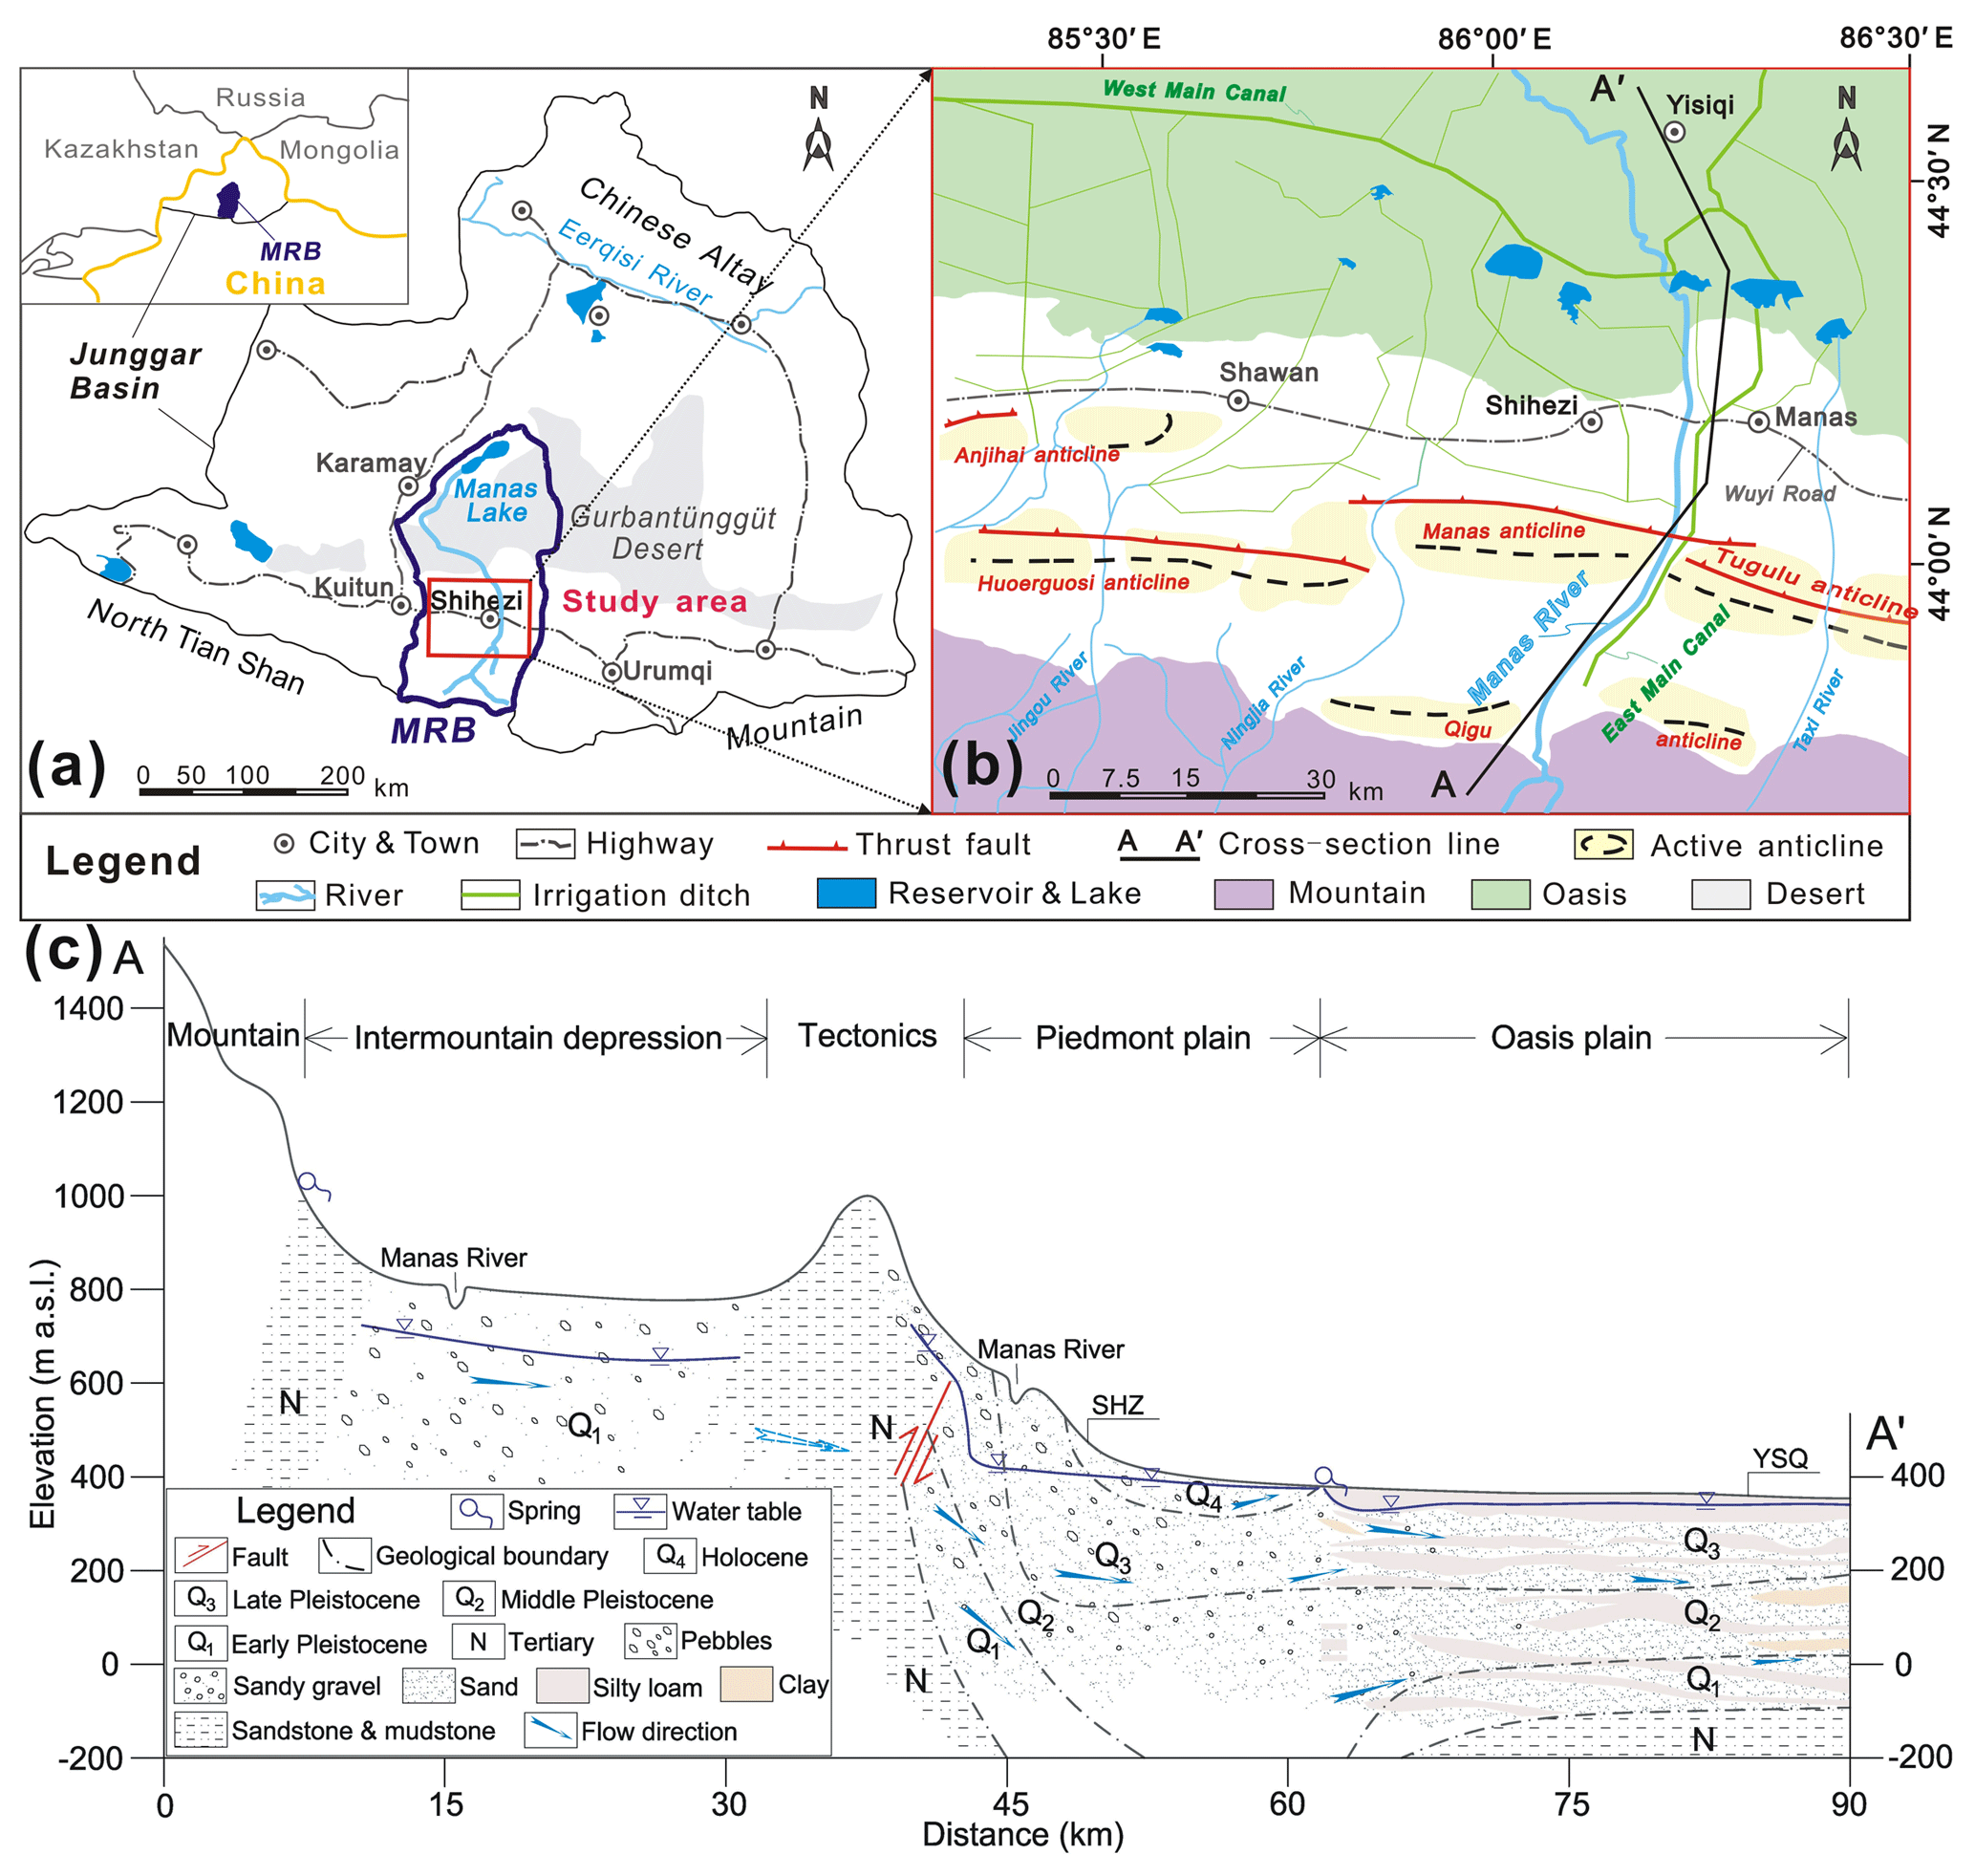
Figure 1Maps showing (a) regional location of the Manas River Basin (modified after Ma et al., 2018), (b) surface water (river, reservoir and irrigation ditch) system (modified after Cui et al., 2007 and Ji, 2016) and (c) geological cross section of the study area for A–A′ line shown in (b).
Mixing within the aquifers and during the pumping process from the long-screened wells is expected to be common in the fault-influenced hydraulic drop alluvium aquifers of the Manas River Basin (MRB) in the arid northwest of China (Fig. 1a, b). In particular, pumping from long-screened wells (of which there are over 10 000 boreholes; Ma et al., 2018) makes groundwater mixing most likely to occur. MRTs that result from a deep unsaturated zone (with water table depths of up to 180 m) and contrasting geological settings (hydraulic head drops of as much as 130 m caused by the thrust fault) are still insufficiently recognised in the alluvium aquifer (Fig. 1c). We aim to provide the first estimation of MRTs from borehole groundwater drainage (e.g. well withdrawal) using CFCs and 3H in MRB. We will then analyse the major hydrochemical ions in groundwater as first-order proxies for MRTs. In addition, we identify the recharge sources for the different mixing end-members and constrain mixing rates.
The bedrock of the upper Manas River catchment in the mountain area of northwestern China consists of granites, sedimentary formations of Devonian and Carboniferous age, and Mesozoic limestone (Jelinowska et al., 1995). Pyroclastic rock is exposed in relatively small areas in the mountain to the south. The piedmont and oasis plains are within the Cenozoic strata, including Tertiary and Quaternary deposits with a total depth of more than 5000 m in the piedmont area and 500–1000 m in the centre of the plain (Zhao, 2010). The vertical cross section (Fig. 1c) shows that the Quaternary deposits consist of pebbles, sandy gravel, and sand in the piedmont plain. The clay content in the Quaternary deposits increases from the overflow spring zone to the north oasis plain, which consists of silty loam and clay. The Huoerguosi–Manas–Tugulu thrust faults occurred in the early Pleistocene and cut the Tertiary strata with a total length of approximately 100 km in the piedmont alluvial fan (Fig. 1); these are water block features. These faults were intermittently active in the middle to late Pleistocene and then were more active from the late Holocene (Cui et al., 2007).
In the mountain area, groundwater consists of metamorphic rock fissure water, magmatic rock fissure water, clastic rock fissure water, and Tertiary clastic rock fissure water (Cui et al., 2007; Zhou, 1992). In the piedmont plain of the Shihezi (SHZ) zone, groundwater is from a single-layer unconfined aquifer. From the overflow spring zone to the central oasis plain, groundwater consists of shallow unconfined water and deep confined water. The hydraulic gradient, hydraulic conductivity, and transmissivity show a large range of variations due to changes in grain size and local increases in clay content (Wu, 2007). The groundwater flow direction is consistent with the Manas River flow direction. In the piedmont plain, the unconfined aquifer with saturated thickness more than 650 m is recharged by the Manas River water and is hydraulically connected to the hydrological network in the piedmont plain and north oasis plain (Ma et al., 2018; Wu, 2007). The depth of the piedmont plain unconfined aquifer decreases gradually from south to north and has relatively fresh groundwater with total dissolved solids (TDS) of < 1 g L−1. Groundwater discharges via springs in the northern area of SHZ (Fig. 1c). Groundwater in the shallow unconfined aquifer in the north oasis plain has TDS of > 3 g L−1, and the TDS of groundwater in the underlying confined aquifer varies from 0.3 to 1.0 g L−1 (Wu, 2007). The water table depth is as deep as 180 m and the hydraulic head drops as much as 130 m due to the thrust fault in the south margin in SHZ (Fig. 1c).
Table 1Chemical–physical parameters, stable isotopes, CFC concentrations, tritium (3H), and 14C in groundwater samples in the Manas River Basin.
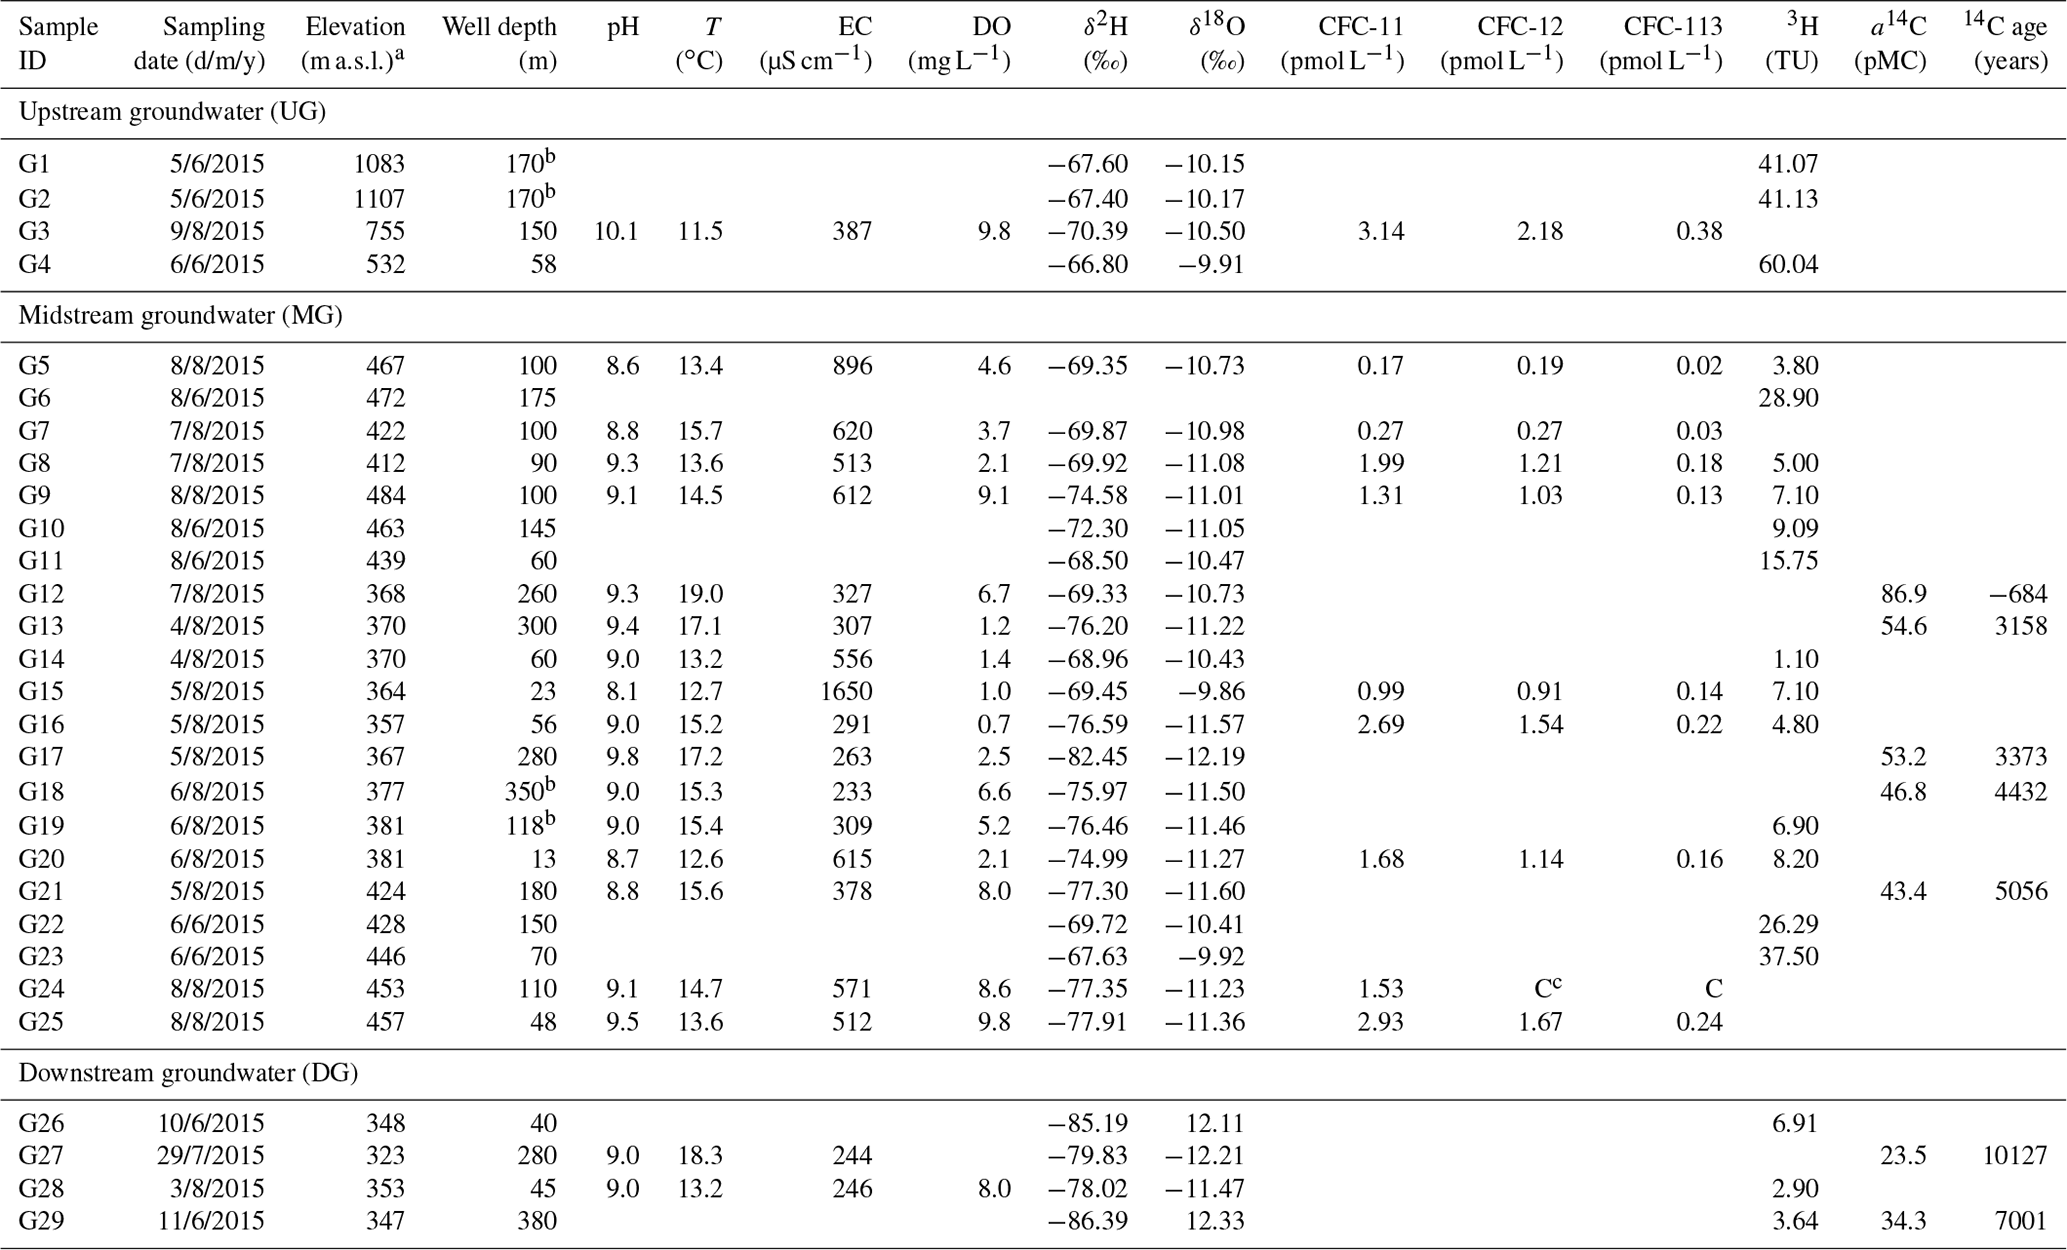
a m a.s.l. = m above sea level. b Artesian well. c Contamination.
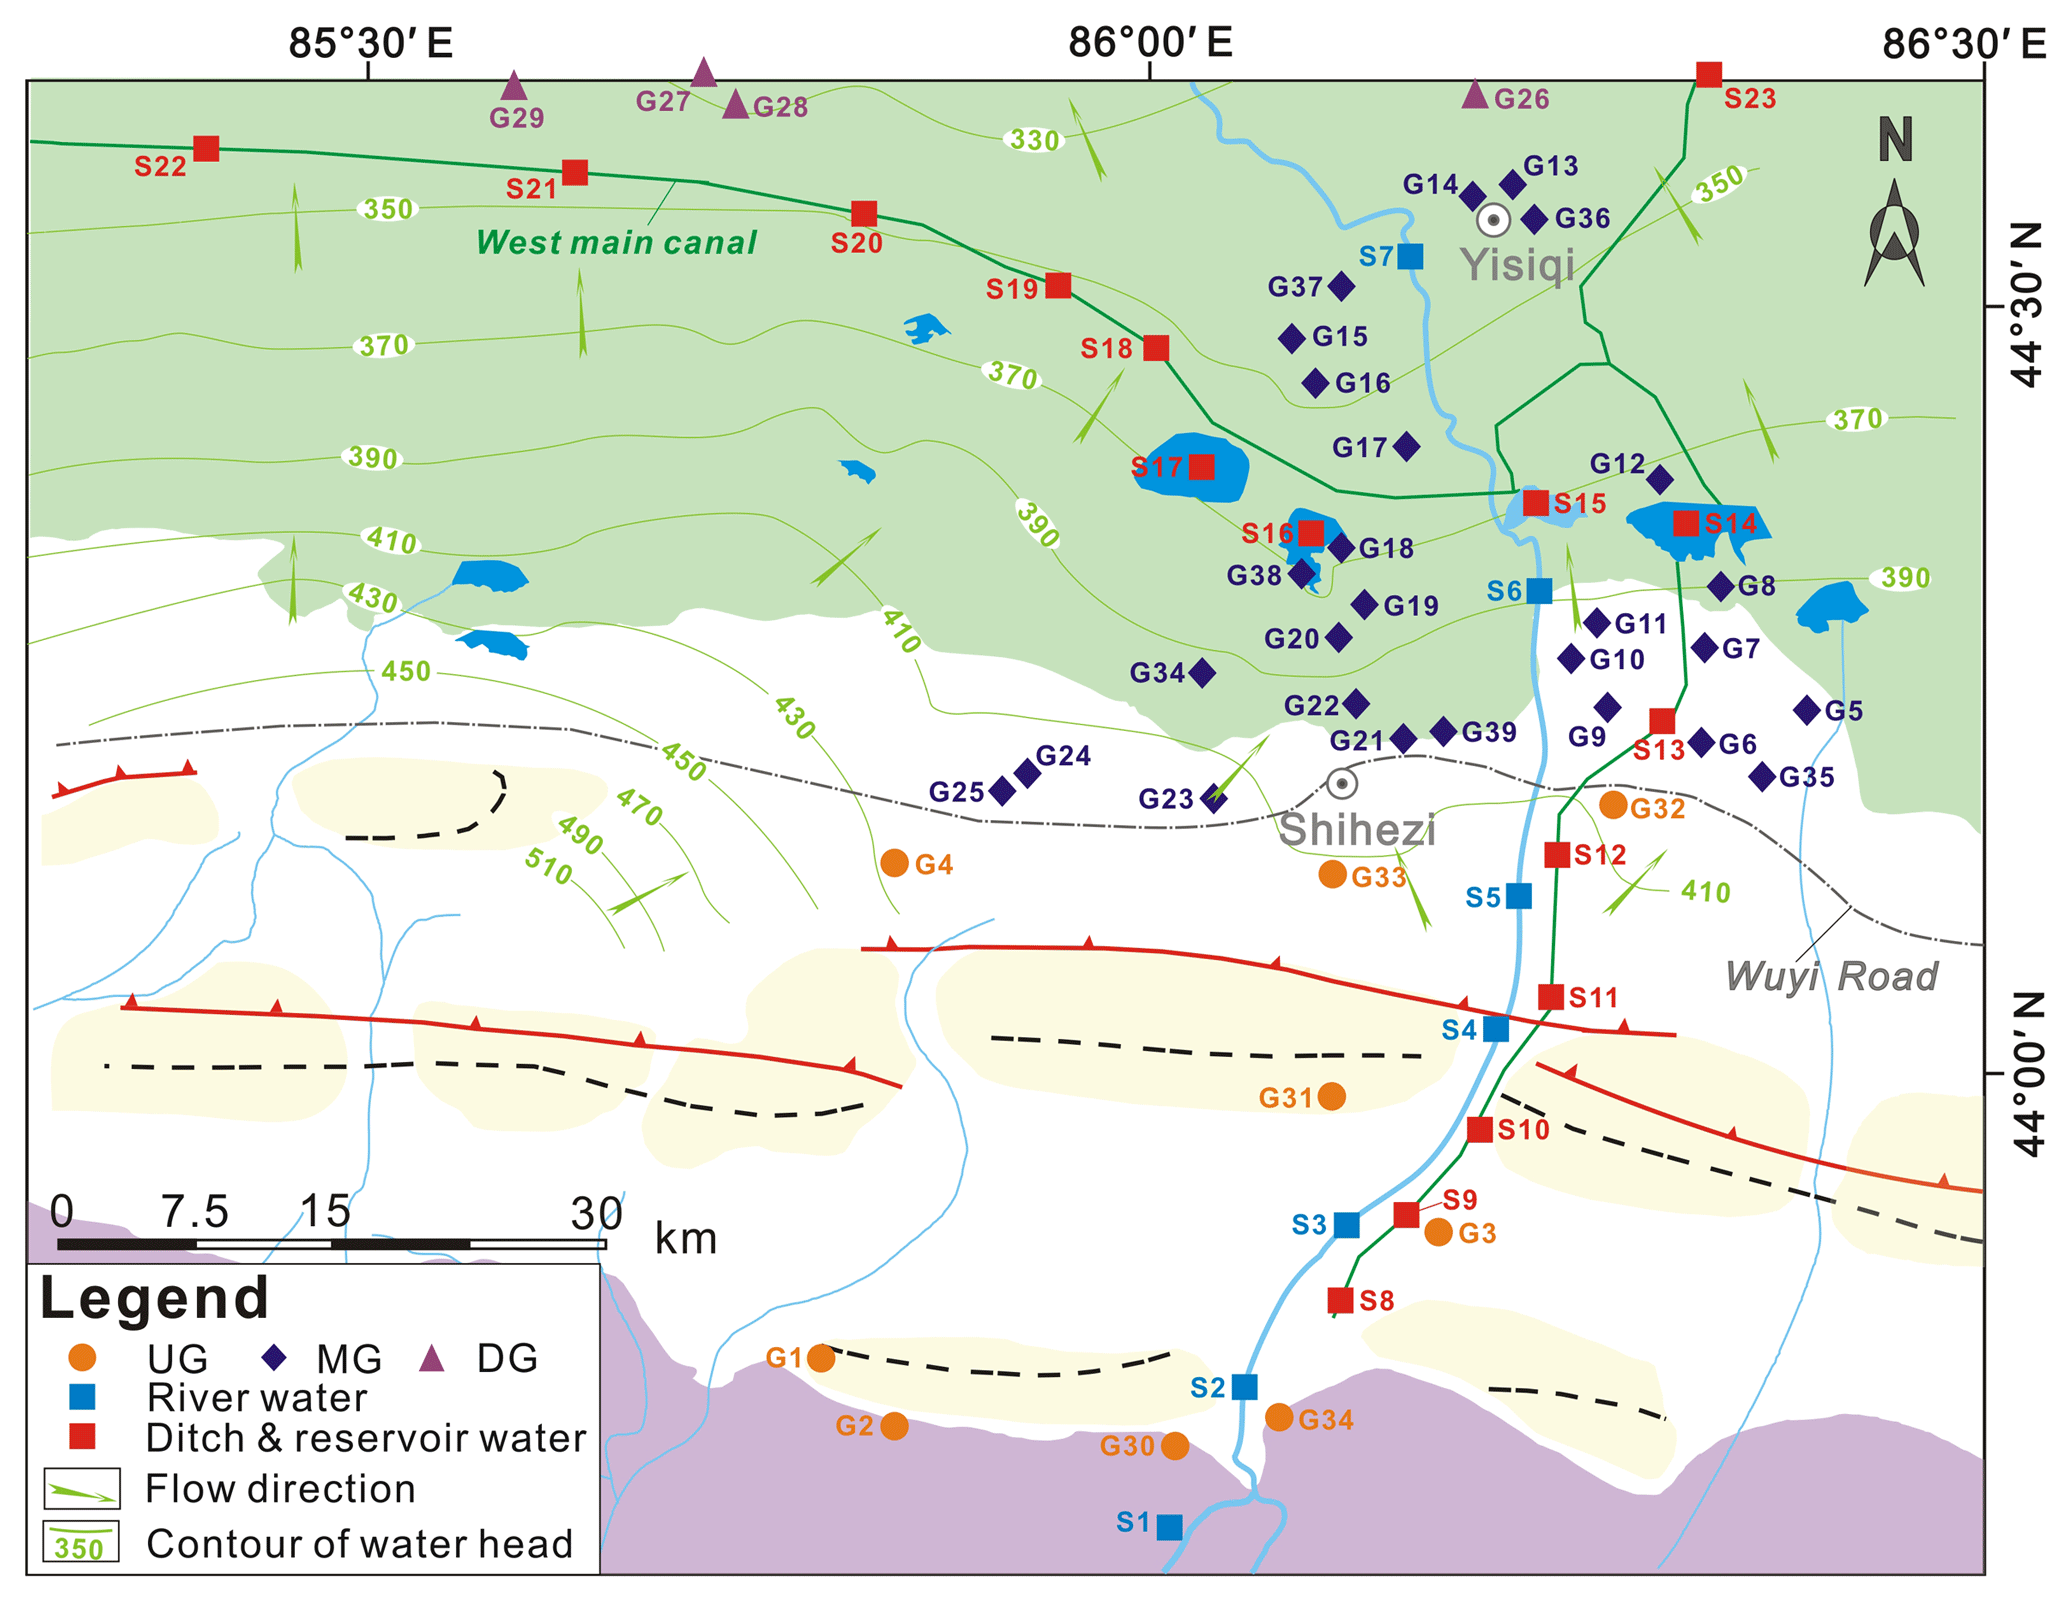
Figure 2Water sampling sites and unconfined groundwater head contours (in metres) in the headwater catchments of Manas River. UG: upstream groundwater, MG: midstream groundwater, DG: downstream groundwater.
3.1 Water sampling
A total of 29 groundwater samples (pumped from fully penetrating wells and three artesian wells) were collected along the Manas River between June and August 2015 (from G1 to G29 in Table 1 and Fig. 2). Locations were separated into three clusters based on the hydrochemistry and stable isotope data: the upstream groundwater (UG, south of the Wuyi Road), midstream groundwater (MG, area between the Wuyi Road and the West Main Canal–Yisiqi), and downstream groundwater (DG, north of the West Main Canal–Yisiqi). Groundwater was sampled from wells for irrigation and domestic supply, in which shallow wells were pumped for a minimum of 5 min before sampling and deep wells were active for irrigation for more than 10 days prior to sampling. Surface water sample data (river water, ditch and reservoir water) and groundwater sample data (sample ID are from G30 to G39) were reported by Ji (2016) and Ma et al. (2018).
Water temperature (T), pH, electrical conductivity (EC), and dissolved oxygen (DO) were measured (Table 1) in the field using calibrated Hach (HQ40d) conductivity and pH meters, which had been calibrated before use. Bicarbonate was determined by titration with 0.05 N HCl on-site. Samples to be analysed for chemical and stable isotopic values were filtered on-site through 0.45 µm millipore syringe filters and stored in pre-cleaned polypropylene bottles at 4 ∘C until analysis. For cation and strontium isotope analysis, the samples were acidified to pH < 2 with ultrapure HNO3.
For CFC samples extreme precautions were taken to avoid contamination from equipment such as pumps and tubing (Cook et al., 2017; Darling et al., 2012; Han et al., 2012). After purging the wells the water samples were collected directly from the borehole using a copper tube sampling pipe. One end of the pipe was connected to the well casing, and the other end was placed in the bottom of a 120 mL borosilicate glass bottle, inside a 2000 mL beaker. The well water was allowed to flow through the tubing for 10 min, thoroughly flushing the tubing. The bottle was submerged, and then filled and capped underwater when no bubbles appeared in the bottle following the protocols described by Han et al. (2007). In this study, five bottles were collected at each well, three of which were analysed. A total of 10 wells were collected for CFC analysis (CFC-11, CFC-12, and CFC-113). Unfiltered groundwater samples for 3H analysis were collected and stored in 500 mL airtight polypropylene bottles. Dissolved inorganic carbon (DIC) for 14C activity analysis was precipitated to BaCO3 and sealed in 500 mL polypropylene bottles in the field from 180 to 240 L water samples following the procedure reported by Chen et al. (2003). This was done by the addition of excess BaCl2 previously brought to pH ≥ 12 with NaOH.
3.2 Analytical techniques
The CFC concentrations were analysed within 1 month of sample collection at the Groundwater Dating Laboratory of the Institute of Geology and Geophysics, Chinese Academy of Sciences (IGG–CAS), using a purge-and-trap gas chromatography procedure with an electron capture detector (ECD). The procedure was reported by Han et al. (2012, 2015) and Qin et al. (2011), which is modified from Oster et al. (1996). The detection limit for each CFC is about 0.01 pmol L−1 of water, with an error < ±5 %. The obtained results are shown in Table 1.
The 3H and 14C activities of groundwater were measured using liquid scintillation spectrometry (1220 Quantulus ultra-low-level counters, PerkinElmer, Waltham, MA, USA) at the State Key Laboratory of Biogeology and Environmental Geology, China University of Geosciences, in Wuhan. Water samples for 3H were distilled and electrolytically enriched prior to being analysed. Detailed procedures were based on those in Morgenstern and Taylor (2009). 3H activities were expressed as tritium unit (TU), with 1 TU corresponding to a 3H∕1H ratio of . For 14C samples, the obtained BaCO3 samples were first converted to CO2, then to acetylene (C2H2), which in turn was trimerised catalytically to C6H6 as described by Polach (1987), prior to being analysed. 14C activities were reported as percent modern carbon (pMC). The achieved precision values for 3H and 14C were ±0.2 TU and ±0.4 pMC respectively.
The cation, anion, and stable isotope measurements were performed at the State Key Laboratory of Biogeology and Environmental Geology, China University of Geosciences, in Wuhan. Cations were analysed using inductively coupled plasma atomic emission spectrometry (ICP–AES) (IRIS Intrepid II XSP, Thermo Elemental). Anions were analysed on filtered unacidified samples using ion chromatography (IC) (Metrohm 761 Compact IC). Analytical errors were inferred from the mass balance between cations and anions (with HCO3) and are within ±6 %. Stable isotopic values (δ2H and δ18O) analyses were measured using a Finnigan MAT–253 mass spectrometer (Thermo Fisher, USA, manufactured in Bremen, Germany), with the TC/EA method. The δ2H and δ18O values (Table 1) were presented in δ notation in per mille (‰) with respect to the Vienna Standard Mean Ocean Water (VSMOW), with an analytical precision of 0.5 ‰ vs. VSMOW for δ2H and of 0.1 ‰ for δ18O.
3.3 Groundwater dating
3.3.1 CFCs indicating modern water recharge
Knowledge of the history of the local atmospheric mixing ratios of CFCs in precipitation is required for indicating modern water recharge. The difference between the local and global background atmospheric mixing ratios of CFCs in the Northern Hemisphere – CFC excess – varies substantially based on the industrial development of the area. Elevated CFC concentrations (10 %–15 % higher than those of the Northern Hemisphere as a whole) have been reported in the air of urban environments such as Las Vegas, Tucson, Vienna, and Beijing (Barletta et al., 2006; Carlson et al., 2011; Han et al., 2007; Qin et al., 2007), whereas the atmospheric mixing ratios of CFCs in Lanzhou and Yinchuan (northwestern China) were approximately 10 % lower than those of the Northern Hemisphere (Barletta et al., 2006). Manas River Basin is located in northwestern China (Fig. 1a), has a very low population density, and is far from industrial cities. To evaluate the modern water recharge by CFCs, the time series trend of the Northern Hemisphere atmospheric mixing ratio (Fig. 3; 1940–2014, https://water.usgs.gov/lab/software/air_curve/index.html, last access: 27 October 2017) was adopted in this study.
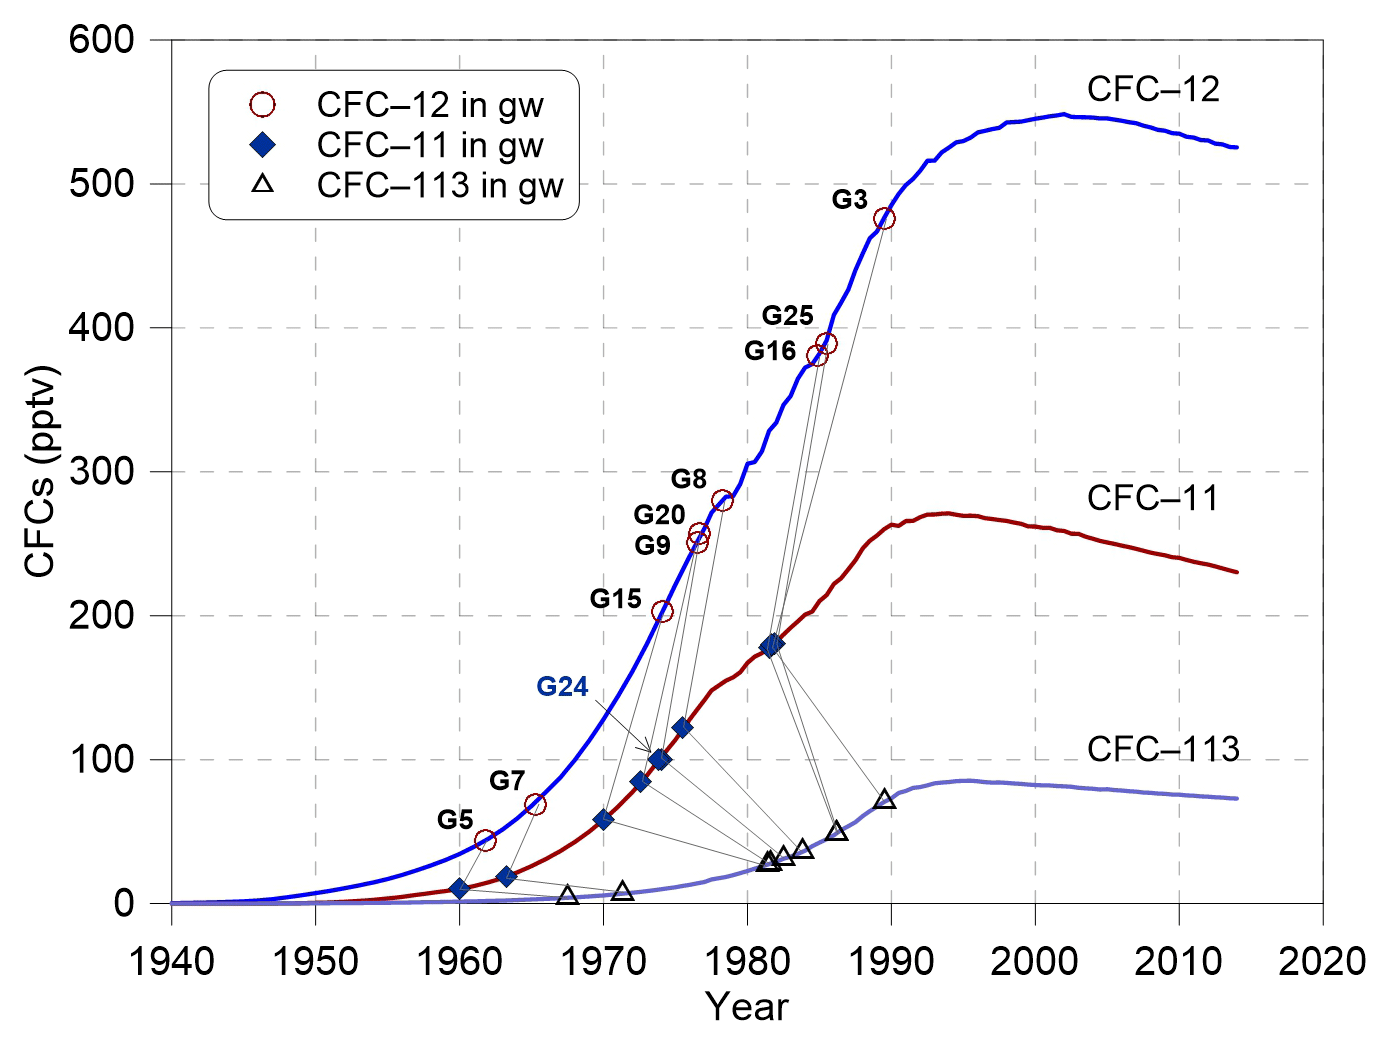
Figure 3Concentrations of CFC-11, CFC-12 and CFC-113 (pptv) in the groundwater of this study area sampled in 2015 compared with the time series trend of Northern Hemisphere atmospheric mixing ratio at a recharge temperature of 10 ∘C. Data are available at https://water.usgs.gov/lab/software/air_curve/index.html (last access: 27 October 2017).
Measured CFC concentrations (in pmol L−1) can be interpreted in terms of partial pressures of CFCs (in pptv) in solubility equilibrium with the water sample based on Henry's law. The computational process was conducted following Plummer et al. (2006a). In arid northwestern China, estimating the local shallow groundwater temperature as recharge temperature is more suitable than the annual mean surface air temperature (Qin et al., 2011) because the local low precipitation usually cannot reach the groundwater. Studies on the MRB (Ji, 2016; Wu, 2007) have also indicated much less vertical recharge water from the local precipitation compared with abundant groundwater lateral flow recharge and river leakage from the mountain to the piedmont areas. In this study, the measured groundwater temperature, which varied from 11.5 to 15.7 ∘C between wells (Table 1), was used as the recharge temperature to estimate the groundwater input CFC concentrations. Surface elevations of the recharge area vary from 316 to 755 m. The modern water recharge was then determined by comparing the calculated partial pressures of CFCs in solubility equilibrium with the water samples with historical CFC concentrations in the air (Fig. 3).
3.3.2 The apparent 14C ages
Carbon-14 (14C, half-life 5730 years) activity in groundwater is often used to estimate groundwater age over time periods of approximately 200 to 30 000 years, and to determine the recharge from mixing water in various climate conditions (Cook et al., 2017; Custodio et al., 2018; Huang et al., 2017). Since groundwater age cannot be measured directly, and the age distribution in the sample is unknown, one can derive an apparent age using a mathematical formula for the groundwater 14C sample (Suckow, 2014). “Apparent” here describes the fact that the age is not corresponding to the time difference between recharge and sampling during which piston flow is assumed for a water parcel (Cartwright et al., 2017; Suckow, 2014). Calculation of groundwater apparent 14C age may be complicated if dissolved inorganic carbon is derived from a mixture of sources, or if 14C originating from the atmosphere or soil zone is significantly diluted by the dissolution of 14C-free carbonate minerals in the aquifer matrix and biochemical reactions along the groundwater flow paths (Clark and Fritz, 1997). Although only minor carbonate dissolution is likely and determination of groundwater residence times requires 14C correction (Atkinson et al., 2014). When the dissolution of carbonate during recharge or along the groundwater flow path may dilute the initial soil CO2, δ13C can be used to trace the process (Clark and Fritz, 1997). An equation for the reaction between CO2-containing water with a carbonate mineral is commonly written as follows (modified after Pearson and Hanshaw, 1970):
where δ13Ccarb is the dissolved carbonate δ13C value (approximately 0; Clark and Fritz, 1997), and δ13CDIC is the measured δ13C value in groundwater.
Depending on knowing the measured 14C activity after adjustment for the geochemical and physical dilution processes in the aquifer (without radioactive decay), the groundwater apparent 14C ages (t) can be calculated from the following decay equation:
where is the 14C decay constant (), and a14C is the measured 14C activity of the DIC in groundwater.
Previous studies in the arid northwest of China (Edmunds et al., 2006; Huang et al., 2017) have concluded that a volumetric value of 20 % “dead” carbon derived from the aquifer matrix was recognised, which is consistent with the value (10 %–25 %) obtained by Vogel (1970). Therefore, the initial 14C activity (a014C) of 80 pMC is used to correct groundwater 14C ages (results are shown in Table 1), although this simple correction makes no attempt to correct the age of individual samples that may have experienced different water–rock interaction histories.
3.3.3 Groundwater mean residence time estimation
Groundwater mixing may occur both within the aquifer and in the long-screened wells (Cook et al., 2017; Custodio et al., 2018; Visser et al., 2013). A wide range of the groundwater residence times (ages) has been reported in an arid unconfined aquifer because recharge occurs under various climate conditions (Custodio et al., 2018). Furthermore, the groundwater residence time with wide variabilities governed by the distribution of flow paths of varying length cannot be measured directly (de Dreuz and Ginn, 2016; Suckow, 2014). A lumped parameter model may be an alternative approach to describe the distribution of residence times, which at the same time describes a mean residence time for the mixtures of different residence times. With the aid of gaseous tracers (e.g. 3H, CFCs, SF6, and 85Kr) one can describe the distribution of tracer concentrations (Stewart et al., 2017; Zuber et al., 2005) to obtain the groundwater MRTs. For the steady-state subsurface hydrologic system, 3H and CFCs tracers entering groundwater with precipitation are injected proportionally to the volumetric flow rates by natural processes. The output concentration in water at the time of sampling relating to the input 3H and CFCs can be described by the following convolution integrals (Małoszewski and Zuber, 1982):
where Cout is the tracer output concentration, Cin is the tracer input concentration, τ is the residence time, t−τ is the time when water entered the catchment, is the 3H decay constant (), and g(τ) is the system response function that describes the residence time distributions in the subsurface hydrologic system.
In this study, the CFC concentrations from the time series trend of the Northern Hemisphere atmospheric mixing ratio (Fig. 3) and 3H activities in precipitation in Urumqi (Fig. 4) are treated as proxies for CFC and 3H recharge concentrations (Cin), respectively. The historical precipitation 3H activity in the Urumqi station (Fig. 4) was reconstructed with the data available from the International Atomic Energy Agency (IAEA) using a logarithmic interpolation method. The precipitation 3H activity between 1969 and 1983 at Hong Kong and Irkutsk with different latitudes was used (data are available at https://www.iaea.org/, last access: 4 December 2017). The time series of 3H activity (Fig. 4) used as the input data was based on the following considerations. First, the MRB is located in the Northern Hemisphere, where the bomb pulse 3H activity is several orders of magnitude higher than in the Southern Hemisphere (Clark and Fritz, 1997; Tadros et al., 2014) and was superimposed with the China atmospheric nuclear tests from 1964 to 1974 in the arid northwest of China. Thus, the remnant 3H activity remains affected by the tail end of the bomb pulse. Second, the study area is more than 3500 km away from the western Pacific, and hence the atmospheric 3H activity is much higher than that at coastal sites due to the continental effect (Tadros et al., 2014). Furthermore, although the atmospheric 3H activity varies between seasons (Cartwright and Morgenstern, 2016; Morgenstern et al., 2010; Tadros et al., 2014), mean annual values (Fig. 4) were considered in this study.
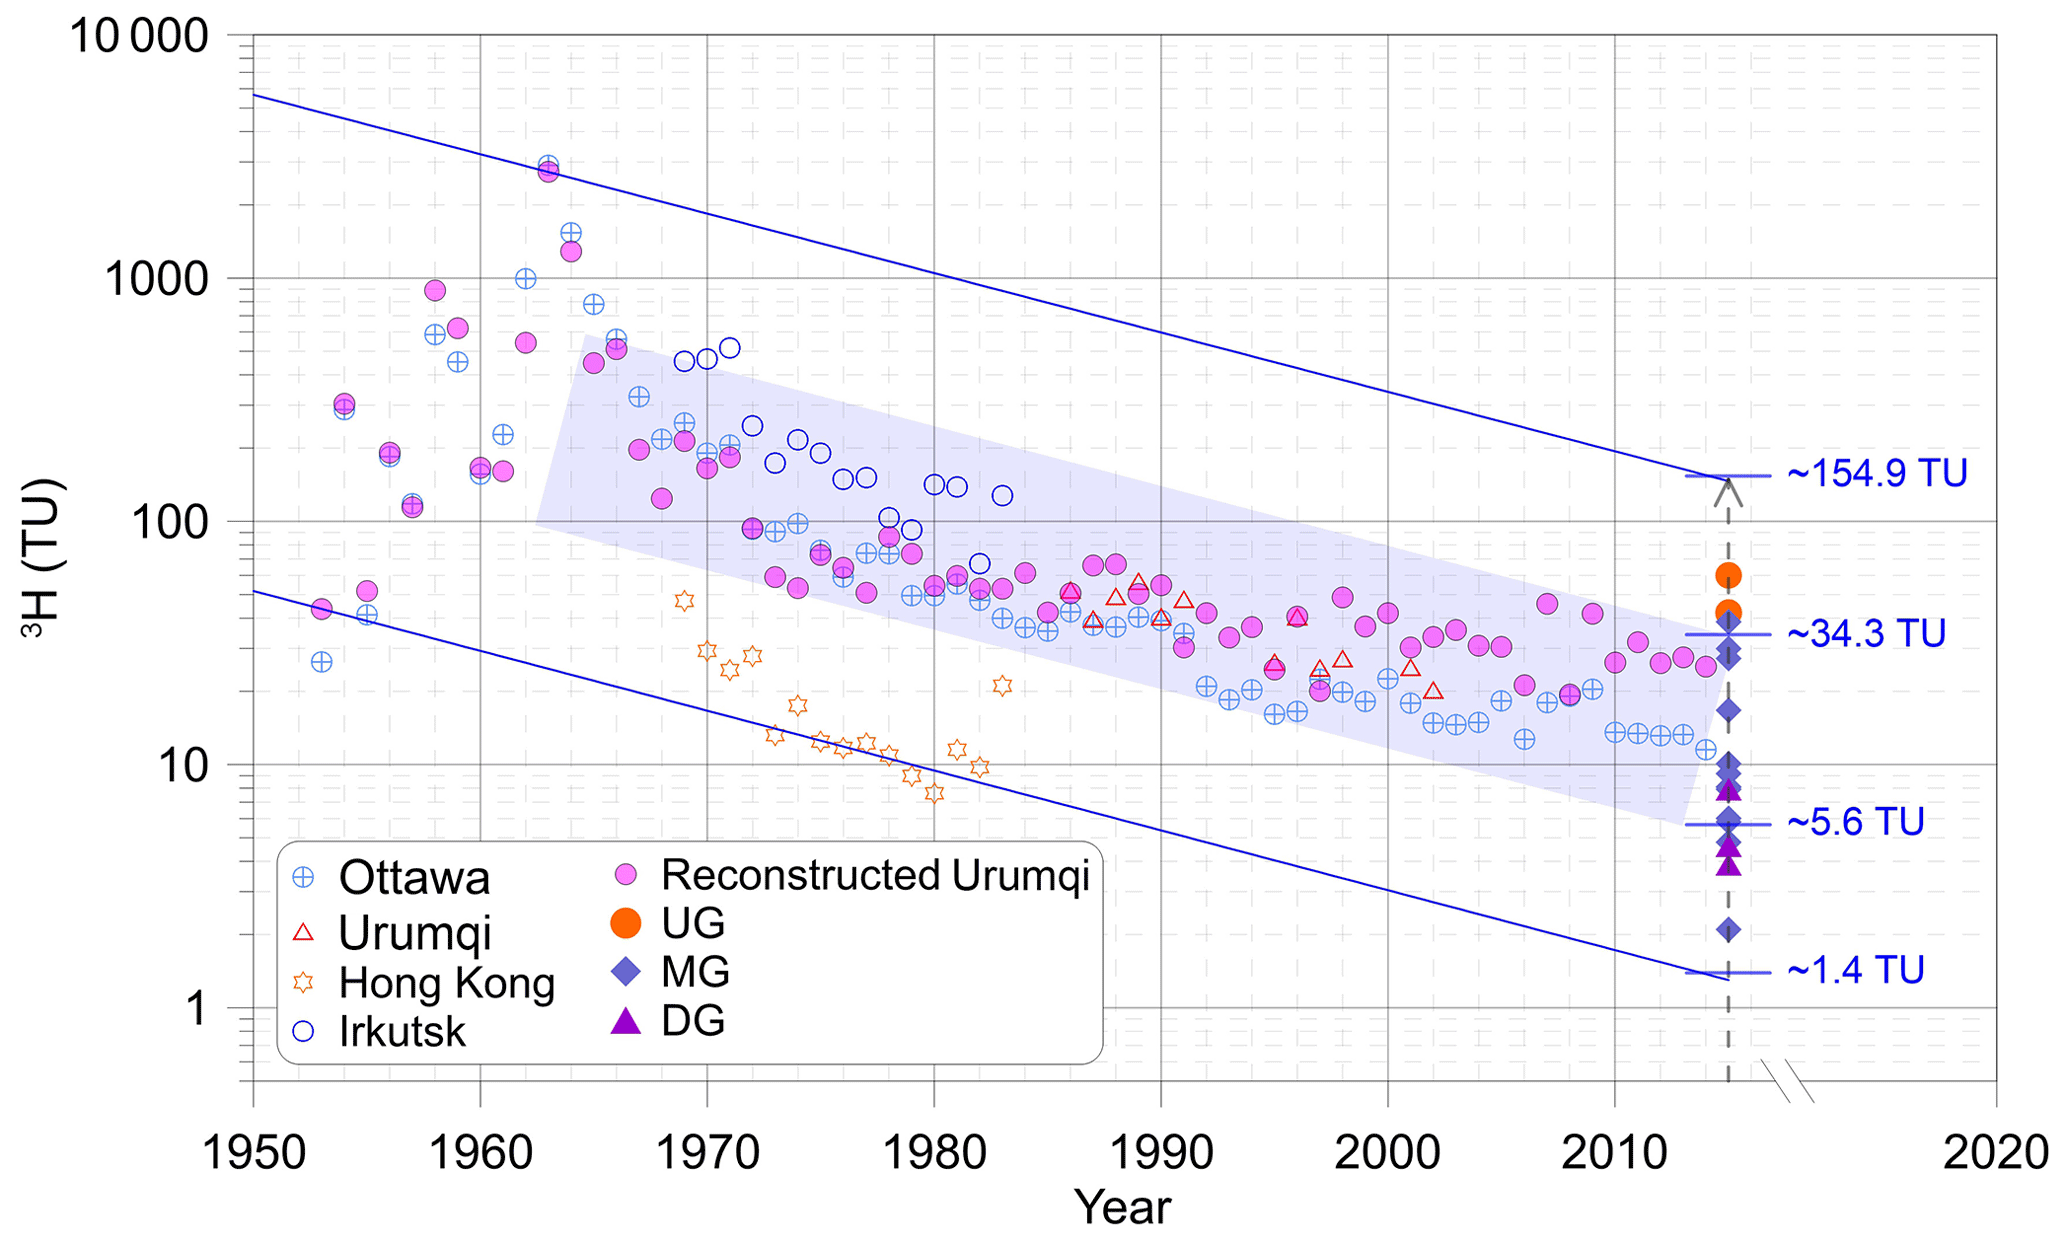
Figure 4Tritium concentration (TU) of the upstream groundwater (UG), midstream groundwater (MG), and downstream groundwater (DG). Time series of tritium concentration in precipitation at Ottawa, Urumqi, Hong Kong, and Irkutsk were obtained by GNIP in IAEA (https://www.iaea.org/, last access: 4 December 2017). The blue solid lines and shaded field were drawn using the half-life (12.32 years) of tritium decayed to 2014.
Several residence time distributions have been described (Małoszewski and Zuber, 1982; Jurgens et al., 2012) and have been widely used in studies of variable timescales and catchment areas (Cartwright and Morgenstern, 2015, 2016; Cartwright et al., 2018; Hrachowitz et al., 2009; Morgenstern et al., 2010, 2015; McGuire et al., 2005). The selection of each model depends on the hydrogeological situations in the hydrologic system to which it is applicable. The exponential piston flow model (EPM) describes an aquifer that contains a segment of the exponential flow followed by a segment of piston flow. The piston flow model assumes minimal water mixing from different flow lines and little or no recharge in the confined aquifer; the exponential flow model assumes that water mixing between flowlines in the unconfined aquifer is minimal and that flowlines have an exponential distribution of transit times (Jurgens et al., 2012; Małoszewski and Zuber, 1982). The weighting function of this model is given by
The dispersion model (DM) mainly measures the relative importance of dispersion to advection, and is applicable for confined or partially confined aquifers (Małoszewski, 2000). Its residence time distribution is given by
The weighting function of the exponential mixing model (EMM) is
where τm is the mean residence time and η is the ratio defined as , where lE (or lP) is the length of area at the water table receiving (or not receiving) recharge. DP is the dispersion parameter, which is the reciprocal of the Peclet number (Pe) and defined as , where D is the dispersion coefficient (m2 day−1), v is velocity (m day−1), and x is distance (m).
Each residence time distribution has one or two parameters. MRTs (τm) are determined by convoluting the input (the time series of 3H and CFCs input in rainfall) to each model to match the output (the measured 3H and CFC concentrations in groundwater). The other parameters (η and Dp) are determined depending on the hydrogeological conditions. To interpret the ages of the MRB data set, EPM (η=1.5 and 2.2), DM (Dp=0.03 and 0.1), and EMM models were used, after which MRTs were compared.
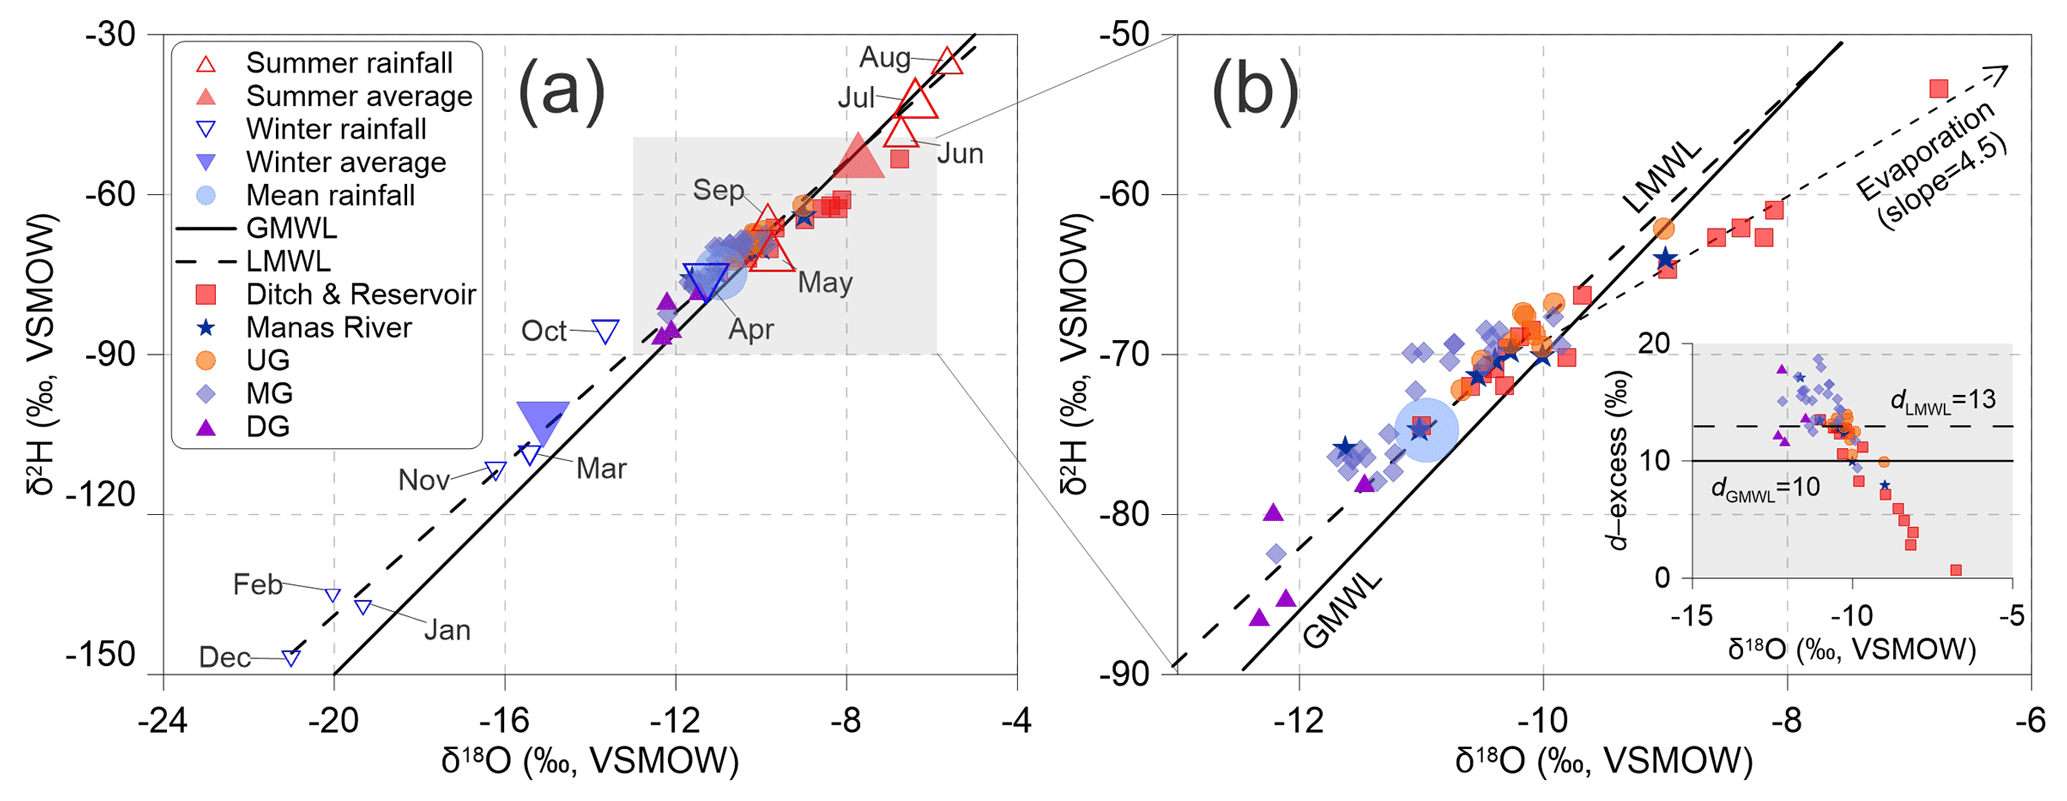
Figure 5(a) Plot of stable isotopes of surface water and groundwater from the mountain to the oasis plain compared to the global meteoric water line (GMWL; Craig, 1961) and the local meteoric water line (LMWL, rainfall in Urumqi station of IAEA networks during 1986 and 2003; data are available at https://www.iaea.org, last access: 27 January 2016). The size of the hollow triangles stands for the relative amount of precipitation. “Mean rainfall” refers to the annual amount-weighted mean rainfall isotopic value. (b) Plot of δ2H vs. δ18O and inserted plot d excess vs. δ18O. UG: upstream groundwater, MG: midstream groundwater, DG: downstream groundwater.
4.1 Stable isotope and major ion hydrochemistry
The δ2H values in the study area vary from −75.88 ‰ to −53.40 ‰ for the surface water, and −82.45 ‰ to −62.16 ‰ for the groundwater. Meanwhile, the δ18O values vary from −11.62 ‰ to −6.76 ‰ for the surface water, and −12.19 ‰ to −9.01 ‰ for the groundwater. Figure 5a shows the δ2H and δ18O values of surface water and groundwater in relation to the precipitation isotopes of the closest GNIP station (Urumqi station in Fig. 1a). Both the linear slope (7.3) and intercept (3.1) of the Local Meteoric Water Line (LMWL) are lower than that of the Global Meteoric Water Line (GMWL, 8 and 10, respectively; Craig, 1961). Surface water (ditch, river, and reservoir water) is more enriched in heavy isotopes and defines an evaporation line with a slope of 4.5 (Fig. 5b), which is much higher than that solely calculated from the upstream river water and reservoir water (slope =3.2 from Ma et al., 2018).
Groundwater deuterium excess values (, Fig. 5b) defined by Dansgaard (1964) lie close to the annual mean LMWL (dLMWL=13 ‰), which also suggest little isotope fractionation by evaporation as the d excess value decreases when water evaporates (Han et al., 2011; Ma et al., 2015). The d excess values of surface water decrease from 17.12 ‰ in the upstream area to 0.68 ‰ in the downstream area, indicating a strong evaporation effect, which is also demonstrated by the low slope (evaporation slope =4.5) of the surface water. A recent study (Benettin et al., 2018) indicated that the evaporation line obtained from various sources of water is often not the true evaporation line. All samples of surface water in the present study were collected in the summer of 2015 and were recharged from the mountain areas in the same season. Although they were collected from different areas (ditch water, reservoir water, and Manas River water), the linear trend obtained may have implications for surface water evaporation.
The hydrochemistry compositions of surface water and groundwater in the MRB reflect the evolution from the fresh HCO3–SO4–Ca water type to the HCO3–SO4–Na–Ca type and further to the HCO3–SO4–Na type, and finally to the brine Cl–SO4–Na water type along the groundwater flow paths (Fig. 6). Groundwater in the unconfined aquifers (e.g. intermountain depression and piedmont plain aquifers in Fig. 1c) is dominated by Ca2+ and , with a relatively low concentration of Na+ (Fig. 6). Groundwater in the confined aquifers is characterised by a wide range of ion concentrations, with progressively increasing Na+ and Cl− concentrations, whereas Ca2+ and Mg2+ concentrations decrease progressively as the salinity spectrum moves towards the more concentrated end (Fig. 6). The concentration of ions gradually increases in the unconfined aquifers and becomes less dominant in the confined aquifers along the groundwater flow paths (Fig. 6).
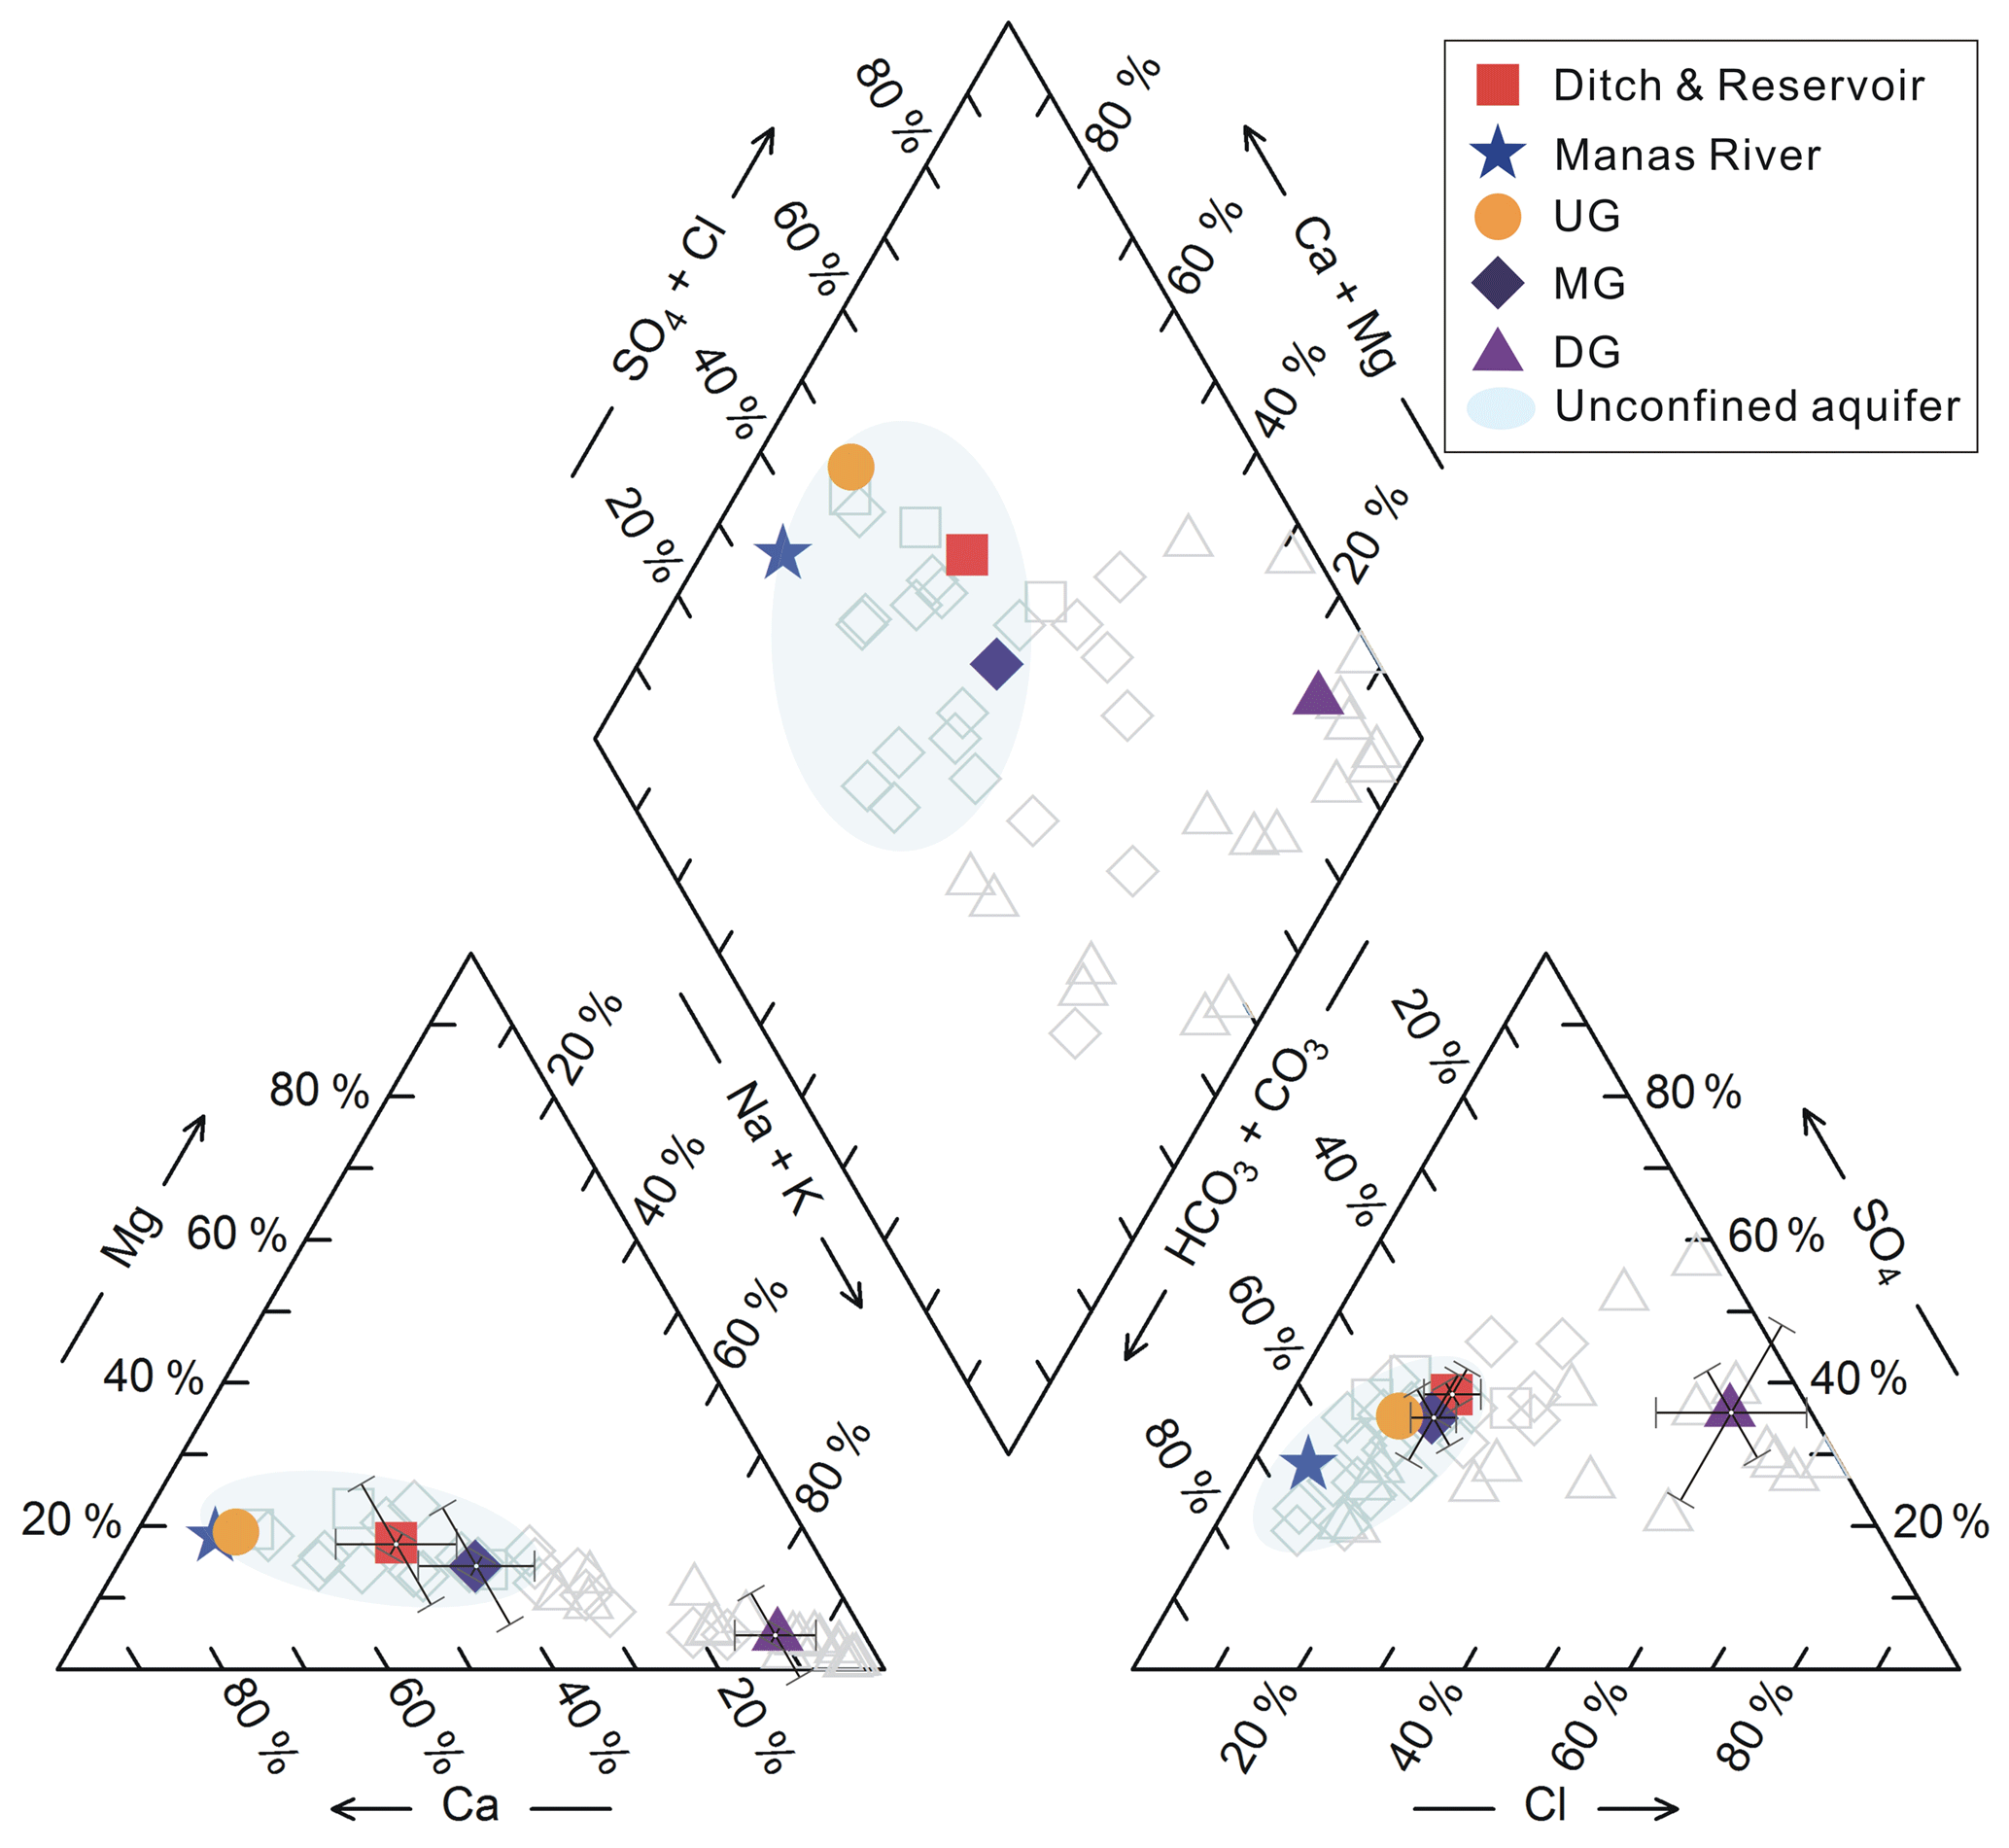
Figure 6Piper diagram highlights the HCO3–SO4–Na type of waters. The coloured symbols represent the mean values calculated from the hydrochemistry data (light grey hollow symbols) reported by Ma et al. (2018). The error bars are shown in the cation and anion diagrams.
4.2 Modern and paleo-meteoric recharge features
4.2.1 Stable isotope indications
Stable isotopes (δ2H and δ18O), the components of the water molecule that record the atmospheric conditions at the time of recharge (Batlle-Aguilar et al., 2017; Chen et al., 2003), provide valuable information on groundwater recharge processes (Ma et al., 2017; Stumpp and Małoszewski, 2010; Stumpp et al., 2009). Generally, there are two possible meteoric recharge sources including precipitation in the modern climate and in the paleoclimate. Groundwater whose isotopic values are more depleted than the modern precipitation would usually be ascribed to one or both of two recharge sources, including snowmelt or precipitation at higher elevation and precipitation that fell under cooler climate conditions. Figure 5 shows that the markers of groundwater isotopes are generally distributed along the LMWL but do not define evaporation trend, implying that little evaporation and isotope exchange between groundwater and the rock matrix have occurred (Ma et al., 2018; Négrel et al., 2016). Transpiration is likely to be dominant over evaporation in the soil when infiltration takes place, as soil water uptake by root is not significantly isotope fractionated (Dawson and Ehleringer, 1991).
Three groundwater clusters can be identified in the δ2H–δ18O plot (Fig. 5), suggesting different recharge sources among the upstream, midstream, and downstream areas. The first group of UG has the average δ2H and δ18O values of −68.24 ‰ and −10.08 ‰, respectively. Figure 5a shows that UG is located much closer to the summer rainfall, which reflects more enriched summer rainfall inputs in the upstream area of the Manas River. Negligible evaporation trends are observed in UG, although the recharge is mostly from the fast river leakage in the intermountain depression through highly permeable pebbles and gravel deposits (Fig. 1c). Furthermore, the detectable CFC concentrations and high 3H activity (Table 1) also indicate a modern precipitation recharge. An overlap between surface water and UG indicates the same recharge sources, because some alignment of river water and groundwater isotopic values is a qualitative indication of recharge under climate conditions similar to contemporary conditions (Huang et al., 2017).
The second group has the average δ2H and δ18O values of −73.10 ‰ and −11.0 ‰, respectively, which overlap with the annual amount-weighted mean rainfall isotopic value from MG. Such isotopic values are comparable to the modern annual amount-weighted mean rainfall δ2H and δ18O values (−74.7 ‰ and −11.0 ‰, respectively; Fig. 5a); it probably reflects annual modern precipitation recharge. The mixing of different timescale recharges of variable isotopic values at different aquifers and sites along the groundwater flow paths is another explanation for the highly scattered MG isotopic values in the δ2H–δ18O plot (Fig. 5b). Groundwater isotopes in the piedmont plain are relatively rich in heavy isotopes (Fig. 5b), which overlap with the river water, and indicate fast river leakage recharge within a short time (Ma et al., 2018). Groundwater isotopic values in the oasis plain diverge from those in the piedmont plain (Fig. 5b) and do not align with surface water, indicating recharge with longer flow paths rather than fast river leakage recharge.
The third group, which is most depleted in heavy isotopes (−82.36 ‰ and −12.03 ‰), is from DG and is located much closer to the winter rainfall in the δ2H–δ18O plot (Fig. 5b). Studies (Ji, 2016; Ma et al., 2018) have shown that vertical recharge from the winter rainfall in the downstream area is unlikely. As precipitation recharge from high altitudes (Clark and Fritz, 1997) and paleo-meteoric recharge during the cooler climate (Chen et al., 2003) could collectively account for the depletion of isotopes in groundwater, it is usually not easy to distinguish the precipitation recharge sources at a higher elevation from paleo-meteoric recharge. However, precipitation in the north Tian Shan (Fig. 1a) has a positive isotope altitude gradient due to the moisture recycling (Kong and Pang, 2016); thus sub-cloud evaporation effects will yield more enriched isotopes from higher-altitude precipitation recharge. The isotopically enriched UG (Fig. 5b) in the intermountain depression with higher altitude (Fig. 1c) is recharged from the high mountains. This also demonstrates that DG is unlikely to be from the high mountain recharge. Accordingly, its depleted isotopic values (Fig. 5b) are attributed to the paleo-meteoric recharge in a cooler climate. In the last glacial period, temperatures in the Xinjiang region (Li et al., 2015) and North China Plain (Chen et al., 2003) were cooler by approximately 10 and 6–9 ∘C, respectively, compared with the present day. Groundwater had a depleted δ18O value of −12.0 ‰ from the paleo-meteoric recharge in the arid northwest of China, such as in the Minqin basin (Edmunds et al., 2006), as well as in the east (Li et al., 2015) and west (Huang et al., 2017) Junggar Basin (Fig. 1a).
4.2.2 CFCs indications
Table 1 shows that groundwater with well depths of 13–150 m contained detectable CFC concentrations (0.17–3.77 pmol L−1 for CFC-11, 0.19–2.18 pmol L−1 for CFC-12, and 0.02–0.38 pmol L−1 for CFC-113) in both the upstream and midstream areas, indicating at least a small fraction of young groundwater components (post-1940). The highest concentration is observed in the UG (G3), south of the fault. The median and the lowest concentrations are observed in the west and east banks, respectively, of the East Main Canal in the MG, north of the fault. In the midstream area (Fig. 2), CFC concentrations generally decrease with well depth south of the reservoirs (G25, G8, and G9), and increase with well depth north of the reservoirs (G15 and G16), which may indicate different groundwater flow paths (e.g. downward or upward flow directions).
Table 2Calculated results for CFC atmospheric partial pressure (pptv), fraction of post-1940 water, modern precipitation recharge year, and mean residence times (EPM, DM, and EMM).
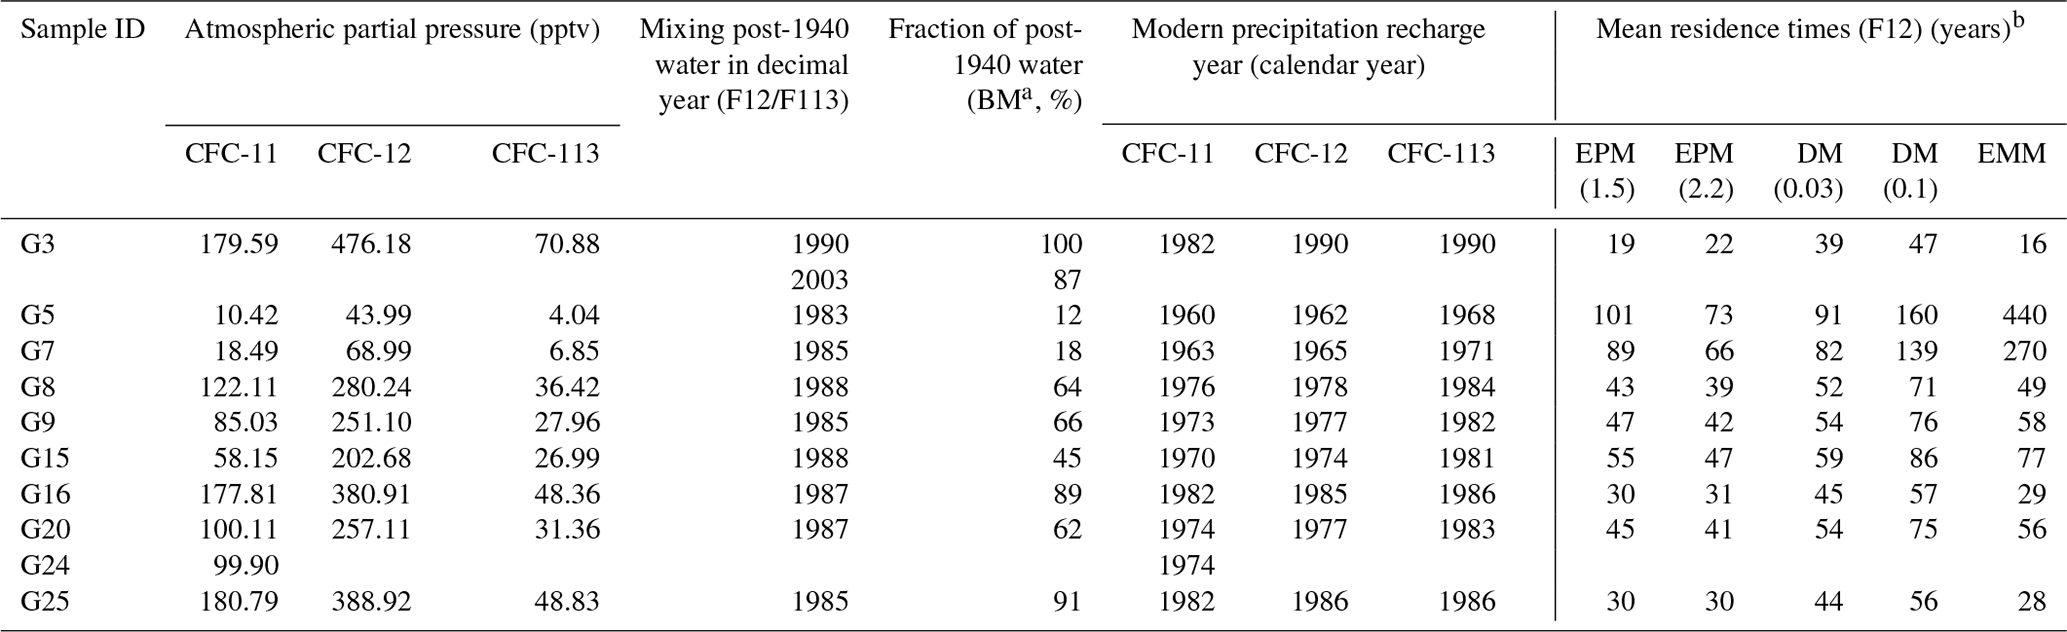
a BM = binary mixing, assuming a mixture of old water with young water (post-1940). b Lumped parameter models: DM = dispersion model with DP (in Eq. 3) of 0.1 and 0.03, EPM = exponential piston flow model with η (in Eq. 2) of 2.2 and 1.5, EMM = exponential mixing model. F12 is short for CFC-12.
The groundwater aerobic environment (Table 1; DO values from 0.7 to 9.8 mg L−1) makes CFC degradation under anoxic conditions unlikely. Nevertheless, CFC-11 has shown a greater propensity for degradation and contamination than CFC-12 (Plummer et al., 2006b); therefore we use CFC-12 to interpret the modern groundwater recharge in the following discussions. The estimated CFC partial pressure and possible recharge year are shown in Table 2 and Fig. 3. The UG (G3) CFC-113 and CFC-12 both indicate the 1990 precipitation recharge (Table 2), most likely as a piston flow recharge in the upstream area. The MG CFC-11-based modern precipitation recharge is in agreement with that based on CFC-12 concentrations within 2–8 years, whereas the CFC-113-based recharge is as much as 4–11 years later than that of the other two, signifying recharge of a mixture of young and old groundwater components in the midstream area. The most recent groundwater recharge is in the upstream area (G3 with 1990 rainfall recharge), which is most likely because the flow paths from recharge sources here are shorter than those of the piedmont groundwater samples in the midstream area.
G5 and G7 are located in the east bank of the East Main Canal in the midstream area and are closer than G15 and G16 north of the reservoir, showing that the modern recharge is much earlier than that of G15 and G16 (Table 2). This can be explained by the lower groundwater velocities in the east bank of the East Main Canal, where the hydraulic gradient (Fig. 2) is much smaller than that in the west. Furthermore, groundwater recharge south of the reservoir (G25, G8, and G9) becomes much earlier with increasing well depth from 48 to 100 m, whereas that north of the reservoir becomes much later with increasing well depth from 23 to 56 m (G15 and G16; Table 2, Fig. 2). The different trends for the relationship between groundwater recharge year and well depth may be due to the different flow paths between the two sites.

Figure 7Plots showing relationships of (a) CFC-113 vs. CFC-12 and (b) CFC-11 vs. CFC-12 in parts per trillion by volume (pptv) for the Northern Hemisphere air. The “+” denotes selected calendar years. The solid lines correspond to the piston flow and the dashed lines show the binary mixing. The shaded regions in (a) indicate no post-1989 waters mixing.
Comparing CFC concentrations helps to identify samples containing young (post-1940) and old (CFC-free) water (Han et al., 2007, 2012; Koh et al., 2012) or exhibiting contamination or degradation (Plummer et al., 2006b). The cross-plot of the concentrations for CFC-113 and CFC-12 (Fig. 7a) demonstrates that all of the groundwater can be characterised as binary mixtures between young and old components, though there is still room for some ambiguity around the crossover in the late 1980s (Darling et al., 2012). As shown in Fig. 7a, all of the MG samples were located in the shaded region, representing no post-1989 water recharge. The UG (G3) sample is clearly relatively modern and seems to have been recharged in 1990 through piston flow or mixed with old water and post-1995 water. Using the method described by Plummer et al. (2006b) with the binary mixing model, the fractions of young water are found to vary from 12 % to 91 % (Table 2) for the MG samples with the relatively low young fractions of 12 % and 18 % in the MG samples from the east bank of the East Main Canal (G5 and G7). These two well water tables are deeper than 40 m, suggesting a relatively slow and deep circulated groundwater flow. This hypothesis is also suggested by the lower DO (3.7–4.6 mg L−1; Table 1) and nitrate concentrations (8.6–9.5 mg L−1 from Ma et al., 2018), and the considerably smaller hydraulic gradient (Fig. 2). Furthermore, a fraction of young water as high as 100 % is obtained from the G3 sample with the recharge water from 1990, and an 87 % fraction is obtained from the binary mixture of post-1989 water and old water (Table 2). The relatively modern recharge for the G3 sample is likewise supported by its high DO (9.8 mg L−1; Table 1) and relatively low nitrate concentration (7.9 mg L−1 from Ma et al., 2018), which represents the contribution of high-altitude recharge rather than old water.
CFC contamination and sorption in the unsaturated zone during recharge considerably influence the interpretation of groundwater recharge. Points off the curves in the cross-plot of CFC concentrations may indicate contamination with CFCs from the urban air during sampling (Carlson et al., 2011; Cook et al., 2006; Mahlknecht et al., 2017) or the degradation or sorption of CFC-11 or CFC-113 (Plummer et al., 2006b). Figure 7 demonstrates that CFC contamination from the urban air, which generally increases CFC concentrations above the global background atmospheric CFC concentrations for the Northern Hemisphere, are unlikely. Elevated CFC concentrations have been reported in the air of urban environments such as Las Vegas, Tucson, Vienna, and Beijing (Barletta et al., 2006; Carlson et al., 2011; Han et al., 2007; Qin et al., 2007), but not in the arid northwest of China (Barletta et al., 2006). Hence, the anomalous ratios of CFC-11 ∕ CFC-12 (Fig. 7b) off the model lines may be attributed to sorption in the unsaturated zone during recharge but not the degradation of CFC-11 (Cook et al., 2006; Plummer et al., 2006b) under anoxic conditions (Table 1; DO values vary from 0.7 to 9.8 mg L−1). Nevertheless, the small deviations (Fig. 7b) indicate a low sorption rate. A higher CFC sorption rate occurs with high clay fraction and high organic matter in soils (Russell and Thompson, 1983), and vice versa (Carlson et al., 2011). Therefore, the hypothesis of a low sorption rate due to the low clay fraction and low organic matter content in the intermountain depression and the piedmont plain (Fig. 1c) is reasonable.
The time lag for CFC transport through the thick unsaturated zone (Cook and Solomon, 1995) and degradation (especially as CFC-11 is common in anaerobic groundwater; Horneman et al., 2008; Plummer et al., 2006b) are both important considerations when interpreting groundwater recharge using CFC concentrations. The time lag for CFC diffusions through the deep unsaturated zone in simple porous aquifers, a function of the tracer solubility in water, tracer diffusion coefficients, and soil water content (Cook and Solomon, 1995), have been widely proved (Darling et al., 2012; Qin et al., 2011). The small differences in CFC-11 and CFC-12 recharge years (Table 2) demonstrate that the time lag should be short in the fault-influenced hydraulic drop alluvium aquifers with the deep unsaturated zone (Fig. 1c). Studies on the MRB (Ma et al., 2018; Zhou, 1992) have shown that groundwater is mainly recharged by fast river leakage in the upstream area and piedmont plain, where the soil texture consists of pebbles and sandy gravel (Fig. 1c). This suggests that the unsaturated zone air CFC closely follows that of the atmosphere, so the recharge time lag through the unsaturated zone is not considered.
4.2.3 3H and 14C indications
Groundwater recharge was determined using 14C activity in groundwater for time intervals from centuries to millennia (Custodio et al., 2018), and 3H has been used for modern precipitation recharge, especially during the nuclear bomb periods (Cook et al., 2017; Huang et al., 2017). Groundwater 3H activity varies from 1.1 to 60 TU (Fig. 4 and Table 1), with the highest value in UG (G4), followed by MG (mean 12.4 TU) and DG (mean 4.5 TU). All of the 3H values in UG (G1, G2, and G4) and G23 (belonging to MG) are higher than 34.3 TU, which indicate input of some fractions of the 1960s precipitation recharge. Groundwater with 3H activity lower than 5.6 TU contains some pre-1950s recharge.
Both 3H and 14C activities show large variations with the distance to the mountainous region along groundwater flow paths in the midstream area (Fig. 8), suggesting recharge over a mixture of short to long timescales. Two different trends for the distribution of 3H activity with distance to the mountainous region (Fig. 8) from the upstream to midstream areas are observed. First, in the upstream area an increase in 3H activity with distance is seen from 41.1 (G1 and G2) to 60 TU (G4), indicating a larger fraction of 1960s precipitation for G4 than for G1 and G2; indeed, as seen in Fig. 2, near-G4 samples exhibited the highest hydraulic gradient values. Second, 3H activity in groundwater in the midstream area show an obvious reduction trend along the Manas River from 37.5 (G23) to 1.1 TU (G14), indicating that more fractions of pre-bomb precipitation recharge may have occurred along the groundwater flow direction north of the fault. Furthermore, 14C activities in the MG show small increases with distance (Fig. 8) from 43.4 to 54.6 pMC, with the exception of sample G12 at approximately 54 km (86.9 pMC with a 14C age of −684 years; modern recharge; Table 1), whereas that in the DG decrease to 23.5 pMC. The presence of detectable 3H (2.9–6.91 TU) in DG with low 14C values (23.5–34.3 pMC) indicates that some mixing with post-bomb precipitation recharge may have occurred.
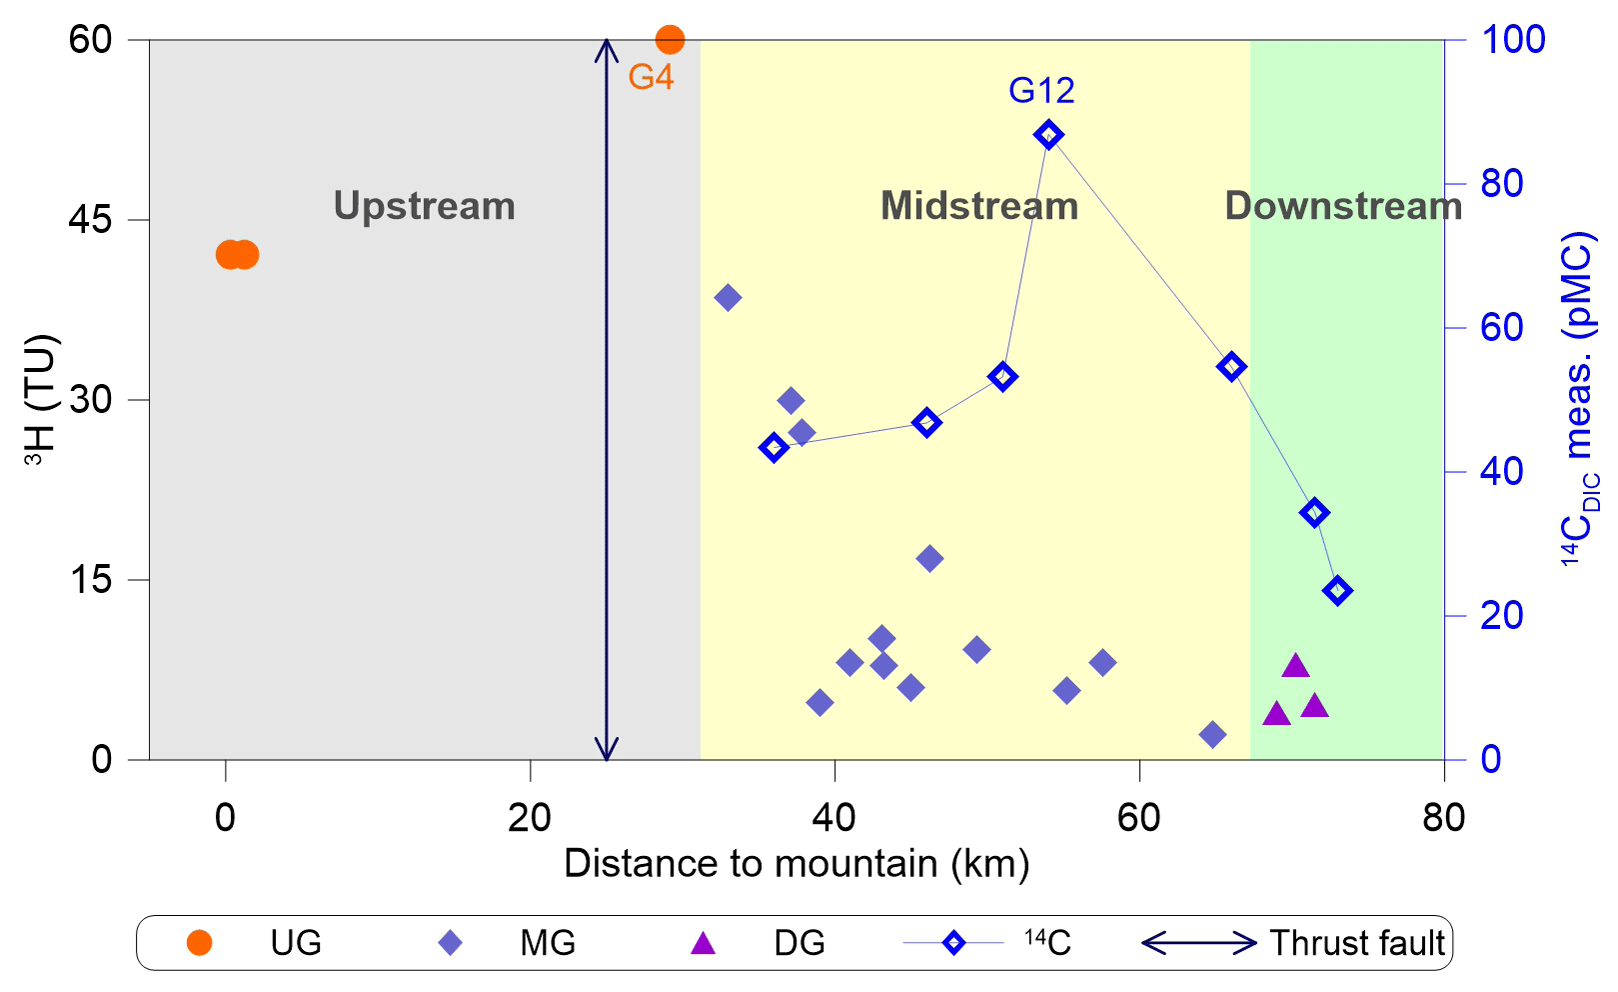
Figure 8Distributions of 3H and 14C activities with distance to the mountain. The shaded regions indicate the upstream, midstream, and downstream of Manas River.
Combined use of CFCs and 3H may help to resolve even more complicated recharge features due to the large difference of the temporal pattern in the input functions between CFCs and 3H. Compared with plots of tracer ratios, tracer–tracer concentration plots have some advantages because they reflect more directly the measured quantities and potential mixtures (Plummer et al., 2006b), such as mixing with irrigation water (Han et al., 2012, 2015; Koh et al., 2012) or young water mixtures in different decades (Han et al., 2007; Qin et al., 2011). The plot of 3H vs. CFC-12 (Fig. 9; CFC-11 and CFC-113 can substitute for CFC-12) shows that some samples (G9, G15, and G20) are slightly above the piston flow line, whereas in Fig. 7a they are away from the piston flow line but on the binary mixing lines. G15 and G20 have the shallowest well depths of 23 and 13 m, respectively. The G9 sample was collected from the piedmont plain near Manas River (Fig. 2), which features pebbles and sandy gravel deposits. This situation may be explained by (i) binary mixing between post-1989 water and older water recharged between 1950 and 1970 that did not contain CFC-free water (pre-1940), or (ii) mixing of two end-members with one end-member containing various mixtures of young (but pre-1989) and old water and the other having post-1989 water. The second explanation requires samples to contain at least some post-bomb fractions from the 1960s (revealed by 3H activities; Fig. 9) and both post-1989 and pre-1940 water, which is not consistent with CFC data (Fig. 7a). If the first explanation is true, the binary mixing hypothesis and the young water (post-1940) fractions in Table 2 for these three samples should be adjusted accordingly.
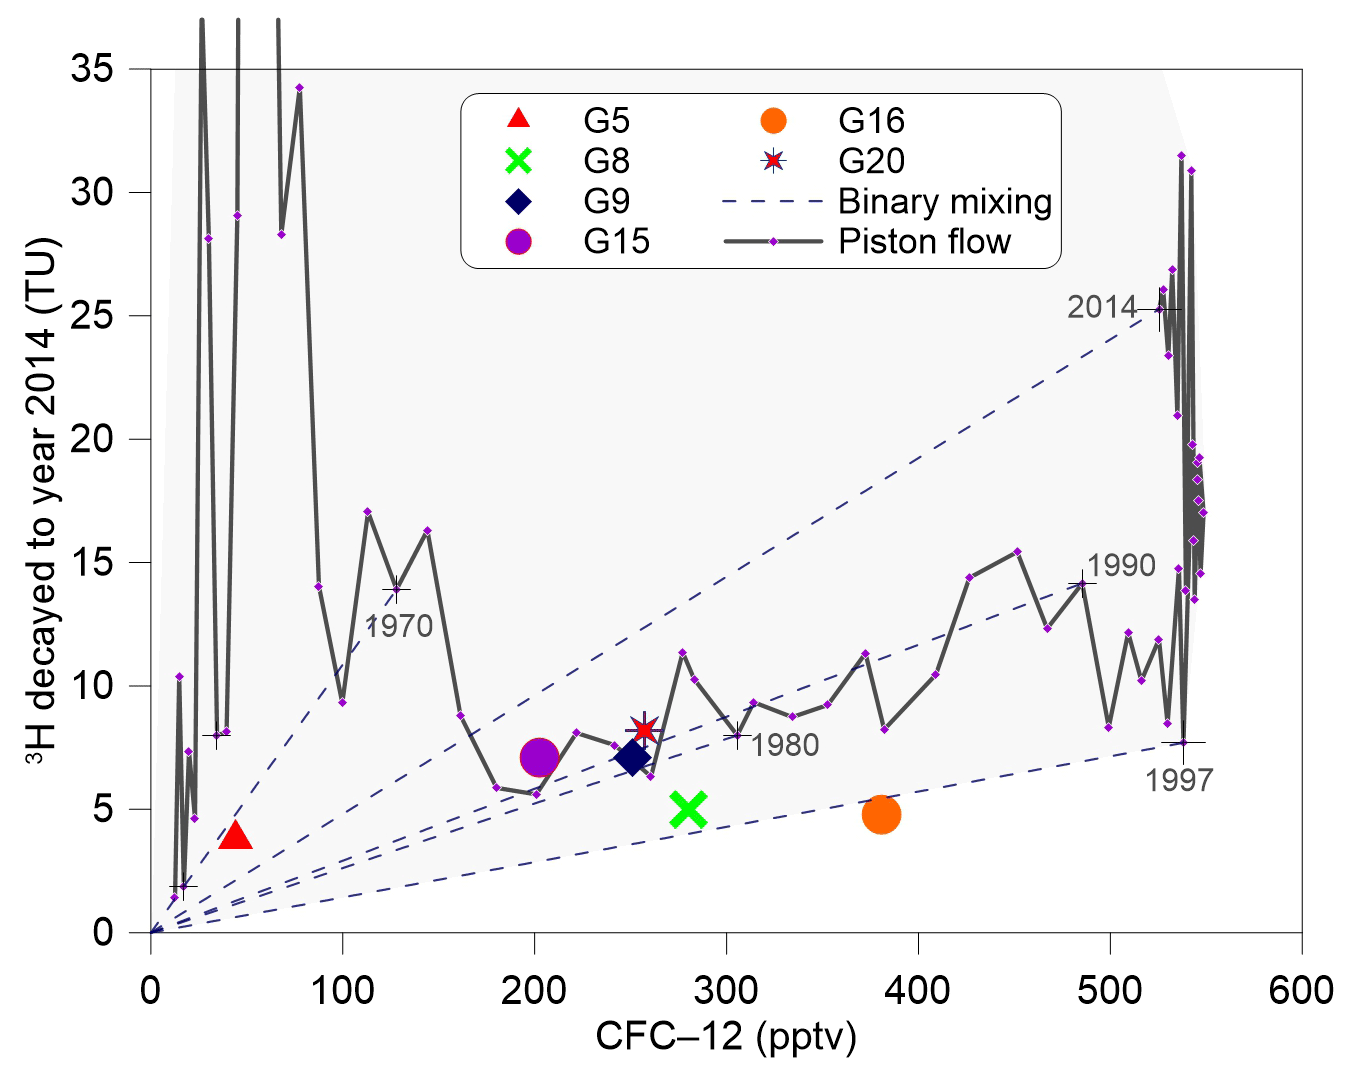
Figure 93H activity (TU) in Urumqi precipitation decayed to 2014 vs. CFC-12 in parts per trillion of volume (pptv) for Northern Hemisphere air. The “+” denotes selected calendar years. The solid lines correspond to the piston flow and the dashed lines show the binary mixing. The shaded region indicates concentrations that could arise due to mixing water of different ages.
Because atmospheric 3H activities have been elevated for a long time, old water components can be identified by 3H activities that are anomalously low compared with those of CFCs (Plummer et al., 2006b). The G5 sample contains very low CFC-113 with a 3H concentration of 3.8 TU (Table 1), indicating that this sample is likely a mixture of the older water (pre-1940) and 1960–1970 water. The low 3H concentration can be attributed to dilution by a high fraction of old water, and thus the “3H bomb peak” cannot be recognised. The G16 sample, outside of the shaded region (Fig. 9), has low 3H but a substantial CFC concentration. This situation may be explained by (i) exposure to the atmosphere before sampling during large water table fluctuations due to groundwater pumping or the addition of excess air to water through the fractured system, or (ii) river water or reservoir water with high CFC concentration but minimal 3H recharge. Furthermore, the relatively high fraction of young water (89 %; Table 2) precludes the dilution effect by old water. Irrigation re-infiltration can cause a shift of CFC concentrations to higher values but does not alter the 3H concentration (Han et al., 2015). However, the relatively low concentration (4.51 mg L−1; data from Ma et al., 2018) of the G16 sample suggested that irrigation re-infiltration did not have a significant effect. Therefore, river or reservoir water with very low concentration (2.7–7.3 mg L−1; data from Ma et al., 2018) recharge is possible.
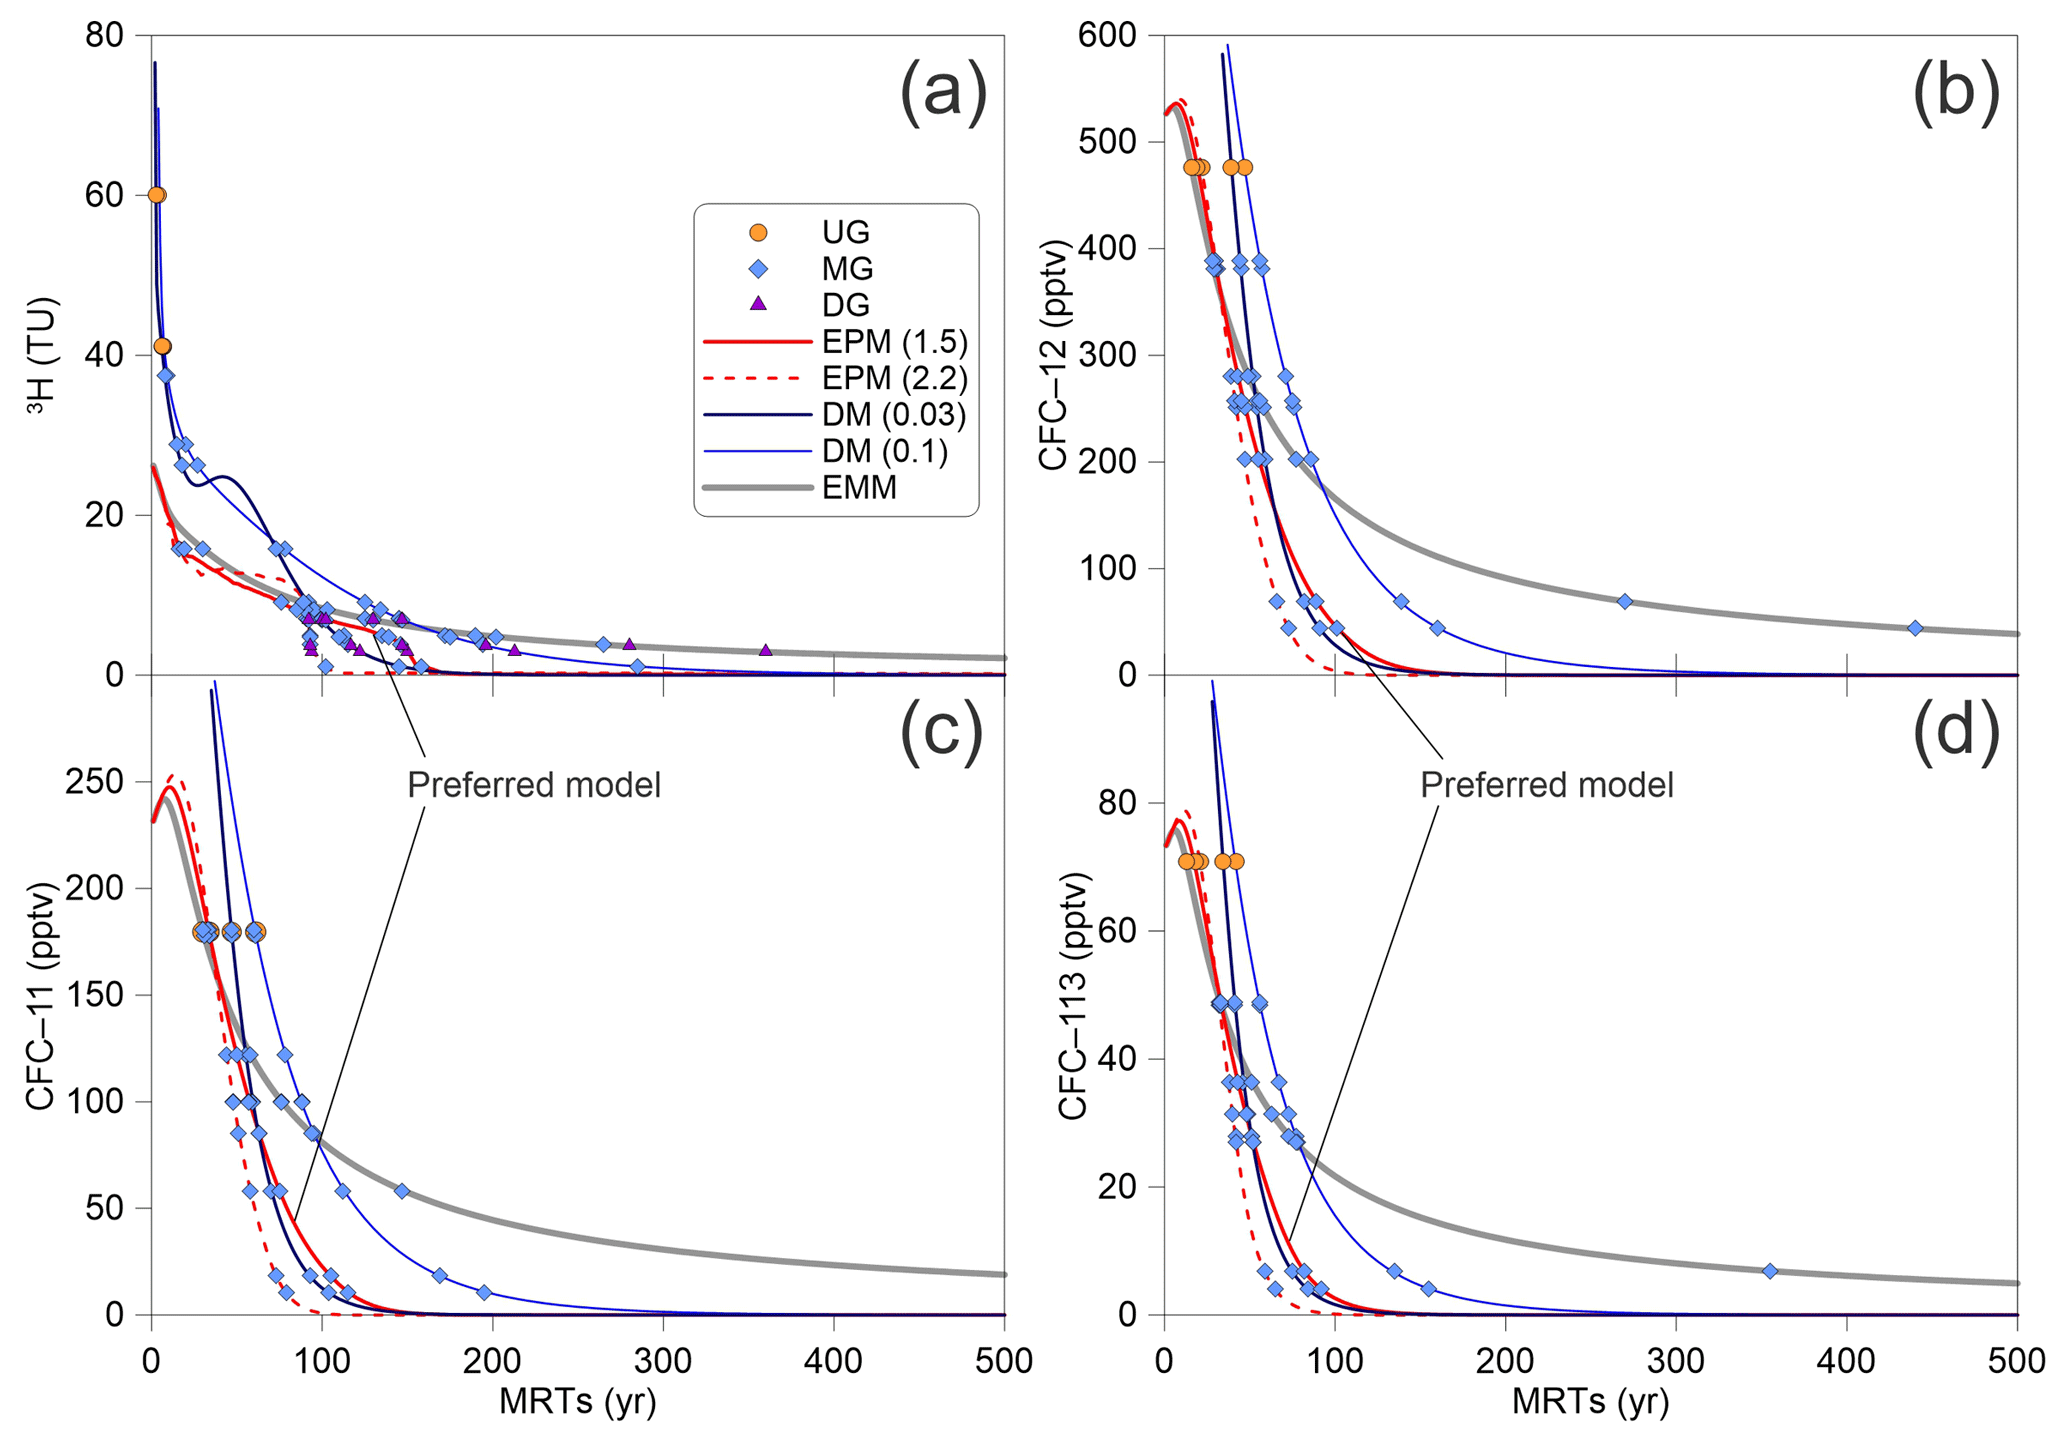
Figure 10Tritium and CFCs (CFC-11, CFC-12, and CFC-113) output vs. mean residence times for different lumped parameter models estimated using Eqs. (2) to (5). The input 3H activity and CFCs concentration are using the estimated 3H activity in precipitation in Urumqi station (Fig. 4) and the Northern Hemisphere atmospheric mixing ratio (Fig. 3), respectively.
4.3 Groundwater mean residence time
4.3.1 3H and CFCs
Residence time distribution functions (Eqs. 3 to 5) are suited to several specific hydrogeological situations (Małoszewski and Zuber, 1982). EPM is particularly useful for the interpretation of MRTs in aquifers that have regions of both exponential and piston flow (Cartwright et al., 2017). The unconfined aquifers adjacent to the rivers (Fig. 1c) are likely to exhibit exponential flow, and the recharge through the unsaturated zone (Fig. 1c) will most likely resemble piston flow (Cartwright and Morgenstern, 2015; Cook and Böhlke, 2000). For the time series of 3H and CFCs inputs, MRTs (Fig. 10) are initially calculated using EPM, with an EPM ratio of 1.5 obtained using Eqs. (2) and (3) (lE in Eq. (3) is determined by adding the intermountain depression to the piedmont plain in Fig. 1c). But the river leakage and rainfall input could have come only from the piedmont plain (Ma et al., 2018); thus a smaller proportion of piston flow in the EPM could give an EPM ratio of 2.2 (lE in Eq. (3) would only be for the piedmont plain in Fig. 1c). The veracity of MRTs is tested by Eqs. (2), (4), and (5) using the DM (DP=0.03 or 0.1) and the EMM. Plots of the output concentrations for 3H (Fig. 10a) and CFCs (CFC-11 in Fig. 10b, CFC-12 in Fig. 10c, and CFC-113 in Fig. 10d) vs. MRTs for different lumped parameter models show that the range of MRTs are wide and correspond positively to the increase in MRTs.
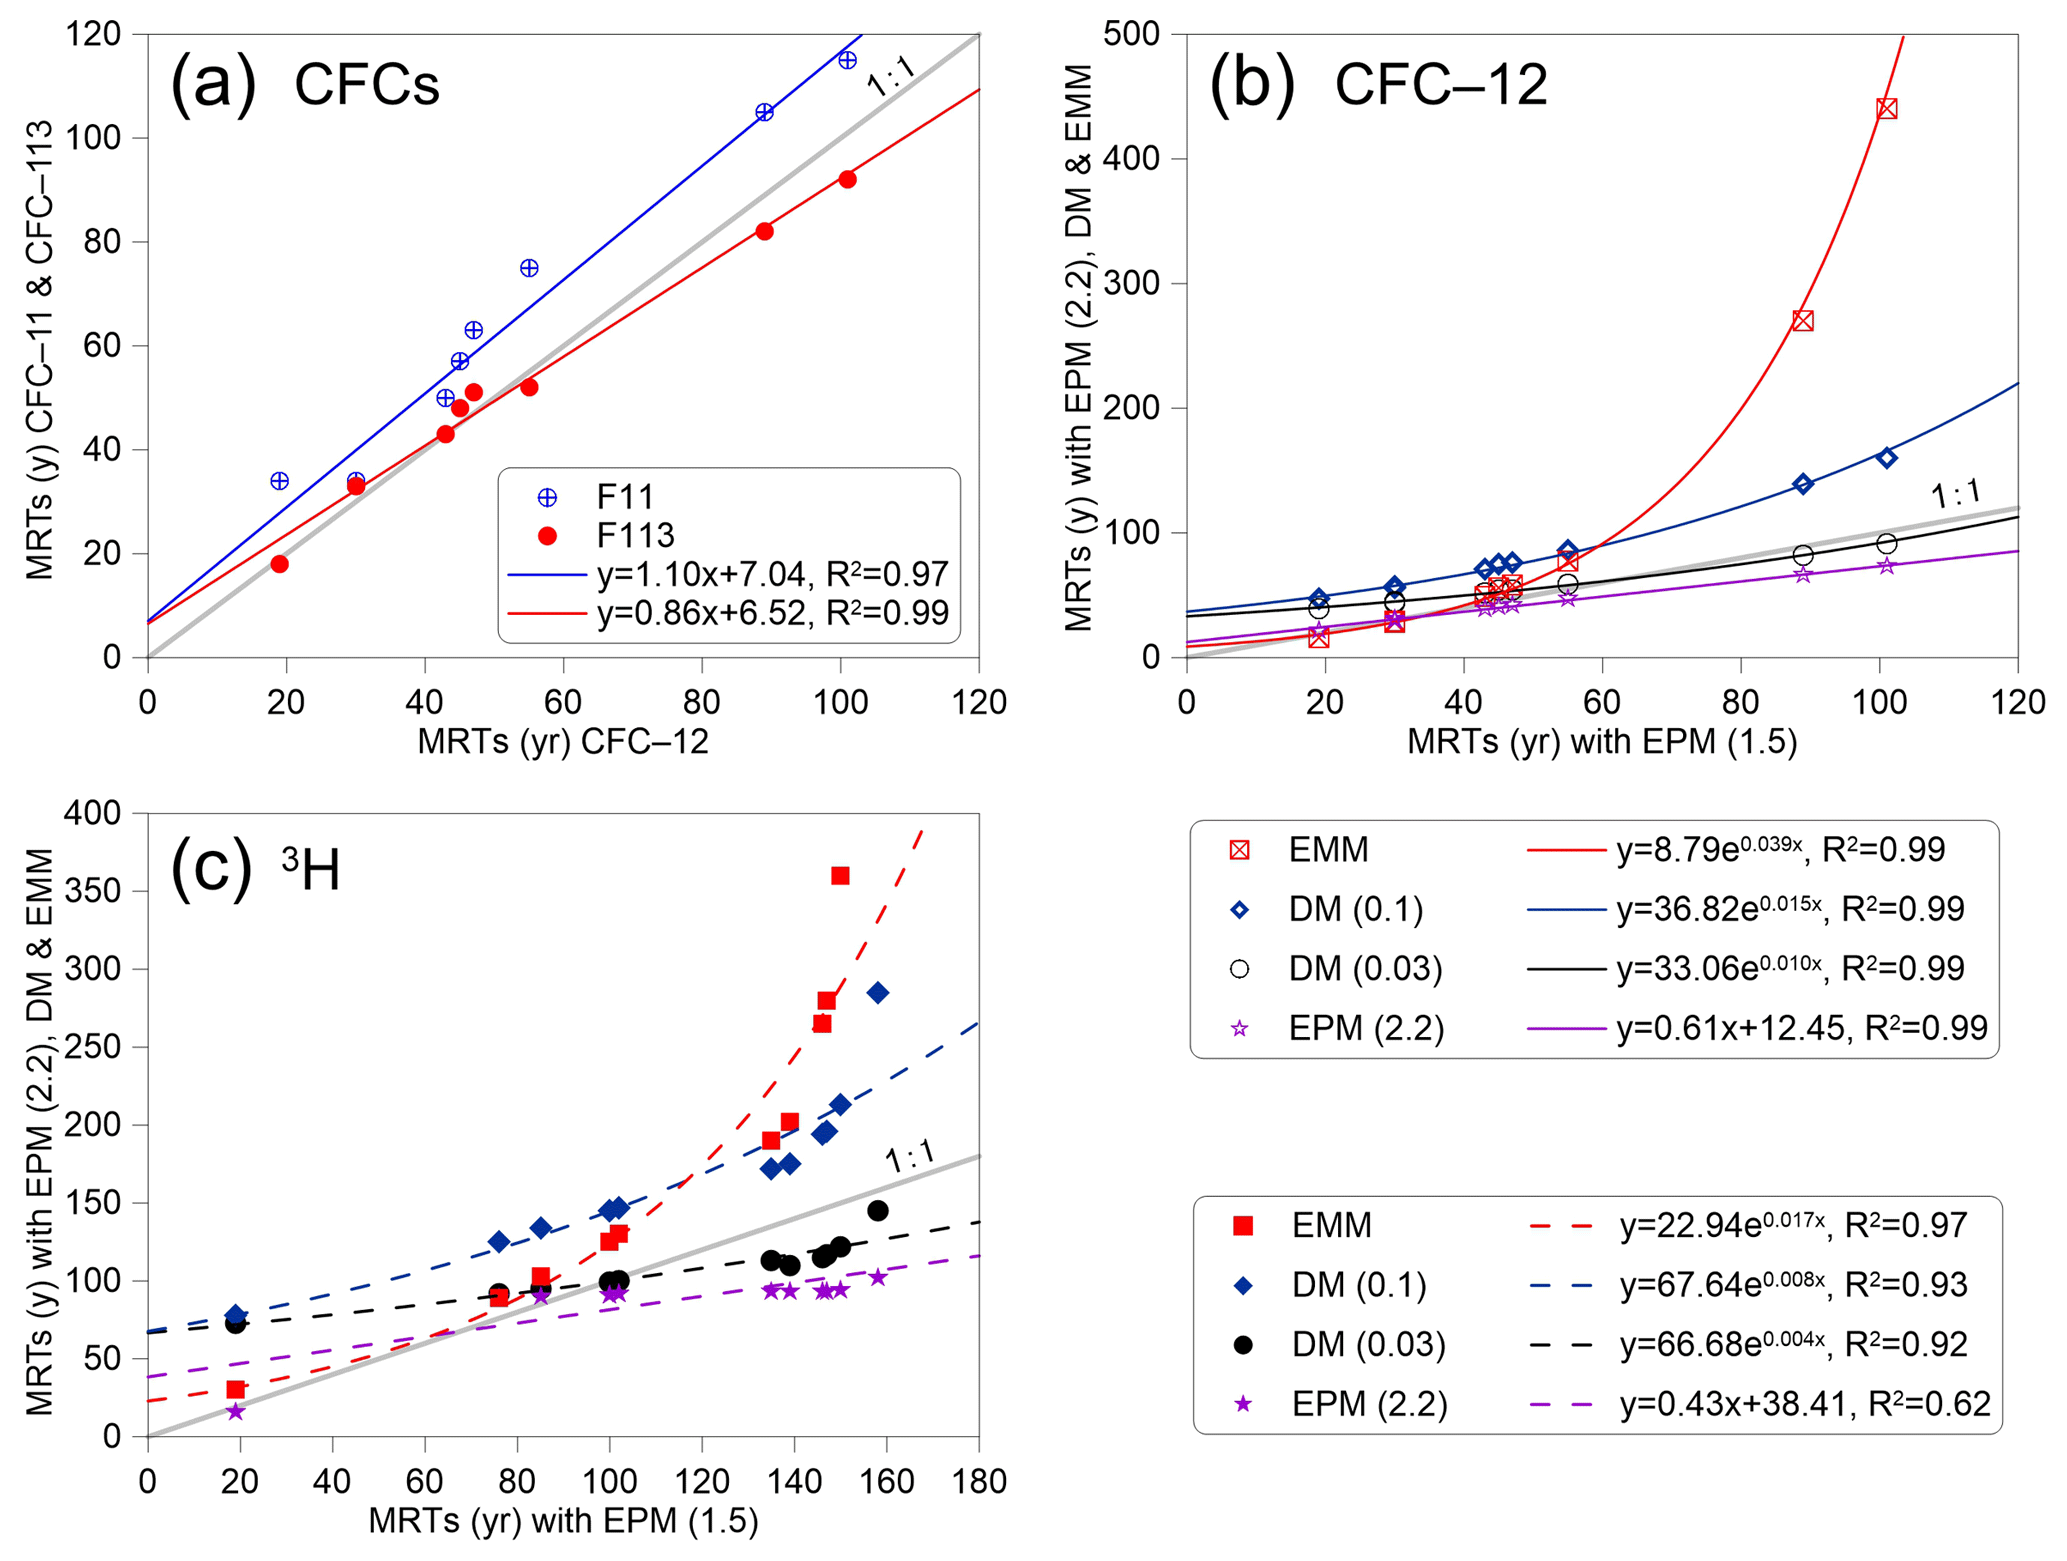
Figure 11(a) Mean residence times (MRTs) for CFC-12 vs. MRTs for CFC-11 and CFC-113 data using the EPM (1.5) model. (b) MRTs for CFC-12 with EPM (1.5) vs. those with other models. (c) MRTs for 3H vs. those with other models.
Figure 11 presents MRTs determined from the time series of 3H and CFC inputs using different lumped parameter models. MRTs obtained from different lumped parameter models tend to become more discretised with the increase in the MRTs themselves. On the other hand, MRTs estimated from the EPM with an EPM ratio of 1.5 in Fig. 11a vary from 19 to 101 years (median: 51 years) for the CFC-12 rainfall input, 33 to 115 years (median: 62.3 years) for the CFC-11 rainfall input, and 18 to 92 years (median: 50.2 years) for the CFC-113 rainfall input. Good linear relationships for MRTs between the different CFCs rainfall inputs are obtained using the same EPM (EPM 1.5 in Fig. 11a and EPM 2.2 in Fig. 11b). MRTs increase when the EPM ratios decrease from 2.2 to 1.5 in Fig. 11b, implying that the groundwater flow paths recharged from the intermountain depression are much longer. MRTs in the UG, the west and east banks of the East Main Canal of MG are estimated from the different lumped parameter models with different CFC-12 concentrations in Figs. 2 and 11b. The mean values of MRTs in the UG and the west bank of the East Main Canal of MG vary from 28.6 to 64.8 years, and in the east bank of the East Main Canal of MG vary from 129.2 to 173 years. It is seen that the mean values of MRTs in the east bank of the East Main Canal of MG have larger differences than those in the UG and in the west bank of the East Main Canal of MG (see Figs. 2 and 11b, and Table 2). Overall, the youngest value is observed in the G3 sample on the south side of the fault, and the oldest value is observed in the G5 sample on the east bank of the East Main Canal in Fig. 2.

Figure 12(a) pH and silica (SiO2) and (b) sulfate (), bicarbonate (), and total dissolved solids (TDS) vs. mean residence times (MRTs). The MRTs are from CFC-12 data using the EPM (1.5) model. The dashed red line in (a) is from Morgenstern et al. (2015).
It is seen from Fig. 11 that MRTs determined from the time series of 3H inputs have larger uncertainties and wider ranges than those from CFCs. For EPM with an EPM ratio of 1.5, MRTs estimated from the time series 3H inputs vary from 19 to 158 years with a median of 112.2 years (Fig. 11c), which are much longer than those calculated from the CFCs inputs by the same model (Fig. 11b). The reason is that the travel times through the thick unsaturated zone for 3H are much longer than those for CFCs. 3H moves principally in the liquid phase, whereas CFCs travel in the gas phase through the unsaturated zone (Cook and Solomon, 1995). The transport in the gas phase is more rapid than that in the liquid phase in the unsaturated zone, which is expected to give rise to longer residence times from 3H than those determined from CFCs (Cook, et al., 2017). Furthermore, the ranges of MRTs estimated from EPM, DM, and EMM are 16–158 years, 72–285 years, and 30–360 years, respectively. The uncertainties will increase when MRTs increase among different models, especially for MRTs that are higher than 130 years (Fig. 11c), which mainly exist in the DG and the east bank of the East Main Canal of MG.
Groundwater MRTs in the west bank of the East Main Canal show an overall increasing trend with the distance to the mountain in MG and DG (Fig. 11b, c). It has been proven that much longer as well as much deeper flow paths usually give rise to much longer MRTs (Cartwright and Morgenstern, 2015, 2016; McGuire et al., 2005). On the other hand, groundwater MRTs in the east bank of the East Main Canal are much longer than those in the west bank. As shown in Fig. 2, this phenomenon can partly be ascribed to the relatively short distance to the mountain and much smaller hydraulic gradient in the west bank. Previous studies pointed out that groundwater MRTs would vary on account of the interplay of factors, like the uncertainties of the input concentrations and different models (Cartwright and Morgenstern, 2015, 2016), and mixing and dispersion in the subsurface flow systems. Moreover, the assumption of the homogeneous aquifer with a simple geometry may result in significantly different MRTs that are calculated by lumped parameter models to the actual MRTs (Cartwright et al., 2017; Kirchner, 2016; Stewart et al., 2017). Nevertheless, the homogeneous aquifers, being at steady state, justify the use of lumped parameter models to calculate MRTs in this study.
4.3.2 Hydrochemistry evolution
Strong correlations between hydrochemical components and groundwater age permit their use as proxies for, or complementary to, age via previously established relationships in similar lithological conditions. For example, an excellent correlation between silica (SiO2) and MRTs (R2=0.997) has been reported (Morgenstern et al., 2010), which was much better than in Fig. 12 and in other results (Morgenstern et al., 2015). SiO2 (Fig. 12a), sulfate (), bicarbonate (), and TDS (Fig. 12b) all show good correlations with groundwater age, indicating that mineral dissolutions through water–rock interactions dominate hydrochemical changes (Ma et al., 2018), and major ion concentrations increase with groundwater age. However, MRTs determined by the time series of 3H inputs show poor correlations with the ions (data not shown). Moreover, the lithology type that the groundwater flows through within the aquifer and the likely evolutionary path ways play important roles in the hydrochemical compositions. The negative saturation indices with respect to gypsum (Ma et al., 2018) indicate that the high concentrations (Fig. 12b) are due to gypsum dissolution in the Tertiary stratum. It is also of note that high can originate from geothermal water (Morgenstern et al., 2015), in contrast to studies such as Guo et al. (2014) and Guo et al. (2017), and can be biased due to anoxic reduction. However, the groundwater in this study have relatively low temperatures and aerobic environment (Table 1), making the two cases above unlikely.
The combination of hydrochemistry concentrations and groundwater age data is also a powerful tool for investigating the groundwater flow processes and flow-through conditions (McGuire and McDonnell, 2006; Morgenstern et al., 2010, 2015), and for identifying the natural groundwater evolution and the impact of anthropogenic contaminants (Morgenstern et al., 2015; Morgenstern and Daughney, 2012). The pH of the groundwater decreases from 10.1 to 8.6 over the age range from 19 to 101 years, with a log law fit of pH , R2=0.65 (Fig. 12a). In contrast, a trend of increasing pH with increasing groundwater age has been reported in New Zealand (the dashed red line shown in Fig. 12a; Morgenstern et al., 2015), where pH values were all less than 7.2. These two discrepant trends can be explained by the relationship between pH and concentrations in water (inserted plot in Fig. 12a). The pH increases with increasing concentration only when the pH is less than 8.34; otherwise it decreases with increasing concentrations. Therefore, the trend of increasing concentrations with increasing groundwater age (Fig. 12b) in this study supports the decreasing trend for the pH (from 10.1 to 8.6).
The soda waters with an overall pH higher than 8.1 (Table 1) are in disequilibrium with primary rock-forming minerals of the host rocks. The incongruent dissolutions of the albite and anorthite through hydrolysis reaction are as follows:
where all chemical components of albite and anorthite are released into the solution phase and produce OH− with simultaneous precipitation of kaolinite. A trend of increasing pH with well depth (Table 1) suggests that groundwater whose pH is lower than 9 is likely recharged by CO2-containing water, because OH− generally interacts with CO2 and organic acids in the soil to form (Wang et al., 2009). Similarly, the trend of decreasing pH with increasing MRTs (Fig. 12a) indicates that groundwater with much longer MRTs contains much higher CO2 concentrations, which seems to suggest an anthropogenic input. The nitrate () concentrations vary from 4.5 to 20.2 mg L−1 with a median of 12.2 mg L−1 (data not shown), which exceed the natural nitrate concentration in groundwater of 5–7 mg L−1 (Appelo and Postma, 2005). The development of the plough after the 1950s, N–NO3 fertiliser (with low 87Sr∕86Sr ratios; Ma et al., 2018), and the extensive groundwater withdrawal for irrigation (Ji, 2016) suggest that irrigation infiltration can account for the high groundwater concentrations in the piedmont plain. On the other hand, little irrigation infiltration was observed in the downstream area with groundwater concentrations of less than 5 mg L−1 (Ma et al., 2018) due to the water-saving irrigation style, which does not contribute to groundwater recharge in the arid northwest of China.
In this study, we used environmental tracers and hydrochemistry to identify the modern and paleo-meteoric recharge sources, to constrain the different end-members mixing ratios, and to study the mixed groundwater MRTs in fault-influenced hydraulic drop alluvium aquifer systems. The aquifer below the Manas River downstream area is recharged by the paleo-meteoric precipitation instead of the lateral flow from higher-elevation regions. The relatively modern groundwater with young (post-1940) water fractions of 87 %–100 % is obtained on the south side of the fault, indicating only a small mixing ratio between old and young water. The concentration (7.86 mg L−1) is higher than the natural level; this, together with the short MRTs (19 years) on the south side of the fault (headwater area), implies the contribution of modern contaminants. This finding requires particular attention since the headwater is used as the domestic water supply for local communities. The young water fractions of 12 % to 91 % are widespread on the north side of the fault, suggesting that mixing between water of different ages may occur within the aquifer or pumping from the different depths of long-screened boreholes. Furthermore, the mixing diversity is highlighted by the substantial water table fluctuations during groundwater pumping, vertical recharge through the thick unsaturated zone, and different young water inputs in different decades. The strong correlations between the groundwater MRTs and the hydrochemical concentrations enable a first-order proxy for MRTs of 19 to 101 years in the fault-influenced hydraulic drop alluvium aquifers. In addition, this study reveals that MRTs estimated by CFCs are more appropriate to be used as an age proxy than those estimated by 3H in the arid Manas River Basin, which has a thick unsaturated zone.
The data are available upon request.
XL and JL were responsible for the 3H and 14C analyses. BM undertook the sampling program and oversaw the analysis of the hydrochemistry and CFCs. BM and MJ prepared the paper.
The authors declare that they have no conflict of interest.
This research was financially supported by the National Natural Science
Foundation of China (no. U1403282 and no. 41807204). The authors would like
to thank Yunquan Wang for the valuable discussions and suggestions for
this paper. We wish to thank Xumei Mao, Dajun Qin, and Yalei Liu
for sampling and laboratory works. We also wish to thank the editor and
anonymous referees for their valuable suggestions and insightful
comments.
Edited by: Christine Stumpp
Reviewed by: Michael Stewart and one anonymous referee
Aggarwal, P. K.: Introduction, in: Isotope Methods for Dating Old Groundwater, edited by: Suckow, A., Aggarwal, P. K., and Araguas-Araguas, L., International Atomic Energy Agency, Vienna, Austria, 1–4, 2013.
Appelo, C. A. J. and Postma, D.: Geochemistry, groundwater and pollution, 2nd ed., Balkema, Dordrecht, Netherlands, 2005.
Atkinson, A. P., Cartwright, I., Gilfedder, B. S., Cendón, D. I., Unland, N. P., and Hofmann, H.: Using 14C and 3H to understand groundwater flow and recharge in an aquifer window, Hydrol. Earth Syst. Sci., 18, 4951–4964, https://doi.org/10.5194/hess-18-4951-2014, 2014.
Barletta, B., Meinardi, S., Simpson, I. J., Rowland, F. S., Chan, C. Y., Wang, X., Zou, S., Chan, L. Y., and Blake, D. R.: Ambient halocarbon mixing ratios in 45 Chinese cities, Atmos. Environ., 40, 7706–7719, https://doi.org/10.1016/j.atmosenv.2006.08.039, 2006.
Batlle-Aguilar, J., Banks, E. W., Batelaan, O., Kipfer, R., Brennwald, M. S., and Cook, P. G.: Groundwater residence time and aquifer recharge in multilayered, semi-confined and faulted aquifer systems using environmental tracers, J. Hydrol., 546, 150–165, https://doi.org/10.1016/j.jhydrol.2016.12.036, 2017.
Benettin, P., Volkmann, T. H. M., von Freyberg, J., Frentress, J., Penna, D., Dawson, T. E., and Kirchner, J. W.: Effects of climatic seasonality on the isotopic composition of evaporating soil waters, Hydrol. Earth Syst. Sci., 22, 2881–2890, https://doi.org/10.5194/hess-22-2881-2018, 2018.
Beyer, M., Jackson, B., Daughney, C., Morgenstern, U., and Norton, K.: Use of hydrochemistry as a standalone and complementary groundwater age tracer, J. Hydrol., 543, 127–144, https://doi.org/10.1016/j.jhydrol.2016.05.062, 2016.
Carlson, M. A., Lohse, K. A., McIntosh J. C., and McLain, J. E. T.: Impacts of urbanization on groundwater quality and recharge in a semi-arid alluvial basin, J. Hydrol., 409, 196–211, https://doi.org/10.1016/j.jhydrol.2011.08.020, 2011.
Cartwright, I. and Morgenstern, U.: Transit times from rainfall to baseflow in headwater catchments estimated using tritium: the Ovens River, Australia, Hydrol. Earth Syst. Sci., 19, 3771–3785, https://doi.org/10.5194/hess-19-3771-2015, 2015.
Cartwright, I. and Morgenstern, U.: Contrasting transit times of water from peatlands and eucalypt forests in the Australian Alps determined by tritium: implications for vulnerability and the source of water in upland catchments, Hydrol. Earth Syst. Sci., 20, 4757–4773, https://doi.org/10.5194/hess-20-4757-2016, 2016.
Cartwright, I., Cendón, D., Currell, M., and Meredith, K.: A review of radioactive isotopes and other residence time tracers in understanding groundwater recharge: Possibilities, challenges, and limitations, J. Hydrol., 555, 797–811, https://doi.org/10.1016/j.jhydrol.2017.10.053, 2017.
Cartwright, I., Irvine, D., Burton, C., and Morgenstern, U.: Assessing the controls and uncertainties on mean transit times in contrasting headwater catchments, J. Hydrol., 557, 16–29, https://doi.org/10.1016/j.jhydrol.2017.12.007, 2018.
Chen, Z., Qi, J., Xu, J., X, J., Ye, H., and Nan, Y.: Paleoclimatic interpretation of the past 30 ka from isotopic studies of the deep confined aquifer of the North China Plain, Appl. Geochem., 18, 997–1009, https://doi.org/10.1016/S0883-2927(02)00206-8, 2003.
Clark, I. D. and Fritz, P.: Environmental Isotopes in Hydrogeology, Lewis, New York, USA, 1997.
Cook, P. G. and Böhlke, J. K.: Determining timescales for groundwater flow and solute transport, in: Environmental Tracers in Subsurface Hydrology, edited by: Cook, P. G. and Herczeg, A. L., Kluwer, Boston, Netherlands, 1–30, 2000.
Cook, P. G. and Solomon, D. K.: Transport of atmospheric tracer gases to the water table: Implications for groundwater dating with chlorofluorocarbons and krypton 85, Water Resour. Res., 31, 263–270, https://doi.org/10.1029/94WR02232, 1995.
Cook, P. G., Plummer, L. N., Solomon, D. K., Busenberg, E., and Han, L. F.: Effects and processes that can modify apparent CFC age, in: Use of Chlorofluorocarbons in Hydrology: A Guidebook, edited by: Gröning, M., Han, L. F., and Aggarwal, P., International Atomic Energy Agency, Vienna, Austria, 31–58, 2006.
Cook, P., Dogramaci, S., McCallum, J., and Hedley, J.: Groundwater age, mixing and flow rates in the vicinity of large open pit mines, Pilbara region, northwestern Australia, Hydrogeol. J., 25, 39–53, https://doi.org/10.1007/s10040-016-1467-y, 2017.
Craig, H.: Isotopic variations in meteoric waters, Science, 133, 1702–1703, https://doi.org/10.1126/science.133.3465.1702, 1961.
Cui, W. G., Mu, G. J., Wen, Q., and Yue, J.: Evolution of alluvial fans and reaction to the regional activity at rage front of Manas River Valley, Res. Soil Water Conserv., 14, 161–163, 2007.
Custodio, E., Jódar, J., Herrera, C., Custodio-Ayala, J., and Medina, A.: Changes in groundwater reserves and radiocarbon and chloride content due to a wet period intercalated in an arid climate sequence in a large unconfined aquifer, J. Hydrol., 556, 427–437, https://doi.org/10.1016/j.jhydrol.2017.11.035, 2018.
Dansgaard, W.: Stable isotopes in precipitation, Tellus, 16, 436–468, https://doi.org/10.1111/j.2153-3490.1964.tb00181.x, 1964.
Darling, W. G., Gooddy, D. C., MacDonald, A. M., and Morris, B. L.: The practicalities of using CFCs and SF6 for groundwater dating and tracing, Appl. Geochem., 27, 1688–1697, https://doi.org/10.1016/j.apgeochem.2012.02.005, 2012.
Dawson, T. E. and Ehleringer, J. R.: Streamside trees do not use stream water, Nature, 350, 335–337, 1991.
de Dreuzy, J. R. and Ginn, T. R.: Residence times in subsurface hydrological systems, introduction to the Special Issue, J. Hydrol., 543, 1–6, https://doi.org/10.1016/j.jhydrol.2016.11.046, 2016.
Edmunds, W. M., Ma, J., Aeschbach-Hertig, W., Kipfer, R., and Darbyshire, D. P. F.: Groundwater recharge history and hydrogeochemical evolution in the Minqin Basin, North West China, Appl. Geochem., 21, 2148–2170, https://doi.org/10.1016/j.apgeochem.2006.07.016, 2006.
Gleeson, T., Befus, K. M., Jasechko, S., Luijendijk, E., and Cardenas, M. B.: The global volume and distribution of modern groundwater, Nat. Geosci., 9, 161–167, https://doi.org/10.1038/NGEO2590, 2016.
Green, C. T., Jurgens, B. C., Zhang, Y., Starn, J. J., Singleton, M. J., and Esser, B. K.: Regional oxygen reduction and denitrification rates in groundwater from multi-model residence time distributions, San Joaquin Valley, USA, J. Hydrol., 543, 155–166, https://doi.org/10.1016/j.jhydrol.2016.05.018, 2016.
Guo, H., Wen, D., Liu, Z., Jia, Y., and Guo, Q.: A review of high arsenic groundwater in Mainland and Taiwan, China: Distribution, characteristics and geochemical processes, Appl. Geochem., 41, 196–217, https://doi.org/10.1016/j.apgeochem.2013.12.016, 2014.
Guo, Q., Planer-Friedrich, B., Liu, M., Li, J., Zhou, C., and Wang, Y.: Arsenic and thioarsenic species in the hot springs of the Rehai magmatic geothermal system, Tengchong volcanic region, China, Chem. Geol., 453, 12–20, https://doi.org/10.1016/j.chemgeo.2017.02.010, 2017.
Han, L., Hacker, P., and Gröning, M.: Residence times and age distributions of spring waters at the Semmering catchment area, Eastern Austria, as inferred from tritium, CFCs and stable isotopes, Isot. Environ. Healt. S., 43, 31–50, https://doi.org/10.1080/10256010601154015, 2007.
Han, D., Song, X., Currell, M. J., Cao, G., Zhang, Y., and Kang, Y.: A survey of groundwater levels and hydrogeochemistry in irrigated fields in the Karamay Agricultural Development Area, northwest China: Implications for soil and groundwater salinity resulting from surface water transfer for irrigation, J. Hydrol., 405, 217–234, https://doi.org/10.1016/j.jhydrol.2011.03.052, 2011.
Han, D. M., Song, X. F., Currell, M. J., and Tsujimura, M.: Using chlorofluorocarbons (CFCs) and tritium to improve conceptual model of groundwater flow in the South Coast Aquifers of Laizhou Bay, China, Hydrol. Process., 26, 3614–3629, https://doi.org/10.1002/hyp.8450, 2012.
Han, D., Cao, G., McCallum, J., and Song, X.: Residence times of groundwater and nitrate transport in coastal aquifer systems: Daweijia area, northeastern China, Sci. Total Environ., 538, 539–554, https://doi.org/10.1016/j.scitotenv.2015.08.036, 2015.
Horneman, A., Stute, M., Schlosser, P., Smethie Jr., W., Santella, N., Ho, D. T., Mailloux, B., Gorman, E., Zheng, Y., and van Geen, A.: Degradation rates of CFC-11, CFC-12 and CFC-113 in anoxic shallow aquifers of Araihazar Bangladesh, J. Contam. Hydrol., 97, 27–41, https://doi.org/10.1016/j.jconhyd.2007.12.001, 2008.
Hrachowitz, M., Soulsby, C., Tetzlaff, D., Dawson, J. J. C., Dunn, S. M., and Malcolm, I. A.: Using long-term data sets to understand transit times in contrasting headwater catchments, J. Hydrol., 367, 237–248, https://doi.org/10.1016/j.jhydrol.2009.01.001, 2009.
Huang, T., Pang, Z., Li, J., Xiang, Y., and Zhao, Z.: Mapping groundwater renewability using age data in the Baiyang alluvial fan, NW China, Hydrogeol. J., 25, 743–755, https://doi.org/10.1007/s10040-017-1534-z, 2017.
Jelinowska, A., Tucholka, P., Gasse, F., and Fontes, J. C.: Mineral magnetic record of environment in Late Pleistocene and Holocene sediments, Lake Manas, Xinjiang, China, Geophys. Res. Lett., 22, 953–956, https://doi.org/10.1029/95GL00708, 1995.
Ji, L.: Using stable hydrogen and oxygen isotope to research the conversion relationship of surface water and groundwater in Manas River Basin, MS thesis, Shihezi University, China, 58 pp., 2016.
Jurgens, B. C., Böhlke, J. K., and Eberts, S. M.: TracerLPM (Version 1): An Excel® workbook for interpreting groundwater age distributions from environmental tracer data: U.S. Geological Survey Techniques and Methods Report 4–F3, Reston, USA, 60 pp., 2012.
Kirchner, J. W.: Aggregation in environmental systems – Part 1: Seasonal tracer cycles quantify young water fractions, but not mean transit times, in spatially heterogeneous catchments, Hydrol. Earth Syst. Sci., 20, 279–297, https://doi.org/10.5194/hess-20-279-2016, 2016.
Kirchner, J. W., Tetzlaff, D., and Soulsby C.: Comparing chloride and water isotopes as hydrological tracers in two Scottish catchments, Hydrol. Process., 24, 1631–1645, https://doi.org/10.1002/hyp.7676, 2010.
Koh, D. C., Ha, K., Lee, K. S., Yoon, Y. Y., and Ko, K. S.: Flow paths and mixing properties of groundwater using hydrogeochemistry and environmental tracers in the southwestern area of Jeju volcanic island, J. Hydrol., 432–433, 61–74, https://doi.org/10.1016/j.jhydrol.2012.02.030, 2012.
Kong, Y. and Pang, Z.: A positive altitude gradient of isotopes in the precipitation over the Tianshan Mountains: Effects of moisture recycling and sub-cloud evaporation, J. Hydrol., 542, 222–230, https://doi.org/10.1016/j.jhydrol.2016.09.007, 2016.
Li, J., Pang, Z., Froehlich, K., Huang, T., Kong, Y., Song, W., and Yun, H.: Paleo-environment from isotopes and hydrochemistry of groundwater in East Junggar Basin, Northwest China, J. Hydrol., 529, 650–661, https://doi.org/10.1016/j.jhydrol.2015.02.019, 2015.
Ma, B., Liang, X., Jin, M., Li, J., and Niu, H.: Characteristics of fractionation of hydrogen and oxygen isotopes in evaporating water in the typical region of the North China Plain, Adv. Water Sci., 26, 639–648, 2015.
Ma, B., Liang, X., Liu, S., Jin, M., Nimmo, J. R., and Li, J.: Evaluation of diffuse and preferential flow pathways of infiltrated precipitation and irrigation using oxygen and hydrogen isotopes, Hydrogeol. J., 25, 675–688, https://doi.org/10.1007/s10040-016-1525-5, 2017.
Ma, B., Jin, M., Liang, X., and Li, J.: Groundwater mixing and mineralization processes in a mountain–oasis–desert basin, northwest China: hydrogeochemistry and environmental tracer indicators, Hydrogeol. J., 26, 233–250, https://doi.org/10.1007/s10040-017-1659-0, 2018.
Mahlknecht, J., Hernández-Antonio, A., Eastoe, C. J., Tamez-Meléndez, C., Ledesma-Ruiz, R., Ramos-Leal, J. A., and Ornelas-Soto, N.: Understanding the dynamics and contamination of an urban aquifer system using groundwater age (14C, 3H, CFCs) and chemistry, Hydrol. Process., 31, 2365–2380, https://doi.org/10.1002/hyp.11182, 2017.
Małoszewski, P.: Lumped–parameter models as a tool for determining the hydrological parameters of some groundwater systems based on isotope data, IAHS–AISH Publication, 262, 271–276, 2000.
Małoszewski, P. and Zuber, A.: Determining the turnover time of groundwater systems with the aid of environmental tracers, 1. Models and their applicability, J. Hydrol., 57, 207–231, https://doi.org/10.1016/0022-1694(82)90147-0, 1982.
McGuire, K. J. and McDonnell, J. J.: A review and evaluation of catchment transit time modeling, J. Hydrol., 330, 543–563, https://doi.org/10.1016/j.jhydrol.2006.04.020, 2006.
McGuire, K. J., McDonnell, J. J., Weiler, M., Kendall, C., McGlynn, B. L., Welker, J. M., and Seibert, J.: The role of topography on catchment-scale water residence time, Water Resour. Res., 41, 302–317, https://doi.org/10.1029/2004WR003657, 2005.
Morgenstern, U. and Daughney, C. J.: Groundwater age for identification of baseline groundwater quality and impacts of land-use intensification – The National Groundwater Monitoring Programme of New Zealand, J. Hydrol., 456–457, 79–93, https://doi.org/10.1016/j.jhydrol.2012.06.010, 2012.
Morgenstern, U. and Taylor, C. B.: Ultra low-level tritium measurement using electrolytic enrichment and LSC, Isot. Environ. Healt. S., 45, 96–117, https://doi.org/10.1080/10256010902931194, 2009.
Morgenstern, U., Stewart, M. K., and Stenger, R.: Dating of streamwater using tritium in a post nuclear bomb pulse world: continuous variation of mean transit time with streamflow, Hydrol. Earth Syst. Sci., 14, 2289–2301, https://doi.org/10.5194/hess-14-2289-2010, 2010.
Morgenstern, U., Daughney, C. J., Leonard, G., Gordon, D., Donath, F. M., and Reeves, R.: Using groundwater age and hydrochemistry to understand sources and dynamics of nutrient contamination through the catchment into Lake Rotorua, New Zealand, Hydrol. Earth Syst. Sci., 19, 803–822, https://doi.org/10.5194/hess-19-803-2015, 2015.
Négrel, P., Petelet-Giraud, E., and Millot, R.: Tracing water cycle in regulated basin using stable δ2H–δ18O isotopes: The Ebro river basin (Spain), Chem. Geol., 422, 71–81, https://doi.org/10.1016/j.chemgeo.2015.12.009, 2016.
Oster, H., Sonntag, C., and Münnich, K. O.: Groundwater age dating with chlorofluorocarbons, Water Resour. Res., 32, 2989–3001, https://doi.org/10.1029/96WR01775, 1996.
Pearson, F. J. and Hanshaw, B. B.: Sources of dissolved carbonate species in groundwater and their effects on carbon-14 dating, in: Proceedings of A Symposium on Use of Isotopes in Hydrology, International Atomic Energy Agency, Vienna, Austria, 271–286, 1970.
Plummer, L. N., Busenberg, E., and Cook, P. G.: Principles of Chlorofluorocarbon dating, in: Use of Chlorofluorocarbons in Hydrology: A Guidebook, edited by: Gröning, M., Han, L. F., and Aggarwal, P., International Atomic Energy Agency, Vienna, Austria, 17–29, 2006a.
Plummer, L. N., Busenberg, E., and Han, L. F.: CFCs in binary mixtures of young and old groundwater, in: Use of Chlorofluorocarbons in Hydrology: A Guidebook, edited by: Gröning, M., Han, L. F., and Aggarwal, P., International Atomic Energy Agency, Vienna, Austria, 59–72, 2006b.
Polach, H. A.: Evaluation and status of liquid scintillation counting for radiocarbon dating, Radiocarbon, 29, 1–11, https://doi.org/10.1017/S0033822200043502, 1987.
Qin, D.: Decline in the concentrations of chlorofluorocarbons (CFC-11, CFC-12 and CFC-113) in an urban area of Beijing, China, Atmos. Environ., 41, 8424–8430, https://doi.org/10.1016/j.atmosenv.2007.07.005, 2007.
Qin, D., Qian, Y., Han, L., Wang, Z., Li, C., and Zhao, Z.: Assessing impact of irrigation water on groundwater recharge and quality in arid environment using CFCs, tritium and stable isotopes, in the Zhangye Basin, Northwest China, J. Hydrol., 405, 194–208, https://doi.org/10.1016/j.jhydrol.2011.05.023, 2011.
Russell, A. D. and Thompson, G. M.: Mechanisms leading to enrichment of the atmospheric fluorocarbons CCl3F and CCl2F2 in groundwater, Water Resour. Res., 19, 57–60, https://doi.org/10.1029/WR019i001p00057, 1983.
Stewart, M. K., Morgenstern, U., and McDonnell, J. J.: Truncation of stream residence time: how the use of stable isotopes has skewed our concept of stream water age and origin, Hydrol. Process., 24, 1646–1659, https://doi.org/10.1002/hyp.7576, 2010.
Stewart, M. K., Morgenstern, U., Gusyev, M. A., and Maloszewski, P.: Aggregation effects on tritium-based mean transit times and young water fractions in spatially heterogeneous catchments and groundwater systems, Hydrol. Earth Syst. Sci., 21, 4615–4627, https://doi.org/10.5194/hess-21-4615-2017, 2017.
Stumpp, C. and Małoszewski, P.: Quantification of preferential flow and flow heterogeneities in an unsaturated soil planted with different crops using the environmental isotope δ18O, J. Hydrol., 394, 407–415, https://doi.org/10.1016/j.jhydrol.2010.09.014, 2010.
Stumpp, C., Małoszewski, P., Stichler, W., and Fank, J.: Environmental isotope (δ18O) and hydrological data to assess water flow in unsaturated soils planted with different crops: Case study lysimeter station “Wagna” (Austria), J. Hydrol., 369, 198–208, https://doi.org/10.1016/j.jhydrol.2009.02.047, 2009.
Suckow, A.: The age of groundwater – Definitions, models and why we do not need this term, App. Geochem, 50, 222–230, https://doi.org/10.1016/j.apgeochem.2014.04.016, 2014.
Tadros, C. V., Hughes, C. E., Crawford, J., Hollins, S. E., and Chisari, R.: Tritium in Australian precipitation: A 50 year record, J. Hydrol., 513, 262–273, https://doi.org/10.1016/j.jhydrol.2014.03.031, 2014.
Visser, A., Broers, H. P., Purtschert, R., Sültenfuß, J., and de Jonge, M.: Groundwater age distributions at a public drinking water supply well field derived from multiple age tracers (85Kr, 3H∕3He, and 39Ar), Water Resour. Res., 49, 7778–7796, https://doi.org/10.1002/2013WR014012, 2013.
Vogel, J. C.: Carbon-14 dating of groundwater, in: Proceedings of A Symposium on Use of Isotopes in Hydrology, International Atomic Energy Agency, Vienna, Austria, 225–239, 1970.
Wang, Y., Shvartsev, S. L., and Su, C.: Genesis of arsenic/fluoride–enriched soda water: A case study at Datong, northern China, Appl. Geochem., 24, 641–649, https://doi.org/10.1016/j.apgeochem.2008.12.015, 2009.
Wu, B.: Study on groundwater system evolvement law and water environment effect of Shihezi City, PhD thesis, Xinjiang Agricultural University, China, 132 pp., 2007.
Zhao, B. F.: Recharge on water resources characteristics and its rational development pattern for arid areas: a case of Manas River Basin, PhD thesis, Chang'an University, China, 182 pp., 2010.
Zhou, H. C.: Groundwater system and recharge from the remote river in Southwestern margin of the Jungger Basin, PhD thesis, Chinese Academy of Geological Sciences, China, 116 pp., 1992.
Zuber, A., Witczak, S., Różański, K., Śliwka, I., Opoka, M., Mochalski, P., Kuc, T., Karlikowska, J., Kania, J., Jackowicz-Korczyński, M., and Duliński, M.: Groundwater dating with 3H and SF6 in relation to mixing patterns, transport modelling and hydrochemistry, Hydrol. Process., 19, 2247–2275, https://doi.org/10.1002/hyp.5669, 2005.