the Creative Commons Attribution 4.0 License.
the Creative Commons Attribution 4.0 License.
 | 15 Nov 2019
Historic hydrological droughts 1891–2015: systematic characterisation for a diverse set of catchments across the UK
Jamie Hannaford
Simon Parry
Katie A. Smith
Maliko Tanguy
Christel Prudhomme
Hydrological droughts occur in all climate zones and can have severe impacts on society and the environment. Understanding historical drought occurrence and quantifying severity is crucial for underpinning drought risk assessments and developing drought management plans. However, hydrometric records are often short and capture only a limited range of variability. The UK is no exception: numerous severe droughts over the past 50 years have been well captured by observations from a dense hydrometric network. However, a lack of long-term observations means that our understanding of drought events in the early 20th century and late 19th century is limited. Here we take advantage of new reconstructed flow series for 1891 to 2015 to identify and characterise historic hydrological droughts for 108 near-natural catchments across the UK using the standardised streamflow index (SSI). The identified events are ranked according to four event characteristics (duration, accumulated deficit, mean deficit and maximum intensity), and their severity is reviewed in the context of events of the recent past (i.e. the last 50 years). This study represents the first national-scale assessment and ranking of hydrological droughts. Whilst known major drought events were identified, we also shed light on events which were regionally important, such as those in 1921 and 1984 (which were important in the south-east and north-west of the UK, respectively). Events which have been poorly documented, such as those of the 1940s in the post-war years or the early 1970s (prior to the landmark 1975–1976 event), were found to be important in terms of their spatial coverage and severity. This improved knowledge of historic events can support improved long-term water resource planning approaches. Given the universal importance of historical drought appraisal, our systematic approach to historical drought assessment provides a methodology that could be applied in other settings internationally.
- Article
(5361 KB) -
Supplement
(3128 KB) - BibTeX
- EndNote


In all climate zones, droughts are a major natural hazard and can threaten water supplies and trigger severe societal and environmental consequences (e.g. Bachmair et al., 2016a). Proactive drought risk assessment and planning are essential cornerstones of efforts to manage the impacts of droughts in many countries (Wilhite et al., 2000). Such activities rely on an understanding of the likelihood of droughts of a given severity in addition to information on vulnerability of supply infrastructure, populations, ecosystems etc. The likelihood of drought occurrence is contingent on an understanding of past hydrometeorological variability, which in itself depends on long historical records of observational data (of rainfall, evapotranspiration, river flows, groundwater etc.). While water resource and drought planning efforts have evolved over the last 3 decades to incorporate climate model-based assessments of future climate variability under anthropogenic warming scenarios (Brown et al., 2015), the inherent uncertainties in these simulations mean that historical records are still of fundamental importance in drought planning – as well as in providing the data to corroborate modelling projections and providing a baseline against which future changes can be assessed.
While the UK is a humid country, it has periodically suffered from severe droughts which have caused major water shortages and subsequent impacts (e.g. Marsh et al., 2007). Parts of the UK are water stressed, owing to a delicate balance between supply and demand – notably, in some of the drier areas of the south and east, where some of the greatest concentrations of population live alongside intensive agriculture and commerce (Environment Agency and Natural Resources Wales, 2013). Consecutive dry winters pose a particular threat in these areas, where groundwater makes up a large proportion of public water supply, as was demonstrated in the recent droughts of 2004–2006 and 2010–2012 (e.g. Parry et al., 2016). These reserves are reliant on recharge over the winter months to replenish supplies. In the wetter north and west, droughts may, intuitively, not be regarded as a major issue, but natural catchment storage is limited, and even relatively short periods of warm and dry weather can cause significant risks to water supply (as occurred in summer 2018, e.g. Barker et al., 2018a).
As with other regions, there remain large uncertainties in hydrological projections for the UK (Watts et al., 2015), but the general expectation of increased evaporative demand under anthropogenic warming is expected to trigger drying, particularly in summer months (Prudhomme et al., 2011). Moreover, greater climatic variability could mean an increase in persistent blocking episodes and multi-year droughts (e.g. Folland et al., 2015), which are the greatest challenges in the most vulnerable areas of south-eastern England. These factors have led the UK Climate Change Risk Assessment to identify water scarcity as a major risk for the UK (Adaptation Sub-Committee, 2016). Even without climate change impacts, demographic and economic changes are expected to significantly influence future water demands (e.g. Water UK, 2016; National Infrastructure Commission, 2018), and the need to ensure favourable conditions for aquatic ecology places a constraint on future water availability (Environment Agency, 2009).
There is therefore a pressing need for improved tools for drought risk assessment, the development of which is contingent on a proper quantification of past occurrence of droughts in the UK. Droughts are a complex hazard, and it is crucial to quantify and understand not just a peak intensity but duration and spatial extent, all of which are interdependent and different for individual events (Van Loon et al., 2016). Given the usually large spatial footprint and long timescales of drought, it is also challenging to define drought episodes as self-contained events (and, as a result, their onset, termination, seasonality etc.), underlining the importance of consistent, quantitative methods for drought identification.
Knowledge of past droughts is crucial for supply system planning. In the UK, as in many countries, water resource management plans and droughts plans have long relied on a “drought of record”, i.e. using the worst observed historic drought to test the resilience of supply systems (Environment Agency, 2015). More recently, there has been a shift towards stochastic approaches to test the resilience of systems to droughts that are worse than those observed in the recent past (Anderton et al., 2015; Water UK, 2016). These approaches recognise the need to go beyond the envelope of past variability, not just in the context of climate change but given short observational records, wherein it may be expected that “record-breaking” events will occur due to chance alone (as has been described for flooding events, for example in Thompson et al., 2017, and Kjeldsen and Prosdocimi, 2018). However, these stochastic approaches still require benchmarking against historic data, and where longer historic data are available the increased sample size increases the confidence in synthetic events generated using historical training data.
The occurrence of droughts in recent decades is well understood in the UK, with most events since 1976 having been documented extensively by the National Hydrological Monitoring Programme (http://nrfa.ceh.ac.uk/nhmp, last access: 1 November 2019). However, our understanding of hydrological drought occurrence is grounded in the period since 1961, when most UK river flow records commenced. Only a handful of hydrometric records extend back to the early 20th century, meaning that there are few observations on which to base systematic, national-scale assessments of drought severity. In a seminal study, Marsh et al. (2007; see also Cole and Marsh, 2005) synthesised a range of datasets to provide an assessment of historic droughts in England and Wales between 1800 and 2006, identifying nine “major” episodes, of which only four are in the well-gauged period of the last 5 decades. Whilst the study rightly encouraged a longer view, the approach to drought characterisation was qualitative and relied on a small number of long rain gauge and groundwater records as well as documentary sources.
The British Isles is blessed with plenty of long rainfall series. This has allowed quantitative identification of meteorological droughts back to the 17th century (e.g. Todd et al. 2013). Similarly, in Ireland, Noone et al. (2017) developed a drought catalogue back to the 18th century using long rainfall records. But in the context of drought, it is not sufficient to quantify meteorological deficits alone. As some of the most severe drought impacts on society and the environment result from hydrological drought (i.e. deficits in river flows and groundwater levels), and given that the propagation from meteorological to hydrological drought is highly non-linear (e.g. Barker et al., 2016), assessments based solely on meteorology can be misleading (Van Lanen et al., 2013).
Given the lack of long river flow records, such long rainfall records can be used to reconstruct river flow data to extend our knowledge of past variability. The most notable existing example is the work of the Climate Research Unit, which has allowed a window into past droughts back to 1865 (Jones, 1984; Jones and Lister, 1998; Jones et al., 2006). However these studies reconstructed river flows for just 15 catchments across England and Wales, were based on empirical rainfall–runoff relationships, and made a number of simplifying assumptions, such as the use of constant potential evapotranspiration through time (which plays an important role in discharge-generating processes, particularly in the mid-latitudes). There have been some efforts to reconstruct hydrological droughts on a regional scale, the results of which have been run through water supply system models, e.g. for East Anglia (Spraggs et al., 2015) and the Midlands (Lennard et al., 2016). At the national scale, an assessment of past hydrological droughts was recently undertaken by Rudd et al. (2017) which benchmarked a national gridded hydrological model against the droughts identified in Marsh et al. (2007) aggregated over river basin regions, but it did not assess the relative severity or spatio-temporal dynamics of historical episodes. Internationally, although many studies have identified and described historic periods of meteorological drought (e.g. Noone et al., 2017; Pfister et al., 2006; Spinoni et al., 2015), there have been few efforts to reconstruct historic hydrological droughts at the broad, national scale. An exception is Caillouet et al. (2017), which used reconstructions based on rainfall–runoff models for 662 catchments across France.
The aim of this study is to provide the first comprehensive assessment of historic hydrological droughts at the UK scale, providing an up-to-date, objective and quantitative assessment of the severity of major droughts, extending the work of Marsh et al. (2007; hereafter, for brevity, referred to as MCW2007). However, unlike MCW2007, this study focusses on hydrological, specifically river flow, drought. River flow integrates upstream processes combining the effects of climate and the physical catchment properties and is therefore a good indicator of water availability. This study is part of “Historic Droughts” (https://historicdroughts.ceh.ac.uk/, last access: 1 November 2019), a multidisciplinary project which aims to understand past drought from a range of perspectives, with a hydrometeorological assessment at its foundation.
This paper does the following:
-
presents timelines of historic reconstructed droughts for over 100 near-natural catchments;
-
characterises the severity of these past drought events – in terms of duration, accumulated deficit, mean deficit and maximum intensity;
-
ranks historic droughts according to these drought event characteristics and assesses how relative rankings vary by geography and the ranked drought characteristic; and
-
provides a fuller description of the evolution and characteristics of major, nationally important droughts from the pre-1961 period.
2.1 Data
This study makes use of a comprehensive new dataset of reconstructed river flows from 1891 to 2015 for 303 diverse catchments across the UK (Smith et al., 2018). These reconstructed daily river flows were derived from a hydrological model which was driven by newly rescued and digitised meteorological data from UK observing stations held in the paper records of the National Meteorological Archives. The rainfall data are described in Hollis et al. (2019) and available from the UK Met Office (2018, 2019). The hydrological model required daily rainfall and potential evapotranspiration (PET) as inputs, the latter of which was calculated using newly recovered temperature data (Tanguy et al., 2018). The hydrological model employed was the GR4J daily lumped rainfall–runoff model (Perrin et al., 2003), implemented using the “airGR” R package version 1.0.2 (Coron et al., 2017) as described by Smith et al. (2018, 2019). GR4J has previously been used for low-flow reconstructions in France (Caillouet et al., 2017) and has demonstrated good performance in a diverse range of catchments in the UK (Harrigan et al., 2018). GR4J was calibrated using a Latin hypercube sampling (LHS) technique to ensure that each parameter was sampled in an efficient manner, producing 500 000 model parameter sets for each catchment. The 500 000 model results were then analysed and ranked using six evaluation metrics (the Nash–Sutcliffe efficiency, absolute percent bias, mean absolute percent error, Nash–Sutcliffe efficiency on log flows, absolute percent error in Q95 and the absolute percent error in the mean annual minimum on a 30 d accumulation period) which assessed model performance across the flow regime but included drought-specific and low-flow-specific metrics (Smith et al., 2019). From the 500 000 model runs for each catchment, Smith et al. (2018) identified the best-performing model run – referred to as LHS1. Smith et al. (2019) also assessed the model parameter uncertainty for the top 500 model runs, but here, the LHS1 dataset was used to investigate historic hydrological droughts. LHS1 was selected due to the computational demand of the distribution fitting associated with the derivation of the standardised streamflow index (SSI; see below).
In this study, we used a subset of the 303 catchments modelled by Smith et al. (2018), i.e. stations from the National River Flow Archive's (NRFA's) UK Benchmark Network (Harrigan et al., 2017), in particular those stations suitable for low flows, hereafter referred to as the low-flow Benchmark Network (LFBN). The NRFA's UK Benchmark Network provides a network of gauging stations monitoring near-natural catchments, with limited net artificial influences on flows (Harrigan et al., 2017). The use of near-natural catchments enables the hydro-climatic signal to be separated from confounding impacts (such as human modifications to catchments or influences on flows); this is especially vital given that human impacts are not explicitly accounted for in the modelling approach used (Smith et al., 2019).
The 303 UK catchments reconstructed by Smith et al. (2018), which include the LFBN, performed well in model validation steps which included assessing model performance for a range of metrics which summarised how well the model reproduced discharge across the flow regime as well as testing the skill of the model for low flows and drought specifically (Smith et al., 2019). Here, where model evaluation criteria fell below the middle of the three model performance thresholds defined by Smith et al. (2019), catchments were removed. The LFBN generally performed well, and only seven catchments were excluded from the full LFBN (115 catchments), resulting in 108 catchments being appropriate for this study (shown in Fig. 1). A list of the 108 LFBN catchments used in this study is provided in Table S1 in the Supplement, and the model performance metrics for the LHS1 runs from Smith et al. (2018) for the LFBN catchments are shown in Fig. S1 in the Supplement. To provide some geographic context to figures, hydro-climatic regions of the UK described in Harrigan et al. (2018; shown in Fig. 1) were used in the description of the results. A set of nine case study catchments was chosen from the LFBN (one per hydro-climatic region; shown in Fig. 1), representing a range of catchment types and geographies across the UK, enabling catchment-scale results to be shown. The following case study catchments were selected (the hydro-climatic region is given in brackets): Cree (WS), Allan Water (ES), Crumlin (NI), Aire (NEE), Ellen (NWENW), Teme (ST), Cynon (SWESW), Lud (ANG) and Lambourn (SE).

Figure 1The 108 low-flow Benchmark Network (LFBN) catchments used in this study which are included in the river flow reconstructions of Smith et al. (2018), highlighting nine selected case study catchments. Catchments are coloured by the hydro-climatic regions of Harrigan et al. (2018). See Table S1 for a list of catchments and basic catchment information.
2.2 Drought indices
The SSI (Vicente-Serrano et al., 2011) was calculated for each LFBN catchment using reconstructed flow data (Smith et al., 2018) for the period 1891–2015 (Barker et al., 2018b). The standardisation of the reconstructed streamflow allowed consistent comparison over both time and space and provided a measure of drought severity – crucial characteristics for a quantitative and rigorous assessment of drought event characteristics over time and space.
Daily mean river flow reconstructions were aggregated to mean monthly flows for each catchment in the LFBN. The SSI was then calculated for 3 and 12 end-month accumulation periods, where for example the December SSI-3 represents flow deficits from October to December, whilst the December SSI-12 represents deficits from January to December. The 12-month accumulation period (SSI-12) gives a summary of long-term annual (multi-season) deficits likely to have greater impact on water resources (whether groundwater or multi-season reservoirs). The 3-month accumulation period (SSI-3) characterises short-term seasonal river flow deficits and impacts on smaller, single-season reservoirs. For practical applications, the accumulation period most appropriate for a given water resource system, or a particular type of drought impact, varies across the country (Bachmair et al., 2016b). In general, longer periods are more important in the south and east of the UK (including durations even longer than those used here, e.g. 24 or 36 months) and shorter periods in western areas (e.g. Barker et al., 2016; Folland et al., 2015; Marsh et al., 2007). However, due to substantial spatial variation, two contrasting accumulation periods are used for all sites.
The SSI was calculated using the Tweedie distribution, which has been found to have the best fit for observed river flow data for UK Benchmark catchments (Svensson et al., 2017), the majority of which overlap with the 108 LFBN catchments used in this study. The Tweedie distribution was recommended in the UK by Svensson et al. (2017), following rigorous testing of 12 distributions, with special attention paid to the tails of the distribution. The Tweedie has the advantages of being a flexible three-parameter distribution that has a lower bound at zero. Due to the uncertainties associated with extreme SSI values (e.g. Stagge et al., 2015), values were limited to the range of −5 to 5.
Although the daily river flow reconstructions had no missing data, there were 5 individual months to which a Tweedie distribution could not be fitted and so did not have an SSI value. All 5 months of missing data appear in the SSI-3 series for four catchments and equate to 0.0015 % of available data for the 108 catchments and two accumulation periods for the period 1891–2015 (see Table S2 for details). Four of these missing data points occurred during periods of positive SSI (i.e. above-normal flows) and so did not affect the identification of drought events (see Sect. 2.3). The last missing data point occurred in December 1921 for the Great Stour at Horton (SE region) and was infilled with the SSI value of preceding and subsequent months (both −5).
2.3 Drought event extraction and characteristics
Drought events were defined as months with consecutively negative SSI values, with at least 1 month in the negative series reaching a threshold of −1.5 (equating to “severe” drought; Barker et al., 2016). For each extracted event, the following characteristics were calculated (after Noone et al., 2017; see Fig. 2):
-
duration (number of months),
-
accumulated deficit (sum of SSI values across the event duration),
-
mean deficit (accumulated deficit divided by duration), and
-
maximum intensity (the minimum SSI value during the event).
Due to the seasonal focus of the study, events with a duration of less than 3 months (i.e. 1 or 2 months) were removed. As the accumulated deficit and mean deficit were derived from the SSI, they represent relative deficits and not absolute flow deficits (for example, as millimetres or a volume).
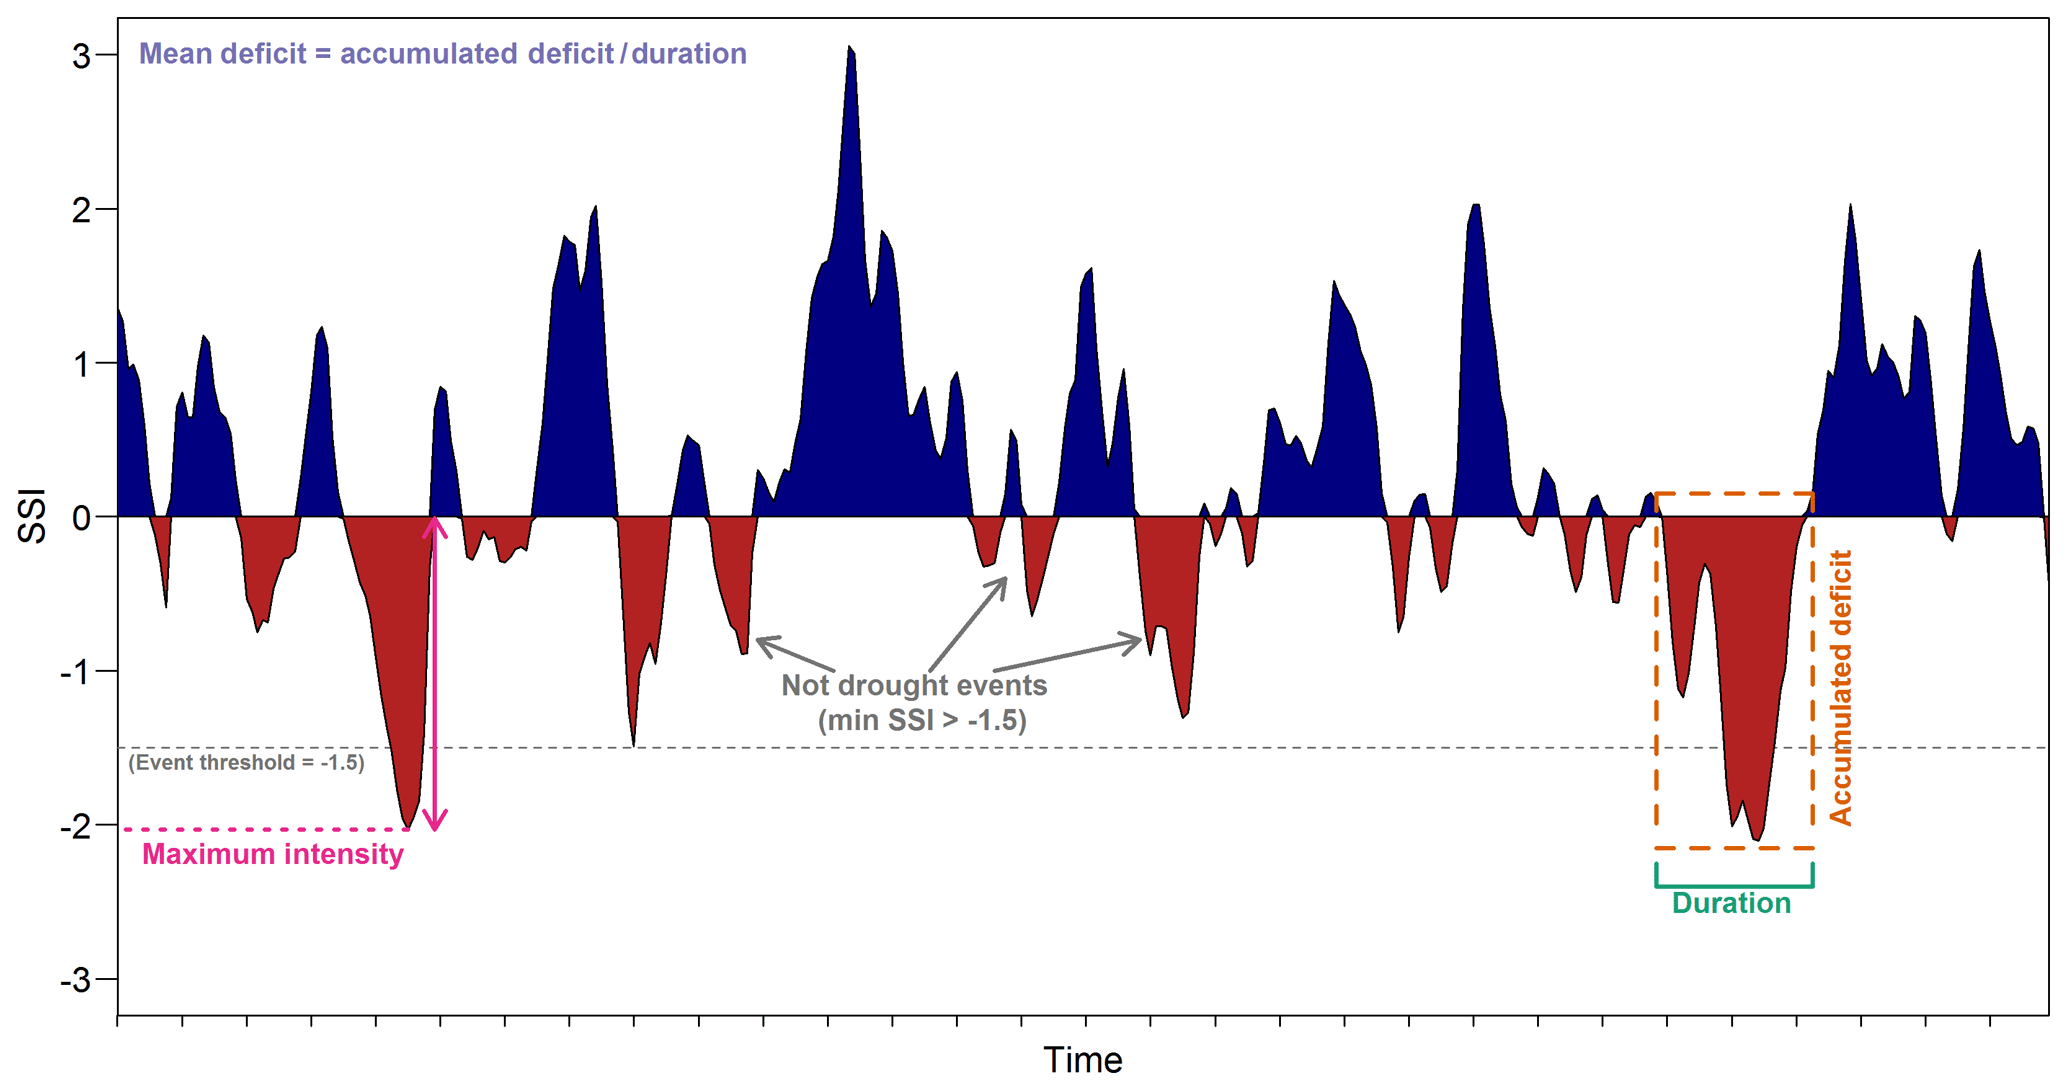
Figure 2Conceptual diagram illustrating drought event identification and characteristics (NB x axis ticks represent years, but SSI data are on a monthly time step).
The extracted events were ranked by each event characteristic (i.e. duration, accumulated deficit, mean deficit and maximum intensity), and the top 10 events for each characteristic and accumulation period were identified. When ranking by duration, tied events were also sorted by the accumulated deficit, so the longest events with the lowest (i.e. most negative) accumulated deficit ranked highest.
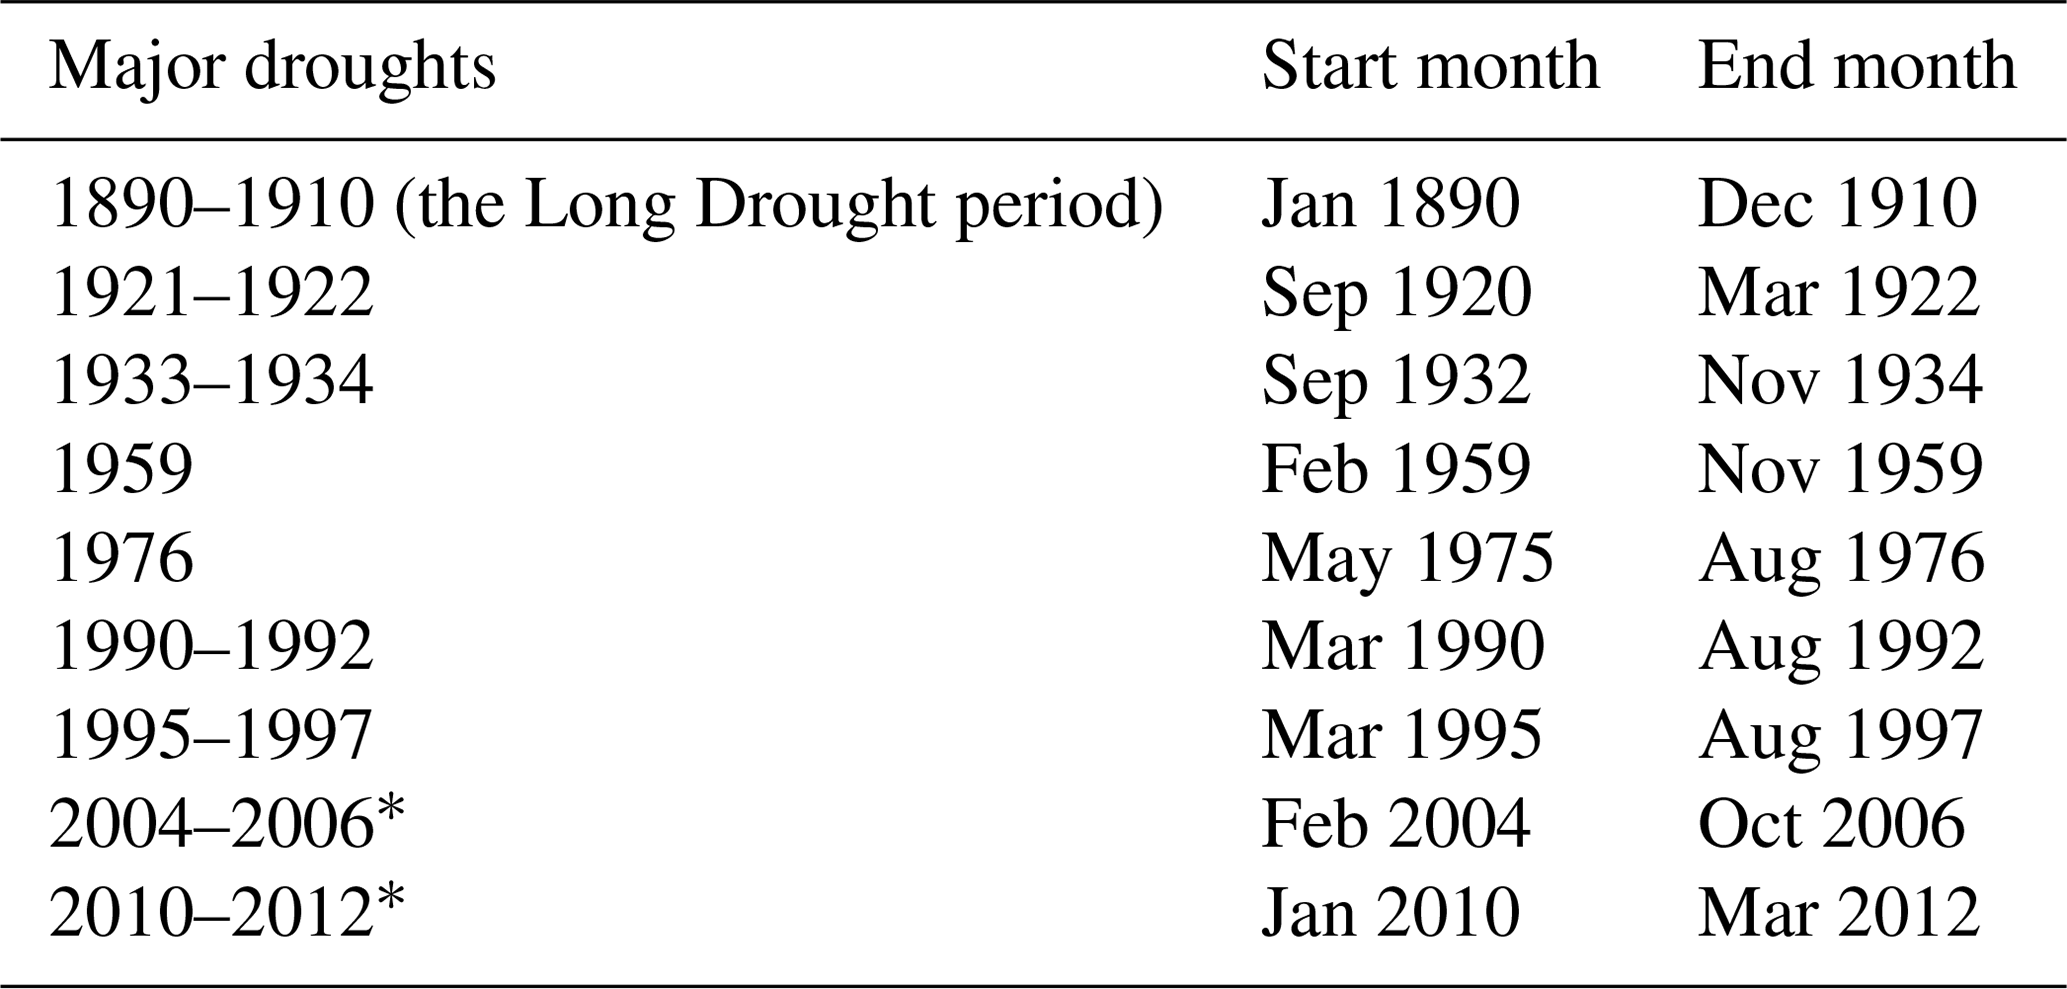
All extracted drought events were compared to events identified as major droughts in England and Wales by MCW2007 or documented as such by the National Hydrological Monitoring Programme and UK Met Office (2004–2006 and 2010–2012; e.g. Marsh, 2007 and Kendon et al., 2013, respectively). Using information from their relevant publication, the start and end months were identified for each event (listed in Table 1). Where the extracted events (from the reconstructed SSI series) overlapped with the major event periods given in Table 1, the extracted event was assigned to the corresponding major drought. Extracted events which did not overlap with these known drought periods were classified as “other events” and were assessed in more detail.
Table 1Major droughts and their start and end dates as identified by MCW2007; * denotes events that were not listed by MCW2007 but were significant events reported by the National Hydrological Monitoring Programme.
3.1 Timelines of historic reconstructed drought
Figure 3 provides a national-scale assessment of drought occurrence, showing the SSI-12 in the form of a heat map, with catchments orientated roughly from north to south. Spatially coherent phases of below normal flows (referred to as low flows throughout this section) can be identified in Fig. 3, with particularly intense periods of low flows in the mid-1930s and 1976, when there were extreme deficits across the UK. Periods of regionally low flows occurred in Northern Ireland in the mid-1890s, the early 1920s and the 2010–2012 event in the SE region, and 1995–1997 in northern England. The period from 1890 to 1910 (referred to by MCW2007 as the “Long Drought”) was a prolonged period of low flows punctuated by periods without flow deficits – e.g. 1903–1905, where above-normal flows were recorded across the country.
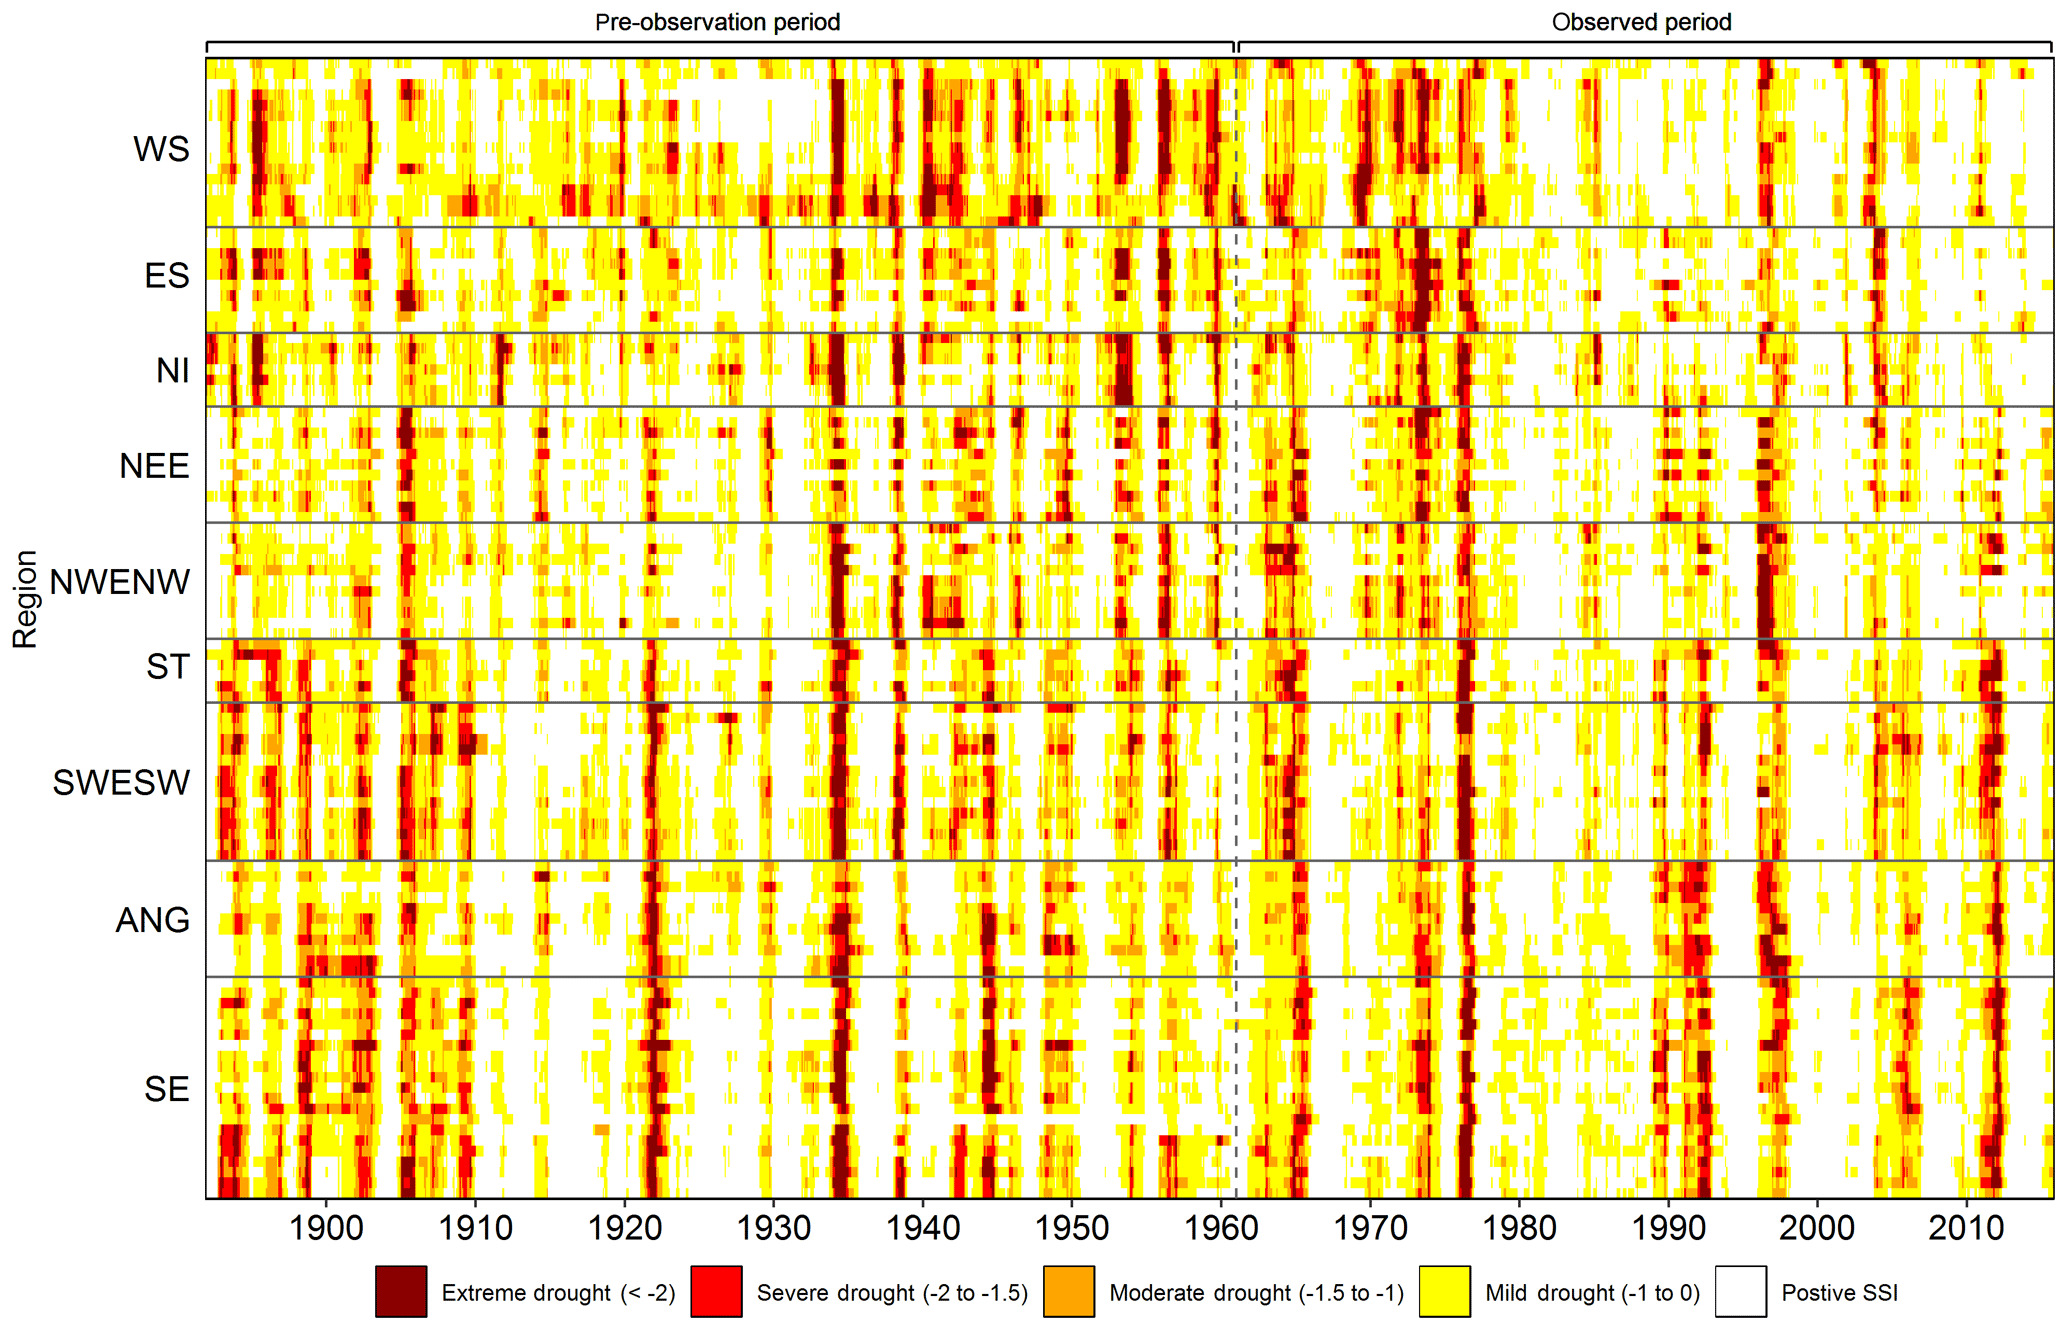
Figure 3Heat map of SSI-12 for LFBN catchments (arranged roughly from north to south on the y axis, with one row per catchment and hydro-climatic regions marked for clarity) from 1891 to 2015.
In general it appears that more intense low flows occurred in the pre-observation period (i.e. before 1961), whilst the 1980–2015 period included more above-normal flow episodes in northern regions (particularly WS), indicated by the white spaces in Fig. 3. Across the UK hardly any extreme low flows occurred in the 1980s over the 12-month accumulation period (Fig. 3), with the decade generally showing mild drought conditions or above-normal flows.
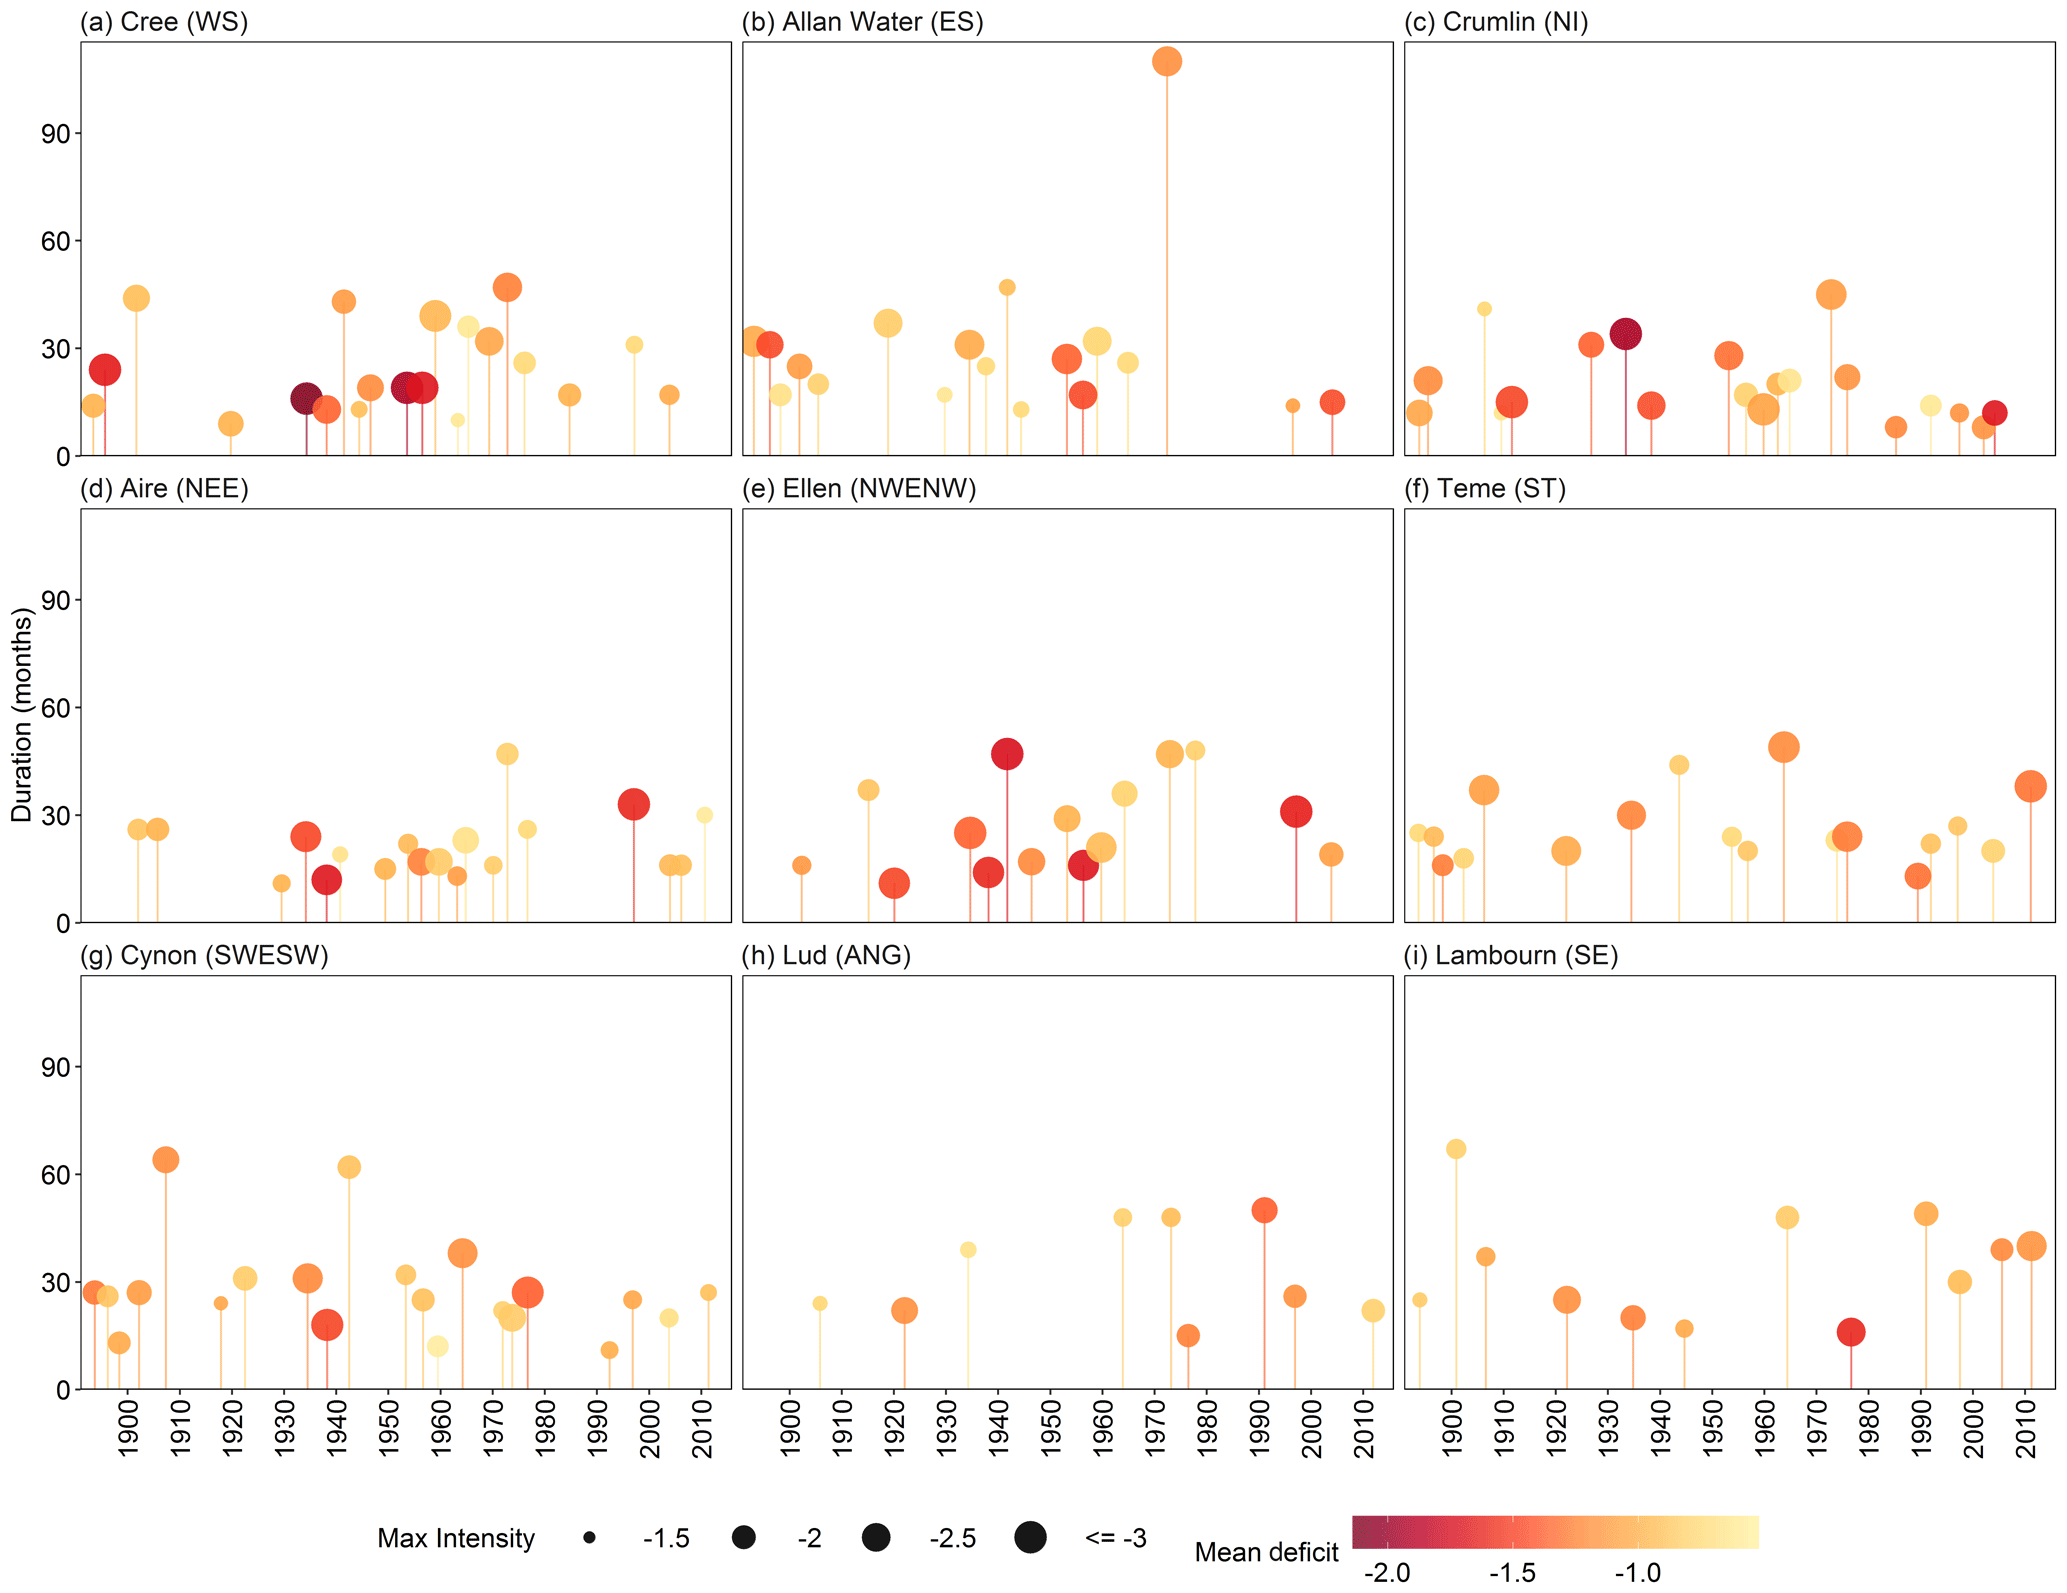
Figure 4Extracted events from SSI-12 and their characteristics for the nine case study catchments, plotted at the midpoint of the event. The size of each point is proportional to the maximum intensity, and the colour indicates the mean deficit.
At the shorter 3-month accumulation period, there was more variability in SSI in both time and space (Fig. S2), although there were some similarities to the SSI-12 (Fig. 3). The 1920s (also identified in SSI-12) show intense low-flow events in the SE region. Severe and extreme low flows can be seen in the pre-observation period, and fewer events occurred during the 1980s to early 2000s (except in WS). Although slightly obscured by the very fine-scale variations shown in Fig. S2, some spatial coherency emerges for SSI-3 (Fig. S2). For example, the 1976 drought, intense in SE and ANG regions, extends northwards and is apparent across the UK. The events of the mid-1930s occur across the UK, with the lowest flows in Northern Ireland. The 1995–1996 drought occurs across England and Wales and to some extent in Scotland – whilst it highlighted longer-term deficits across northern England for SSI-12. At the shorter 3-month accumulation period, the distinction between the SE and ANG regions and the rest of the country is more apparent than at the 12-month accumulation period, with more space–time consistency in SSI values in the south-east of England.
3.2 Characterising the severity of past events
The extracted drought events and their characteristics for the nine case study catchments are shown in Fig. 4 for SSI-12 and Fig. S3 for SSI-3. The identified events tend to be longer and less frequent in more southerly catchments regardless of the SSI accumulation period. Events with a lower negative maximum intensity (i.e. more severe) tend to occur before 1960, particularly in more northerly catchments; a similar pattern can be seen for the mean deficit. Maximum intensity and mean deficit seem unaffected by duration, with severe events occurring over the range of durations plotted. On the Cree, Allan Water and Lud, events were clustered in time (e.g. in the 1930s–1950s, before 1977 and after 1962, respectively); elsewhere, events were more evenly spaced through time. Shorter events tend to have occurred in the last 30 years on the Crumlin and in Scotland, whilst SSI-3 events were longer after the 1970s on the Lambourn.
3.3 Ranking historic drought events
The longest SSI-12 events varied by location (Fig. 5a), but the longest events mostly occurred before 1990 and were clustered between 1940 and 1980. The SSI-12 events of the early to mid-1970s were, for the most part, the longest in northern England, northern Wales, Northern Ireland and Scotland (Fig. 7a). Events in the 1960s ranked highly across the UK (with the exception of Scotland), the 1970s in the north of the UK and the 1900s in the south of England. Many of the 10 longest events occurred during the Long Drought period from the 1890s to 1910s, but in many cases these were not the top-ranking (i.e. most severe) events.
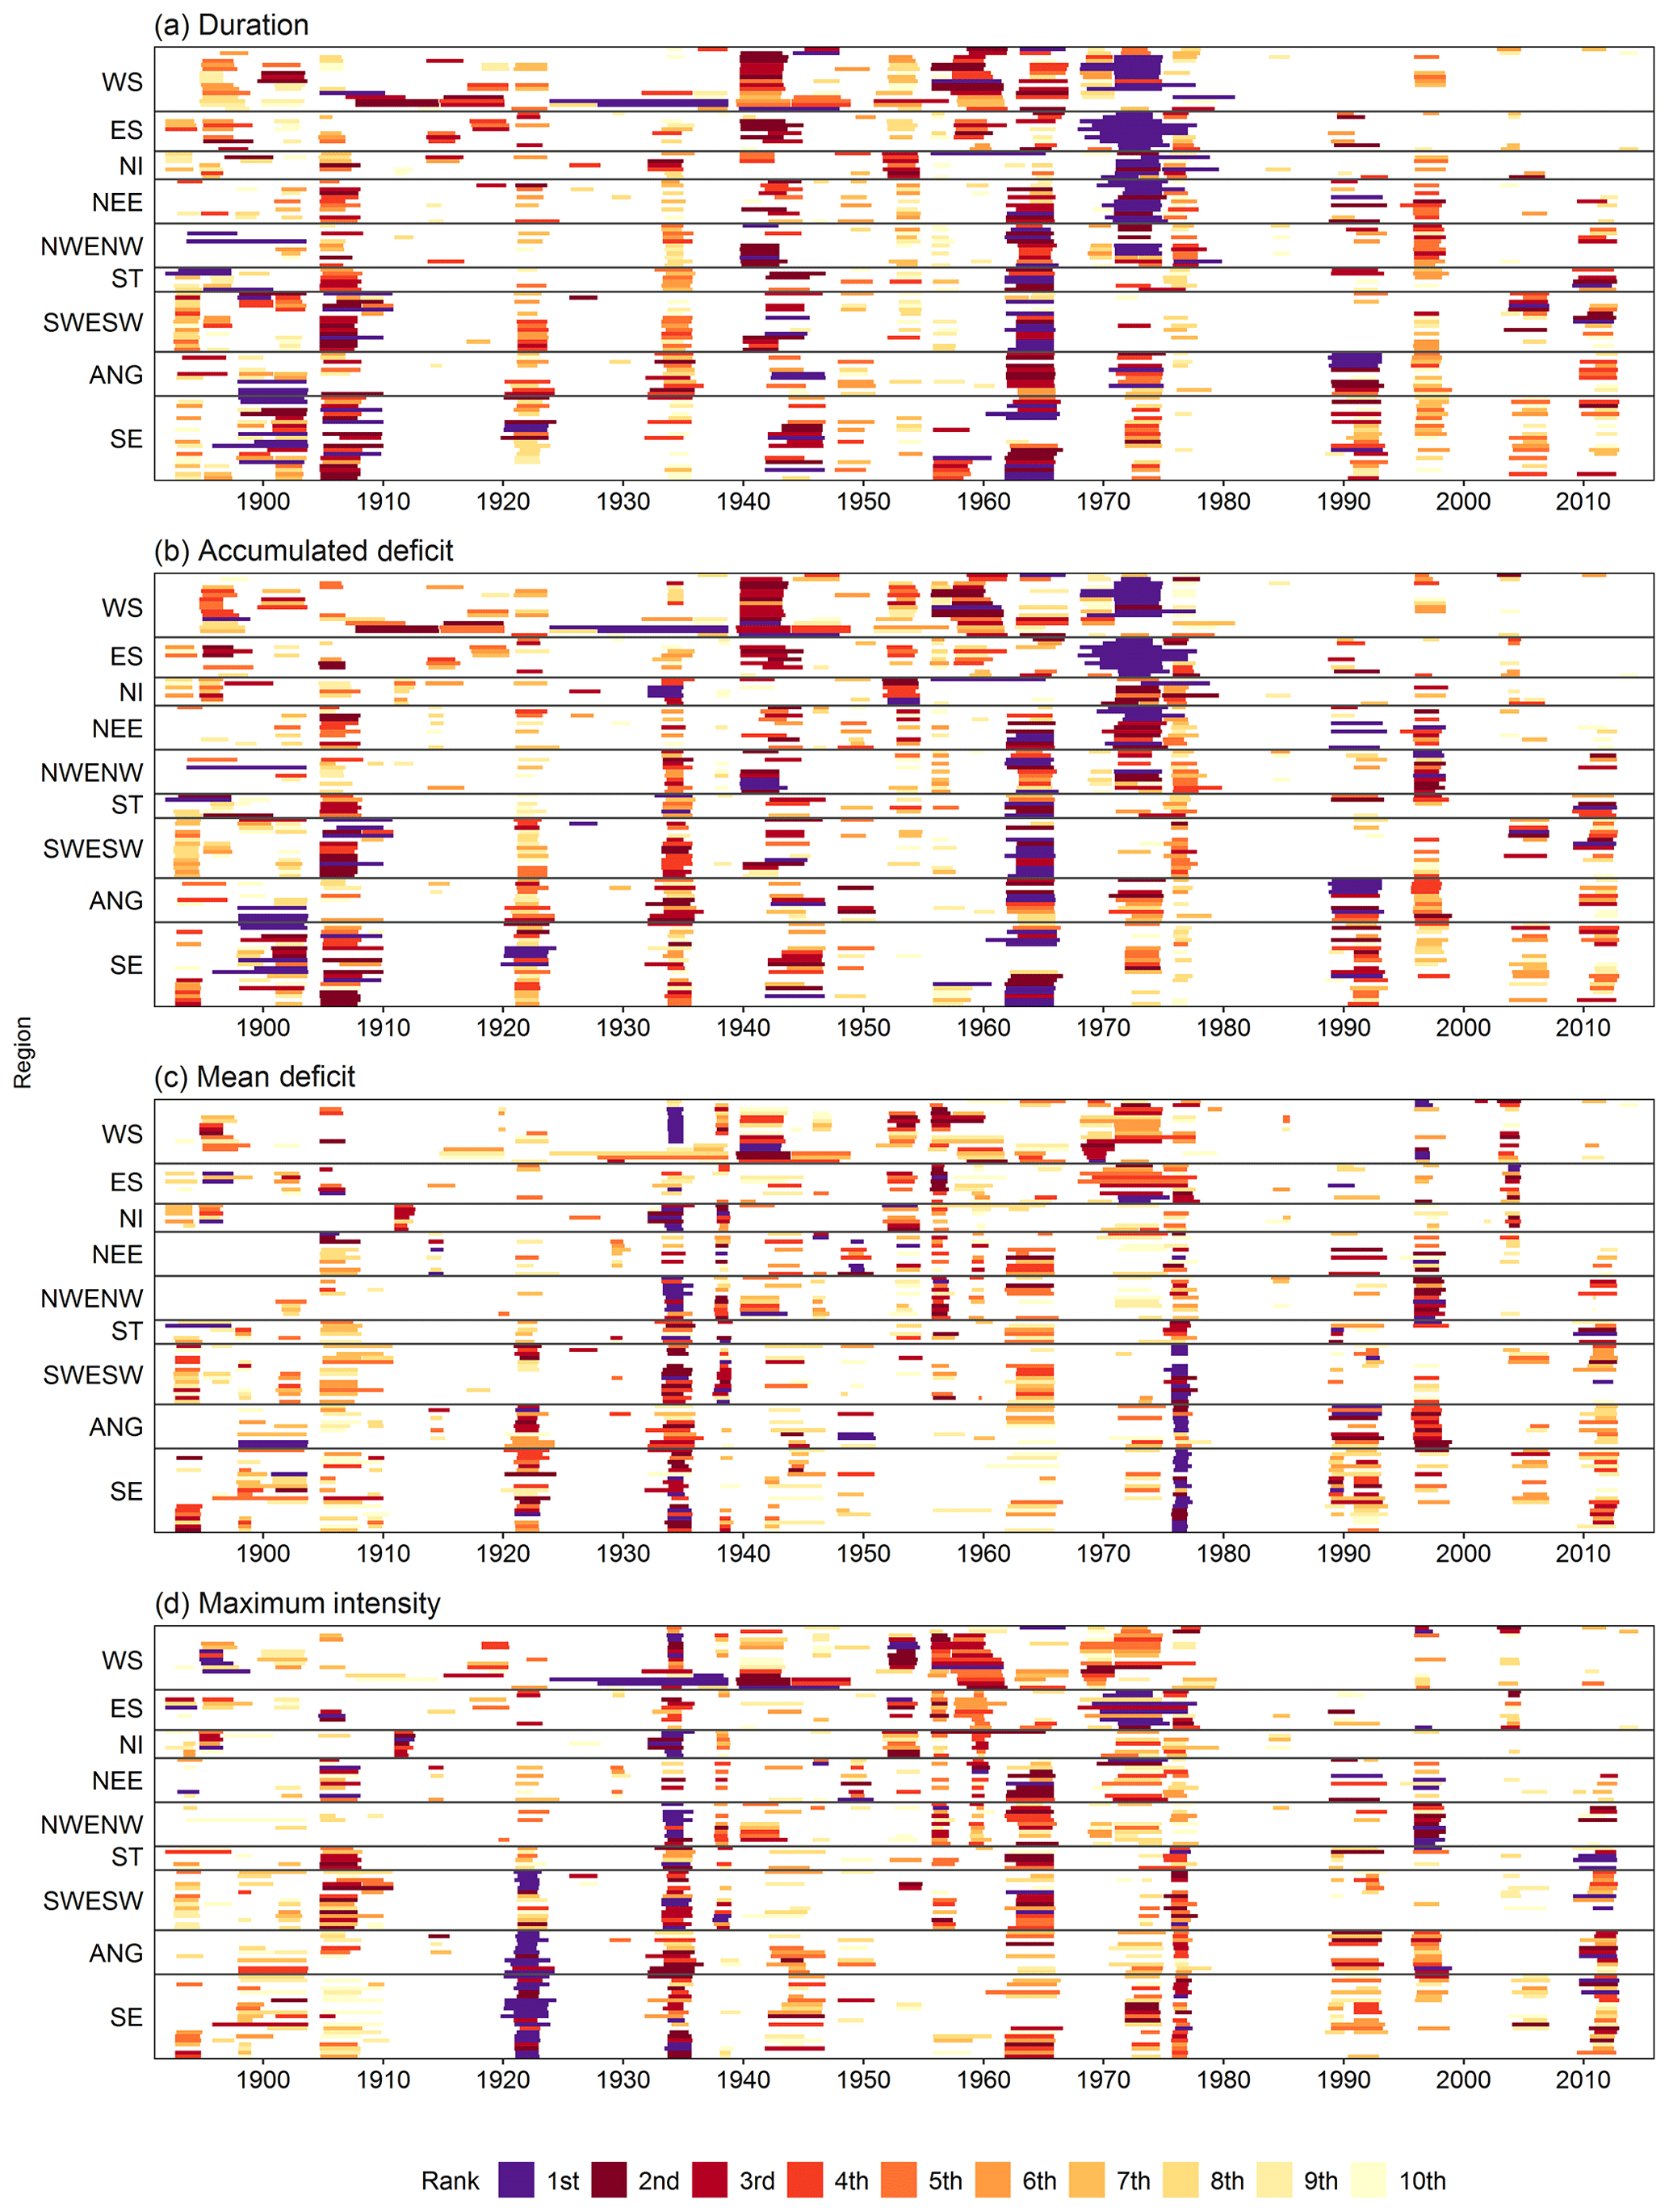
Figure 5Top 10 extracted events from SSI-12, using a threshold of −1.5 for each drought event characteristic. Catchments are arranged roughly from north to south on the y axis, with each row representing a catchment and hydro-climatic regions marked for clarity. Bars represent the top 10 events and are coloured according to the event rank; darker shades represent higher-ranking (i.e. more severe) events.
The event rankings for accumulated deficit were similar to those for duration (Fig. 5a and b), as longer events are likely to have greater accumulated deficit. When the accumulated deficit is divided by the duration to produce the mean deficit, however, a different picture emerges (Fig. 5c). The 1975–1976 event stands out as being highly ranked in terms of mean deficit in southern England and Wales. Events in the mid-1930s rank in the top three across the country. Other severe drought events occurred in the 1950s across northern Britain, in the late 1990s in northern England and Wales, and in the mid-2000s in some catchments in ES, whilst the rank of events in the 1900s and 1960s decreases when looking at mean deficit compared accumulated severity. Several events occurring during the Long Drought period (1890–1910) ranked in the top 10 when considering mean deficit, especially in the SE region. The 1920s in south-eastern England and the 1930s, nationally, stand out dramatically when events are ranked by the maximum intensity (i.e. the lowest monthly SSI value in the event; Fig. 5d). This drought characteristic, more than the others, shows a propensity to more severe events in the earlier part of the reconstructed series than other characteristics.
For SSI-3, more-recent events such as those in the 1990s, 2004–2006 and 2010–2012 rank highly in ANG and SE regions. The drought of 1975–1976 is ranked highly in terms of duration in northern and western regions but at this shorter accumulation period ranks lower in south-eastern regions (Fig. S4a). When accumulated deficit is considered (Fig. S4b), the 1920s ranks in the top half of the rankings across regions of southern England and Wales, whilst the 1930s is coherently ranked in the top 10 across the country (and was particularly highly ranked in Northern Ireland and the south of the UK). The drought of 1995–1997 is highly ranked in the regions of northern England and ANG, with events throughout the 1990s being particularly severe in ANG. When ranked by mean deficit, events such as the early 1920s rank highly in south-eastern regions, and the 1929 drought ranks highly (and was ranked top in some catchments in ES and NEE; Fig. S4c). In contrast to the duration rankings, catchments in SE and ANG regions ranked highly (and top in many) for 1975–1976, whilst at this shorter accumulation period, the summer drought of 1984 appears in the top half of the rankings, particularly in western regions. The late 1920s (1929) also ranks highly in more northerly and westerly regions for the maximum intensity, while the early 1920s ranks particularly highly in ANG and SE regions, as does 1975–1976 (Fig. S4d).
Figure 6 shows the LFBN catchments where the top-ranking SSI-12 events for each event characteristic correspond to the major drought events listed in Table 1. Across England and Wales, the Long Drought period (1890–1910) was the longest event with the largest accumulated deficits events but the most severe event according to mean deficit and maximum intensity in the north of the UK. In contrast, the 1975–1976 event was worse in terms of mean deficit in southern England and Wales and amongst the longest, with the largest accumulated deficit in northern regions. The events of 1920–1922 and 1933–1934 were amongst the worst in terms of maximum intensity in the south-east and west of the UK, respectively. On the north-eastern coast, the 1990–1992 was overall the worst drought, whilst the worst drought was that in 1995–1996 in central northern England. The 2010–2012 event had the highest maximum intensity at the Welsh borders and some groundwater-dominated catchments in the south-east of England. The 1959 and 2004 events were generally not marked as the highest-ranking events for any of the characteristics except in a handful of catchments – at most, five individual catchments during the 1959 event for a range of characteristics and for only three catchments for the 2004 event.
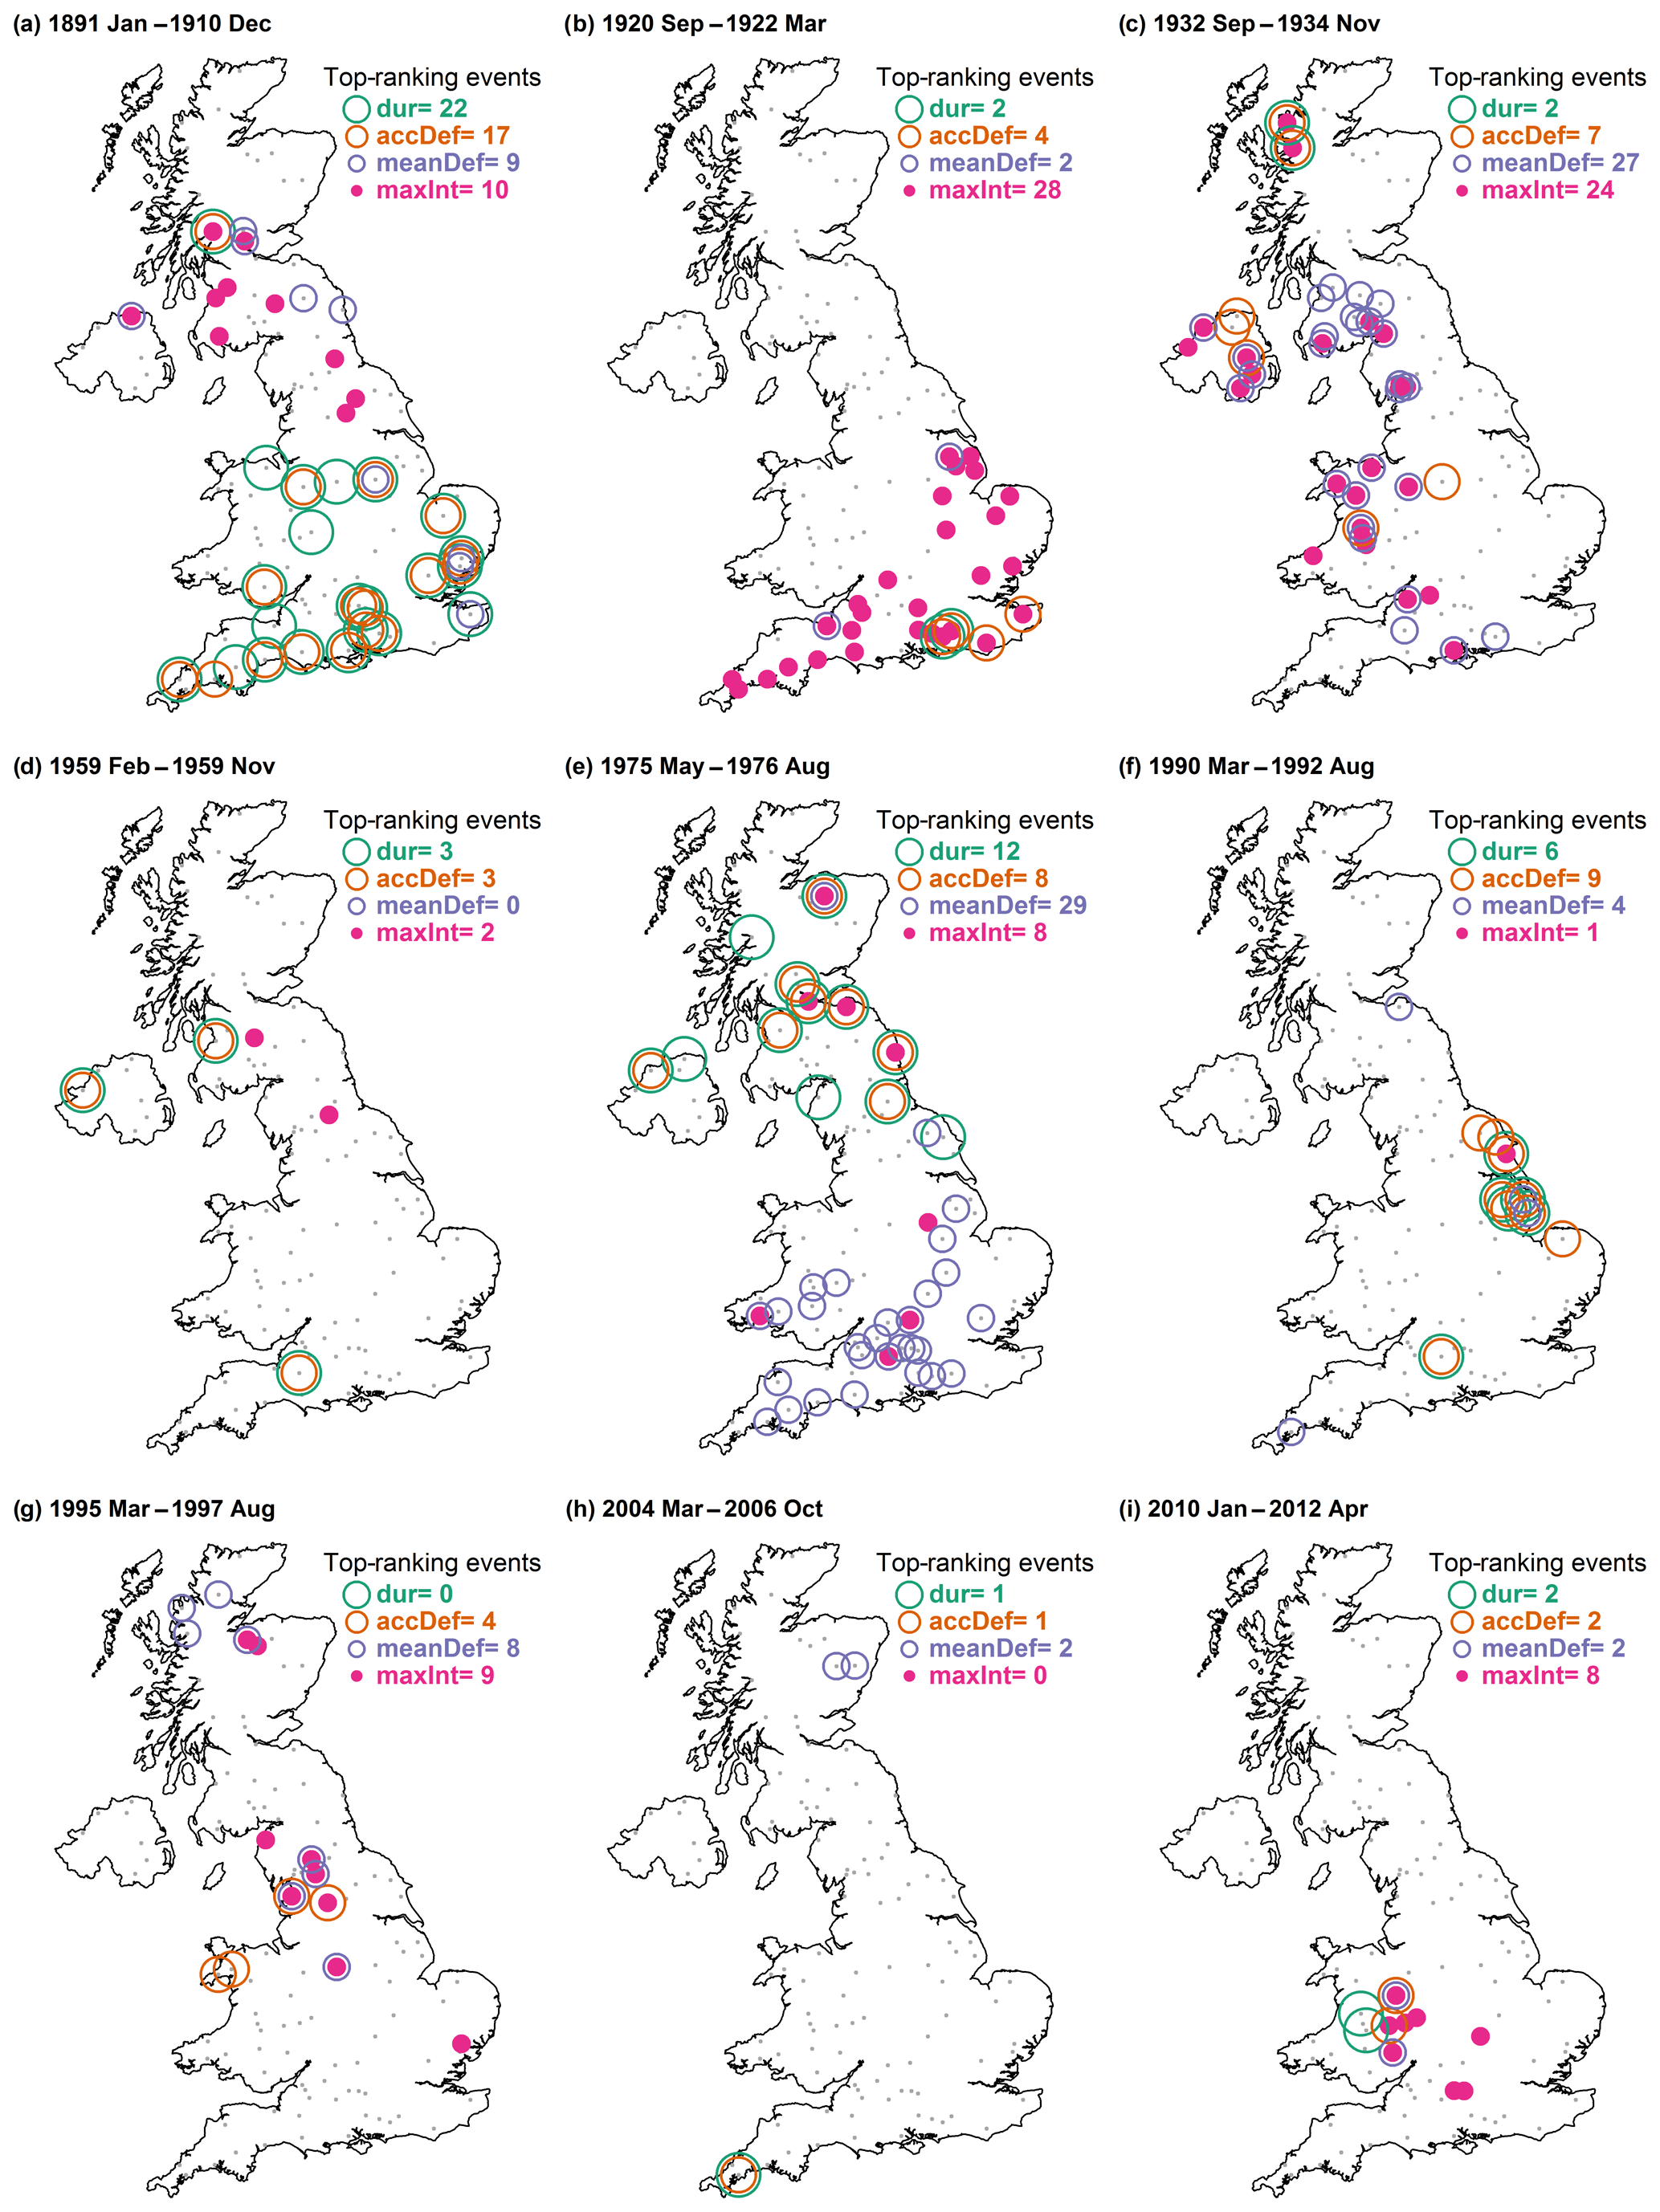
Figure 6Location and number of LFBN catchments, where the top-ranking SSI-12 event corresponds to major events (Table 1) for duration (dur), accumulated deficit (accDef), mean deficit (meanDef) and maximum intensity (maxInt). Each of the nine maps represents one of the major drought events listed in Table 1. Each point on the maps represents the location of the 108 LFBN catchments. Points are coloured pink where the particular event was ranked most severe according to maximum intensity for that catchment. Similarly, points are circled in purple, orange and turquoise to indicate catchments where the particular event was ranked most severe in terms of mean deficit, accumulated deficit and duration, respectively. The numbers in the top right of each map show the number of catchments ranked as most severe for each characteristic for that particular event.
Figure 7a–d show the months when the top-ranking SSI-12 event did not correspond to the major events for each event characteristic. The known major drought events exclude top-ranking events in the 1940s, 1960s and early 1970s (before the 1975–1976 event) across the four drought characteristics. Figure 7e shows the location of the catchments where the top-ranking events occurred outside of the major events; although they occur across the UK, most of these missed events occurred in catchments outside of the south and east of England. A similar spatial pattern can be seen for the top-ranking SSI-3 other events (Fig. S6e), with a focus on northern and western areas. In contrast to SSI-12, more of the SSI-3 duration and accumulated deficit top-ranking events were captured than mean deficit and maximum intensity (around half of which were not captured by the major events). The events not captured by the major events for SSI-3 occurred in similar periods as for SSI-12 (i.e. the 1940s, 1960s and early 1970s), with the addition of the late 1920s, late 1930s and 1984.
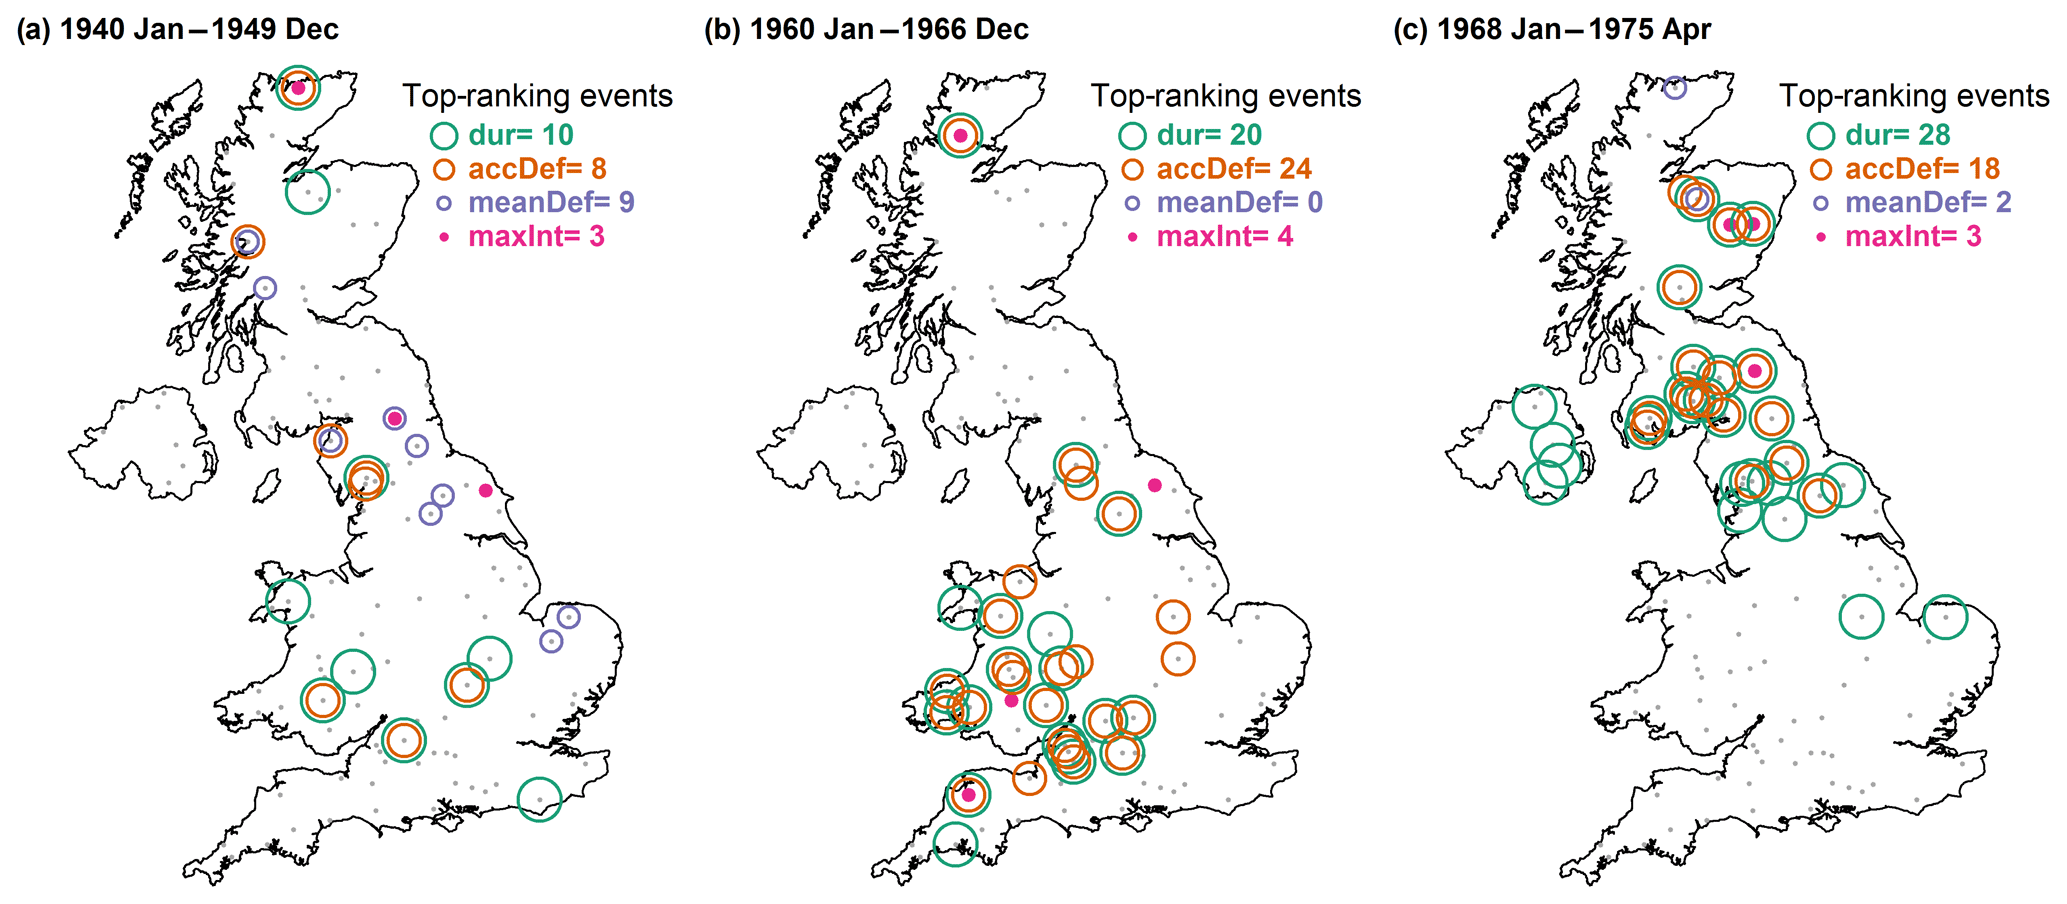
Figure 7Months when SSI-12 top-ranked events occurred outside of the major events (shaded in grey) for the LFBN catchments and each event characteristic (a–d), and (e) the location and number of catchments with other top-ranking events for each event characteristic. Points are coloured as described in the caption for Fig. 6.
For both SSI-3 and SSI-12, the period 1980–2015 appears to be well captured by the major events of Table 1 (see Figs. 7 and S6). Figure 8 shows three other drought event periods for SSI-12 identified in Fig. 7, with top-ranking events spread over the UK for the 1940s, 1960s and early 1970s. In the 1960s (1960–1966), events were of a longer duration and higher accumulated deficit, whilst there were only four catchments with top-ranking events for maximum intensity and none for mean deficit. Catchments with top-ranking events occurring in the 1968–1975 period were focussed in northern parts of the UK, with top-ranking duration and accumulated deficit events spread across Scotland, Northern Ireland and northern England.
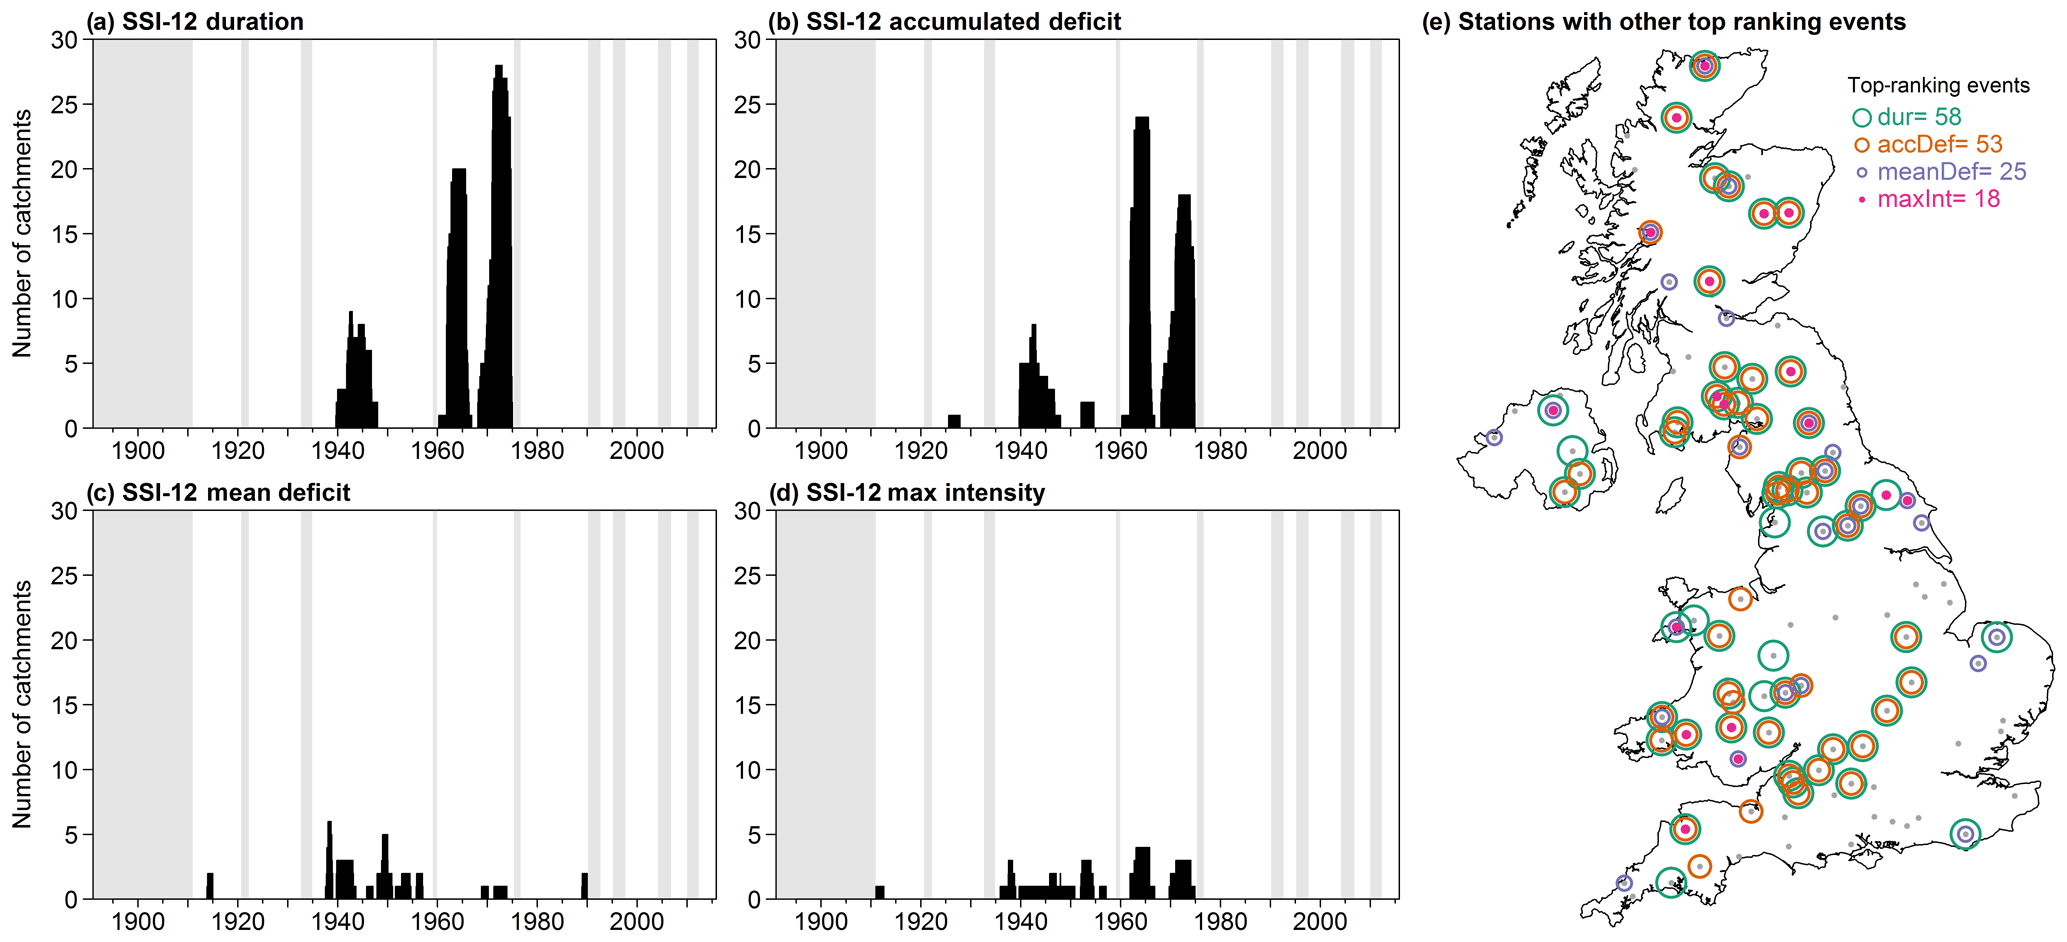
Figure 8Location and number of LFBN catchments, where the top-ranking SSI-12 events for each event characteristic occur in periods outside of the major drought events: (a) 1940–1949, (b) 1960–1966 and (c) 1968–1975. Points are coloured as described in the caption for Fig. 6.
For SSI-3, the 1968–1975 period was important for the most severe events according to duration and accumulated deficit in Scotland (Fig. S7). Some catchments had top-ranking events for more than one characteristic in this period in Scotland, with just four catchments registering top-ranking events (for duration and mean deficit) in England and Wales. Other events were ranked most severe in some catchments and event characteristics (Fig. S7); 1928–1929 ranked first for mean deficit and maximum intensity across Scotland and northern England. The drought of the early 1950s ranks first across all four event characteristics in Northern Ireland, whilst the 1984 event ranked top for mean deficit in 16 catchments in the west of Great Britain.
Finally we consider the rank of all extracted events for SSI-12 for the major events and other identified events for each event characteristic (Fig. 9). By assessing the rank of all the identified events corresponding to the major events (Table 1) and other identified events (Fig. 8), the relative severity of the events can be compared. By placing the top 10 ranks in context, we can see that for some events, the majority of the extracted events fell within the top 10, such as 1995 for duration; 1933 and 1975 for accumulated deficit and mean deficit; and 1920, 1959 and 2010 for maximum intensity. This implies that events such as these were consistently more severe than events with a wider range of ranks or have generally have lower ranks, such as 1891–1910 or the 1940s. The median rank of 2004 was outside of the top 10 events across all characteristics, as was 1959 for duration and accumulated deficit and 1891 for mean deficit and maximum intensity, suggesting that although in some catchments these events were most severe, they were not regularly ranked highly and so were less severe at the national scale. Most of the major and other events identified from the SSI-3 rank outside of the top 10 (Fig. S8), with the exceptions of 1933 for accumulated deficit, where the 25th–75th percentile of events fall within the top 10. This may be a result of the higher number of shorter events extracted from the SSI-3 series. In some cases, the median rank of events falls within the top 10, such as 1933 and 1975 for duration, 1975 for accumulated deficit, and 1920 and 1933 for maximum intensity, suggesting that these events were more important at the seasonal scale (SSI-3).
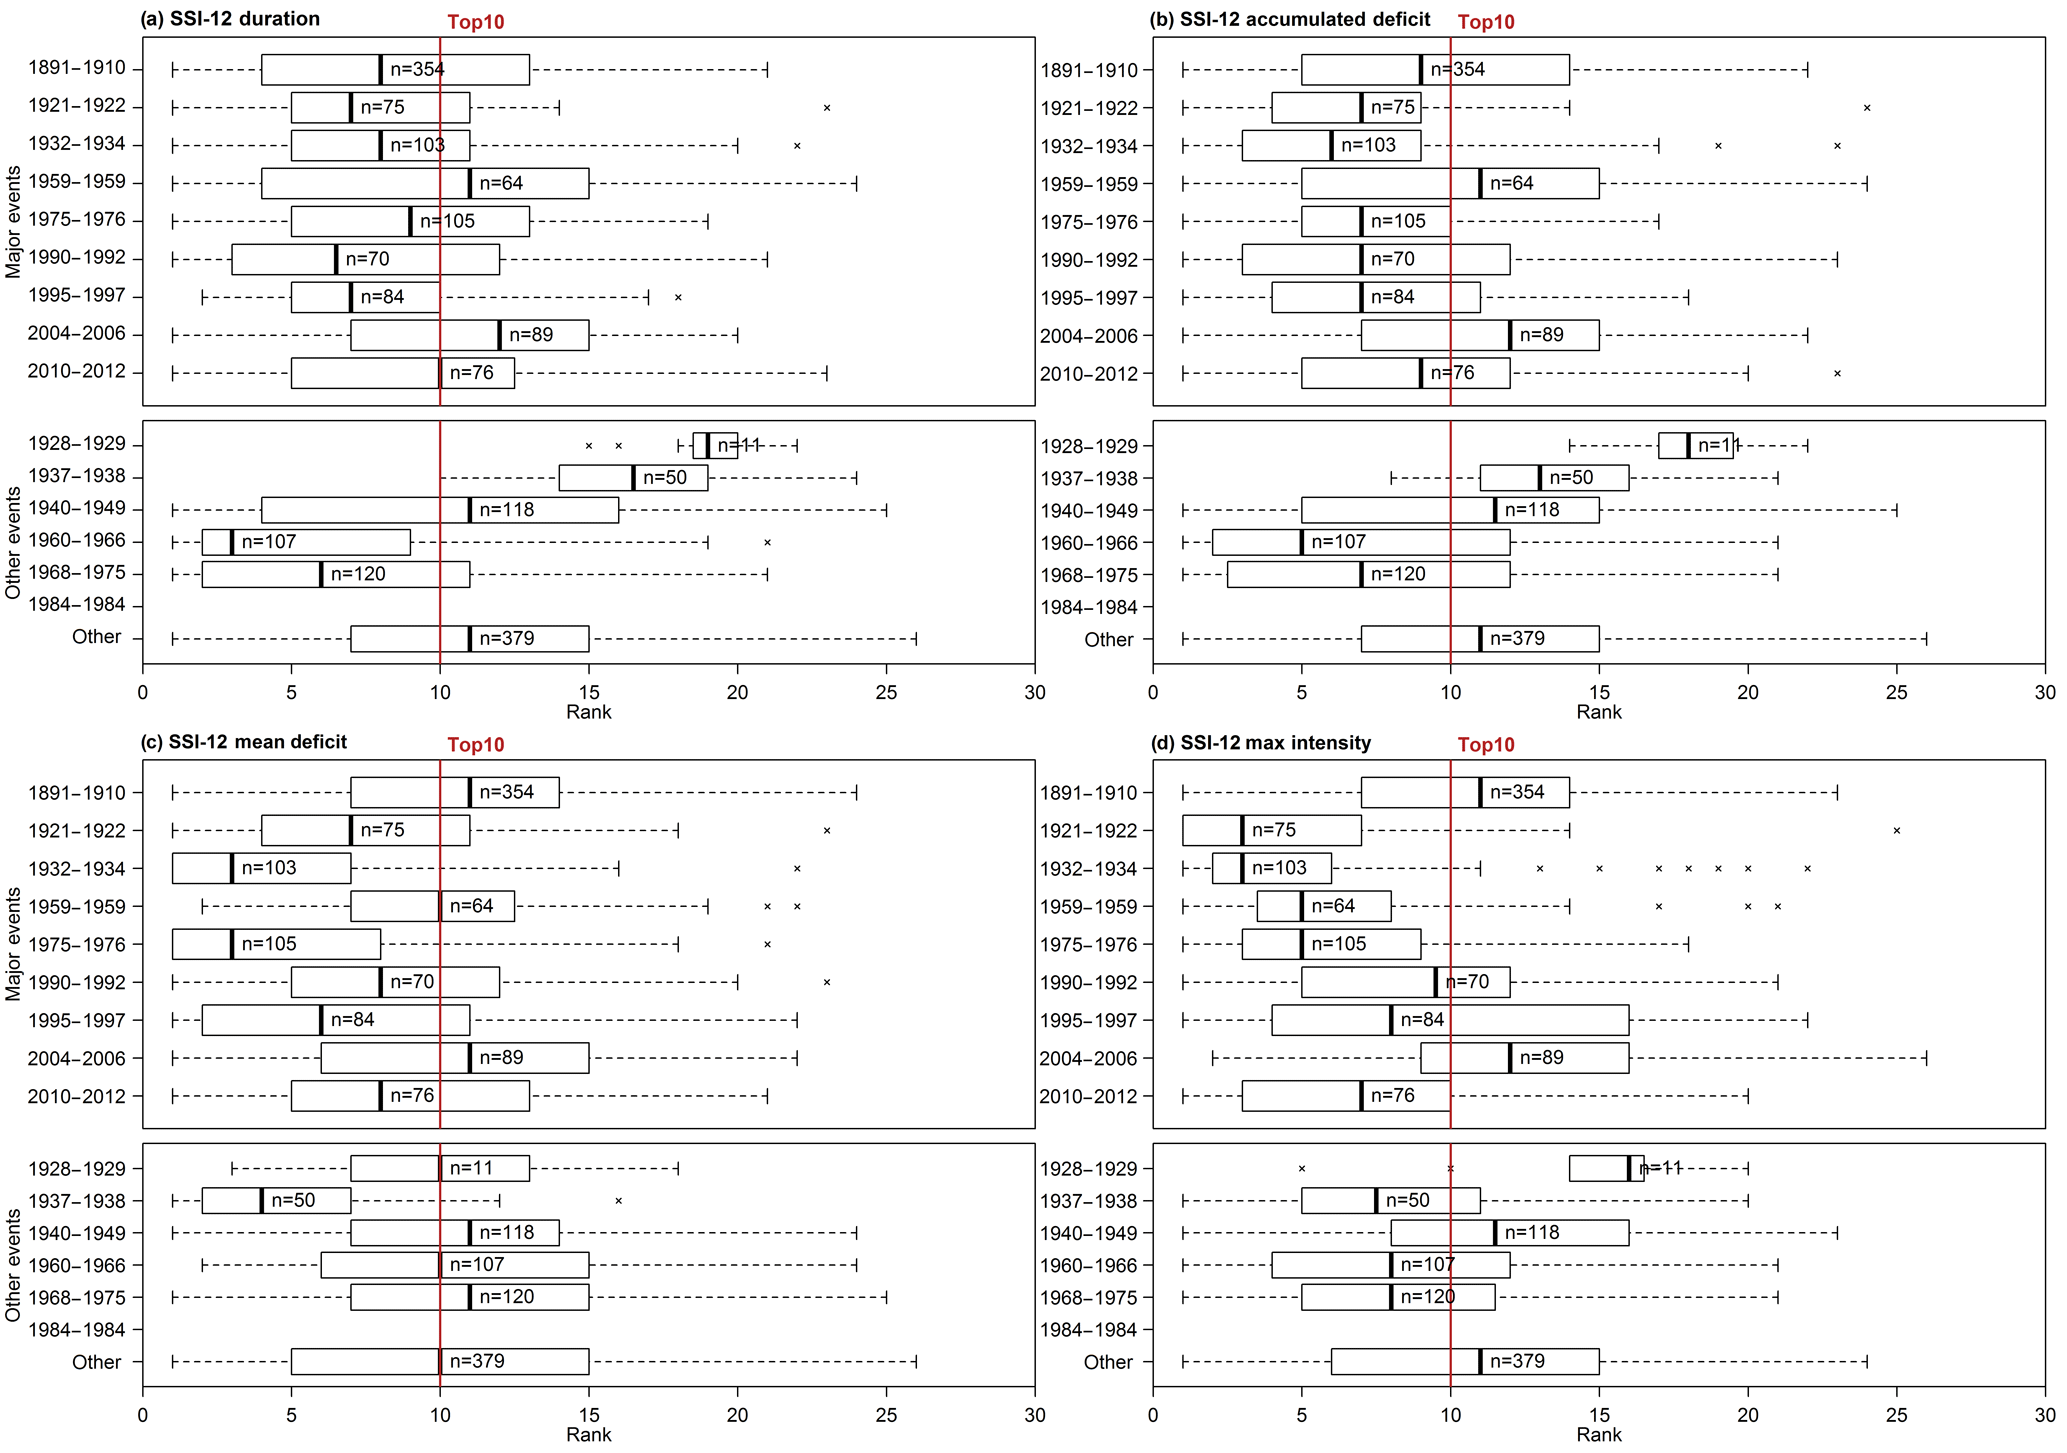
Figure 9Boxplots showing the ranks of all SSI-12 extracted events where they overlap with the major drought events (top panel for each event characteristic) and identified other events (bottom panel for each event characteristic). Within each box, n refers to the total number of events (across the LFBN) identified that occurred within this period. As multiple events can occur within each given period in individual catchments, it is possible for the value of n to be greater than the number of catchments (i.e. 108).
3.4 Evolution and characteristics of major pre-1961 events
While previous work and the above analysis have identified the importance of events in the pre-observation period, their hydrological characteristics have not been fully described at the national scale. The flow reconstructions and derived SSI used here allow a more detailed view of the space–time dynamics of these events comparable with those available for events in the gauged era. Figure 10 shows the SSI for the four earliest events identified in this study prior to 1961: the Long Drought period (1891–1910), 1921–1922, 1933–1934 and the 1940s. These events are discussed in more detail in the section below in terms of both SSI-12 and SSI-3; where results pertain to one accumulation period, it has been specified, and otherwise results relate to both accumulation periods.
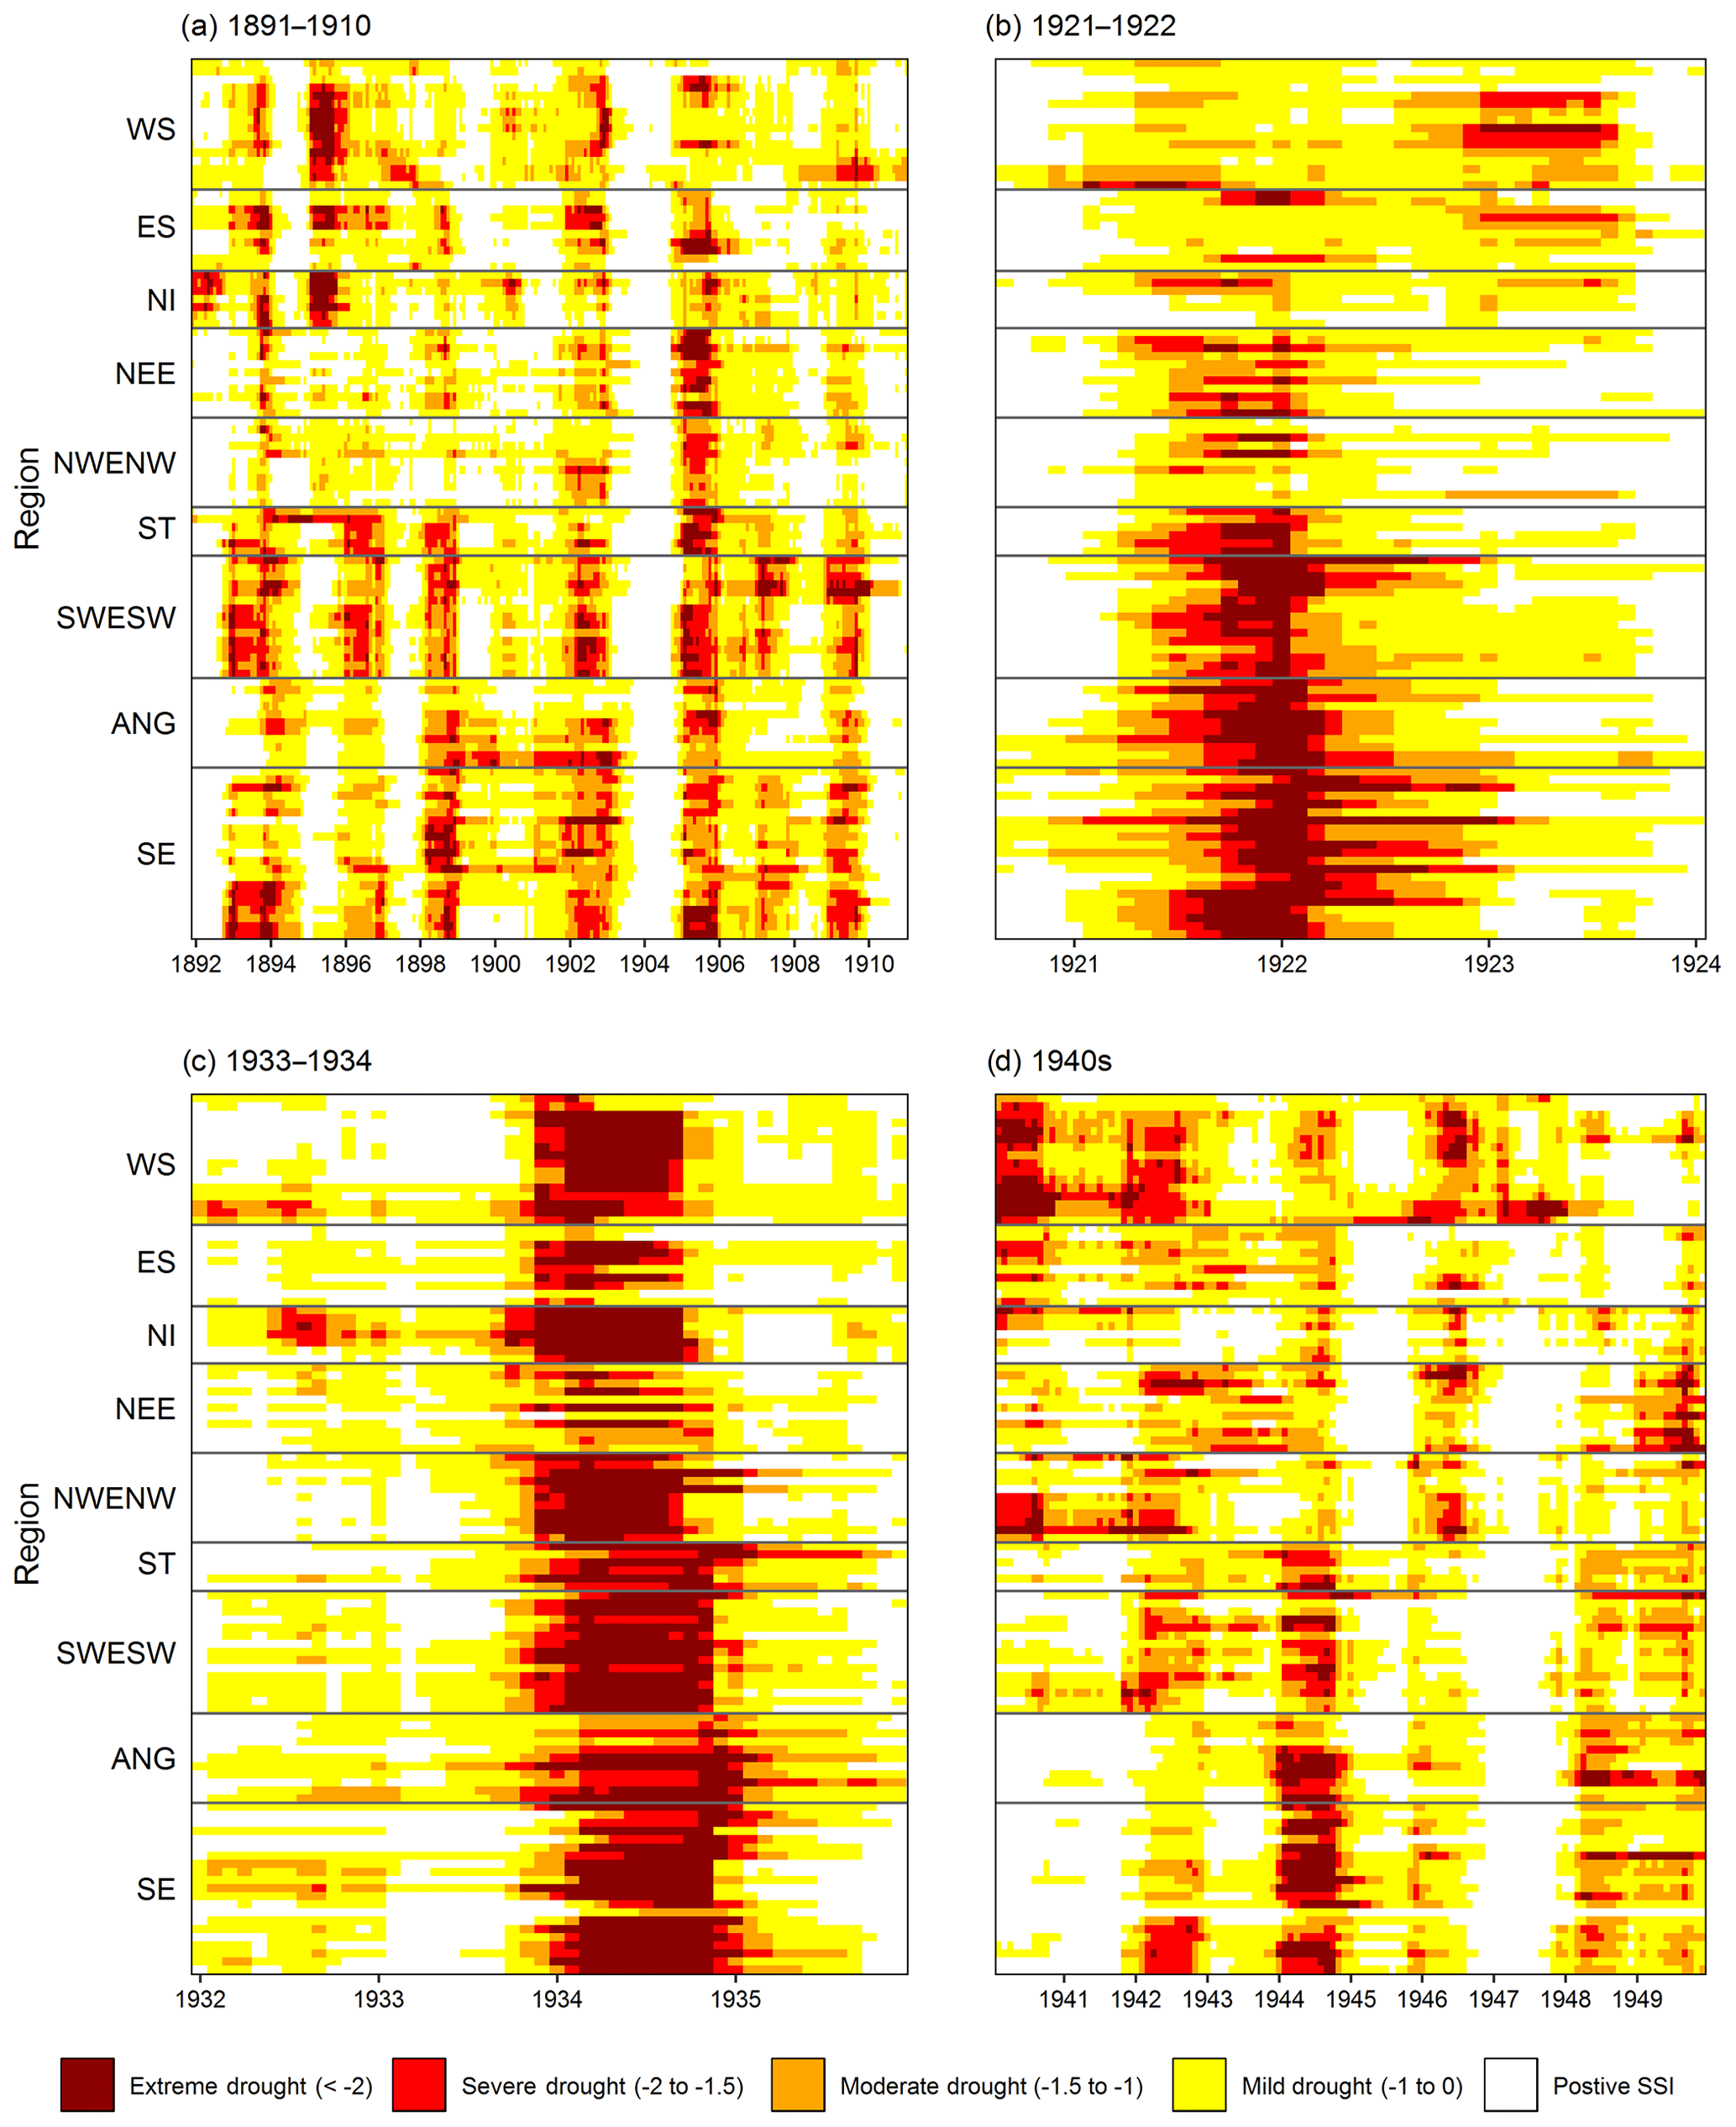
Figure 10Heat maps of reconstructed SSI-12 for LFBN catchments, arranged roughly from north to south, with one row per catchment and hydro-climatic regions marked for clarity for (a) the Long Drought period (1890s–1910s), (b) 1921–1922, (c) 1933–1934 and (d) the 1940s.
3.4.1 The Long Drought period (1890–1910)
The 20-year period, 1890–1910 (the Long Drought), showed periods of low flows across much of the country. For SSI-12, there was often spatial coherency in conditions across southern England and Wales, reducing further north (Fig. 10), whilst for SSI-3 (Fig. S9), only certain periods show national-scale coherency in conditions (such as early 1892, autumn 1892 and 1903–1905). In general, however, extreme and severe flow deficits did not occur simultaneously across all regions, e.g. 1895 saw extreme flow deficits across Scotland and Northern Ireland, mild drought in northern England, and higher-than-average flows in the rest of England. With the exception of 1903–1905, northern England was impacted by extreme deficits, whilst several periods of extreme flow deficits occurred in the rest of England throughout this period. More episodes of severe and extreme deficits can be seen at the seasonal scale using SSI-3 throughout the Long Drought period than for SSI-12.
3.4.2 1921–1922
The drought of the 1920s was mostly focussed in England and southern Wales, with severe flow deficits beginning in summer 1921 across southern England for SSI-12 (Fig. 10). However, for SSI-3, 1920 ended with severe–extreme flow deficits in WS, but the principal period of deficits started across England (with the exception of NWENW) and Northern Ireland in spring 1921. The event continued for a single season in Northern Ireland and NEE and until winter 1922 in southern England and Wales (Fig. S9). The most extreme flow deficits were experienced over the autumn and winter of 1921 and in some catchments in SE extend well into 1922 for SSI-12. In NEE flow deficits were extreme in cases, with severe deficits experienced throughout 1921. North-western areas again experienced severe–extreme deficits in winter 1923–1924 in Scotland, Northern Ireland and SWESW for SSI-3.
3.4.3 1933–1934
Severe and extreme drought began in winter 1933 in Scotland and Northern Ireland, with much of the country in extreme drought in 1934 (Figs. 10 and S9). The ES, northern England and northern parts of ANG appear to be less affected, although they still show at least mild flow deficits. The most severe deficits across the country occur for the duration of 1934 and in some southerly catchments extend to the start of 1935. For SSI-3, deficits ended in the majority of catchments in spring 1934 but continued until the autumn in the south-east of England.
3.4.4 1940s
The 1940s was a decade with multiple periods of drought across the country. The decade began with severe–extreme deficits in WS and parts of NEE. Drought conditions were generally mild in other regions, with the exception of ANG and SE for SSI-12, where flows were mostly normal or above average (Fig. 10). During the remainder of the 1940s, however, drought was more coherent across the UK in terms of occurrence (although not in terms of severity) for both accumulation periods. Other notable drought phases in the decade occurred in southern and central England and southern Wales in 1944, which extend right into Scotland for SSI-3 (Fig. S9); and in WS and catchments across northern England, Northern Ireland and northern Wales in 1946; across the UK in winter 1947 for SSI-3, and prolonged drought conditions (albeit mild) occurred across much of England and Wales 1948–1950, with severe drought in NEE in 1949 for SSI-12.
While past studies have identified historic drought episodes in the UK (as summarised in the Introduction), a detailed, quantitative assessment of hydrological droughts at the national scale has been lacking. This paper provides the first systematic characterisation and ranking of hydrological droughts for a period of ∼125 years for the UK, using a network of near-natural catchments. In the following discussion, we compare the findings with previous studies, address the scientific and practical significance of the outcomes, and outline key limitations and recommendations for future research.
4.1 Historic hydrological droughts
Understanding historic drought occurrence, duration and severity is vital for drought risk estimation and management in any location and provides a baseline against which future change can be assessed. For the UK, the primary national-scale assessment of past droughts is MCW2007 and the companion report (Cole and Marsh, 2005). Here, we set our findings in the context of these previous assessments. Unsurprisingly, there is good agreement as to what constitutes the most significant events at the national scale, for example, the Long Drought period (1891–1910), 1933–1934, 1975–1976, and 1995–1997. However, there are also some important differences. MCW2007 deliberately highlighted national-scale events which showed evidence of demonstrable societal impact and so excluded some of the droughts identified here which were either more regionally focussed or lacked the supporting documentary evidence of impacts. Critical droughts for individual catchments may not be those that occurred nationally, so it is important to consider the most severe droughts on a catchment, or regional, basis. The focus here on characterisation of the identified events for catchments across the UK provides more detail than is provided by MWC2007, which quantified severity for only a handful of long-term hydrometeorological series in the north-west of England and East Anglia.
At the national scale, Jones and Lister (1998) used the drought deficit index to identify droughts in 15 catchments across England and Wales using reconstructed river flows from 1865 to 1993, assessing the severity of the 1989–1992 drought in the context of previous events. Over an 18-month accumulation period of the drought deficit index, the following events ranked as most severe: 1975–1976, 1887–1888, 1905–1906, 1921–1922, 1933–1934 and 1943–1944. These events compare well with those identified here, with the exception of 1887–1888, which is outside of the reconstructed period. Inter-decadal variability is apparent in both sets of reconstructed droughts, with drought-rich periods in the 1890s and 1940s. With just 15 catchments, Jones and Lister (1998) could not capture regional- and national-scale events. Here, however, the national picture is more developed with space–time evolution of events and systematic rankings shown for 108 UK catchments for the 125 year period, 1891–2015, encompassing the most recent events, with analysis based on reconstructed flows modelled using robust methods (Smith et al., 2019).
Our results also resonate with other historical drought studies in the UK (e.g. Fowler and Kilsby, 2002; Lennard et al., 2016; Spraggs et al., 2015; Rudd et al., 2017). These studies typically focussed on regional assessments using a small number of catchments or gauges. Although there were parallels with the results shown here, their transferability is limited by their regional scope and differing methods of assessment. For example, Spraggs et al. (2015), also find the 1989–1992 event to be the most severe for the river Lud (ANG) in river flow reconstructions from 1798 to 2010, and events identified in Yorkshire by Fowler and Kilsby (2002), corresponded to those in the top 10 rankings for NEE, such as SSI-12 for duration, accumulated deficit and mean deficit: 1905, 1940s, the mid 1960s and 1970s, and early 1990s.
Parallels with studies in Europe and at the continental scale are also evident, although few studies focus on hydrological droughts at the catchment scale, with most using meteorological drought indices. Spinoni et al. (2015) used the standardised precipitation index (SPI) to identify and rank events for Europe 1950–2010 and found that for Great Britain, more severe events occurred in the earlier part of this time frame, with 1975–1976 ranking as the most severe for Great Britain, whilst 1959 was most extensive. Van der Schrier et al. (2006) extend further back in time (1901–2002), using meteorological drought indices based on the Palmer drought severity index. They found that the driest year occurred in 1947, followed by 1921 and 1950, with exceptionally dry summers in England in 1976 and 1921 and in Scotland in 1949, 1945 and 1946. Across the island of Ireland, Noone et al. (2017) found that the most severe events extracted from SPI derived from recovered rainfall data occurred in the mid-1800s to late 1800s but also noted that all of the events within the top 10 rankings for the four event characteristics as used here occurred before 1977. Although there were fewer top-ranking events after the 1975–1976 event here, events of the 1990s and 2010–2012 did rank in the top 10 for both SSI-3 and SSI-12 (Figs. S5 and 6, respectively). The lower numbers of drought events post-1980 here and in Noone et al. (2017) are commensurate with increasing trends in runoff in the northern and western parts of the UK (e.g. Hannaford, 2015). Although Hanel et al. (2018) did not include the British Isles in their analyses, they found that large-scale drought events occurred in 1921–1922 and 1949–1950 across Europe in terms of meteorological, hydrological and agricultural drought. In terms of hydrological droughts, Sheffield et al. (2009) identified events at the continental scale from global VIC model outputs over 1950–2000: events in the 1960s and 1975–1976 ranked as the most severe across Europe (although they were focussed in western and eastern Europe), with much of Europe also affected by drought in 1953–1954. In a low-flow assessment using modelled reconstructions for over 650 catchments across France for the period 1800–2012, Caillouet et al. (2017) found that 1976 was the longest and most severe event in northern France. Given the spatial footprint of the event (Briffa et al., 2009), it is unsurprising that 1976 is similarly highly ranked in southern England in terms of accumulated and mean deficit (e.g. Figs. 5 and 6).
It is instructive to consider why the events identified in Figs. 8 and S7 were not regarded as major events by MCW2007 and others. The events of the late 1960s and early 1970s were somewhat overshadowed by the 1975–1976 event, in which there were dramatic impacts on water supplies and the environment across the UK (e.g. Doornkamp et al., 1980; Rodda and Marsh, 2011). Although the 1975–1976 event was a distinct event, the 20-year period between 1960 and 1979 can be seen to be drought-rich in Figs. 3 and S2, within which events rank as most severe and fall within the top 10 (Figs. 5 and 6; Figs. S3 and S6). In this study the 1940s ranked highly across the different event characteristics and affected much of the country, with flow deficits occurring somewhere in all months throughout this period (Figs. 10 and S2). Although 1943–1944 was classed as a major hydrological event by MCW2007 the documentary evidence to support the physical manifestation of the drought was lacking in the post-war period. As such, the importance of the hydrological droughts of the 1940s are probably understated, as was found by Rudd et al. (2017), and the findings of this study (along with regional assessments such as Spraggs et al., 2015, who found it to be a significant event in East Anglia), indicating that it was a national-scale event (Fig. 10d) which may have had substantial impacts on society and the environment.
It is of course important to re-emphasise the hydrological focus of this study. Although the 1959 and 2004 events were identified here, they were not often ranked as most severe (with the exception of 1959 for SSI-12 maximum intensity, Fig. 9). These events may be better characterised by rainfall (1959) or groundwater (2004–2006) drought indices. The addition of impact information (as in MWC2007 or Noone et al., 2017, for example) would shed more light on these events, the severity of deficits and their impacts (see Sect. 4.3).
The benefit of using of the two accumulation periods is highlighted when considering the 1984 event, which was not identified using SSI-12 but was ranked as most severe for 16 catchments across western Britain when using SSI-3. Figures 5 and S3 also show the benefit of utilising the different event characteristics, as different events are ranked as most severe when each of the characteristics is considered. This is particularly important for water managers who may be dependent on water sources with differing levels of responsiveness for their supply, such as single-season reservoirs, or those with more memory that respond more slowly, such as groundwater-dominated river flows.
4.2 Applications
The extracted events and new analyses presented here can support further work on the trends and variability in hydrological droughts in the UK. Although work has been undertaken to understand the link between droughts in the UK and large-scale atmospheric forcings (e.g. Folland et al., 2015; Svensson and Hannaford, 2019), this longer, wider set of drought event reconstructions provides a much broader dataset to assess large-scale patterns which cause the clustering of drought events. A better understanding of the relationship between large-scale atmospheric forcings and drought event characteristics would be useful in the context of drought monitoring, early warning and forecasting applications.
Using reconstructed river flow data (opposed to using observed data) not only extends record lengths on average by ∼75 years but, when considering the identified and characterised events, provides a much larger pool of events to work with. Across all catchments, ∼67 % and ∼65 % of events (extracted from the SSI-12 and SSI-3, respectively) occurred before the observed records began. This highlights the benefit of the long-term view and increasing the pool of events to improve our understanding of past hydrological drought behaviours. Our findings have important implications for those considering hydrological drought risk, particularly for water resource planners. These reconstructed drought series can be applied in the stress testing of water resource systems for water resource management and drought plans. Most directly, the results can assist in conventional stress tests using the worst droughts on record (e.g. Environment Agency, 2015) but can also inform “scenario” stress tests based on synthetic designed droughts (e.g. Watts et al., 2012; Anderton et al., 2015). Similarly, the results can provide inputs to – or corroboration for – the stochastic drought generation techniques that are increasingly used in UK water resource and drought planning (e.g. Atkins, 2016).
Some studies (e.g. Spraggs et al., 2015; Lennard et al., 2016) have demonstrated that extending the hydrological records does not improve water resource planning in particular water supply regions of the UK. However, their regional focus and infrastructure modelling limits their applicability to other locations where earlier droughts may have substantial impacts on supplies. The results presented here demonstrate that in many regions of the UK, some of the most severe hydrological droughts occurred in the late 19th and early 20th centuries. Further work is required to run such sequences through water supply system models to understand the impacts on drought risk assessments and thus on management plans. But the data and knowledge developed here provide a consistent national resource for such studies, which is particularly important, as more collaborative regional and national planning is becoming a key priority in the UK (Water UK, 2016; National Infrastructure Commission, 2018). The regional differences in the most severe events over the past ∼125 years and the range of event characteristics (i.e. accumulated deficit, duration, mean deficit and maximum intensity) shown here provide a valuable toolkit for assessing hydrological droughts across the country. To this end, results for individual catchments (the full set of 303 catchments for which reconstructions are available) and additional accumulation periods can be explored using the “UK Hydrological Drought Explorer” (https://shiny-apps.ceh.ac.uk/hydro_drought_explorer/, last access: 1 November 2019), including SSI time series, extracted events and the most severe droughts (ranked by the four event characteristics) – see the Data Availability section.
4.3 Data limitations and future work
The SSI was derived from daily river flow reconstructions (Smith et al., 2018), extending the gauged record of the LFBN catchments by, on average, more than 75 years and at most 86 years. When deriving the SSI, uncertainties may arise from fitting the selected distribution (e.g. Stagge et al., 2015; Svensson et al., 2017); however, the Tweedie distribution has been found to fit well for UK river flow data and is recommended by Svensson et al. (2017). Smith et al. (2019) assessed the performance of the modelled flow reconstructions and the derived SSI for 303 UK catchments (including the LFBN). Although the SSI was found to exacerbate any model errors in the flow simulations and the exact magnitude of flow deficits may not be well captured by the reconstructed SSI, the peaks and troughs and the drought events extracted from the reconstructions compared well to those from observed flows (using the same identification methodology as used here; Smith et al., 2019). The relative rankings of the extracted drought events presented here should, therefore, be well captured.
The flow reconstructions of Smith et al. (2018) provide the top 500 ensemble members for each of the LFBN catchments (within the full set of 303 catchments). However, in this study, the single best-performing model run (LHS1) was used for each catchment without accounting for model uncertainty due to the computational implications of deriving the SSI using the Tweedie distribution for 500 model parameterisations for each catchment. Due to the identified uncertainties in deficit magnitudes in some catchments by Smith et al. (2019), utilising the ensemble data in future studies will provide more confidence in the extraction of drought events that are near the threshold of severe drought (i.e. an SSI value of −1.5).
Here, the SSI was calculated using a reference period of 1961–2010 for consistency with companion datasets of the gridded standardised precipitation index for the UK (Tanguy et al., 2015, 2017). Although this period encompasses well defined flood-rich and drought-rich and flood-poor and drought-poor periods, the derived SSI and extracted and ranked drought events are derived relative to this period. As high and low rainfall and river flows become more extreme in the future (e.g. Prudhomme et al., 2014), these data should be used with caution for future assessments.
Although reconstruction modelling approaches are valuable, providing otherwise unavailable data for historic events, the limitations of the approach should be recognised. They provide systematic series for the past, but modelling approaches do not address non-stationarities in catchment response, land use change etc. As such, there remains a need for long-term hydrometric data rescue and recovery (e.g. at Wendover Springs; Bayliss et al., 2004), curation (e.g. Dixon et al., 2013), and the incorporation of additional strands of evidence (e.g. documentary, epigraphic and paleohydrological) to supplement and bolster the analysis of hydrological extremes (e.g. Kjeldsen et al., 2014).
The long time series of the SSI and the extracted drought events presented here provide the potential for national-scale assessments of trends, changes in timing and seasonality of drought events across the UK. However, when managing and planning for drought, it is also important to consider meteorological and groundwater droughts. Recovered and reconstructed data from the Historic Droughts project (e.g. Bloomfield et al., 2018; Durant and Counsell, 2018) will enable a more holistic analysis of UK drought at both the national and regional scale. By design drought impacts were not considered here; however, this paper presents a systematic characterisation of UK droughts which can be analysed in conjunction with impact information from a range of sources in the future, for example the European Drought Impact report Inventory (Stahl et al., 2016) and references to drought from British newspapers (e.g. Baker et al., 2019).
This study presents timelines of historic reconstructed droughts for 108 near-natural catchments extracted from the standardised streamflow index (SSI) for 3-month and 12-month accumulation periods. It characterises and ranks these past drought events and assesses how relative rankings for each characteristic vary geographically for the first time in the UK. It also provides a fuller understanding of the evolution and characteristics of major, nationally important droughts from the pre-observation period. The results here reflect the work of previous studies in the UK and at the European scale, identifying well-known events as extreme events for the UK (e.g. 1976), but also shed light on events of the 20th century that have not previously been considered to be significant (whether due to a lack of data or evidence of impact), such as the droughts of the 1940s and early 1970s. Results highlight that a range of timescales, or accumulation periods, should be considered when assessing drought severity and hazard in different locations and for different sectors dependent on water sources with varying response time. By using continuous time series of reconstructed river flow, consistent, objective drought event identification methods and quantitative appraisal of multiple drought characteristics, this study provides a more longitudinal view of drought occurrence and characteristics over a ∼125 year period for the UK with the higher-resolution, catchment-scale detail important for both science and drought planning applications of the future.
The reconstructed daily streamflow data are freely available for download via the Environmental Data Information Centre along with associated metadata on the model performance (Smith et al., 2018). The performance of the model in each catchment, as well as the reconstructed daily river flow time series, can be explored using an interactive web application, the “UK Reconstructed Flow Data Explorer”, at https://shiny-apps.ceh.ac.uk/reconstruction_explorer/ (last access: 1 November 2019).
Standardised streamflow index data are freely available for download via the Environmental Data Information Centre (Barker et al., 2018b). These SSI data, along with further event analyses, can be explored for the LFBN using an interactive web application, the “UK Hydrological Drought Explorer”, at https://shiny-apps.ceh.ac.uk/hydro_drought_explorer/ (last access: 1 November 2019).
The supplement related to this article is available online at: https://doi.org/10.5194/hess-23-4583-2019-supplement.
LB, JH and SP discussed and developed the aims of the paper. LB was responsible for the data analysis and visualisation. LB and JH prepared the original paper, with contributions from SP, KS, MT and CP.
The authors declare that they have no conflict of interest.
This research is an outcome of the UK Drought & Water Scarcity Programme “Analysis of historic droughts and water scarcity in the UK” project, and financial support was provided by the UK Natural Environment Research Council (NE/L01061X/1).
This research has been supported by the Natural Environment Research Council (grant no. NE/L01016X/1).
This paper was edited by Uwe Ehret and reviewed by two anonymous referees.
Adaptation Sub-Committee: UK Climate Change Risk Assessment 2017: Synthesis Report: priorities for the next five years, Adaptation Sub-Committee of the Committee on Climate Change, London, 2016.
Anderton, S., Ledbetter, R., and Prudhomme, C.: Understanding the performance of water supply systems during mild to extreme droughts, Environment Agency, Bristol, 2015.
Atkins: Thames Water Stochastic Resource Modelling: Stage 2&3 Report, Atkins, availabel at: https://corporate.thameswater.co.uk/-/media/Site-Content/Corporate/Media/Thames-Water-Reports-Page/Stochastics-Water-Resources-Analysis-October-2016.pdf (last access: 1 November 2019), 2016.
Bachmair, S., Stahl, K., Collins, K., Hannaford, J., Acreman, M., Svoboda, M., Knutson, C., Smith, K. H., Wall, N., Fuchs, B., Crossman, N. D., and Overton, I. C.: Drought indicators revisited: the need for a wider consideration of environment and society, Wiley Interdisciplin. Rev.: Water, 3, 516–536, https://doi.org/10.1002/wat2.1154, 2016a.
Bachmair, S., Svensson, C., Hannaford, J., Barker, L. J., and Stahl, K.: A quantitative analysis to objectively appraise drought indicators and model drought impacts, Hydrol. Earth Syst. Sci., 20, 2589–2609, https://doi.org/10.5194/hess-20-2589-2016, 2016b.
Baker, H., Fry, M., and Bachiller-Jareno, N.: Historic droughts inventory of references from British twentieth-century newspapers 1900–1999, UK Data Service, https://doi.org/10.5255/UKDA-SN-853196, 2019.
Barker, L. J., Hannaford, J., Chiverton, A., and Svensson, C.: From meteorological to hydrological drought using standardised indicators, Hydrol. Earth Syst. Sci., 20, 2483–2505, https://doi.org/10.5194/hess-20-2483-2016, 2016.
Barker, L. J., Mastrantonas, N., Lewis, M., and Clemas, S.: Hydrological summary for the United Kingdom: July 2018, NERC/Centre for Ecology & Hydrology, Wallingford, UK, 2018a.
Barker, L. J., Smith, K. A., Svensson, C., Tanguy, M., and Hannaford, J.: Historic Standardised Streamflow Index (SSI) using Tweedie distribution with standard period 1961–2010 for 303 UK catchments (1891–2015), NERC Environmental Information Data Centre, https://doi.org/10.5285/58ef13a9-539f-46e5-88ad-c89274191ff9, 2018b.
Bayliss, A., Norris, J., and Marsh, T.: The Wendover Springs record: An insight into the past and a benchmark for the future, Weather, 59, 267–271, 2004.
Bloomfield, J. P., Marchant, B. P., and Wang, L.: Historic Standardised Groundwater level Index (SGI) for 54 UK boreholes (1891–2015), NERC Environmental Information Data Centre, https://doi.org/10.5285/d92c91ec-2f96-4ab2-8549-37d520dbd5fc, 2018.
Briffa, K., Van Der Schrier, G., and Jones, P.: Wet and dry summers in Europe since 1750: evidence of increasing drought, Int. J. Climatol., 29, 1894–1905, 2009.
Brown, C. M., Lund, J. R., Cai, X., Reed, P. M., Zagona, E. A., Ostfeld, A., Hall, J., Characklis, G. W., Yu, W., and Brekke, L.: The future of water resources systems analysis: Toward a scientific framework for sustainable water management, Water Resour. Res., 51, 6110–6124, 2015.
Caillouet, L., Vidal, J. P., Sauquet, E., Devers, A., and Graff, B.: Ensemble reconstruction of spatio-temporal extreme low-flow events in France since 1871, Hydrol. Earth Syst. Sci., 21, 2923–2951, https://doi.org/10.5194/hess-21-2923-2017, 2017.
Cole, G. and Marsh, T.: Major Droughts in England and Wales from 1800 – and Evidence of Impact, Environment Agency, Bristol, 2005.
Coron, L., Thirel, G., Delaigue, O., Perrin, C., and Andréassian, V.: The suite of lumped GR hydrological models in an R package, Environ. Model. Softw., 94, 166–171, 2017.
Dixon, H., Hannaford, J., and Fry, M. J.: The effective management of national hydrometric data: experiences from the United Kingdom, Hydrolog. Sci. J., 58, 1383–1399, 2013.
Doornkamp, J., Gregory, K., and Burn, A.: Atlas of Drought 1975–1976, Institute of British Geographers, London, 1980.
Durant, M. J. and Counsell, C. J.: Inventory of reservoirs amounting to 90 % of total UK storage, NERC Environmental Information Data Centre, Wallingford, 2018.
Environment Agency: Water for People and the Environment: Water resources strategy for England and Wales, Environment Agency, Bristol, UK, 2009.
Environment Agency: Write a drought plan: How to write a water company drought plan: https://www.gov.uk/guidance/write-a-drought-plan (last access: 1 November 2019), 2015.
Environment Agency and Natural Resources Wales: Water stressed areas – final classification, Environment Agency & Natural Resources Wales, Bristol/Cardiff, 2013.
Folland, C. K., Hannaford, J., Bloomfield, J. P., Kendon, M., Svensson, C., Marchant, B. P., Prior, J., and Wallace, E.: Multi-annual droughts in the English Lowlands: a review of their characteristics and climate drivers in the winter half-year, Hydrol. Earth Syst. Sci., 19, 2353–2375, https://doi.org/10.5194/hess-19-2353-2015, 2015.
Fowler, H. and Kilsby, C.: A weather-type approach to analysing water resource drought in the Yorkshire region from 1881 to 1998, J. Hydrol., 262, 177–192, 2002.
Hanel, M., Rakovec, O., Markonis, Y., Máca, P., Samaniego, L., Kyselý, J., and Kumar, R.: Revisiting the recent European droughts from a long-term perspective, Scient. Rep., 8, 9499, https://doi.org/10.1038/s41598-018-27464-4, 2018.
Hannaford, J.: Climate-driven changes in UK river flows:A review of the evidence, Prog. Phys. Geogr., 39, 29–48, https://doi.org/10.1177/0309133314536755, 2015.
Harrigan, S., Hannaford, J., Muchan, K., and Marsh, T.: Designation and trend analysis of the updated UK Benchmark Network of river flow stations: The UKBN2 dataset, Hydrol. Res., 49, 552–567, https://doi.org/10.2166/nh.2017.058, 2017.
Harrigan, S., Prudhomme, C., Parry, S., Smith, K., and Tanguy, M.: Benchmarking ensemble streamflow prediction skill in the UK, Hydrol. Earth Syst. Sci., 22, 2023–2039, https://doi.org/10.5194/hess-22-2023-2018, 2018.
Hollis, D., McCarthy, M., Kendon, M., Legg, T., and Simpson, I.: HadUK-Grid – A new UK dataset of gridded climate observations, Geosci. Data J., https://doi.org/10.1002/gdj3.78, in press, 2019.
Jones, P. D.: Riverflow reconstruction from precipitation data, J. Climatol., 4, 171–186, 1984.
Jones, P. D. and Lister, D.: Riverflow reconstructions for 15 catchments over England and Wales and an assessment of hydrologic drought since 1865, Int. J. Climatol., 18, 999–1013, 1998.
Jones, P. D., Lister, D. H., Wilby, R. L., and Kostopoulou, E.: Extended riverflow reconstructions for England and Wales, 1865–2002, Int. J. Climatol., 26, 219–231, https://doi.org/10.1002/joc.1252, 2006.
Kendon, M., Marsh, T., and Parry, S.: The 2010–2012 drought in England and Wales, Weather, 68, 88–95, https://doi.org/10.1002/wea.2101, 2013.
Kjeldsen, T. R. and Prosdocimi, I.: Assessing the element of surprise of record-breaking flood events, J. Flood Risk Manage., 11, S541–S553, https://doi.org/10.1111/jfr3.12260, 2018.
Kjeldsen, T. R., Macdonald, N., Lang, M., Mediero, L., Albuquerque, T., Bogdanowicz, E., Brazdil, R., Castellarin, A., David, V., and Fleig, A.: Documentary evidence of past floods in Europe and their utility in flood frequency estimation, J. Hydrol., 517, 963–973, 2014.
Lennard, A. T., Macdonald, N., Clark, S., and Hooke, J. M.: The application of a drought reconstruction in water resource management, Hydrol. Res., 47, 646–659, https://doi.org/10.2166/nh.2015.090, 2016.
Marsh, T.: The 2004–2006 drought in southern Britain, Weather, 62, 191–196, 2007.
Marsh, T., Cole, G., and Wilby, R.: Major droughts in England and Wales, 1800–2006, Weather, 62, 87–93, https://doi.org/10.1002/wea.67, 2007.
Met Office: HadUK-Grid Gridded Climate Observations on a 1 km grid over the UK for 1862–2017, Centre for Environmental Data Analysis, available at: http://catalogue.ceda.ac.uk/uuid/2a62652a4fe6412693123dd6328f6dc8 (last access: 1 November 2019), 2018.
Met Office: MIDAS Open: UK daily rainfall data, v201901, Centre for Environmental Data Analysis, https://doi.org/10.5285/ec54d5e5288a4ebb8c7ad2a1ef6aec42, 2019.
National Infrastructure Commission: Preparing for a drier future: England's water infrastructure needs, available at: https://www.nic.org.uk/publications/preparing-for-a-drier-future-englands-water-infrastructure-needs/ (last access: 1 November 2019), 2018.
Noone, S., Broderick, C., Duffy, C., Matthews, T., Wilby, R. L., and Murphy, C.: A 250-year drought catalogue for the island of Ireland (1765–2015), Int. J. Climatol., 37, 239–254, https://doi.org/10.1002/joc.4999, 2017.
Parry, S., Wilby, R. L., Prudhomme, C., and Wood, P. J.: A systematic assessment of drought termination in the United Kingdom, Hydrol. Earth Syst. Sci., 20, 4265–4281, https://doi.org/10.5194/hess-20-4265-2016, 2016.
Perrin, C., Michel, C., and Andréassian, V.: Improvement of a parsimonious model for streamflow simulation, J. Hydrol., 279, 275–289, https://doi.org/10.1016/S0022-1694(03)00225-7, 2003.
Pfister, C., Weingartner, R., and Luterbacher, J.: Hydrological winter droughts over the last 450 years in the Upper Rhine basin: a methodological approach, Hydrolog. Sci. J., 51, 966–985, https://doi.org/10.1623/hysj.51.5.966, 2006.
Prudhomme, C., Parry, S., Hannaford, J., Clark, D. B., Hagemann, S., and Voss, F.: How Well Do Large-Scale Models Reproduce Regional Hydrological Extremes in Europe?, J. Hydrometeorol., 12, 1181–1204, https://doi.org/10.1175/2011jhm1387.1, 2011.
Prudhomme, C., Giuntoli, I., Robinson, E. L., Clark, D. B., Arnell, N. W., Dankers, R., Fekete, B. M., Franssen, W., Gerten, D., Gosling, S. N., Hagemann, S., Hannah, D. M., Kim, H., Masaki, Y., Satoh, Y., Stacke, T., Wada, Y., and Wisser, D.: Hydrological droughts in the 21st century, hotspots and uncertainties from a global multimodel ensemble experiment, P. Natl. Acad. Sci. USA, 111, 3262–3267, https://doi.org/10.1073/pnas.1222473110, 2014.
Rodda, J. and Marsh, T.: The 1975–76 Drought – a contemporary and retrospective review, National Hydrological Monitoring Programme series, NERC/Centre for Ecology & Hydrology, Wallingford, 2011.
Rudd, A. C., Bell, V. A., and Kay, A. L.: National-scale analysis of simulated hydrological droughts (1891–2015), J. Hydrol., 550, 368–385, https://doi.org/10.1016/j.jhydrol.2017.05.018, 2017.
Sheffield, J., Andreadis, K. M., Wood, E. F., and Lettenmaier, D. P.: Global and Continental Drought in the Second Half of the Twentieth Century: Severity–Area–Duration Analysis and Temporal Variability of Large-Scale Events, J. Climate, 22, 1962–1981, https://doi.org/10.1175/2008jcli2722.1, 2009.
Smith, K. A., Tanguy, M., Hannaford, J., and Prudhomme, C.: Historic reconstructions of daily river flow for 303 UK catchments (1891–2015), NERC Environmental Information Data Centre, https://doi.org/10.5285/f710bed1-e564-47bf-b82c-4c2a2fe2810e, 2018.
Smith, K. A., Barker, L. J., Tanguy, M., Parry, S., Harrigan, S., Legg, T., Prudhomme, C., and Hannaford, J.: A Multi-Objective Ensemble Approach to Hydrological Modelling in the UK: An Application to Historic Drought Reconstruction, Hydrol. Earth Syst. Sci., 23, 3247–3268, https://doi.org/10.5194/hess-23-3247-2019, 2019.
Spinoni, J., Naumann, G., Vogt, J. V., and Barbosa, P.: The biggest drought events in Europe from 1950 to 2012, J. Hydrol.: Reg. Stud., 3, 509–524, 2015.
Spraggs, G., Peaver, L., Jones, P., and Ede, P.: Re-construction of historic drought in the Anglian Region (UK) over the period 1798–2010 and the implications for water resources and drought management, J. Hydrol., 526, 231–252, https://doi.org/10.1016/j.jhydrol.2015.01.015, 2015.
Stagge, J. H., Tallaksen, L. M., Gudmundsson, L., Van Loon, A. F., and Stahl, K.: Candidate Distributions for Climatological Drought Indices (SPI and SPEI), Int. J. Climatol., 35, 4027–4040, https://doi.org/10.1002/joc.4267, 2015.
Stahl, K., Kohn, I., Blauhut, V., Urquijo, J., De Stefano, L., Acácio, V., Dias, S., Stagge, J. H., Tallaksen, L. M., Kampragou, E., Van Loon, A. F., Barker, L. J., Melsen, L. A., Bifulco, C., Musolino, D., de Carli, A., Massarutto, A., Assimacopoulos, D., and Van Lanen, H. A. J.: Impacts of European drought events: insights from an international database of text-based reports, Nat. Hazards Earth Syst. Sci., 16, 801–819, https://doi.org/10.5194/nhess-16-801-2016, 2016.
Svensson, C. and Hannaford, J.: Oceanic conditions associated with Euro-Atlantic high pressure and UK drought, Environ. Res. Commun., 1, 101001, https://doi.org/10.1088/2515-7620/ab42f7, 2019.
Svensson, C., Hannaford, J., and Prosdocimi, I.: Statistical distributions for monthly aggregations of precipitation and streamflow in drought indicator applications, Water Resour. Res., 53, 999–1018, 2017.
Tanguy, M., Hannaford, J., Barker, L., Svensson, C., Kral, F., and Fry, M.: Gridded Standardized Precipitation Index (SPI) using gamma distribution with standard period 1961–2010 for Great Britain [SPIgamma61-10], NERC Environmental Information Data Centre, https://doi.org/10.5285/94c9eaa3-a178-4de4-8905-dbfab03b69a0, 2015.
Tanguy, M., Fry, M., Svensson, C., and Hannaford, J.: Historic Gridded Standardised Precipitation Index for the United Kingdom 1862–2015 (generated using gamma distribution with standard period 1961–2010) v4, NERC Environmental Information Data Centre, https://doi.org/10.5285/233090b2-1d14-4eb9-9f9c-3923ea2350ff, 2017.
Tanguy, M., Prudhomme, C., Smith, K., and Hannaford, J.: Historical gridded reconstruction of potential evapotranspiration for the UK, Earth Syst. Sci. Data, 10, 951–968, https://doi.org/10.5194/essd-10-951-2018, 2018.
Thompson, V., Dunstone, N. J., Scaife, A. A., Smith, D. M., Slingo, J. M., Brown, S., and Belcher, S. E.: High risk of unprecedented UK rainfall in the current climate, Nat. Commun., 8, 107, https://doi.org/10.1038/s41467-017-00275-3, 2017.
Todd, B., Macdonald, N., Chiverrell, R. C., Caminade, C., and Hooke, J. M.: Severity, duration and frequency of drought in SE England from 1697 to 2011, Climatic Change, 121, 673–687, https://doi.org/10.1007/s10584-013-0970-6, 2013.
Van der Schrier, G., Briffa, K., Jones, P., and Osborn, T.: Summer moisture variability across Europe, J. Climate, 19, 2818–2834, 2006.
Van Lanen, H., Wanders, N., Tallaksen, L., and Van Loon, A.: Hydrological drought across the world: impact of climate and physical catchment structure, Hydrol. Earth Syst. Sci., 17, 1715–1732, https://doi.org/10.5194/hess-17-1715-2013, 2013.
Van Loon, A. F., Gleeson, T., Clark, J., Van Dijk, A. I. J. M., Stahl, K., Hannaford, J., Di Baldassarre, G., Teuling, A. J., Tallaksen, L. M., Uijlenhoet, R., Hannah, D. M., Sheffield, J., Svoboda, M., Verbeiren, B., Wagener, T., Rangecroft, S., Wanders, N., and Van Lanen, H. A. J.: Drought in the Anthropocene, Nat. Geosci., 9, 89–91, https://doi.org/10.1038/ngeo2646, 2016.
Vicente-Serrano, S. M., López-Moreno, J. I., Beguería, S., Lorenzo-Lacruz, J., Azorin-Molina, C., and Morán-Tejeda, E.: Accurate computation of a streamflow drought index, J. Hydrol. Eng., 17, 318–332, 2011.
Water UK: Water resources long term planning framework (2015–2065), Water UK, London, 2016.
Watts, G., von Christierson, B., Hannaford, J., and Lonsdale, K.: Testing the resilience of water supply systems to long droughts, J. Hydrol., 414, 255–267, 2012.
Watts, G., Battarbee, R. W., Bloomfield, J. P., Crossman, J., Daccache, A., Durance, I., Elliott, J. A., Garner, G., Hannaford, J., Hannah, D. M., Hess, T., Jackson, C. R., Kay, A. L., Kernan, M., Knox, J., Mackay, J., Monteith, D. T., Ormerod, S. J., Rance, J., Stuart, M. E., Wade, A. J., Wade, S. D., Weatherhead, K., Whitehead, P. G., and Wilby, R. L.: Climate change and water in the UK – past changes and future prospects, Prog. Phys. Geogr., 39, 6–28, https://doi.org/10.1177/0309133314542957, 2015.
Wilhite, D. A., Hayes, M. J., Knutson, C., and Smith, K. H.: Planning for Drought: Moving From Crisis to Risk Management 1, J. Am. Water Resour. Assoc., 36, 697–710, 2000.