the Creative Commons Attribution 4.0 License.
the Creative Commons Attribution 4.0 License.
 | 18 Nov 2019
Quantification of soil water balance components based on continuous soil moisture measurement and the Richards equation in an irrigated agricultural field of a desert oasis
Zhongkai Li
Wenzhi Zhao
Qiyue Yang
Rong Yang
Jintao Liu
An accurate assessment of soil water balance components (SWBCs) is necessary for improving irrigation strategies in any water-limited environment. However, quantitative information on SWBCs is usually challenging to obtain, because none of the components (i.e., irrigation, drainage, and evapotranspiration) can be easily measured under actual conditions. Soil moisture is a variable that integrates the water balance components of land surface hydrology, and the evolution of soil moisture is assumed to contain the memory of antecedent hydrologic fluxes, and can thus be used to determine SWBCs from a hydrologic balance. A database of soil moisture measurements from six experimental plots with different treatments in the middle Heihe River basin of China was used to test the potential of a such a database for estimating SWBCs. We first compared the hydrophysical properties of the soils in these plots, such as vertical saturated hydraulic conductivity (Ks) and soil water retention features, for supporting SWBC estimations. We then determined evapotranspiration and other SWBCs using a method that combined the soil water balance method and the inverse Richards equation (a model of unsaturated soil water flow based on the Richards equation). To test the accuracy of our estimation, we used both indirect methods (such as power consumption of the pumping irrigation well and published SWBCs values at nearby sites) and the water balance equation technique to verify the estimated SWBCs values, all of which showed good reliability with respect to our estimation method. Finally, the uncertainties of the proposed methods were analyzed to evaluate the systematic error of the SWBC estimation and any restrictions regarding its application. The results showed significant variances among the film-mulched plots in both the cumulative irrigation volumes (652.1–867.3 mm) and deep drainages (170.7–364.7 mm). Moreover, the un-mulched plot had remarkably higher values in both cumulative irrigation volumes (1186.5 mm) and deep drainages (651.8 mm) compared with the mulched plots. Obvious correlation existed between the volume of irrigation and that of drained water. However, the ET demands for all of the plots behaved pretty much the same, with the cumulative ET values ranging between 489.1 and 561.9 mm for the different treatments in 2016, suggesting that the superfluous irrigation amounts had limited influence on the accumulated ET throughout the growing season due to the poor water-holding capacity of the sandy soil. This work confirmed that relatively reasonable estimations of the SWBCs in coarse-textured sandy soils can be derived by using soil moisture measurements; the proposed methods provided a reliable solution over the entire growing season and showed a great potential for identifying appropriate irrigation amounts and frequencies, and thus a move toward sustainable water resources management, even under traditional surface irrigation conditions.


Arid inland river basins in northwestern China are unique ecosystems consisting of ice and snow, frozen soil, alpine vegetation, oases, deserts, and riparian forest landscapes, in a delicate eco-hydrological balance (Liu et al., 2015). Among these inland basins, the Heihe River basin (HRB) is one of the largest (Chen et al., 2007). The oasis plains in the middle reaches of the HRB have become an important source of grains, including the largest maize seed production center in China (Yang et al., 2015). Crop water requirements in this region are supplied mainly by irrigation from the river and from groundwater (Zhou et al., 2017). According to Wang et al. (2014), agriculture consumes 80 % to 90 % of the total water resources in the HRB and has fundamentally altered the regional hydrological processes and even resulted in eco-environmental deterioration (Zhao and Chang, 2014). Traditional irrigation, namely flood irrigation in the HRB, has low efficiency (i.e., a high leaching fraction – the ratio of the actual depth of drainage to the depth of irrigation) (Li et al., 2017; Deng et al., 2006), and the extensive fertilization practices have given rise to higher levels of potential nitrate contamination in the groundwater because water and pollutants percolate into the deep sandy soils of the desert oasis, which have low water-holding capacities (Zhao and Chang, 2014). It is crucial to adopt a mechanism that can preserve the role of irrigation in food security, yet with minimal consumption of the already scarce water, in order to increase water productivity and conservation. Reducing water drainage and, thus, nitrate contamination in groundwater, saving water, and increasing water and nitrogen use efficiency, are turning out to be important steps toward sustainable agriculture in this region (Hu et al., 2008; Yu et al., 2019) – steps that are being implemented by developing effective irrigation schedules (Su et al., 2014).
An efficient irrigation scheduling program should aim to replenish the water deficit within the root zone while minimizing leaching below this depth (Bourazanis et al., 2015). Accordingly, an accurate assessment of soil water balance components (SWBCs: this abbreviation is used in this paper for simplicity) is necessary for improving the irrigation management strategies in the oasis fields. However, quantitative information on SWBCs is usually challenging to obtain (Dejen, 2015). In desert oasis settings, the hydrological process of farmland is principally dominated by irrigation (I), drainage (D), and evapotranspiration (ET). However, none of these components are easily measured in practice. For example, not even the site-specific amount of irrigation can be determined accurately: the two most common methods of measuring irrigation water – water meters or indirect methods – pose both economic and operational challenges to water managers, due to the wide spatial distribution of small fields throughout rural areas (Folhes et al., 2009). Measurement of deep percolation is also difficult (Bethune et al., 2008; Odofin et al., 2012), and reliable data are rare in practice; thus, percolation is often calculated as a residual of the water balance, e.g., Zhang et al. (2014) estimated the deep percolation in an irrigated cropland of the Kaidu River–Kongqi River basin using such a water balance approach. ET is another source of uncertainty inherent in water balance estimates (Dolman and De Jeu, 2010), and its estimation at the field scale is usually obtained through the application of mathematical models; it is commonly calculated by relying on reference ET (ET0) or potential ET (PET) (Allen et al., 2011; Suleiman and Hoogenboom, 2007; Wang and Dickinson, 2012; Ibrom et al., 2007).
Soil moisture is a variable that integrates the water balance components of land surface hydrology (Porporato et al., 2002), and over time it can be used to develop a record of antecedent hydrologic fluxes (Costa-Cabral et al., 2008). Soil moisture measurements were used to estimate the infiltration for unsaturated porous mediums by numerical solutions as early as the 1950s (Hanks and Bowers, 1962; Gardner and Mayhugh, 1958). With the advent of automated soil moisture monitors (Topp et al., 1980), ET estimation was implemented using continuous soil moisture data with simple water balance approaches (Young et al., 1997), but the computations are usually interrupted during rainfall or irrigation periods, as there is no means of accounting for drainage or recharge, due to inadequate turbulent flux measurements (Breña Naranjo et al., 2011). It has only been during recent years that some researchers, including Zuo and Zhang (2002), Schelde et al. (2011), and Guderle and Hildebrandt (2015), have started exploring the potential of using highly resolved soil moisture measurements to determine ET, by accounting for vertical flow, demonstrating that such measurements can work when the appropriate approach is used. Rahgozar et al. (2012) and Shah et al. (2012) extended these methodologies to determine other components of the water balances, such as lateral flow, infiltration, interception capture, storage, surface runoff, and other fluxes. Many techniques are now available to automatically measure soil moisture dynamics; time domain reflectometry (TDR) is one of the most popular worldwide (Kirnak and Akpinar, 2016), due to its flexibility and accuracy (Schelde et al., 2011). With the wider applications of TDR (Sr et al., 2003; Fu et al., 2010), methods based on soil moisture data have become one of the most promising ways to quantify SWBC information in different ecosystems (Li et al., 2002). For example, the inverse Richards approach was believed to be a practical way of estimating ET based on continuously measured soil moisture data, as it does not require any prior information on root distribution parameters (which is required by most common soil water flux modeling methods even though accurate measurement of them is difficult), and can therefore be applicable under various climatic conditions (Guderle and Hildebrandt, 2015).
TDR probes have also been used in many dryland regions, including arid northwest China, for measurement of soil moisture during the last several decades (Liu et al., 2015). These types of measurements provide critical information for ecohydrology, agricultural, and hydrological research in arid environments, but have mostly served as either an indicator for drought monitoring and forecasting (Anderson et al., 2012) or boundary conditions and/or calibration data for models (Vereecken et al., 2008). So far, however, relatively few studies have been published on testing the potential of using a soil moisture database as a method to systematically estimate the SWBCs of farmland in dryland regions, where the principal soils are coarse (Grayson et al., 1999; Yang et al., 2019) and tend to have low water retention capacity and high drainage (Lal, 2004) and the plant roots are very diverse and complex because of the harsh environments in which they grow. As frequently occurring soil aridification and nutrient leaching present major threats to food security and sustainable development of regional communities in these environments (Crosbie et al., 2009), the development of a reliable farmland SWBC estimation method, which can make the most of the vast amounts of soil moisture data, is crucial for irrigation management optimization (Musters and Bouten, 2000; Sharma et al., 2017), especially for arid regions with coarse-textured soils. This work used the TDR measurements of soil moisture collected from a long-term field experiment in the ecotones of desert and oasis, which was originally designed to test the accumulative impacts of different cropping systems (i.e., maize and alfalfa) and agronomic manipulation (i.e., succession cropping, crop rotation, row intercropping) on soil property evolution. The inverse Richards method was adopted and improved by combining it with a water balance approach to estimate not only ET but also the other SWBCs based on the soil moisture database. Through this effort we aimed (1) to investigate the feasibility of using soil moisture measurements to determine SWBCs in the croplands of a desert oasis, to serve as a framework for farmland SWBC estimation for coarse-textured soils; (2) to estimate the effects of different cropping systems and agronomic histories, on the hydrophysical soil properties, and to discuss these effects on the practical application of our method in different fields; and (3) to determine the potential for using a soil-moisture data-based method to improve irrigation strategies in a desert oasis.
2.1 Study area
The study sites were located in the transition zone between the Badain Jaran Desert and the Zhangye Oasis in the middle HRB (Fig. 1). More specifically, they were at the Linze Inland River Basin Research Station of the Chinese Academy of Science (39∘21′ N, 100∘17′ E, altitude 1382 m). This region has a temperate continental desert climate. The annual average temperature is about 7.6 ∘C, and the minimum and maximum temperatures are −27 and 39.1 ∘C, respectively. The annual average precipitation is 117 mm and the mean potential evaporation is about 2366 mm a−1 (Liu et al., 2015). The annual dryness index (defined as the ratio of potential evaporation to precipitation) is 15.9, which is a common value for arid northwestern China. About 60 % of the total precipitation, with low rainfall intensity, is received during July–September, with only 3 % occurring during winter. Northwesterly winds prevail throughout the year, with intense sandstorm activity in spring. This region was part of a sandstorm-eroded area, and the research site was converted into an artificial oasis during the 1970s. As a result, the soil types are dominated by sandy loam and sandy soil (which are the two soil types most widely distributed in arid and semiarid environments, and thus important for potential agricultural production in these regions) and are characterized by rapid infiltration (Zhao et al., 2010). The local dominant species are Scots pine, Gansu poplar, wheat, and maize (Liu et al., 2015); sand-fixation plant species (planted since the 1970s), including Haloxylon ammodendron, Elaeagnus angustifolia, Tamarix ramosissima, Nitraria sphaerocarpa; and annual herbaceous species such as Bassia dasyphylla, Halogeton arachnoideus, Suaeda glauca, and Agriophyllum squarrosum. The growing season of these plants and forages usually starts in early April and normally continues through the month of September (day of year – DOY 94–288, with temperature above 0 ∘C).
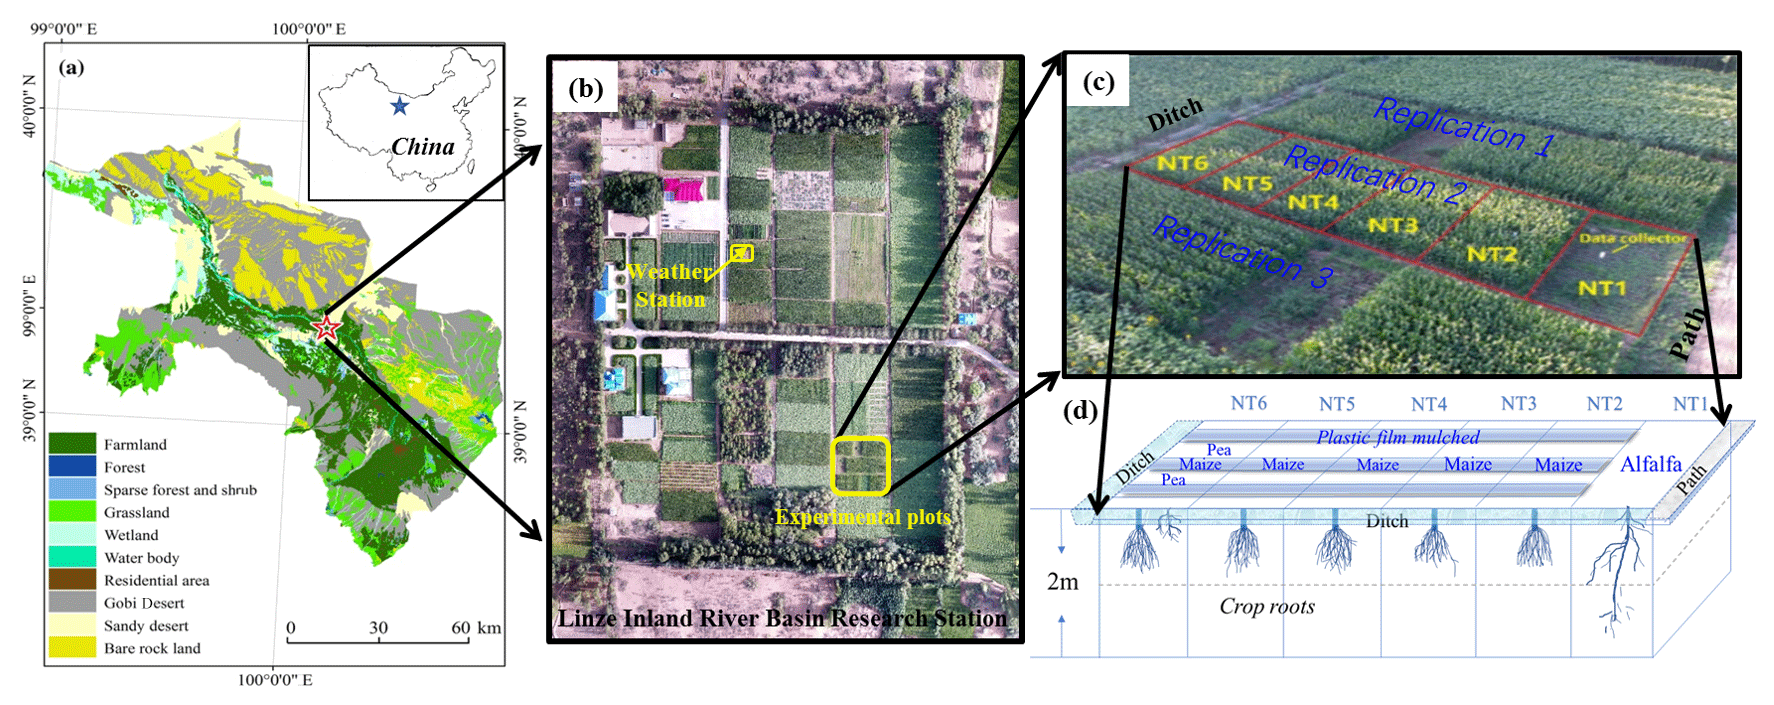
Figure 1(a) Map of the study area and research site; (b) aerial view of the Linze Inland River Basin Research Station and (c) the study site; and (d) detailed design of the field experiments in 2016.
2.2 Site description and data collection
A long-term field experiment with six different treatments was set up in 2007 (and will continue as long as funding allows) to investigate the accumulative effect of cropping systems and agronomic manipulation on soil property evolution. A randomized complete block design with three replicates was employed in this experiment (Fig. 1b, c), and one of the three replicates was selected for the installation of the TDR sensors (Fig. 1d). The treatments applied to NT1 to NT6 were sequentially as follows: (1) continuous pasture cropping; (2) continuous maize cropping; (3) continuous maize cropping with straw return; (4) maize–maize–pasture rotation; (5) maize–pasture rotation; and (6) maize–pasture intercropping. Plastic film mulching was applied during the initial growing season, and furrow irrigation was selected for this experiment because it is the most widely used irrigation type in the study area, and, in fact, in the entire region of northwestern China (Zhao et al., 2015). In 2016, NT1 was planted with alfalfa without plastic film mulch; NT2 to NT5 were planted with maize with plastic film mulch; and NT6 was planted with interlaced maize (mulched) and peas (non-mulched) (Fig. 1d). Maize and peas are annual crops, and about 80 % of the maize roots are distributed in the soil layers between 0 and 40 cm. Only a few maize roots can reach 100 cm, whereas pea roots are usually found within a depth of 30 cm below the surface. Alfalfa is a perennial forage legume that normally lives for 4–8 years, and about 70 % of the alfalfa roots are distributed in the soil layers between 0 and 30 cm; only a few alfalfa roots can reach 110 cm in the sandy soils of this region (Sun et al., 2008). The growing season of maize and alfalfa in the region is usually from early April until late September (Zhao and Zhao, 2014). Alfalfa was harvested twice during the growing season of 2016. Harvest 1 was conducted on 16 July, and the subsequent regrowth was harvested on 28 September 2016.
The mean temperature of the growing season in 2016 was 27.12 ∘C, or 3.12 ∘C warmer than the long-term average of the growing seasons in 2007–2016 (24.0 ∘C), and the mean rainfall during the period was about 60.2 mm, or 47 % less than the long-term average of 115.4 mm (2005–2016), indicating that the weather was hotter and drier during the growing season in 2016 than in the previous 10 years. The groundwater table depth fluctuated from 5 to 8 m at the experimental field during the year 2016. Irrigation with water extracted from a nearby pumping irrigation well was applied one by one to the plots from NT6 to NT1 during each irrigation event, and this work was usually completed in 3 h or less. The power consumption of the pumping irrigation well was recorded as an in situ observation to obtain the actual total irrigation amount of all plots via a well-built relationship at the field scale, i.e., the relationship obtained the average actual irrigation amount for the six plots (Table 1). In situ soil moisture measurements have been carried out since 2015, and are designed to continue until the long-term field experiment is ended. The volumetric soil moisture of the six plots (NT1 to NT6) was measured using a TDR system (5TE, Decagon Devices Inc. Pullman, WA, USA), which was installed at 5 different depths (20, 40, 60, 80, and 100 cm) at each plot, with measurement intervals of 10 min. Before use, the TDR was calibrated using soil columns in the laboratory with a known volumetric water content (θv). A maximum likelihood fitting procedure was used to correct the observed data to eliminate the potential errors induced by the soil texture and salinity (Muñoz-Carpena, 2004). Soil bulk density (ρb), vertical saturated hydraulic conductivity (Ks), and soil water retention were determined using standard laboratory procedures on undisturbed soil cores in steel cylinders (110 cm3 volume, 5 cm height) taken at 20 cm intervals down to a depth of 100 cm. Soil water retention curves were measured at the pressure heads of −0.01, −0.05, −0.1, −0.2, −0.4, −0.6, −0.8, −1, −2, −5, −10, −15, −20, and −25 bars. Ks was measured with an undisturbed soil core using the constant head method, i.e., measured 36 h after saturated water flow at a constant head gradient (5 cm) (Salazar et al., 2008). These determined parameters of soil hydrophysical properties were further profile-averaged for each of the plots. The values of field capacity (θfc) and wilting point (θw) were empirically related to the corresponding soil water (matrix) potentials through the determined soil-water retention curves (−0.1 bar for θfc and −15 bar for θw). Hourly climatic data, including precipitation, temperature, radiation, wind, and potential evaporation were recorded by a weather station located about 150 m from the experimental site (Fig. 1).
Table 1Planned and actual application of irrigation water for the plots during the growing season of 2016.
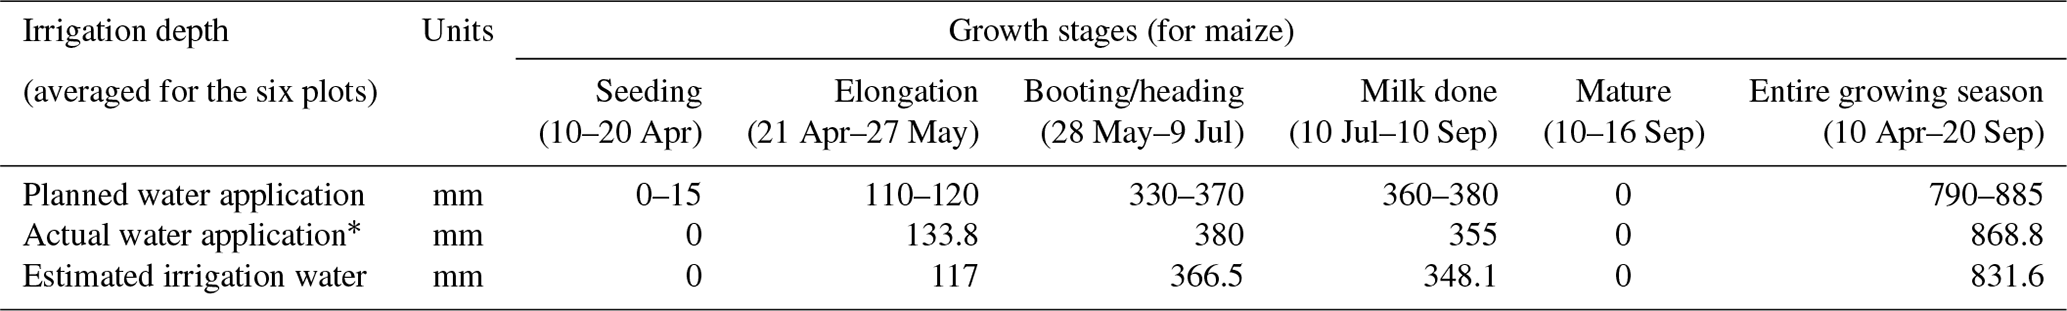
Note: the irrigation schedule was designed for maize, and water was applied to all six plots using the same schedule, for convenience. * Actual water application was determined based on the power consumption of the pumping well, and the estimated irrigation water was determined based on continuous soil moisture measurements.
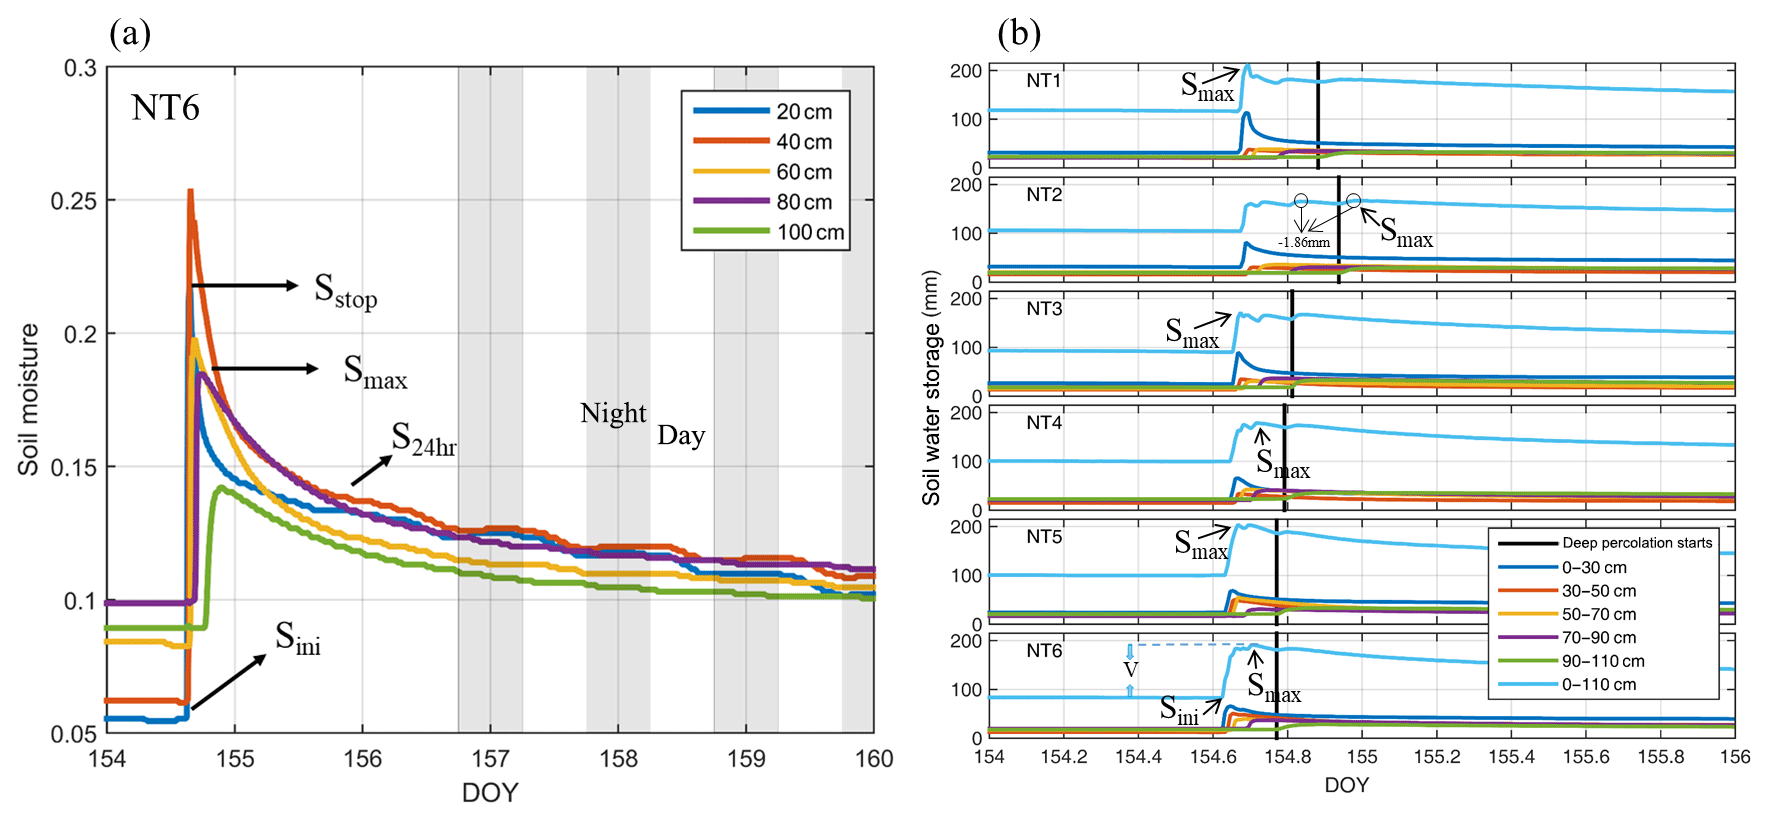
Figure 2(a) Example diagram of the volumetric soil water content at various depths of NT6 during and after the 107.1 mm irrigation event on DOY (day of year) 154–160 (2016). Sstop denotes that the irrigation event ends and moisture of uppermost soil layer starts to decrease; Smax represents maximum water storage and that the real water storage in root-zone soil was assumed to be equal to Smax; S24 h denotes that deep percolation ends 1 d later – after this point, ET dominates the water-loss processes; S24 h would tend to approach Smax if more soil moisture sensors were installed in the soil profile; Sini refers to the pre-irrigation, soil moisture minimum. The gray stripes between 156 and 160 DOY represent nights, i.e., 18:00 to 06:00 LT of the next day. (b) Verification of the assumption of Eq. (2), i.e., that Smax appeared before deep percolation began during the irrigation event on DOY 154–156 (2016). The black solid line represents the time that deep percolation began in each plot (NT1–NT6).

2.3 Calculation methods
2.3.1 Water storage and irrigation amounts
Soil water storage (S) was calculated for the soil depth within the root zone (0–110 cm) based on the sensor readings using Eq. (1) (see Table 2 for a list of symbols used in this paper):
where Zi is the soil moisture of layer i, and is the layer thickness between 10 cm above and 10 cm below the sensor installation depth (except for the top 30 cm soil layer, which is represented by the TDR installed at 20 cm). At the field level, examples of inflows are irrigation and rainfall, and examples of outflows are evaporation and deep leakage beyond the root zone. An irrigation event usually lasted 20 to 30 min in each of the independent plots depending on the growth stages of the plants. Soil moisture increased rapidly following irrigation events and decreased quickly as well during the subsequent dry-down period. Rapid drying usually occurs for a few hours after a soil has been thoroughly wetted due to high water conductivity (Fig. 2a). The preferential flow was neglected in the selected soil profiles because the larger hydraulic conductivity of sandy soil itself neutralizes the effects of preferential flow, and because coarse soil is relatively inimical to the formation of stable preferential flow paths (Hamblin, 1985). Because of the relatively short irrigation times, which hampered the form of the steady infiltration rate (Bautista and Wallender, 1993; Selle et al., 2011), we hypothesized that no surface-water excess or steady-state flow took place during any irrigation event, and assumed that deep percolation usually occurred after soil moisture storage reached maximum (Smax) and whenever the soil water content in the deepest layer (90–110 cm) was found to be greater than “field capacity” (θfc) (Rice et al., 1986). The irrigation volume (V) could then be calculated as the difference between Smax and Sini:
where Smax is the recorded maximum soil water storage of the root zone (0–110 cm) after one irrigation event began and Sini is the initial soil water storage of the root zone before irrigation (Fig. 2a). Although a few specific cases of percolation could occur before the Smax is reached (second panel in Fig. 2b), these would have little impact on the estimation of irrigation volume because the maximum soil water storage differed little (by only 1.86 mm) before and after deep percolation began. For instance, we checked all the irrigation events for NT1–NT6 during the entire growing season, and there were no underestimates of Smax except for two irrigation events in NT2, which only had slight underestimates of 1.86 and 10.3 mm, and generated errors of 1.1 % and 4.1 %, respectively.
2.3.2 Drainage and evapotranspiration
Following irrigation water applications, the drainage behavior of the soils consisted of two stages: (1) rapid drainage and (2) slow drainage. During irrigation, the root zone became effectively saturated, and rapid drainage followed, leading to deep percolation. Then, as the water content in the soil fell, the hydraulic conductivity decreased sharply, as did the rate of drainage. The second phase, slow drainage, may continue for several days or months, depending on the soil texture (Bethune et al., 2008). We assumed that rapid drying or drainage ceased 24 h after an irrigation event; thus, rapid drainage (Q1) could be estimated through the variances of water storage and actual ET during the period (Eq. 3). The actual ET during the period was assumed to be equal to the potential ET, because ET occurs unhindered under non-water-stress conditions.
where S24 h is the soil moisture storage 24 h after irrigation, Smax is the maximum water storage after irrigation, and ETp is the potential ET calculated with the Penman–Monteith combination equation during that day.
Slow drainage is also important for sandy soils (Bethune et al., 2008), as (along with ET) it constitutes the water loss during the second drying stage before the next irrigation event. Following Zuo and Zhang (2002) and Guderle and Hildebrandt (2015), an inverse method was employed to estimate the slow drainages and the average root water uptakes by solving the mixed formulation of the 1-D Richards Equation (Eq. 4) and iteratively searching for the sink term profile that produces the best fit between the numerical solution and the measured values of soil moisture content. ET is then obtained by summing rainfall and the sink term (Sp), and the drainage for this period is estimated as the water flux across the lower boundary of the soil profile. The abovementioned 1-D Richards equation is written as follows:
where h is the soil matric potential (cm), C(h) is the soil water capacity (cm−1), K(h) is the soil hydraulic conductivity (cm d−1), h0(z) is the initial soil matric potential in the profile (cm), E(t) is the soil surface evaporation rate (cm), hl(t) is the matric potential at the lower boundary (cm), L is the simulation depth (cm), and z is the vertical coordinate originating from the soil surface and moving positively downward (cm). The iterative procedure runs the numerical model over a given time step (Δt) in order to estimate the soil water content profile at the end of the time step, assuming that the sink term is zero over the entire profile at the beginning, where ∼ depicts the estimated values at the respective soil layer i and v indicates the iteration step. Next, the sink term profile is set equal to the difference between the previous approximation and the measurements θi, while accounting for soil layer thickness and the length of the time step for units. In the following iterations, was used with the Richards equation to calculate the new soil water content . The new average sink term was then determined using Eq. (8):
A backward Euler with a modified Picard iteration finite differencing solution scheme was adopted to inversely obtain the solution, and this implementation exactly follows the algorithm outlined by Celia et al. (1990). Three steps proposed by Guderle and Hildebrandt (2015) were taken to determine when the iteration process could be terminated in this calculation:
- 1.
evaluate the difference between the estimated and measured soil water contents (, Eq. 9) and test the change between this difference and the difference from the previous iteration (, Eq. 10):
- 2.
in soil layers where , set the root water uptake rate back to the value of the previous iteration . Only if , go to the next step;
- 3.
if , calculate according Eq. (8); otherwise the current iteration sink term () is retained, as it results in a good fit between estimated and measured soil water content. More detailed procedures can be found in Guderle and Hildebrandt (2015).

Figure 3Measured daily rainfall and potential ET estimated using the Penman–Monteith method during the growing season of 2016 at the Linze Inland River Basin Research Station. The cumulative rainfall during the growing season was 69.2 mm in 2016, and the black downward arrows represent irrigation events and average depths of water applied to the six plots during the events.
2.3.3 Boundary setting and data collection
To reduce computational complexity, uniform soil profiles were assumed because there were no significant stratification differences within the sandy soils (Table 3 in this study; Liu et al., 2015). The upper boundary of the calculation was set as the atmospheric boundary condition, and the calculation involved actual precipitation, irrigation, and potential evapotranspiration rates determined through Penman–Monteith combination equations driven by hourly environmental data during the growing season of 2016 (Fig. 3). The meteorological measurements were monitored at the nearby weather station (150 m from our study plots, Fig. 1), which had the same underlying surface as the experimental plots (Fig. 1b), and were used to compute the upper boundary condition. The film mulching effects on the upper boundary condition were modeled as proportionally damped ET, where β is the area percentage without plastic film mulching in each experimental plot (i.e., 60 %), and ETp is the potential ET. For coding convenience, the bare soil evaporation (Ea) was determined via a simplified method proposed by Porporato et al. (2002): the evaporation was assumed to linearly increase with soil moisture (θ) from zero at the hygroscopic point (θh) to Ep,a at the field capacity (θfc). For values exceeding the field capacity, evapotranspiration was decoupled from soil moisture and remained constant at Ep,a. However, we did not set specific upper boundaries for intercropping treatments, because the difference in surface soil evaporation between mono- and intercropping treatments was relatively small when compared with the transpiration over a growing season. The surface fluxes were incorporated by using the average hourly rates, distributed uniformly over each hour. The lower boundary was set as a free-drainage boundary condition because the groundwater table depth (deeper than 3.5 m) was far below the crop effective root depth during the growing season, and any capillary rise from groundwater could be ignored in this study. The drainage rate q(n) assigned to the bottom node n was determined by programming (in a MATLAB environment) as , where h is the local value of the pressure head and K(h) is the hydraulic conductivity corresponding to this pressure head (Odofin et al., 2012).
Table 3Soil physical characteristics in the six experimental plots and two other selected plots near the study site.
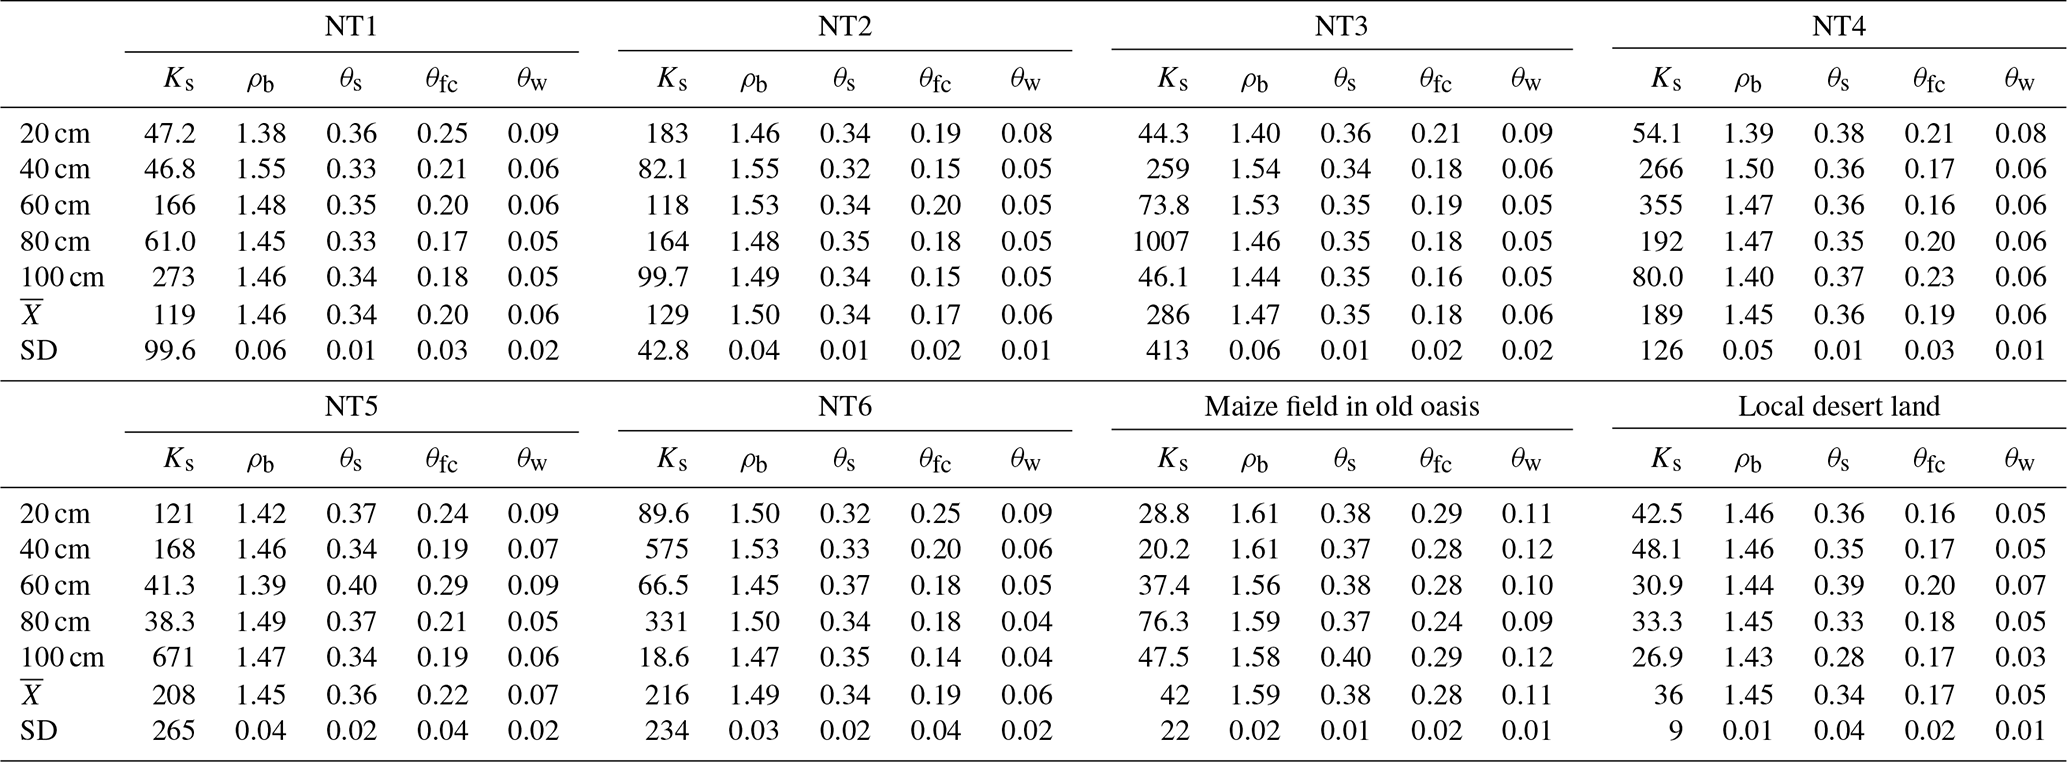
Ks: saturated water conductivity (cm d−1); ρb: bulk density (g cm−3); θs: saturated water content (100 %); θfc: field capacity (100 %); θw: wilting point (100 %); : mean value of the five soil layers; SD: standard deviation of the five soil layers.
We used soil moisture dynamics measured in the soil profiles as inputs to inversely solve for sink term profiles at each plot for each hour (Lv, 2014). The soil moisture measurements for 10 min intervals during the period were hourly averaged to numerically filter out the noise associated with highly resolved data. This had the effect of slightly reducing the infiltration and ET estimates, but this effect in the overall results is negligible according to Guderle and Hildebrandt (2015). The actual amount of water delivered for irrigation (Q0) was determined from the power consumption of water pumping (P0) via a relationship established between the two: , where η is the ratio of the power consumption per unit water pumped and is likely to be different for different pumping heads. The coefficient was experimentally determined to be 8.5 m3 kW−1 h−1 for a head corresponding to 0.95 kg cm−2 of delivery pressure in this study.

Figure 4Soil moisture characteristic curve (SMC) of uniform soil profiles of the six experimental plots and two other representative fields. The soil field capacity (θfc), wilting point (θw), and water stress point, i.e., the point of incipient stomatal closure (θ*) are empirically related to the corresponding soil matric potentials (−0.1 bar for θfc, −0.2 bar for θ* and −15 bar for θw); the blue horizontal line represents the error bar, and the solid red line represents saturated water content (θs), which was obtained via the traditional soil drying method with three repetitions in each layer; for soil water (matric) potential (Ψ) take the absolute value, for example, −0.01 bar is equal to −2 on the y axis.
3.1 Soil hydrophysical characteristics
An accurate measurement of soil hydraulic parameters is crucial for this inverse Richards method and is helpful in explaining the movement of soil water flow. A summary of the most important soil hydrophysical characteristics of the soils at a depth of between 0 and 100 cm (NT1 to NT6, and two other representative fields) in relation to their capacity for water storage is listed in Table 3. The textures in plots NT1–NT6 were largely loamy sandy soils, in contrast to the sandy loam soil in the old oasis field with a long tillage history (∼100 years) and sandy soil in the desert with no tillage history. Their bulk densities were generally between 1.4 and 1.5 g cm−3 – slightly higher than that in the local desert land, but still lower than that in maize fields of the old oasis. θs, θfc, and θw of the plots showed the same tendency of increasing soil hydrophysical properties (toward better water retention) as the bulk densities (Table 3). However, those parameters of the soil profiles are very similar to one another, especially between the same soil depths (horizontal) of the plots, suggesting that the different planting systems had similar influences on the soil hydrophysical proprieties, at least at the scale of 10 years. The effects of different cropping systems on soil moisture release characteristics are shown in Fig. 4. As expected, the relationship between soil water potential and volumetric water content across all data and treatment combinations followed a curvilinear pattern, where the water potential increased exponentially as soil water content increased.
The large and varying values of the saturated drainage velocity (Ks) showed a great drainage potential in the coarse-textured soil and an obvious heterogeneity in both horizontal and vertical profiles across the six plots (Table 3). Soil moisture characteristic curves (SMC) in the six profiles are shown in Fig. 4, and indicate almost the same soil water content for all the plots (NT1–NT6) under the same suction head; i.e., all of the soil profiles were nearly saturated when the water potential reached −0.01 bar and little was available after the soil water potential dropped to −15 bar. Two obvious inflection points were observed, at θ≅0.08 and 0.3, and −15.2 bar in each of the soil moisture characteristic curves from NT1 to NT6. The slopes of the soil water potential-moisture, especially the parts between the inflection points of the six plots, were very close to one another, and also similar to that of the desert soil, suggesting similarly poor water capacities for the sandy soils (Sławiński et al., 2002). A very significant difference in water capacities was observed when comparing the SMCs of NT1–NT6 with that of the old oasis field, indicating that a considerably long period of time is still needed for high soil water capacity to evolve at these experimental sites.
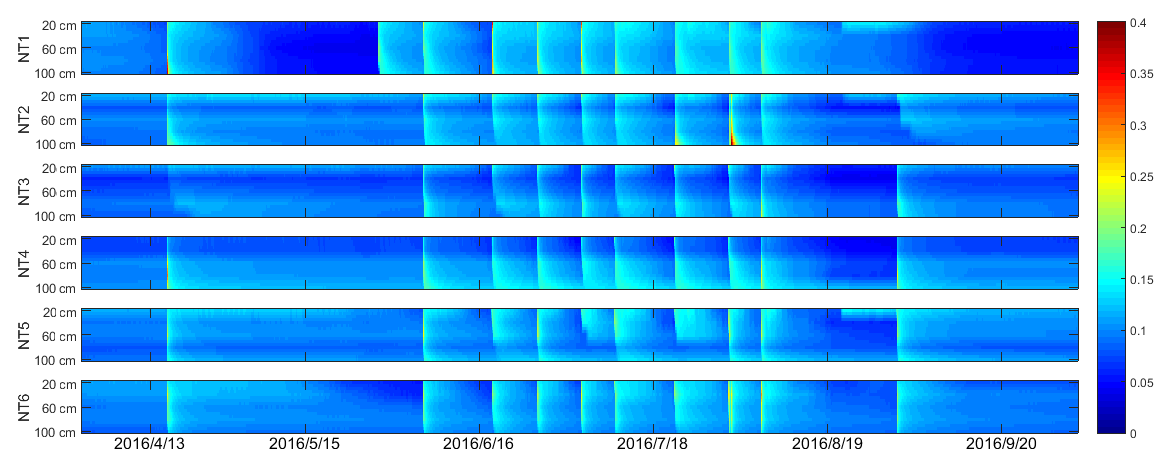
Figure 5Spatial and temporal variations of soil water content with a time resolution of 10 min. The color bar on the right side represents the volumetric soil water content. The time period was from 1 April to 1 October 2016. Irrigation events for NT2–NT6 occurred on 16 April; 2, 15, and 23 June; 1, 7, 18, and 28 July; and 3 and 28 August. NT1 had one more irrigation event on 25 May and one less on 28 August.
3.2 Soil moisture dynamics (SMDs)
Checking the soil water dynamic of the entire growing season can help us verify the boundary setting and affirm the assumption about the irrigation estimation used. Figure 2a shows an example of the soil water content responses at various depths for NT6 during and after the 107.1 mm irrigation event on DOY 154 (in 2016). TDR measurements exhibited a sharp increase when irrigation began and then decreased rapidly as it was turned off, due to the poor water-holding capacity of the sandy soil. The increase in water content occurred layer by layer from the upper horizons, suggesting limited influence from potential preferential flow (Liu and Lin, 2015), while the rapid moistening of the deep horizons could imply the existence of water loss by drainage. The greatest rate decrease in water content was observed in the top 20 cm of soil. During the 12 h after irrigation, the water content at the top sensor decreased from 21.9 % to 14.2 %. For the same interval of time, the water contents at soil depths of 40, 60, 80, and 100 cm decreased from 25.4 %, 19.8 %, 18.5 %, and 14.2 % to 15.7 %, 14.3 %, 15.4 %, and 12.8 %, respectively. After irrigation ended, water continued to move down the soil profile; thus, the top part of the profile was continuously losing water to the soil below it. The lower soil horizons were leaching water into the horizon below but were concurrently receiving water that had drained from the horizon immediately above, resulting in lower water content decrease rates for these layers than for those at the top horizon (20 cm) (Fares and Alva, 2000). Very similar patterns of change in the water content were observed through the six different soil profiles.
The average field capacity value (θfc) of NT1–NT6 determined from laboratory measurement of soil water release curves was 19.2 % (20 %, 17 %, 18 %, 19 %, 22 %, and 19 % for NT1–NT6, respectively). A total of 24 h after the end of irrigation (3 June 2016), the soil moisture values for all of the measured horizons (depths from 20 to 100 cm) of NT1–NT6 ranged between 8.9 % and 16.9 % (13.7 %–15.7 %, 13.7 %–15.1 %, 8.9 %–14.5 %, 9.6 %–16.9 %, 11.7 %–15.3 %, and 12.3 %–14.2 % for NT1–NT6, respectively) lower than the field capacity (Figs. 2, 5), suggesting that the rapid drainage of water away from the root zone soil (0–100 cm) was terminated during the period, as expected. In the mornings of the subsequent days, the decrease in soil moisture again sped up as the evaporative demand of the atmosphere gradually increased. In the absence of any irrigation during the subsequent nights, a slowdown in the decrease, or even a very slight increase, in the soil moisture content was observed in the top soil layer (Fig. 2). According to the data, there was also no obvious response of soil moisture regimes to precipitation, indicating a very limited contribution of rainfall to the soil water storage compared with irrigation. In fact, more than 90 % of the rainfall events in this region are less than 5 mm (Fig. 3), and canopy interception (about 2–5 mm) may have hampered any effective infiltration from those insufficient precipitation events.
3.3 Soil water balance components (SWBCs)
The estimated soil water balance components (SWBCs), including total irrigation, evapotranspiration, and deep percolation, at the six different plots during the growing season of 2016 are summarized in Table 4, and Figs. 6 and 7. Irrigation applications began in mid-April and continued until late September, every 5 to 25 d, depending upon the moisture content and crop growth (Fig. 3). A total of 10 irrigation events were sequentially applied using furrow irrigation for the plots during the entire growing season. Based on the in situ observations of irrigation – i.e., the power consumption of the pumping irrigation well – the estimated irrigation volumes of the six plots were averaged and tested against the observations at the field scale. The estimated average cumulative irrigation volume of the six plots during the entire growing season was 831.6 mm (1187, 760, 652, 840, 683, and 867 mm for NT1–NT6, respectively), which compares well with the actual average irrigation volume (868.8 mm) determined through power consumption (Table 1); thus, this suggests that the calculated irrigation agrees closely with the real values from the farm fields when accurate irrigation and rainfall data are available. A difference of 4.5 % in the irrigation amount was observed between the real values and the estimated values over the entire growing season of 2016, indicating a high reliability of the water balance method used in the SWBCs estimation.
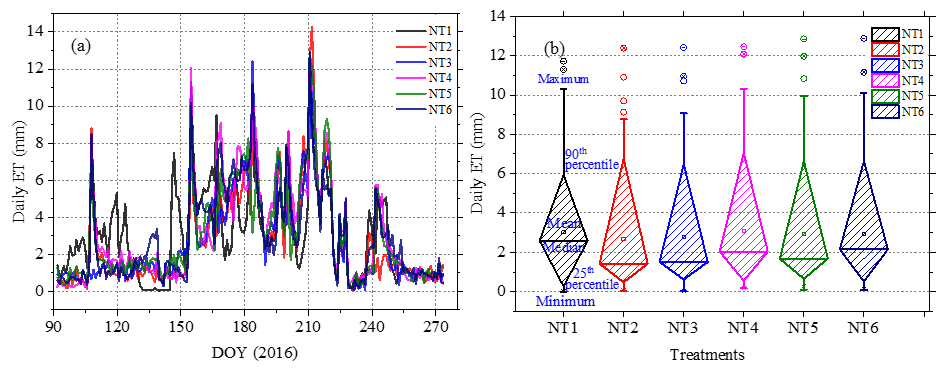
Figure 6Daily ET during the growing season of 2016 as determined from the inverse Richards method: (a) time series of estimated daily ET; and (b) box-and-whisker diagrams showing the minimum, median, 25th percentile, 75th percentile, and maximum daily ET. No significant differences were detected when Duncan's multiple range test was applied at the 5 % level to compare values among the plots. Note: DOY refers to day of year.

Figure 7Estimated water components of the plots during the growing season of 2016: (a) cumulative irrigation, (b) cumulative ET, and (c) cumulative drainage. Note: DOY refers to day of year.
Table 4Estimated evapotranspiration and other major soil water balance components during the growing season of 2016.
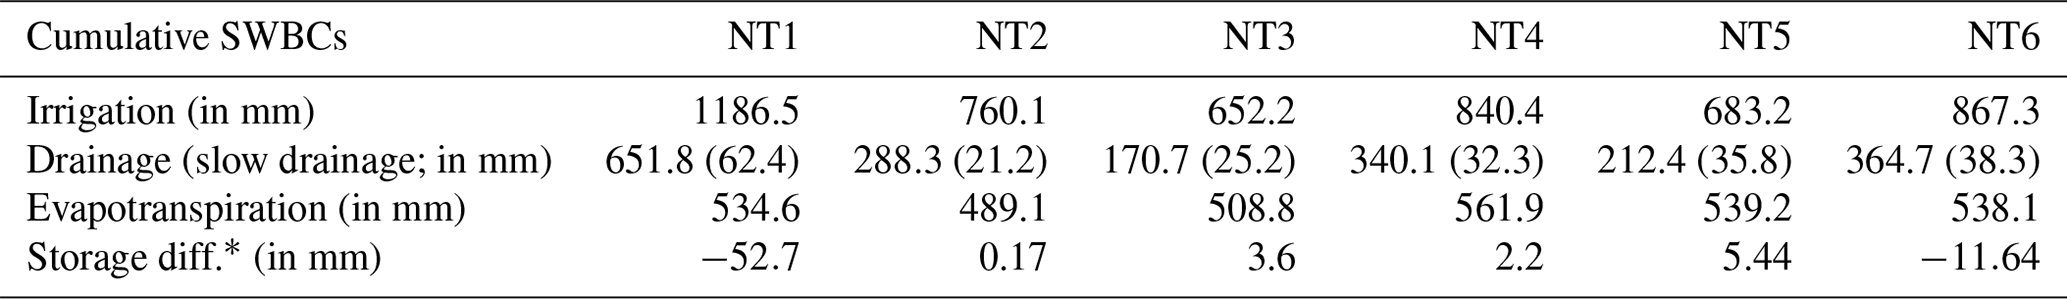
* Storage differences represent the difference in soil water storage before and after the growing season.
Evapotranspiration and deep percolation dominated the outflows of the field soil water balance during the study period. A clear trend in seasonal variation of the water balance components can be observed at the site (Fig. 7). The corresponding ET values were very similar for all of the plots. Three different stages of ET could be discriminated throughout the 2016 growing season: the ET rate was very low during the initial stage (i.e., the first 50 d of the growing season), and increased gradually as vegetation coverage became greater with crop development, before reaching maximal values at the mid-season stage. After that, ET decreased gradually until harvest. The estimated daily ET values ranged largely between 0.2 and 12 mm d−1, with an average of 3 mm d−1. No significant differences were detected in the daily ET when Duncan's multiple range test was applied at the 5 % level to compare among the six experimental plots (P>0.75). A relatively large difference was observed in irrigation applied to the selected plots in this study, i.e., significantly higher cumulative irrigation volume was found at NT1. The excess of water in the soil produced an important deep percolation, which became greater with the increase in the irrigation quota. Among the plots, 45 %–79 % of the input irrigation water was consumed by way of ET (i.e., for plant growth), while the change in soil water storage before and after the growing season was quite small. It is clear that although there was a high correlation between the volume of irrigation and that of drained water, the superfluous irrigation amount had limited influence on the accumulated ET during the growing season.
4.1 Accuracy of the estimated ET
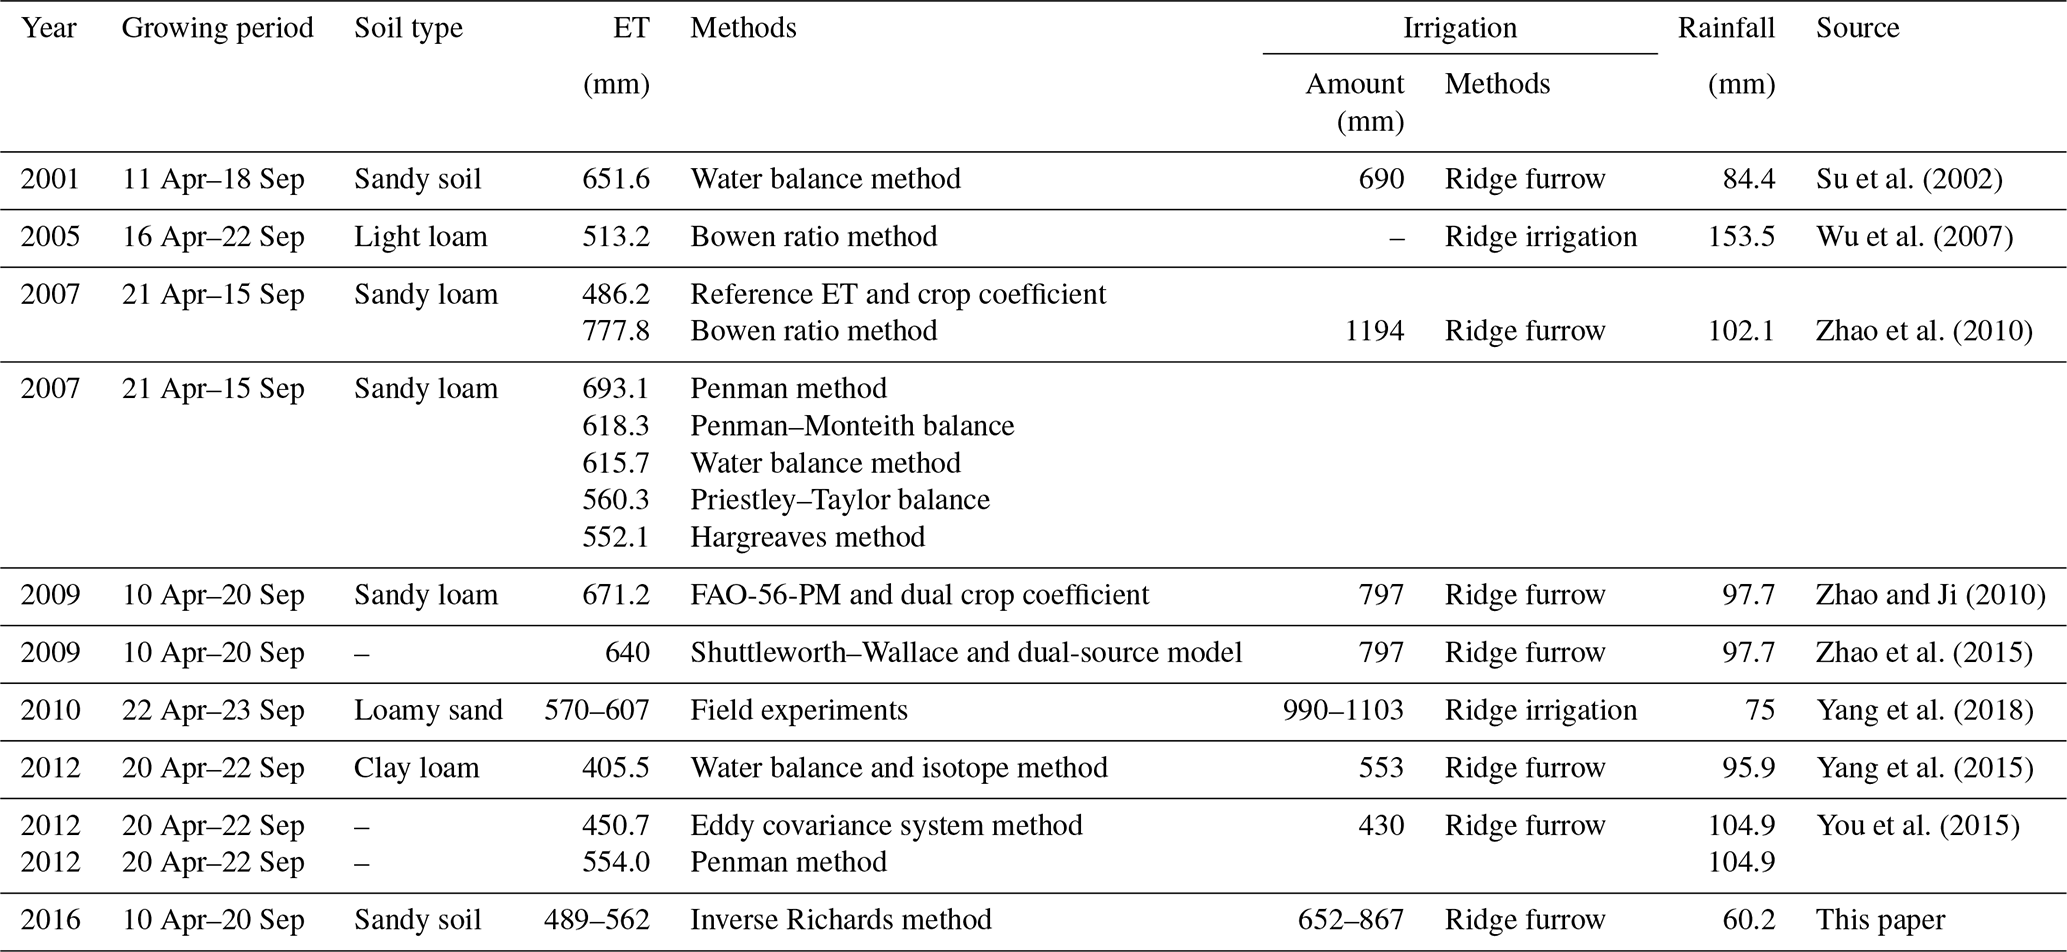
Cumulative ET values calculated from the inverse Richards method ranged between 489.1 and 561.9 mm for the different treatments in 2016. The values of ET obtained from the current study are well within the range of published ET values from nearby sites (406–778 mm), and are consistent with the averages from other studies (∼585.5 mm) also carried out in this region, including Zhao and Ji (2010), Rong (2012), Yang et al. (2015), You et al. (2015), and Zhao et al. (2015), among others, for maize fields similar to those present at the study site (Table 5). Compared with the methods used in the literature listed in Table 5, the soil-moisture data-based method used in this study is more reliable as it produced a better fit between the numerical solution (soil water profile calculated by the inverse Richards method) and the measured values of soil moisture content (soil water profile measured by TDR), even with vertical flow accounted for (Guderle and Hildebrandt, 2015). The narrow range of cumulative ET (489.1–561.9 mm) observed in 2016 can be attributed to the similar sandy soil texture and mesic moisture regimes caused by frequent irrigation (Figs. 4, 5); this, in turn, suggested that both cropping systems and agronomic manipulation had limited influence on the accumulated ET during the growing season for the un-mulched alfalfa and mulched maize (Srivastava et al., 2017). This result is well supported by evidence, reported by early investigators, that the ET differences in different cropping systems are quite small for coarse-textured soils compared with the large differences in the amount of irrigation water (Jalota and Arora, 2002; Ji et al., 2007), and that ET is strictly a function of ambient atmospheric conditions under normal or wet conditions (Rahgozar et al., 2012).
Table 5Reported evapotranspiration, irrigation, and rainfall data of the oasis maize field in the middle Heihe River basin (HRB).
The observed seasonal trend of ET corresponded well with the irrigation frequency and crop water consumption characteristics of the growth stage (Fig. 7), and similar patterns in the ET processes have also been reported by many other studies conducted in this region (Zhao et al., 2010, 2015). Although we also noticed that the cumulative ET of NT1 was relatively higher than those of the other plots at the beginning of the growing season, this phenomenon can be largely attributed to the plastic film mulching on the other five plots. In the early growing season (seeding to emergence), soil evaporation (E) is the major cause of ET (Zhao et al., 2015), and the plastic film mulching applied to NT2–NT6 was able to significantly retain the soil moisture and, thus, decrease soil evaporation (Jia et al., 2006). However, the differences in the cumulative ET, between NT1 and the other plots, were quite small after the mid-growing season, most likely because with the plant canopy development, crop transpiration became the major portion of ET, and the influence of plastic film on ET diminished (Zhang et al., 2017; Qin et al., 2014; Jia et al., 2006). Another influence that may have decreased the evapotranspiration at NT1 after the mid-growing season is cutting. Cutting alfalfa lowers the leaf area index and drastically changes the effective diffusive resistance, consequently lowering the daily ET rate of alfalfa at NT1, although for a short time after cutting evaporation from the soil surface may compensate for the decrease in transpiration (Dong et al., 2003; Su et al., 2002).
4.2 Accuracy of the other estimated SWBCs
The irrigation volume of maize (NT2–NT6) within our plots ranged between 652.2 and 867.3 mm, with an average value of 760.6 mm, which is very comparable to the range of the average maize field irrigation volume in this region, i.e., a range between 604.8 and 811.4 mm reported in the Statistical Yearbook of Zhangye City for the period from 1995 to 2017 (see http://www.zhangye.gov.cn, last access: 10 September 2019). When compared with the other treatments with plastic film mulching, significantly higher amounts of the applied irrigation (1186.5 mm) were found in NT1, which could be attributed to the larger percentage of infiltrating surface area and the relatively longer irrigation duration caused by the rougher surface of the ground without plastic film mulching. According to Yang et al. (2018), plastic film mulch has been widely used to increase the productivity of crops in arid or semiarid regions of China. The logic behind this approach is that plastic film mulch improves the soil physical properties, such as the soil water content and temperature in the top soil layers, and thus leads to increased plant growth and yield (Mbah et al., 2010). Our results suggested that plastic film mulching can equally reduce the irrigation duration and applied water depth by lowering surface roughness and, thus, the friction coefficient of the ground. Similar results were also reported by earlier investigators (Zhang et al., 2017; Jia et al., 2006; Qin et al., 2014). A less extreme but still significant difference can be found in the irrigation volumes (∼652.2 to 867.3 mm) over the other five plots with plastic film mulching (NT2–NT6). This may be associated with the inconsistent durations caused by uneven irrigation applications, randomly rough soil surfaces, and mutation of the infiltration rate (i.e., Ks) across the plots (Table 3). Uneven irrigation may be further attributed to the uneven fields and ditches, which may lead to the application of much more water than required for evapotranspiration, in some places (Babcock and Blackmer, 1992). Soil surface texture has a direct effect on soil water and complex interactions with other environmental factors (Yong et al., 2014). The hydraulic behavior and the rate of traditional surface irrigation is eventually influenced by the inflow and duration of each irrigation (Ascough and Kiker, 2002). Although only slight differences exist among the retention curves (Fig. 4), the differences in saturation water conductivity (Ks) can be substantial (varying between 119 cm d−1 at NT1 and 286 cm d−1 at NT3), indicating that a slight difference in hydrophysical properties of soil profiles could be amplified to generate wildly varying infiltration behavior, especially during saturated or near-saturated stages under actual irrigation conditions (Ojha et al., 2017).
In desert oasis farmland, the water cycle is primarily driven by evapotranspiration demand under the influence of irrigation, and soil water percolation may occur when too much water is applied to the root zone. Estimated deep drainage rates were observed, ranging from 170.7 mm (NT3) to 651.8 mm (NT1), amounting to about 26.2 % and 54.9 % of the total irrigation of the two plots, respectively. Drainage within the mulched maize fields ranged from 170.7 to 364.7 mm, which is in good agreement with other results from the same region, i.e., 255 mm through isotopes obtained by Yang et al. (2015), and 339.5 mm through the Hydrus-1D model by Li et al. (2015). Compared with the theoretical deep drainage determined by water balance techniques (Rice et al., 1986), an error of −2.6 to 43.1 mm, or 0.2 % to 17.6 %, was obtained for the cumulative deep drainage (Table 4), indicating the reliability of the method used to estimate deep drainage in this study. The data expressed in Fig. 2 also explain how easily an excess of water, and therefore deep drainage, can occur in these soils. Indeed, the deep drainage was directly proportional to the amount of irrigation applied during any particular period (Fig. 7, Table 4). This phenomenon is easy to understand because for a given amount of irrigation, the likelihood of a drainage event and its average size both increased naturally with the irrigation amount, because coarse-textured soils in desert-oasis environments contain more sand particles that have large pores, and these soils are highly permeable, allowing the water to move rapidly through the pore system (Fig. 7 in this paper; Keller, 2005). It is obvious that drainage is an essential part of irrigation design and management. According to our results (Fig. 6, Table 4), an average of 40.6 % of input water was consumed by deep leakage across the six plots, and on average more than 90 % of the drainage again occurred during the rapid drainage stage within the first 24 h following an irrigation event (Table 4); this leakage is unproductive and could even cause nutrient loss and groundwater pollution at field scales (Fares and Alva, 2000), suggesting there is a huge potential to increase irrigation water-use efficiencies and reduce irrigation water requirements in this region, especially in areas that are mostly dominated by coarse-textured sandy soils.
4.3 Effects of the variances in soil hydrophysical properties on the SWBC estimation
In this desert oasis and other such areas located in arid northwestern China, most of the fields belong to smallholder farmers, who usually follow different cropping patterns and tillage methods, resulting in a heterogeneity of soil hydrophysical properties (Salem et al., 2015; Ács, 2005; Abu and Abubakar, 2013). For the soil-moisture data-based method proposed in this paper, the spatial heterogeneity of the soil hydrophysical properties – which can be characterized by hydrophysical functions (soil water retention curve and soil water conductivity) and/or hydrophysical parameters (ρb, θs, θfc, and θw) (Ács, 2005) – may restrict its applicability to a large agricultural area. Therefore, evaluating the extent to which the variances in the soil hydrophysical properties affect the SWBC estimations is important (in order to reduce unnecessary repetitive measurements of soil hydrophysical information at both spatial and temporal scales, and thereby improve the application efficiency of our method) is critical. Crop root systems, for example, may create heterogeneity in soil properties through mechanical actions and the active release of chemicals (Hirobe et al., 2001; Read et al., 2003); and, along with similar feedbacks between long-term planted crops and the soil environment, may change water flow and soil hydraulic characteristics, and thus affect local water balances (Baldocchi et al., 2004; Séré et al., 2012). Our results indicated that although the tillage and planting of past decades have significantly increased the soil's water-holding ability (i.e., higher values of ρb, θs, θfc, and θw compared with the sandier land), the magnitude of the increase in most of the parameters, except Ks in soil vertical profiles, was independent of the treatments applied across the six selected plots; this suggested that different cropping systems and agronomic manipulation have limited effects on differing soil physical characteristics in sandy soil, at least at the decade scale, and this agrees well with the reports from Katsvairo et al. (2002). The limited influence of different cropping systems on soil hydrophysical properties in coarse-textured soil environments at a 10-year scale indicates a good stability and representativeness of the measured soil hydrophysical data and, thus, a good application prospect for applying the soil-moisture data-based method in practice.
4.4 Potential for SWBC estimation using soil moisture measurements
The best estimates of SWBCs should be based on models of soil water, because in most cases direct measurements are not available (Campbell and Diaz, 1988). Many studies including modeling work have been conducted in this region during the past few decades (Table 5). However, most of these were rough approximations based on meteorological methods and water balance equations (Rong, 2012; Jiang et al., 2016; Yang et al., 2015; Wu et al., 2015; Ji et al., 2007), as there has been a lack of accurate parameters to assess the heterogeneity and complexity involved in modeling (Allen et al., 2011; Suleiman and Hoogenboom, 2007; Wang and Dickinson, 2012; Ibrom et al., 2007). Soil-moisture data-based methods have been considered one of the most promising ways to directly determine ET and other SWBCs (Guderle and Hildebrandt, 2015; Li et al., 2002), and many possible options, including single- or multistep, and single- or multilayer water balance methods, have been proposed and tested with synthetic time series of water content (Guderle and Hildebrandt, 2015). Our results suggest that a combination of a soil water balance method and the inverse method could be a good candidate for SWBC estimation in this region, and in other arid regions with similar geographic conditions, i.e., the Tarim River basin in China and the Aral Sea basin in central Asia (Tian et al., 2019). Because plant roots in those dryland environments usually tend to be diverse and complex as a result of adaptation to water-limited conditions, parameterizing the root distribution is likely to be a major challenge in modeling works for SWBC estimation. The soil-moisture data-based methods do not rely on any a priori assumption of root distribution parameters, and thus can provide a reliable solution, especially with respect to estimating ET, root water uptake, and vertical water flow.
Information on SWBCs is crucial for irrigation planning at both the field and regional scale (Jalota and Arora, 2002). Early studies suggested that decreasing the irrigation amount and increasing the irrigation frequency, and thus maintaining a relatively constant level of soil moisture with less stress from “too little or too much”, is the best choice for saving water and improving water use efficiency in arid regions like the middle HRB (Rong, 2012; Jiang et al., 2016; Yang et al., 2015; Wu et al., 2015; Ji et al., 2007). This scenario can be achieved not only by adopting proper modern irrigation systems but also by integrating new technologies into the effective planning of irrigation schedules so that plants can be supplied with optimal water volume and minimum water loss. Soil water balance models help in translating irrigation amounts in different time periods to evapotranspiration (ET), which has significance from the standpoint of crop yield (Jalota and Arora, 2002). Our results show that superfluous irrigation has no impact on increasing ET, due to the poor water-holding capacity of the sandy soil in this region, and thus irrigation application should not exceed a specific threshold (i.e., root zone depletion, ∼527 mm for maize) to avoid deep percolation (Zotarelli et al., 2016). However, water deficits in crops and the resulting water stress on plants also influences crop evapotranspiration and crop yield (Kallitsari et al., 2011). Thus, a soil moisture measurement-based method makes it possible to quantify SWBCs for different time periods, and has great potential for identifying appropriate irrigation amounts and frequencies. This method could also contribute to alleviating salt accumulation in agricultural soils and the sustainability of irrigated lands in arid regions, by providing key SWBC information for farmers and other decision makers in agricultural production (Gao et al., 2010). As the price of commercial TDR systems has become affordable (Quinones and Ruelle, 2001), they are more and more frequently used for soil water content measurements in desert oases; thus, a soil-moisture data-based method has great potential in irrigation management optimization and in moving toward sustainable water resources management, even under traditional surface irrigation conditions.
4.5 Uncertainty analysis
Uncertainty is inevitable, in any soil water balance components estimate. As summarized by Zuo and Zhang (2002) and Guderle and Hildebrandt (2015), the accuracy and convergence of estimated evapotranspiration and slow drainage using this inverse method are dependent on several factors, including the accuracy of soil hydraulic parameters and input soil moisture data, the time intervals of soil water content measurements, the spatial interval of the measured data along the depth, the setting of simulation depth, and the boundary conditions. For a soil-moisture data-based method, the estimated results are only as good as their input data, i.e., the accuracy, precision, and resolution (Guderle and Hildebrandt, 2015). In this study, every effort was made to eliminate the uncertainty caused by the quality of the input data, including the following: all of the sensors and cables were carefully buried according the operator's manual instructions; the soil-specific calibration of the TDR was conducted in a well-designed laboratory calibration experiment, which resulted in good accuracy (±2 %) for TDR measurements in coarse-textured soil; and the high-resolution moisture data (taken at 10 min intervals) were hourly averaged to numerically filter out the noise and improve the calculation speed of the inverse model. Meanwhile, the simulation depth (0–110 cm) is consistent with the root depth, and it can be well represented by five TDR probes with a spatial interval of 20 cm in sandy soil (Zhao et al., 2016). The boundary condition is also important for this inverse model (Liao et al., 2016); as mentioned in Section 2.3, we set the upper and lower boundaries as close as possible to natural conditions. However, we did not set specific upper boundaries for intercropping treatments, i.e., no bare soil evaporation was considered in the intercropping maize–pea field, which may have slightly underestimated the ET of NT6, but within an acceptable range, because the soil evaporation of NT6 was relatively small when compared with the total transpiration over a growing season. Moreover, the high amount of irrigation may have reduced the temperature of the soil profile, because irrigation is often accompanied by an increase in latent heat flux, and thus by an increase in evapotranspiration (Chen et al., 2018; Haddeland et al., 2006; Zou et al., 2017). Theoretically, a decrease in soil temperature may slightly increase the soil suction under the same moisture conditions (Bachmann et al., 2002); hence, variations in the soil temperature profile under different irrigation scenarios may have affected the accuracy of the inverse model by changing the soil water retention curves. However, irrigation-affected variations of the soil profile temperature in this study were small (within 2∘) – smaller than the daily variation of soil temperature (2 to 3∘); thus, this effect on soil water retention curves can be ignored with respect to eco-hydrological research (Bachmann et al., 2002; Gao and Shao, 2015). Even so, it is still an interesting and important research field deserving further investigation. Finally, it seems likely that uncertainty could also be introduced by the soil hydraulic parameters when adopting the Richards equation to calculate the slow drainage term, as in this work. To reduce the uncertainty, the experimentally determined soil hydrophysical parameters were profile-averaged before being used in the inverse model. Although this measure cannot fully prevent the development of uncertainty caused by the parameters, such uncertainties are trivial, especially in light of the relatively small proportion of slow drainage in the context of sandy soils, i.e., only about 9.5 % of the drainage occurred during this stage, according to our calculation (Table 4).
Aside from the uncertainties in estimating evapotranspiration and slow drainage, more limitations may exist in the estimation of irrigation amounts and rapid drainage following irrigation events. All of these limitations were strongly dependent on the assumptions of Eqs. (2) and (3), specifically, the estimation of Smax. We checked all of the irrigation events of NT1–NT6 during the entire 2016 growing season, and results showed an acceptable accuracy of the estimation of Smax (only two irrigation events in NT2 slightly underestimated the Smax: 1.86 and 10.3 mm, which accounted for 1.1 % and 4.1 % of total soil water storage, respectively). This phenomenon – deep percolation that began before irrigation ceased – may have been caused by a long irrigation duration time and high Ks of surface soil at NT2, which is the major limitation when applying our method to other regions. Calculating the previously occurring leakage volume, for example, using the unsaturated hydraulic conductivity empirical equation, is one of the possible solutions that needs to be tested in future work. Installing the TDR under the film-mulched ridges may also cause an underestimation of the soil moisture content during an irrigation event. We investigated the difference caused by the location of the TDR by comparing the soil water dynamics of an un-mulched flat plot (NT1, which was independent of the TDR location) and film-mulched ridge plots (NT2–NT6, which were affected by the TDR location) after irrigation, and found that the underestimation caused by the location of the TDR was mainly significant in the top 30 cm of the soil layer. For example, during the 24 h after irrigation on 2 June (DOY 154–155, Fig. 2), in the top 30 cm of the soil layer, the maximum soil moisture value of NT1 was 0.378, whereas the maximum soil moisture value of the other plots (NT2–NT6) ranged between 0.219 and 0.299; in other layers, the maximum soil moisture value of NT1 was well within the maximum soil moisture values of other plots in the same layer. The minimum soil moisture values were very close between NT1 and the other plots at the same layer (<0.04). Meanwhile, the variances between NT1 and the other plots were 0.006 to 0.009 in the top 30 cm of the soil layer, and generally ranged from 0.001 to 0.004 for the other layers, which showed a good consistency of soil dynamics in the 30 to 110 cm soil layers compared with the top 30 cm of the soil layers. These consistencies may have been because (1) the height of ridge shoulders in the experimental plots was relatively low (<3 cm), and substantial infiltration could occur through the film holes made for maize growth; and (2) lateral water transfers could be substantially enhanced during the period of irrigation because of the soil water potential differences between ridges and furrows. This judgment can also be supported by research conducted in similar environments, e.g., Zhang et al. (2016). Therefore, we argue here that the uncertainty that the TDR location introduced to the SWBC estimations in this study is acceptable. For now, given that the effect of plastic mulched furrow irrigation on soil water distribution remains elusive (Zhang et al., 2016; Abbasi et al., 2004), installing the TDR in both the ridge and the furrow may be a better option in future studies. In addition, both the heterogeneity of soil hydrophysical properties in sandy soils and the rough artificial irrigation process can introduce uncertainties in the irrigation amount of any oasis cropland. However, the maximum irrigation rate of flood or furrow irrigation is mainly dependent on the Ks of the top soil layer, which is nearly homogeneous in such small experimental plots (6 m × 9 m) because they have the same cropping systems and agronomic history (Table 3); thus, there is no significant infiltration difference within one small plot, and the installed soil moisture probes can monitor the irrigation process of the entire plot well.
Overall, we are confident about the estimation accuracy of ET, which is the most important parameter among all of the SWBCs, and the one the related researchers are most interested in, due to its direct relevance to crop yield, and because maximizing crop yield is the major objective of agricultural irrigation strategies (Liu et al., 2002; Zhang et al., 2004; Kang et al., 2002). The ET estimation model in this study not only has great advantages in theory (for example, it does not require any root distribution information) (Schneider et al., 2010; Guderle and Hildebrandt, 2015), but it concurrently considers the hysteresis effect, unlike other common models (Li et al., 2002; Guderle and Hildebrandt, 2015), while also providing a reliable and high-resolution solution because its results are well within the range of published ET values at nearby sites (Table 5). Other SWBC estimations such as irrigation also had an acceptable accuracy, even though they were estimated using a relatively simple method, because the results show good consistency with the observations (actual irrigation calculated from the pumping power consumption) at the field scale and with the average irrigation amounts in other maize fields in the same region at close to the same time.
A database of soil moisture measurements taken in 2016 from six experimental fields (which were originally designed to test the accumulative impacts of different cropping systems and agronomic manipulations on soil-property evolution in the ecotone of desert and oasis) in the middle Heihe River basin of China was used to test the potential of a soil-moisture time series for estimating the SWBCs. We compared the hydrophysical properties of the soils in the plots, and then determined evapotranspiration and other SWBCs using a soil-moisture data-based method that combined both the soil water balance method and the inverse Richards equation, and the uncertainties of the employed methods were analyzed at the end of the experiment. Significant variances were observed among the film-mulched plots in both the cumulative irrigation volumes (652.1–867.3 mm) and deep drainages (170.7–364.7 mm). We found that the un-mulched plot had remarkably higher values in both cumulative irrigation volumes (1186.5 mm) and deep drainages (651.8 mm) compared with the mulched plots. We noticed that although an obvious correlation existed between the volume of irrigation and that of drained water, the ET demands for all of the plots behaved pretty much the same, with the cumulative ET values ranging between 489.1 and 561.9 mm for the different treatments in 2016. Our results confirmed that (1) relatively reasonable estimations of the SWBCs in a desert oasis environment can be derived by using soil moisture measurements. Although uncertainties exist, our method, which balanced simplicity and accuracy, can provide a reliable solution, especially with respect to estimating ET, for coarse-textured sandy soils; (2) the estimated results of the SWBCs will provide a valuable reference for optimizing irrigation strategies at the field scale, but it is still a long way from use on large areas of agricultural land, because of the soil heterogeneity at the regional scale and the small volume that a TDR probe can monitor.
The code and data used in this study are available from the authors upon request.
ZL and HL are the co-first authors and contributed equally to this work. HL provided insights and performed the coding and analysis; ZL and HL drafted the paper with contributions from all co-authors. QY, ZL, and RY ran the experiments and collected the data. WZ and JL contributed to analysis of the results, the discussion, and editing the paper.
The authors declare that they have no conflict of interest.
We would like to thank Yang Yu for his constructive suggestions on completing this work. Special thanks also go to the editor Fuqiang Tian, Michael W. I. Schmidt, Jun Niu, Yanjun Shen, Luca Brocca, Basil Frefel, Michèle Bösiger, and the other four anonymous reviewers, whose perceptive criticisms, comments, and suggestions helped us improve the quality of the paper.
This research was jointly supported by the National Natural Science Foundation of China (grant no. 41630861), the West Light Foundation of the Chinese Academy of Sciences (grant no. 29Y929621), and the Youth Innovation Promotion Association of the Chinese Academy of Sciences (awarded to Hu Liu in 2016).
This paper was edited by Fuqiang Tian and reviewed by Jun Niu and two anonymous referees.
Abbasi, F., Feyen, J., and Genuchten, M. T. V.: Two-dimensional simulation of water flow and solute transport below furrows: model calibration and validation, J. Hydrol., 290, 63–79, https://doi.org/10.1016/j.jhydrol.2003.11.028, 2004.
Abu, S. T. and Abubakar, I. U.: Evaluating the effects of tillage techniques on soil hydro-physical properties in Guinea Savanna of Nigeria, Soil Till. Res., 126, 159–168, https://doi.org/10.1016/j.still.2012.09.003, 2013.
Ács, F.: On Transpiration and Soil Moisture Content Sensitivity to Soil Hydrophysical Data, Bound.-Lay. Meteorol., 115, 473–497, https://doi.org/10.1007/s10546-004-5937-8, 2005.
Allen, R., Irmak, A., Trezza, R., Hendrickx, J. M. H., Bastiaanssen, W., and Kjaersgaard, J.: Satellite-based ET estimation in agriculture using SEBAL and METRIC, Hydrol. Process., 25, 4011–4027, https://doi.org/10.1002/hyp.8408, 2011.
Anderson, W. B., Zaitchik, B. F., Hain, C. R., Anderson, M. C., Yilmaz, M. T., Mecikalski, J., and Schultz, L.: Towards an integrated soil moisture drought monitor for East Africa, Hydrol. Earth Syst. Sci., 16, 2893–2913, https://doi.org/10.5194/hess-16-2893-2012, 2012.
Ascough, G. W.,= and Kiker, G. A.: The effect of irrigation uniformity on irrigation water requirements, Water SA, 28, 235–241, https://doi.org/10.4314/wsa.v28i2.4890, 2002.
Babcock, B. A. and Blackmer, A. M.: The Value of Reducing Temporal Input Nonuniformities, J. Agr. Resour. Econ., 17, 335–347, 1992.
Bachmann, J., Horton, R., Grant, S. A., and Van der Ploeg, R.: Temperature dependence of water retention curves for wettable and water-repellent soils, Soil Sci. Soc. Am. J., 66, 44–52, https://doi.org/10.2136/sssaj2002.4400, 2002.
Baldocchi, D. D., Xu, L., and Kiang, N.: How plant functional-type, weather, seasonal drought, and soil physical properties alter water and energy fluxes of an oak–grass savanna and an annual grassland, Agr. Forest Meteorol., 123, 13–39, https://doi.org/10.1016/j.agrformet.2003.11.006, 2004.
Bautista, E., and Wallender, W. W.: Reliability of Optimized Furrow-Infiltration Parameters, J. Irrig. Drain. Eng., 119, 784–800, https://doi.org/10.1061/(ASCE)0733-9437(1993)119:5(784), 1993.
Bethune, M. G., Selle, B., and Wang, Q. J.: Understanding and predicting deep percolation under surface irrigation, Water Resour. Res., 44, 681–687, https://doi.org/10.1029/2007WR006380, 2008.
Bourazanis, G., Rizos, S., and Kerkides, P.: Soil water balance in the presence of a shallow water table, in: Proceedings of 9th World Congress, June 2015, Istanbul, Turkey, 119–142, 2015.
Breña Naranjo, J. A., Weiler, M., and Stahl, K.: Sensitivity of a data-driven soil water balance model to estimate summer evapotranspiration along a forest chronosequence, Hydrol. Earth Syst. Sci., 15, 3461–3473, https://doi.org/10.5194/hess-15-3461-2011, 2011.
Campbell, G. S. and Diaz, R. (Eds.): Simplified soil-water balance models to predict crop transpiration, in: Drought Research Priorities for the Dryland Tropics, edited by: Bidinger, F. R. and Johansen, C., ICRISAT (International Crops Research Institute for the Semi-Arid Tropics), Patancheru, India, 15–26, 1988.
Celia, M. A., Bouloutas, E. T., and Zarba, R. L.: A general mass-conservative numerical solution for the unsaturated flow equation, Water Resour. Res., 26, 1483–1496, https://doi.org/10.1029/WR026i007p01483, 1990.
Chen, R., Kang, E., Ji, X., Yang, J., and Wang, J.: An hourly solar radiation model under actual weather and terrain conditions: A case study in Heihe river basin, Energy, 32, 1148–1157, https://doi.org/10.1016/j.energy.2006.07.006, 2007.
Chen, Y., Niu, J., Kang, S., and Zhang, X.: Effects of irrigation on water and energy balances in the Heihe River basin using VIC model under different irrigation scenarios, Sci. Total Environ., 645, 1183–1193, https://doi.org/10.1016/j.scitotenv.2018.07.254, 2018.
Costa-Cabral, M. C., Richey, J. E., Goteti, G., Lettenmaier, D. P., Feldkotter, C., and Snidvongs, A.: Landscape structure and use, climate, and water movement in the Mekong River basin, Hydrol. Process., 22, 1731–1746, https://doi.org/10.1002/hyp.6740, 2008.
Crosbie, R. S., McEwan, K. L., Jolly, I. D., Holland, K. L., Lamontagne, S., Moe, K. G., and Simmons, C. T.: Salinization risk in semi-arid floodplain wetlands subjected to engineered wetting and drying cycles, Hydrol. Process., 23, 3440–3452, https://doi.org/10.1002/hyp.7445, 2009.
Dejen, Z. A.: Hydraulic and operational performance of irrigation schemes in view of water saving and sustainability: sugar estates and community managed schemes in Ethiopia, CRC Press/Balkema, Leiden, the Netherlands, 2015.
Deng, X. P., Shan, L., Zhang, H., and Turner, N. C.: Improving agricultural water use efficiency in arid and semiarid areas of China, Agr. Water Manage., 80, 23–40, https://doi.org/10.1016/j.agwat.2005.07.021, 2006.
Dolman, A. and De Jeu, R.: Evaporation in focus, Nat. Geosci., 3, 296–296, https://doi.org/10.1038/ngeo849, 2010.
Dong, X., Xu, H., and Pu, J.: Extraction of Remote Sensing Information of Spring Crops Under Support of GPS and GIS in Yunnan Province, Agr. Meteorol., 24, 35–37, https://doi.org/10.3969/j.issn.1000-6362.2003.04.011, 2003.
Fares, A. and Alva, A. K.: Evaluation of capacitance probes for optimal irrigation of citrus through soil moisture monitoring in an entisol profile, Irrig. Sci., 19, 57–64, https://doi.org/10.1007/s002710050001, 2000.
Folhes, M. T., Rennó, C. D., and Soares, J. V.: Remote sensing for irrigation water management in the semi-arid Northeast of Brazil, Agr. Water Manage., 96, 1398–1408, https://doi.org/10.1016/j.agwat.2009.04.021, 2009.
Fu, B., Li, S., Yu, X., Ping, Y., Yu, G., Feng, R., and Zhuang, X.: Chinese ecosystem research network: Progress and perspectives, Ecol. Complex., 7, 225–233, https://doi.org/10.1016/j.econom.2010.02.007, 2010.
Gao, H. and Shao, M.: Effects of temperature changes on soil hydraulic properties, Soil Till. Res., 153, 145–154, https://doi.org/10.1016/j.still.2015.05.003, 2015.
Gao, L., Tian, F., Ni, G., and Hu, H.: Experimental study on soil water-salt movement and irrigation scheduling for cotton under mulched drip irrigation condition, J. Hydraul. Eng., 41, 1483–1490, https://doi.org/10.13243/j.cnki.slxb.2010.12.014, 2010.
Gardner, W. and Mayhugh, M.: Solutions and Tests of the Diffusion Equation for the Movement of Water in Soil, Soil Sci. Soc. Am. J., 22, 197–201, https://doi.org/10.2136/sssaj1958.03615995002200030003x, 1958.
Grayson, R. B., Blöschl, G., Willgoose, G. R., and Mcmahon, T. A.: Observed spatial organization of soil moisture and its relation to terrain indices, Water Resour. Res., 35, 797–810, https://doi.org/10.1029/1998wr900065, 1999.
Guderle, M. and Hildebrandt, A.: Using measured soil water contents to estimate evapotranspiration and root water uptake profiles – a comparative study, Hydrol. Earth Syst. Sci., 19, 409–425, https://doi.org/10.5194/hess-19-409-2015, 2015.
Haddeland, I., Lettenmaier, D. P., and Skaugen, T.: Effects of irrigation on the water and energy balances of the Colorado and Mekong river basins, J. Hydrol., 324, 210–223, https://doi.org/10.1016/j.jhydrol.2005.09.028, 2006.
Hamblin, A. P.: The influence of soil structure on water movement, crop root growth, and water uptake, Adv. Agron., 38, 95–158, https://doi.org/10.1016/S0065-2113(08)60674-4, 1985.
Hanks, R. J. and Bowers, S. A.: Numerical Solution of the Moisture Flow Equation for Infiltration into Layered Soil, Soil Sci. Soc. Am. J., 26, 530–534, https://doi.org/10.2136/sssaj1962.03615995002600060007x, 1962.
Hirobe, M., Ohte, N., Karasawa, N., Zhang, G. S., Wang, L. H., and Yoshikawa, K.: Plant species effect on the spatial patterns of soil properties in the Mu-us desert ecosystem, Inner Mongolia, China, Plant Soil, 234, 195–205, https://doi.org/10.1023/A:1017943030924, 2001.
Hu, K., Li, B., Chen, D., Zhang, Y., and Edis, R.: Simulation of nitrate leaching under irrigated maize on sandy soil in desert oasis in Inner Mongolia, China, Agr. Water Manage., 95, 1180–1188, https://doi.org/10.1016/j.agwat.2008.05.001, 2008.
Ibrom, A., Dellwik, E., Flyvbjerg, H., Jensen, N. O., and Pilegaard, K.: Strong low-pass filtering effects on water vapour flux measurements with closed-path eddy correlation systems, Agr. Forest Meteorol., 147, 140–156, https://doi.org/10.1016/j.agrformet.2007.07.007, 2007.
Jalota, S. K. and Arora, V. K.: Model-based assessment of water balance components under different cropping systems in north-west India, Agr. Water Manage., 57, 75–87, https://doi.org/10.1016/S0378-3774(02)00049-5, 2002.
Ji, X., Kang, E., Chen, R., Zhao, W., Zhang, Z., and Jin, B.: A mathematical model for simulating water balances in cropped sandy soil with conventional flood irrigation applied, Agr. Water Manage., 87, 337–346, https://doi.org/10.1016/j.agwat.2006.08.011, 2007.
Jia, Y., Li, F., Wang, X., and Yang, S.: Soil water and alfalfa yields as affected by alternating ridges and furrows in rainfall harvest in a semiarid environment, Field Crops Res., 97, 167–175, https://doi.org/10.1016/j.fcr.2005.09.009, 2006.
Jiang, Y., Zhang, L., Zhang, B., He, C., Jin, X., and Bai, X.: Modeling irrigation management for water conservation by DSSAT-maize model in arid northwestern China, Agr. Water Manage., 177, 37–45, https://doi.org/10.1016/j.agwat.2016.06.014, 2016.
Kallitsari, C., Georgiou, P. E., and Babajimopoulos, C.: Evaluation of Crop Water-Production Functions under Limited Soil Water Availability with SWBACROS model, in: Proceedings of the European Federation for Information Technology in Agriculture, Food and the Environment World Congress on Computers in Agriculture, July 2011, Prague, 585–596, available at: http://aims.fao.org/events/8th-EFITA-2011 (last access: 30 September 2019), 2011.
Kang, S., Zhang, L., Liang, Y., Hu, X., Cai, H., and Gu, B.: Effects of limited irrigation on yield and water use efficiency of winter wheat in the Loess Plateau of China, Agr. Water Manage., 55, 203–216, https://doi.org/10.1016/S0378-3774(01)00180-9, 2002.
Katsvairo, T., Cox, W. J., and Van Es, H.: Tillage and Rotation Effects on Soil Physical Characteristics, Agron. J., 94, 299–304, https://doi.org/10.2134/agronj2002.0299, 2002.
Keller, A.: Evapotranspiration and Crop Water Productivity: Making Sense of the Yield-ET Relationship, in: World Water and Environmental Resources Congress, 15 May 2005, Anchorage, Alaska, USA, 1–11, https://doi.org/10.1061/40792(173)528, 2005.
Kirnak, H. and Akpinar, Y.: Performance evaluation of TDR soil moisture sensor, Agron. Res., 14, 428–433, 2016.
Lal, R.: Carbon sequestration in dryland ecosystems, Environ. Manage., 33, 528–544, https://doi.org/10.1007/s00267-003-9110-9, 2004.
Li, D., Ji, X., and Zhao, L.: Simulation of Seed Corn Farmland Soil Moisture Migration Regularity in the Midstream of the Heihe River Basin, Arid Zone Res., 3, 467–475, https://doi.org/10.13866/j.azr.2015.03.08, 2015.
Li, X., Tong, L., Niu, J., Kang, S., Du, T., Li, S., and Ding, R.: Spatio-temporal distribution of irrigation water productivity and its driving factors for cereal crops in Hexi Corridor, Northwest China, Agr. Water Manage., 179, 55–63, https://doi.org/10.1016/j.agwat.2016.07.010, 2017.
Li, Y., Fuchs, M., Cohen, S., Cohen, Y., and Wallach, R.: Water uptake profile response of corn to soil moisture depletion, Plant Cell Environ., 25, 491–500, https://doi.org/10.1046/j.1365-3040.2002.00825.x, 2002.
Liao, R., Yang, P., Wu, W., and Ren, S.: An Inverse Method to Estimate the Root Water Uptake Source-Sink Term in Soil Water Transport Equation under the Effect of Superabsorbent Polymer, Plos One, 11, 1–17, https://doi.org/10.1371/journal.pone.0159936, 2016.
Liu, H. and Lin, H.: Frequency and Control of Subsurface Preferential Flow: From Pedon to Catchment Scales, Soil Sci. Soc. Am. J., 79, 362, https://doi.org/10.2136/sssaj2014.08.0330, 2015.
Liu, H., Zhao, W., He, Z., and Liu, J.: Soil moisture dynamics across landscape types in an arid inland river basin of Northwest China, Hydrol. Process., 29, 3328–3341, https://doi.org/10.1002/hyp.10444, 2015.
Liu, W., Hunsaker, D. J., Li, Y., Xie, X., and Wall, G.: Interrelations of yield, evapotranspiration, and water use efficiency from marginal analysis of water production functions, Agr. Water Manage., 56, 143–151, https://doi.org/10.1016/S0378-3774(02)00011-2, 2002.
Lv, L.: Linking montane soil moisture measurements to evapotranspiration using inverse numerical modeling, PhD Dissertation, Utah State University, Utah, USA, 3323, available at: https://search.proquest.com/docview/1658771061 (last access: 30 September 2019), 2014.
Mbah, C. N., Nwite, J. N., and Njoku, C.: Physical properties of an ultisol under plastic film and no-mulches and their effect on the yield of maize, World J. Agr. Sci., 6, 160–165, https://doi.org/10.7537/marsjas050509.04, 2010.
Muñoz-Carpena, R.: Field devices for monitoring soil water content, edis, university of florida cooperative extension service, Open File Rep. 343, Field devices for monitoring soil water content, edis, university of florida cooperative extension service, Institute of Food and Agricultural Sciences, USA, 1–24, available at: https://edis.ifas.ufl.edu/ae266 (last access: 30 September 2019), 2004.
Musters, P. A. D. and Bouten, W.: Optimum strategies of measuring soil water contents for calibrating a root water uptake model, J. Hydrol., 227, 273–286, https://doi.org/10.1016/s0022-1694(99)00187-0, 2000.
Odofin, A. J., Egharevba, N. A., Babakutigi, A. N., and Eze, P. C.: Drainage beyond maize root zone in an Alfisol subjected to three land management systems at Minna, Nigeria, J. Soil Sci. Environ. Manage., 3, 216–223, https://doi.org/10.5897/JSSEM11.143, 2012.
Ojha, R., Corradini, C., Morbidelli, R., and Rao, G.: Effective Saturated Hydraulic Conductivity for Representing Field-Scale Infiltration and Surface Soil Moisture in Heterogeneous Unsaturated Soils Subjected to Rainfall Events, Water, 9, 134–151, https://doi.org/10.3390/w9020134, 2017.
Porporato, A., D'Odorico, P., Laio, F., Ridolfi, L., and Rodriguez-Iturbe, I.: Ecohydrology of water-controlled ecosystems, Adv. Water Resour., 25, 1335–1348, https://doi.org/10.1016/S0309-1708(02)00058-1, 2002.
Qin, S., Zhang, J., Dai, H., Wang, D., and Li, D.: Effect of ridge–furrow and plastic-mulching planting patterns on yield formation and water movement of potato in a semi-arid area, Agr. Water Manage., 131, 87–94, https://doi.org/10.1016/j.agwat.2013.09.015, 2014.
Quinones, H. and Ruelle, P.: Operative Calibration Methodology of a TDR Sensor for Soil Moisture Monitoring under Irrigated Crops, Subsurf. Sens. Technol. Appl., 2, 31–45, https://doi.org/10.1023/a:1010114109498, 2001.
Rahgozar, M., Shah, N., and Ross, M. A.: Estimation of Evapotranspiration and Water Budget Components Using Concurrent Soil Moisture and Water Table Monitoring, Int. Scholar. Res. Notic., 2012, 1–15, https://doi.org/10.5402/2012/726806, 2012.
Read, D. B., Bengough, A. G., Gregory, P. J., Crawford, J. W., Robinson, D., Scrimgeour, C. M., Young, I. M., Zhang, K., and Zhang, X.: Plant roots release phospholipid surfactants that modify the physical and chemical properties of soil, New Phytol., 157, 315–326, https://doi.org/10.1046/j.1469-8137.2003.00665.x, 2003.
Rice, R. C., Bowman, R. S., and Jaynes, D. B.: Percolation of water below an irrigated field, Soil Sci. Soc. Am. J., 50, 855–859, https://doi.org/10.2136/sssaj1986.03615995005000040005x, 1986.
Rong, Y.: Estimation of maize evapotranspiration and yield under different deficit irrigation on a sandy farmland in Northwest China, Afr. J. Agr. Res., 7, 4698–4707, https://doi.org/10.5897/AJAR11.1213, 2012.
Salazar, O., Wesström, I., and Joel, A.: Evaluation of DRAINMOD using saturated hydraulic conductivity estimated by a pedotransfer function model, Agr. Water Manage., 95, 1135–1143, https://doi.org/10.1016/j.agwat.2008.04.011, 2008.
Salem, H. M., Valero, C., Muñoz, M. Á., Rodríguez, M. G., and Silva, L. L.: Short-term effects of four tillage practices on soil physical properties, soil water potential, and maize yield, Geoderma, 237, 60–70, https://doi.org/10.1016/j.geoderma.2014.08.014, 2015.
Schelde, K., Ringgaard, R., Herbst, M., Thomsen, A., Friborg, T., and Søgaard, H.: Comparing Evapotranspiration Rates Estimated from Atmospheric Flux and TDR Soil Moisture Measurements, Vadose Zone J., 10, 78–83, https://doi.org/10.2136/vzj2010.0060, 2011.
Schneider, C. L., Attinger, S., Delfs, J. O., and Hildebrandt, A.: Implementing small scale processes at the soil-plant interface – the role of root architectures for calculating root water uptake profiles, Hydrol. Earth Syst. Sci., 14, 279–289, https://doi.org/10.5194/hess-14-279-2010, 2010.
Selle, B., Minasny, B., Bethune, M., Thayalakumaran, T., and Chandra, S.: Applicability of Richards' equation models to predict deep percolation under surface irrigation, Geoderma, 160, 569–578, https://doi.org/10.1016/j.geoderma.2010.11.005, 2011.
Séré, G., Ouvrard, S., Magnenet, V., Pey, B., Morel, J. L., and Schwartz, C.: Predictability of the Evolution of the Soil Structure using Water Flow Modeling for a Constructed Technosol, Vadose Zone J., 11, 59–75, https://doi.org/10.2136/vzj2011.0069, 2012.
Shah, N., Ross, M., and Trout, K.: Using Soil Moisture Data to Estimate Evapotranspiration and Development of a Physically Based Root Water Uptake Model, in: Evapotranspiration-Remote Sensing and Modeling, edited by: Irmak, A., IntechOpen, https://doi.org/10.5772/18040, 2012.
Sharma, H., Shukla, M. K., Bosland, P. W., and Steiner, R.: Soil moisture sensor calibration, actual evapotranspiration, and crop coefficients for drip irrigated greenhouse chile peppers, Agr. Water Manage., 179, 81–91, https://doi.org/10.1016/j.agwat.2016.07.001, 2017.
Sławiński, Sobczuk, H., Stoffregen, H., Walczak, R., and Wessolek, G.: Effect of data resolution on soil hydraulic conductivity prediction, J. Plant Nutr. Soil Sci., 165, 45–49, https://doi.org/10.1002/1522-2624(200202)165:1<45::AID-JPLN45>3.0.CO;2-I, 2002.
Sr, H. J. C., Grimm, N. B., Gosz, J. R., and Seastedt, T. R.: The US Long Term Ecological Research Program, Bioscience, 53, 21–32, https://doi.org/10.1641/0006-3568(2003)053[0021:TULTER]2.0.CO;2, 2003.
Srivastava, R. K., Panda, R. K., and Halder, D.: Effective crop evapotranspiration measurement using time-domain reflectometry technique in a sub-humid region, Theor. Appl. Climatol., 129, 1211–1225, https://doi.org/10.1007/s00704-016-1841-7, 2017.
Su, P., Du, M., Zhao, A., and Zhang, X.: Study on water requirement law of some crops and different planting mode in oasis, Agr. Res. Arid Areas, 20, 79–85, https://doi.org/10.3321/j.issn:1000-7601.2002.02.019, 2002.
Su, Y., Yang, X., and Yang, R.: Effect of Soil Texture in Unsaturated Zone on Soil Nitrate Accumulation and Groundwater Nitrate Contamination in a Marginal Oasis in the Middle of Heihe River Basin, Environ. Sci., 35, 3683–3691, https://doi.org/10.13227/j.hjkx.2014.10.007, 2014.
Suleiman, A. A. and Hoogenboom, G.: Comparison of Priestley-Taylor and FAO-56 Penman–Monteith for daily reference evapotranspiration estimation in Georgia, J. Irrig. Drain. Eng., 133, 175–182, https://doi.org/10.1061/(asce)0733-9437(2007)133:2(175), 2007.
Sun, H., Wu, R., Li, P. I., Shao, S., Qi. L., and Han, J.: Rooting Depth of Alfalfa, Acta Agrest. Sin., 16, 307–312, https://doi.org/10.11733/j.issn.1007-0435.2008.03.019, 2008.
Tian, F., Lu, Y., Hu, H., Kinzelbach, W., and Sivapalan, M.: Dynamics and driving mechanisms of asymmetric human water consumption during alternating wet and dry periods, Hydrolog. Sci. J., 64, 507–524, https://doi.org/10.1080/02626667.2019.1588972, 2019.
Topp, G. C., Davis, J., and Annan, A. P.: Electromagnetic determination of soil water content: Measurements in coaxial transmission lines, Water Resour. Res., 16, 574–582, https://doi.org/10.1029/WR016i003p00574, 1980.
Vereecken, H., Huisman, J. A., Bogena, H., Vanderborght, J., Vrugt, J. A., and Hopmans, J. W.: On the value of soil moisture measurements in vadose zone hydrology: A review, Water Resour. Res., 44, W00D06, https://doi.org/10.1029/2008WR006829, 2008.
Wang, K. and Dickinson, R. E.: A review of global terrestrial evapotranspiration: Observation, modeling, climatology, and climatic variability, Rev. Geophys., 50, RG2005, https://doi.org/10.1029/2011RG000373, 2012.
Wang, P., Yu, J., Pozdniakov, S. P., Grinevsky, S. O., and Liu, C.: Shallow groundwater dynamics and its driving forces in extremely arid areas: a case study of the lower Heihe River in northwestern China, Hydrol. Process., 28, 1539–1553, https://doi.org/10.1002/hyp.9682, 2014.
Wu, J., Ding, Y., Wang, G., Yamazaki, Y., and Kubota, J.: Evapotranspiration of Seed Maize Field in Arid Region, J. Irrig. Drain., 26, 14–17, https://doi.org/10.3969/j.issn.1672-3317.2007.01.004, 2007.
Wu, X., Zhou, J., Wang, H., Li, Y., and Zhong, B.: Evaluation of irrigation water use efficiency using remote sensing in the middle reach of the Heihe river, in the semi-arid Northwestern China, Hydrol. Process., 29, 2243–2257, https://doi.org/10.1002/hyp.10365, 2015.
Yang, B., Wen, X., and Sun, X.: Irrigation depth far exceeds water uptake depth in an oasis cropland in the middle reaches of Heihe River Basin, Scient. Rep., 5, 15206, https://doi.org/10.1038/srep15206, 2015.
Yang, J., Mao, X., Wang, K., and Yang, W.: The coupled impact of plastic film mulching and deficit irrigation on soil water/heat transfer and water use efficiency of spring wheat in Northwest China, Agr. Water Manage., 201, 232–245, https://doi.org/10.1016/j.agwat.2017.12.030, 2018.
Yang, X., Yu, Y., and Li, M.: Estimating soil moisture content using laboratory spectral data, J. Forest. Res., 30, 1073–1080, https://doi.org/10.1007/s11676-018-0633-6, 2019.
Yong, H., Hou, L., Hong, W., Hu, K., and Mcconkey, B.: A modelling approach to evaluate the long-term effect of soil texture on spring wheat productivity under a rain-fed condition, Scient. Rep., 4, 5736, https://doi.org/10.1038/srep05736, 2014.
You, D. B., Wang, J. L., Ming-Qiang, L., and Hua, Q. I.: Evapotranspiration of maize field in irrigation area in heihe middle reaches using the Penman–Monteith method, Acta Agricult. Boreali-Sin., 30, 139–145, https://doi.org/10.7668/hbnxb.2015.S1.025, 2015.
Young, M. H., Wierenga, P. J., and Mancino, C. F.: Monitoring Near-Surface Soil Water Storage in Turfgrass using Time Domain Reflectometry and Weighing Lysimetry, Soil Sci. Soc. Am. J., 61, 1138–1146, https://doi.org/10.2136/sssaj1997.03615995006100040021x, 1997.
Yu, Y., Wei, W., Chen, L., Feng, T., and Daryanto, S.: Quantifying the effects of precipitation, vegetation, and land preparation techniques on runoff and soil erosion in a Loess watershed of China, Sci. Total Environ., 652, 755–764, https://doi.org/10.1016/j.scitotenv.2018.10.255, 2019.
Zhang, Y., Kendy, E., Qiang, Y., Changming, L., Yanjun, S., and Hongyong, S.: Effect of soil water deficit on evapotranspiration, crop yield, and water use efficiency in the North China Plain, Agr. Water Manage., 64, 107–122, https://doi.org/10.1016/s0378-3774(03)00201-4, 2004.
Zhang, Y., Wu, P., Zhao, X., and Zhao, W.: Measuring and modeling two-dimensional irrigation infiltration under film-mulched furrows, Sci. Cold Arid Reg., 8, 419–431, https://doi.org/10.3724/SP.J.1226.2016.00419, 2016.
Zhang, Y., Wang, F., Shock, C. C., Yang, K., Kang, S., Qin, J., and Li, S.: Influence of different plastic film mulches and wetted soil percentages on potato grown under drip irrigation, Agr. Water Manage., 180, 160–171, https://doi.org/10.1016/j.agwat.2016.11.018, 2017.
Zhang, Z., Hu, H., Tian, F., Yao, X., and Sivapalan, M.: Groundwater dynamics under water-saving irrigation and implications for sustainable water management in an oasis: Tarim River basin of western China, Hydrol. Earth Syst. Sci., 18, 3951–3967, https://doi.org/10.5194/hess-18-3951-2014, 2014.
Zhao, L. and Ji, X.: Quantification of transpiration and evaporation over agricultural field using the FAO-56 dual crop coefficient approach – A case study of the maize field in an oasis in the middle stream of the Heihe River Basin in Northwest China, Scient. Agricult. Sin., 43, 4016-4026, https://doi.org/10.3864/j.issn.0578-1752.2010.19.014, 2010.
Zhao, L. and Zhao, W.: Water balance and migration for maize in an oasis farmland of northwest China, Chin. Sci. Bull., 59, 4829–4837, https://doi.org/10.1007/s11434-014-0482-4, 2014.
Zhao, L., Zhao, W., and Ji, X.: Division between transpiration and evaporation, and crop water consumption over farmland within oases of the middlestream of Heihe River basin, Northwestern China, Acta Ecol. Sin., 35, 1114–1123, https://doi.org/10.5846/stxb201304220778, 2015.
Zhao, L., He, Z., Zhao, W., and Yang, Q.: Extensive investigation of the sap flow of maize plants in an oasis farmland in the middle reach of the Heihe River, Northwest China, J. Plant Res., 129, 841–851, https://doi.org/10.1007/s10265-016-0835-y, 2016.
Zhao, W. and Chang, X.: The effect of hydrologic process changes on NDVI in the desert-oasis ecotone of the Hexi Corridor, Sci. China-Earth Sci., 57, 3107–3117, https://doi.org/10.1007/s11430-014-4927-z, 2014.
Zhao, W., Liu, B., and Zhang, Z.: Water requirements of maize in the middle Heihe River basin, China, Agr. Water Manage., 97, 215–223, https://doi.org/10.1016/j.agwat.2009.09.011, 2010.
Zhou, H., Zhao, W., and Zhang, G.: Varying water utilization of Haloxylon ammodendron plantations in a desert-oasis ecotone, Hydrol. Process., 31, 825–835, https://doi.org/10.1002/hyp.11060, 2017.
Zotarelli, L., Dukes, M. D., Morgan, and Morgan, K. T.: Interpretation of soil moisture content to determine soil field capacity and avoid over-irrigating sandy soils using soil moisture sensors, Agricultural and Biological Engineering, available at: http://edis.ifas.ufl.edu/ae460 (last access: 30 September 2019), 2016.
Zou, M., Niu, J., Kang, S., Li, X., and Lu, H.: The contribution of human agricultural activities to increasing evapotranspiration is significantly greater than climate change effect over Heihe agricultural region, Scient. Rep., 7, 8805, https://doi.org/10.1038/s41598-017-08952-5, 2017.
Zuo, Q. and Zhang, R.: Estimating root-water-uptake using an inverse method, Soil Science, 167, 561–571, https://doi.org/10.1097/00010694-200209000-00001, 2002.