the Creative Commons Attribution 4.0 License.
the Creative Commons Attribution 4.0 License.
 | 13 Dec 2019
Effects of preferential flow on snowmelt partitioning and groundwater recharge in frozen soils
Igor Pavlovskii
Edwin E. Cey
Masaki Hayashi
Snowmelt is a major source of groundwater recharge in cold regions. Throughout many landscapes snowmelt occurs when the ground is still frozen; thus frozen soil processes play an important role in snowmelt routing, and, by extension, the timing and magnitude of recharge. This study investigated the vadose zone dynamics governing snowmelt infiltration and groundwater recharge at three grassland sites in the Canadian Prairies over the winter and spring of 2017. The region is characterized by numerous topographic depressions where the ponding of snowmelt runoff results in focused infiltration and recharge. Water balance estimates showed infiltration was the dominant sink (35 %–85 %) of snowmelt under uplands (i.e. areas outside of depressions), even when the ground was frozen, with soil moisture responses indicating flow through the frozen layer. The refreezing of infiltrated meltwater during winter melt events enhanced runoff generation in subsequent melt events. At one site, time lags of up to 3 d between snow cover depletion on uplands and ponding in depressions demonstrated the role of a shallow subsurface transmission pathway or interflow through frozen soil in routing snowmelt from uplands to depressions. At all sites, depression-focused infiltration and recharge began before complete ground thaw and a significant portion (45 %–100 %) occurred while the ground was partially frozen. Relatively rapid infiltration rates and non-sequential soil moisture and groundwater responses, observed prior to ground thaw, indicated preferential flow through frozen soils. The preferential flow dynamics are attributed to macropore networks within the grassland soils, which allow infiltrated meltwater to bypass portions of the frozen soil matrix and facilitate both the lateral transport of meltwater between topographic positions and groundwater recharge through frozen ground. Both of these flow paths may facilitate preferential mass transport to groundwater.
- Article
(2410 KB) -
Supplement
(365 KB) - BibTeX
- EndNote


Snowmelt infiltration and soil freeze–thaw processes are important for modulating hydrological behaviour in cold regions. In many northern landscapes the ground is still frozen when snowmelt begins, and consequently water movement into, through, and over frozen soil plays a critical role in routing snowmelt through catchments (Gray et al., 2001; Hayashi, 2013). Water movement in frozen soils is strongly affected by meteorological and soil moisture dynamics during the preceding seasons and by the coupling of soil water flow and heat transfer processes (Stähli et al., 1999). This coupling, in addition to water and energy transfer at the ground surface, creates complex subsurface flow dynamics during snowmelt (Ireson et al., 2013; Lundberg et al., 2016).
In many cold regions, focused infiltration of snowmelt under topographic depressions is an important mechanism of groundwater recharge (Baker and Spaans, 1997; Hayashi et al., 2003; French and Binley, 2004; Gerke et al., 2010; Greenwood and Buttle, 2018). The Canadian Prairies located in the northern Great Plains (Fig. 1) is an example of such an environment. The area has a cold semi-arid climate with snowmelt providing the major fraction of groundwater recharge (Maulé et al., 1994; Pavlovskii et al., 2018). The region is blanketed by glacial sediments with characteristic undulating terrain and many internally drained depressions (Winter and Rosenberry, 1998). During snowmelt, frozen ground limits infiltration under the uplands surrounding depressions, promoting runoff generation and ponding that results in depression-focused infiltration and recharge (Hayashi et al., 1998). These depressions are an important component of subsurface water budgets as they control the snowmelt input into the groundwater system, and many depressions over the landscape collectively provide a large potential for recharge (van der Kamp and Hayashi, 1998; Berthold et al., 2004). Despite this significance, there are still uncertainties in the groundwater recharge function of prairie landscapes, specifically, in the combined effects of preferential flow and freeze–thaw processes on the rate and timing of meltwater infiltration and its partitioning between soil moisture and groundwater recharge prior to ground thaw.
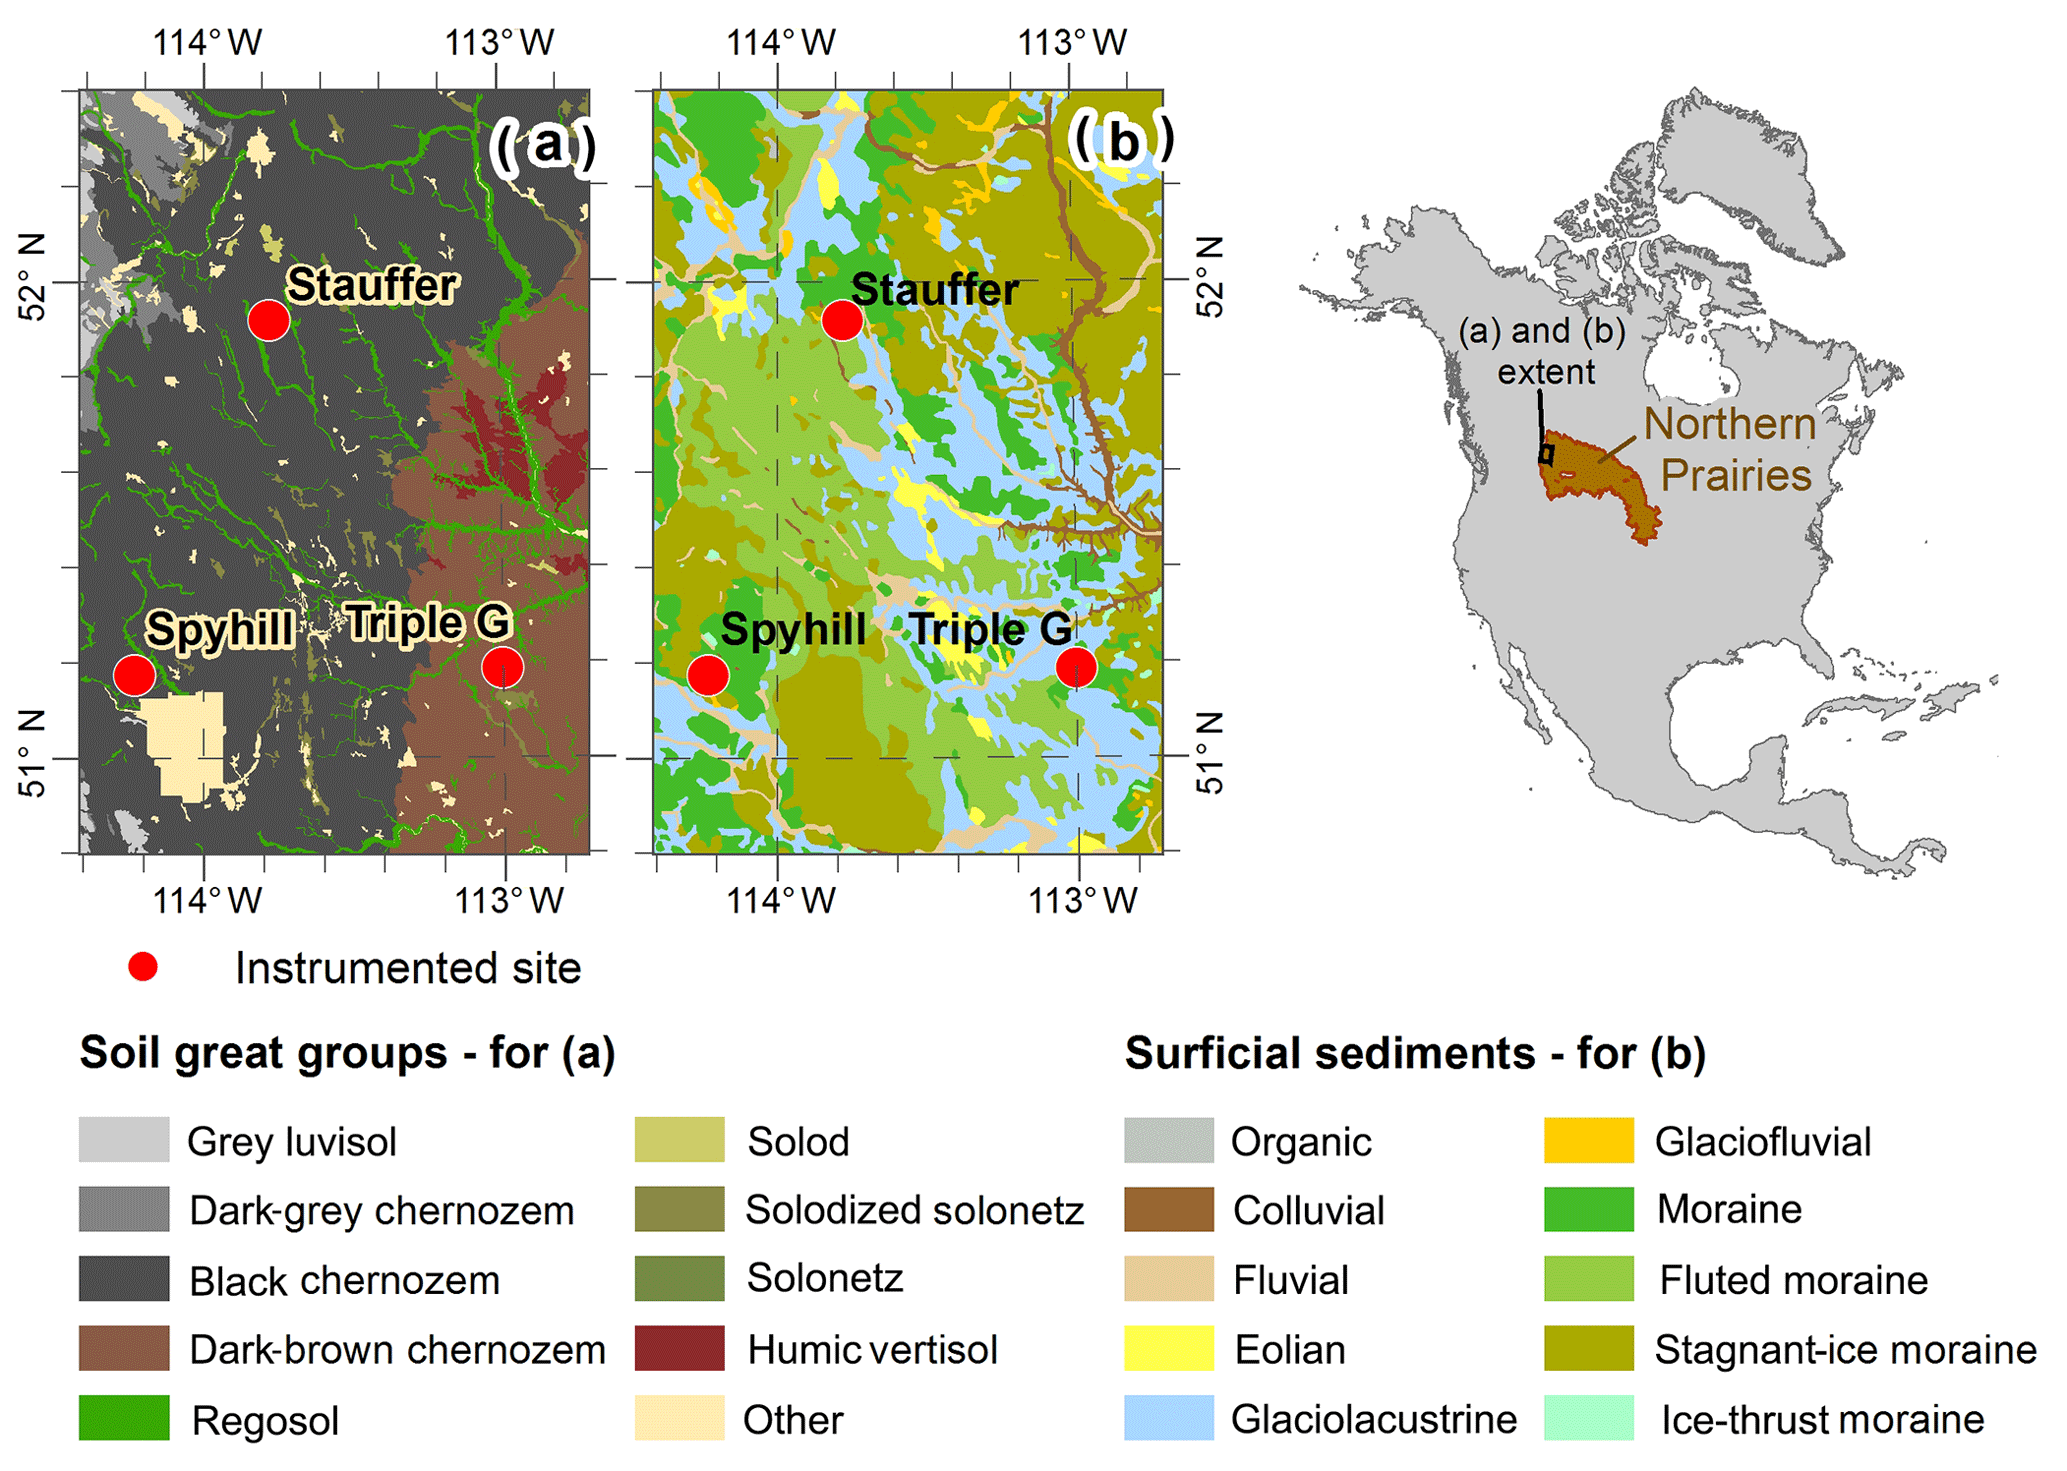
Figure 1Location of the Prairie Pothole Region and study sites within North America. Main classifications of (a) soil and (b) surficial sediments at study sites.
Previous studies in cultivated fields in the Canadian Prairies have noted that the infiltration of ponded water in depressions begins when the soil is still partially frozen, but the initial infiltration rate is limited to the rate of soil thawing, and groundwater recharge only begins once the soil completely thaws (Hayashi et al., 2003). However, perennial grasslands generally have a higher frozen-soil infiltrability due to the presence and development of a macropore network, in comparison to croplands, where annual cultivation breaks up the macropore network near the surface (van der Kamp et al., 2003). In addition, zero-tillage cropping, which has been increasingly adopted in the Prairies over the past several decades, may also allow macropore networks to be preserved (Tiessen et al., 2010). Macropores facilitate preferential flow that can cause water, solutes, and thermal energy to bypass much of the soil matrix (Flury et al., 1994). Granger et al. (1984) classified one of the modes of infiltration into frozen soils as “unlimited”, where most available meltwater is infiltrated due to preferential flow through macropores. In unsaturated soils, macropores remain air-filled upon freezing, which can have a strong influence on the spatial and temporal characteristics of infiltration by enabling the transfer of water into and below the frost zone (Espeby, 1992; Ishikawa et al., 2006). Under these conditions, most infiltration occurs through macropores as freezing temperatures and pore ice greatly reduce the hydraulic conductivity of the soil matrix (Holten et al., 2018; Grant et al., 2019; Demand et al., 2019). However, depending on the soil temperature, infiltrated meltwater may be cooled by the surrounding frozen soil and refreeze along preferential pathways, blocking the flow of water to greater depths and reducing soil infiltrability (Stähli et al., 1996; Watanabe and Kugisaki, 2017). The influence of these processes on snowmelt partitioning and groundwater recharge dynamics in prairie grasslands remains unclear (van der Kamp et al., 1999; van der Kamp and Hayashi, 2009). An improved understanding of the interacting effects of preferential flow and soil freeze–thaw processes, acting from the ground surface through the entire vadose zone, is needed to better understand their influence on groundwater recharge and snowmelt routing at hillslope and watershed scales.
Isolating the effects of frozen soil on meltwater partitioning remains challenging, as snowmelt-driven processes are further modulated by other local-scale factors that affect a field's water and energy balance, such as variability in topographic and microtopographic relief, wind-driven snow redistribution, shading, and land cover (Stähli, 2006; Hayashi, 2013). These overlapping influences obscure the specific effects of frozen soil on snowmelt partitioning, thereby necessitating multi-site observations to draw generalized conclusions about water movement in frozen soil. The primary objective of this study was to characterize the infiltration and soil freeze–thaw processes controlling snowmelt partitioning simultaneously at three instrumented study sites and evaluate the potential for both lateral and vertical preferential flow in frozen soils. The secondary objective was to examine how these processes affect the timing, magnitude, and dynamics of groundwater recharge in prairie grasslands.
Three perennial grassland sites (designated Stauffer, Spyhill, and Triple G), located near the western edge of the Canadian Prairies, part of the larger northern Prairie region (Winter and Rosenberry, 1998), were included in this study (Fig. 1). Surficial geology of the study sites is characterized by glacial sediments of varying composition and hummocky or undulating terrain with numerous depressions (Fenton et al., 2013). The semi-arid climate is typical of the Canadian Prairies: cold winters, low annual precipitation (∼400–500 mm) and hot, dry summers. Maximum frost depth is approximately 1 m, with freezing typically starting in November and thawing occurring in April to early May (Hayashi and Farrow, 2014). Due to proximity of the Rocky Mountains, foehn winds (locally known as “chinooks”) are a common occurrence in the study area and lead to regular midwinter snowmelt events when air temperatures rise above 0 ∘C (Nkemdirim, 1996).
Studies focused on an individual drainage catchment and corresponding depression at each site (Fig. 2): SE2 at Stauffer; W at Triple G; and GP at Spyhill. At the time of the study, land cover was grassland used for cattle grazing at Stauffer and Triple G and ungrazed grassland at Spyhill. Soils at the sites are classified as orthic black or brown chernozems (Soil Classification Working Group, 1998) underlain by glacial till of varying composition ranging in thickness from 7 to 20 m (Pavlovskii et al., 2018). The present study focuses on the monitoring of surface and subsurface hydrological conditions along a depression–upland complex at each site using data collected during the winter and spring of 2016–2017.
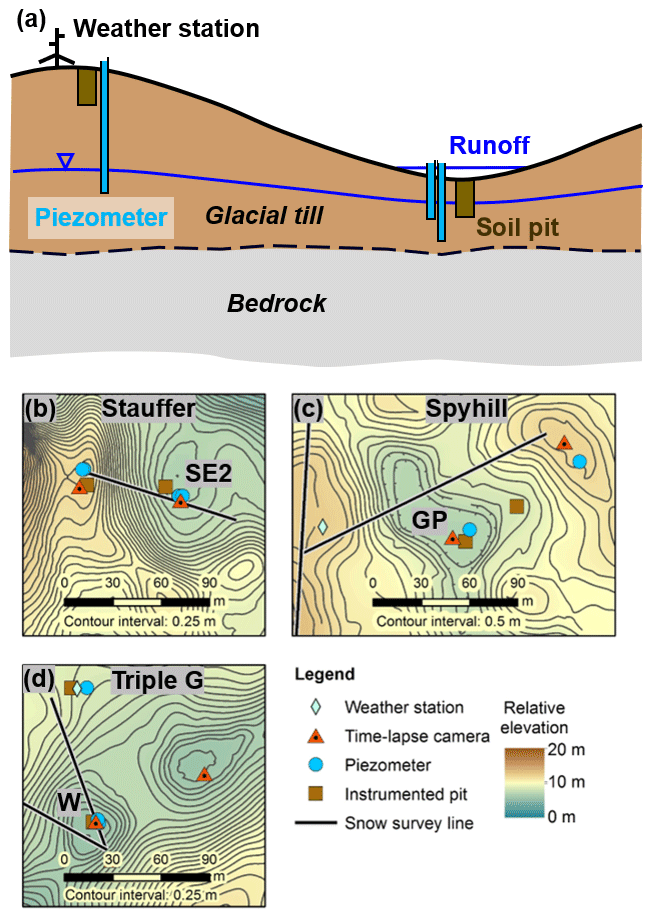
Figure 2Conceptual cross section of instrumentation at the study sites (a). Plan views of instrumentation and relative elevations of (b) SE2 at the Stauffer site, (c) GP at the Spyhill site, and (d) W at the Triple G site.
3.1 Meteorological and land surface measurements
Each site was instrumented with a meteorological station equipped with sensors measuring air temperature, humidity, wind speed, net radiation, total (rain and snow) precipitation, and an eddy-covariance system consisting of a sonic anemometer and a krypton hygrometer at 1.9 m above the ground surface. All-season precipitation data for the Triple G site were not available, so precipitation records from an Alberta Agriculture and Forestry weather station located 5 km north (Standard, Alberta) were used instead. Details regarding the instrument models and precipitation and eddy-covariance data processing are described in Pavlovskii et al. (2019b). At Spyhill and Triple G, the meteorological station was located directly above the upland instrumented soil pit within the internal catchment of depressions GP and W, respectively, while at Stauffer it was situated approx. 600 m north of depression SE2. Snow cover and water ponding conditions were monitored using time-lapse cameras (Wingscapes, TimelapseCam) and snow gauges at upland and depression locations. To monitor the ponding and recession rates in depressions, water levels were recorded on snow gauges visible in the camera images. Water depths in depressions were also measured using pressure transducers (Solinst Levelogger 3001) when possible. Transducers were not deployed in depressions during midwinter snowmelt events due to the possibility of them being damaged by freezing water. In addition, snow surveys were conducted at various intervals throughout the winter. Snow depth was measured using a metal ruler along a 100 to 200 m snow course traversing each depression and the surrounding uplands, and snow samples were collected at 50 m intervals using a 7.0 cm diameter aluminum snow tube. Snow samples were transferred to a sealable bag and weighed in the laboratory to determine the snow water equivalent (SWE). The average SWE was calculated from the average snow depth and density.
Snowmelt runoff was estimated from the volume of water collected in depressions (Mohammed et al., 2013). Pond water levels in depressions were converted to runoff volumes using depth–volume relationships derived from high-resolution topographical surveys of the depressions. The effective snowmelt runoff per unit area was then calculated by dividing the volume of water by the catchment area. This method underestimates runoff as it does not consider the volume of water that initially runs on and then infiltrates beneath the depression prior to observable ponding (Hayashi et al., 2003).
3.2 Vadose zone and groundwater monitoring
Vadose zone conditions were monitored using instrumented soil pits recording soil moisture and temperature under upland and depression locations, with depression pits installed below the lowest surface elevation point in depressions (Fig. 2). Details of the depth and intervals of subsurface instrumentation are listed in Table 1. Required excavations and instrument installation were carried out in October 2014, so disturbance of the soil profile is expected to be minimal for the 2016–2017 season reported here.
Table 1Subsurface instrument depths and piezometer screen intervals.
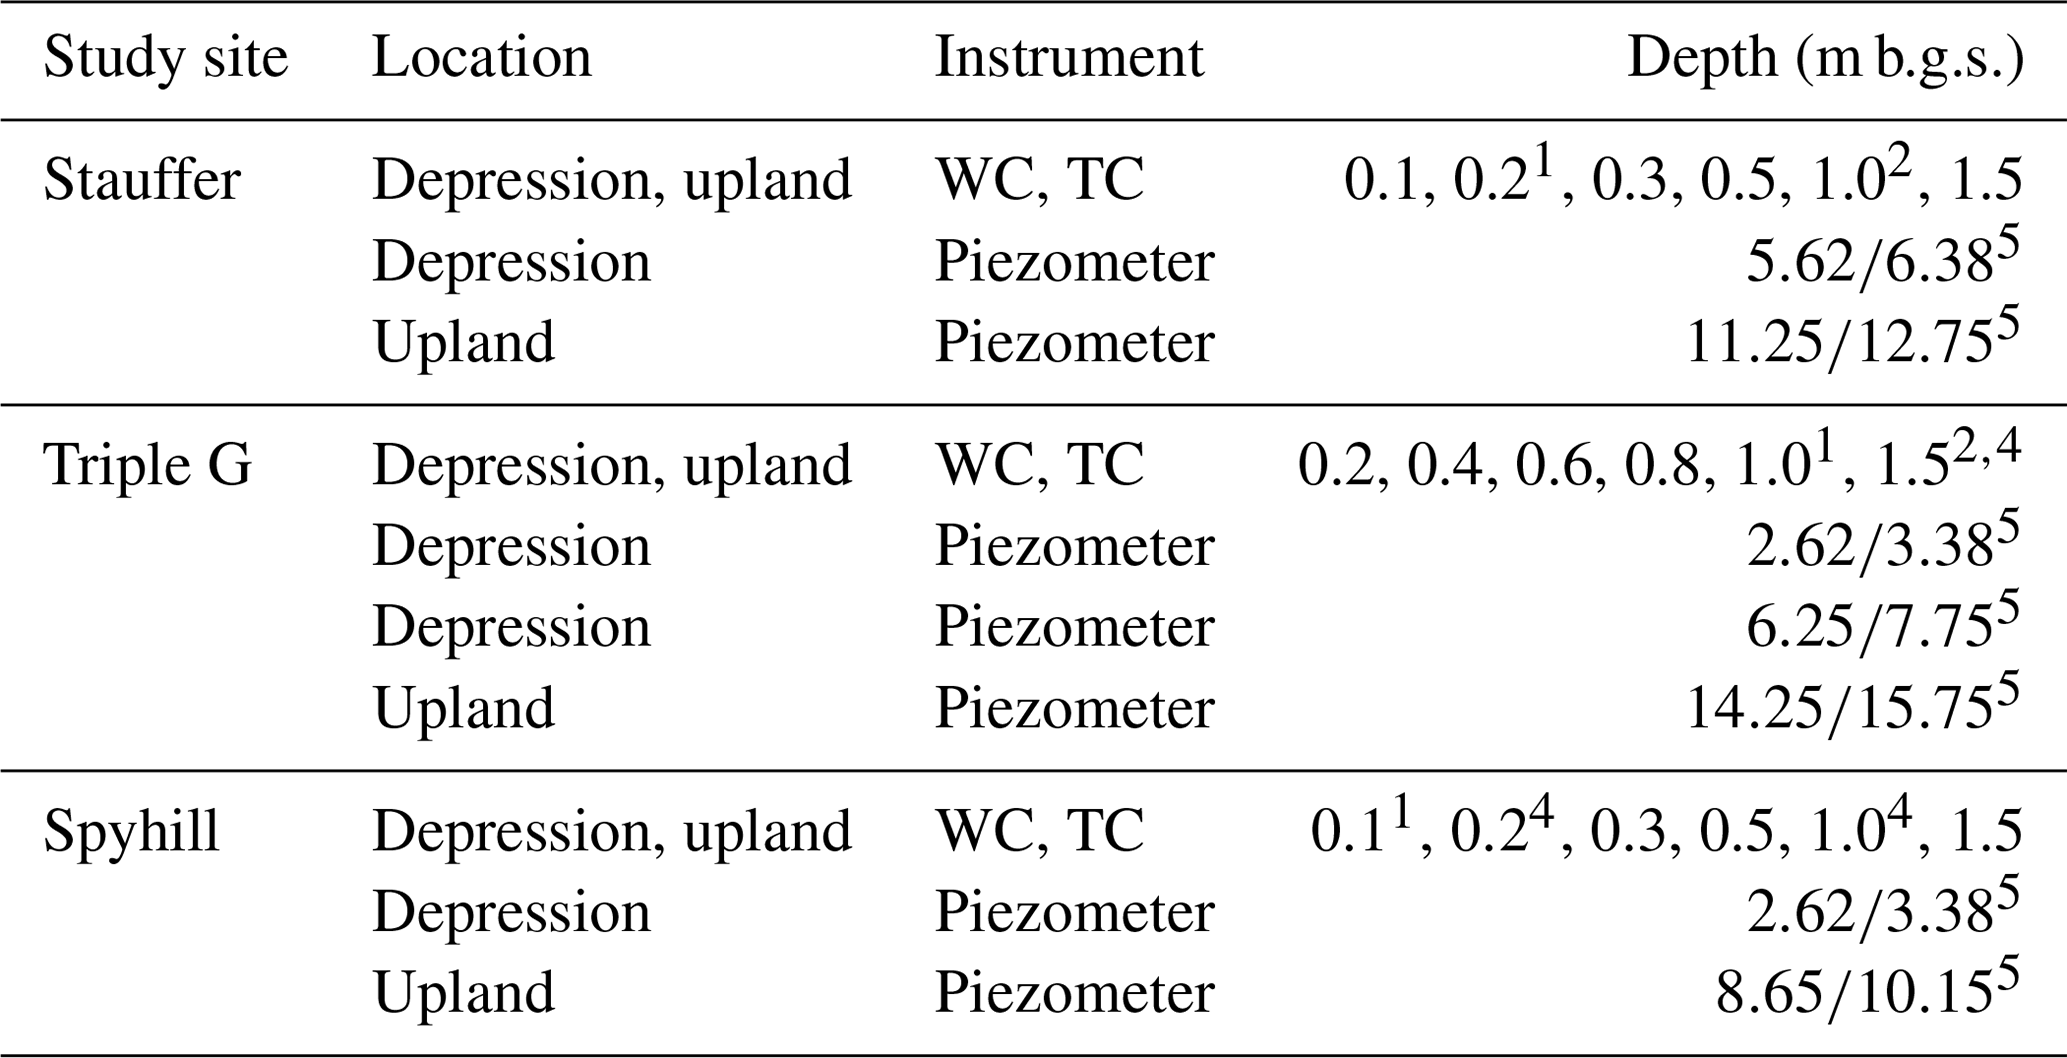
TC – thermocouple. WC – soil moisture probe. m b.g.s. – metres below the ground surface. Superscript 1 refers to a damaged upland TC. Superscript 2 refers to a damaged depression TC. Superscript 3 refers to a damaged upland WC. Superscript 4 refers to a damaged depression WC. Superscript 5 refers to numbers in the depth column for piezometers representing the screen top and bottom depths, respectively.
Time-domain reflectometry (TDR) probes (connected with SDMX multiplexers, Campbell Scientific) were used to estimate unfrozen soil moisture under the uplands and depressions at the Stauffer and Spyhill sites and in the depression at Triple G. Similar to Seyfried and Murdock (1996), the empirical equation of Topp et al. (1980) was used to calculate liquid soil moisture from the apparent bulk dielectric constant, and laboratory testing confirmed the accuracy of this approach in comparison to more physically based dielectric mixing models (Pittman et al., 2019). The upland soil pit at Triple G utilized capacitance probes (Stevens, HydraProbe II) to measure liquid soil moisture, which were individually calibrated following the procedure outlined by Hayashi et al. (2010) using co-located TDR probes that were manually measured with a portable TDR unit (Soil Moisture Equipment, TRASE). Soil temperatures at corresponding depths were measured by Type T thermocouples. All vadose zone data were recorded at hourly or half-hourly intervals using data loggers (Campbell Scientific, CR1000, 10X, and 23X). A number of thermocouples and TDR probes were permanently damaged and were excluded from any analysis (Table 1). Additionally, several TDR probes malfunctioned during winter and early spring at the SE2 depression at Stauffer, and the corresponding data were excluded from the analysis. Soil core samples (5 cm diameter by 5 cm length) from the sites were used to determine the porosity distribution at various depth intervals throughout the soil profile (Table 2). A variety of methods (single-ring infiltrometer, Guelph permeameter, and falling-head permeameter on soil core samples) were also used to determine the saturated hydraulic conductivity (Ksat) of unfrozen soil and surficial sediments at various depths at each site (Table 2).
Table 2Measurements of soil porosity and unfrozen saturated hydraulic conductivity (Ksat) at various depths at the study sites.
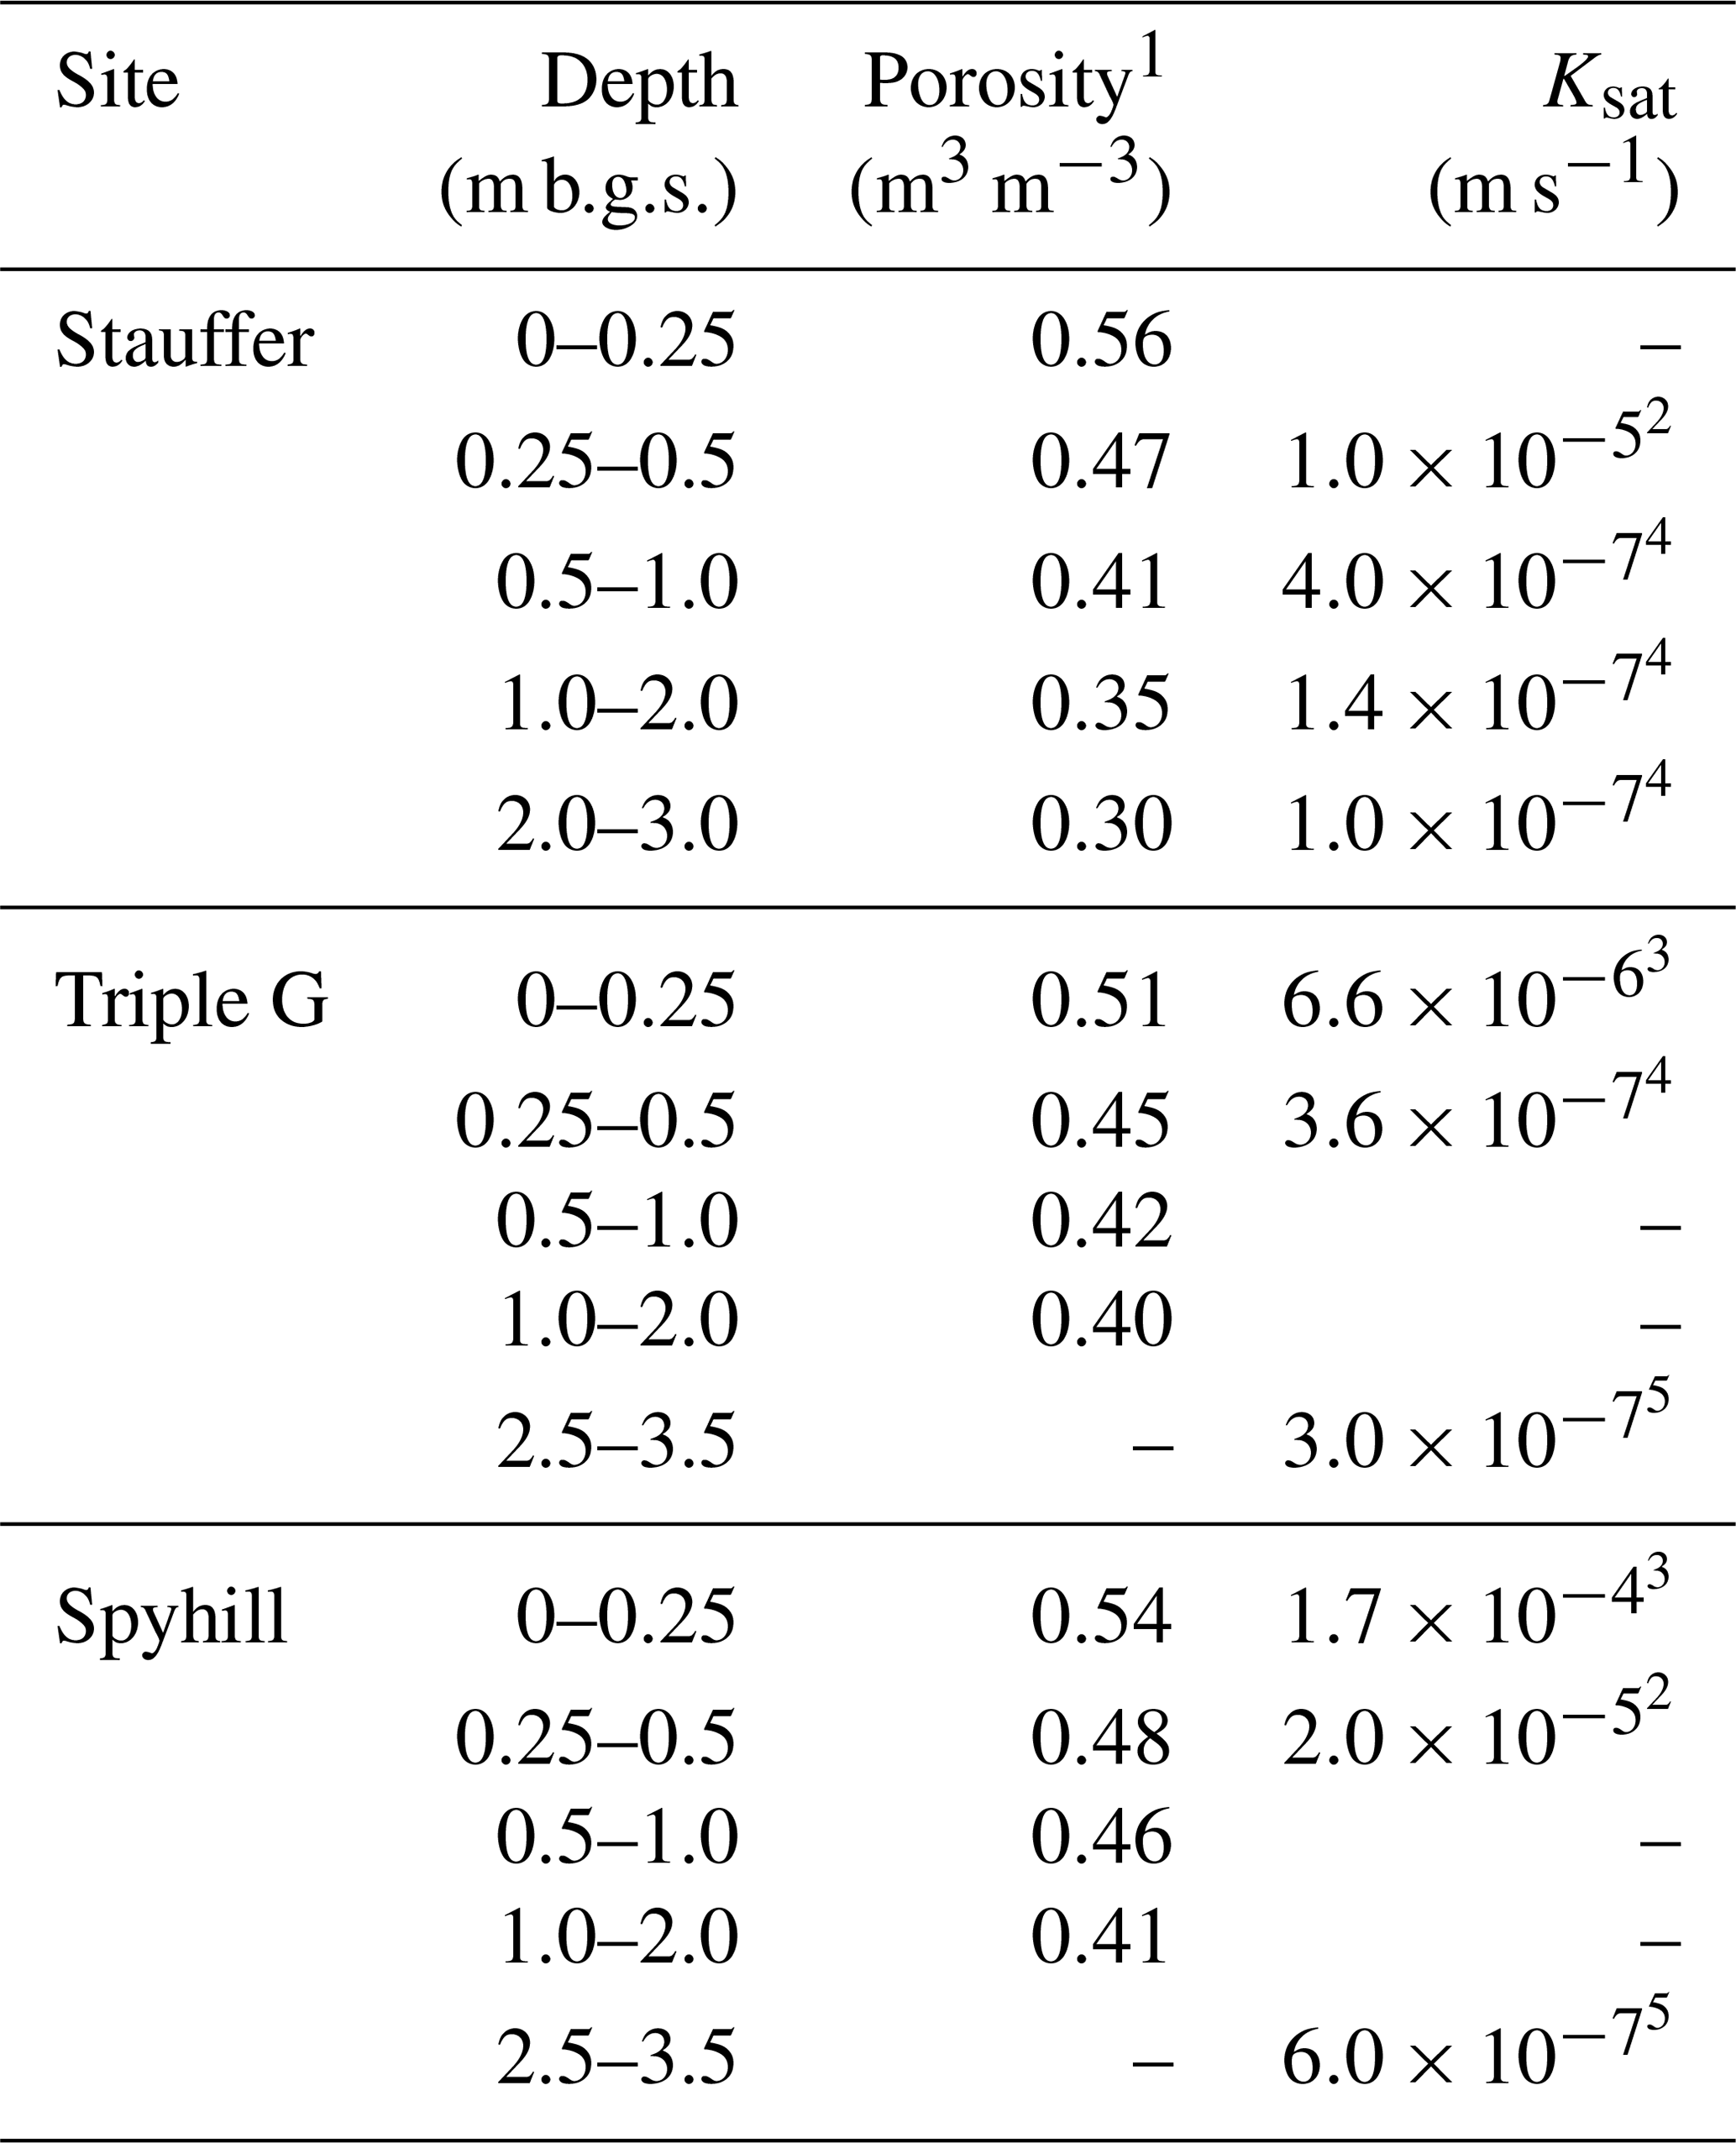
m b.g.s. – metres below the ground surface. Superscript 1 refers to porosity reported as the average of soil rings (5 cm ×5 cm) and maximum soil moisture values from TDR probes. A minimum of four soil rings were used when estimating porosity. Superscript 2 refers to measurements with the Guelph permeameter. Superscript 3 refers to measurements with the single-ring infiltrometer. Superscript 4 refers to measurements by the falling-head permeameter on a minimum of three soil rings and reported as the geometric mean. Superscript 5 refers to measurements by slug tests on piezometers.
Vertically nested piezometers, installed in 2014, were used to monitor groundwater levels beneath the depression and uplands. Only results from the shallowest piezometers are shown in this study. Details of screen lengths and depths are included in Table 1. Water levels in piezometers were recorded by pressure transducers every 30 min (Solinst Levelogger 3001; In-Situ miniTROLL). Additionally, manual water level measurements were performed on irregular intervals to calibrate transducers and ensure no instrument drift. Ksat was estimated from slug tests (Hvorslev, 1951) performed on the piezometers where possible (Table 2). At the SE2 depression, a piezometer was installed with its screened interval at 3 m below the ground surface, but the water table was generally around 5 m below the ground surface. As such, the piezometer remained dry and could not be used for this study. Thus, no slug test was performed at the depth directly below the frost zone (i.e. 2–3 m), and laboratory permeameter results from soil core samples were used to determine Ksat (Table 2). It should be noted that permeameters tend to underestimate field-scale Ksat values compared to slug tests (Schulze-Makuch et al., 1999).
3.3 Snowmelt event water balances
Water balance calculations were used to assess the significance of the various water flow pathways and partitioning of snowmelt at the ground surface over individual snowmelt events. In order to close the water balance over each melt event, only snowmelt events in which complete depletion of the snowpack occurred were utilized. This allowed the amount of infiltrated water to be estimated as the residual of the water balance.
where I is infiltration, ΔSWE is change in snow water equivalent over the melt event as estimated from snow surveys, P is precipitation from the date of the last snow survey to the end of the snowmelt event, Ro is the runoff estimated from the change in ponded volume within depressions, and Ev is vapour flux (i.e. sublimation, evapotranspiration, and/or condensation) measured by the eddy-covariance system. As noted previously, estimating Ro using the accumulation of water within depressions can lead to an overestimation of I under uplands by underestimating runoff that infiltrates in the depression prior to observable ponding. But due to a corresponding underestimation of I in the depression, the catchment-wide I estimate is correct. All components are reported in millimetres (mm).
Air temperature dynamics were similar at all study sites, showing consistent midwinter periods when air temperatures rose above 0 ∘C. We will focus on individual warming events when snowmelt occurred: midwinter warming events (referred to as “MW”) and spring snowmelt (referred to as “Spring”). Soil freeze–thaw conditions at the study sites are classified in terms of three soil temperature states designated as frozen (soil temperature at all depths within the frost zone is below −0.5 ∘C), partially frozen (at least one soil temperature sensor within the frost zone is between −0.5 and 0.5 ∘C), and thawed (all soil temperature probes within the frost zone above are 0.5 ∘C). The frost zone here is defined as a seasonally frozen part of the soil profile and extends from the surface to approximately 1 m depth.
4.1 Stauffer site
The first midwinter snowmelt event (MW1) occurred on 17 January (Fig. 3a). At the upland position, soil moisture and temperature promptly responded to the warming with signals propagating to a depth of 1 m (Fig. 3b and c), suggesting some infiltrated water reached soil below the frost zone. The event is followed by simultaneous decreases in soil temperatures and liquid moisture above 1 m depth, consistent with the refreezing of infiltrated water in the frost zone. The snow cover depletion was not complete during MW1 at this site, so the water balance could not be closed, and no infiltration ratio was calculated. At the same time, the absence of ponding and limited soil moisture response in the depression (Fig. 4a and d) points to a runoff ratio of zero.
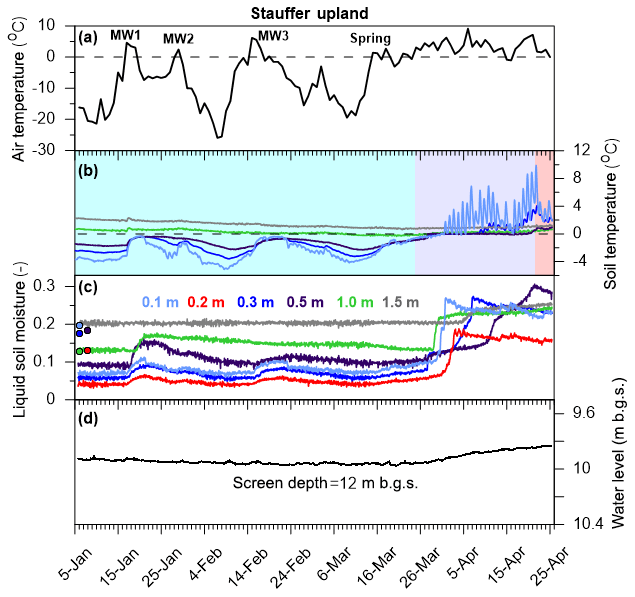
Figure 3Temporal variability of hydrologic variables during the monitoring period for the Stauffer upland location showing (a) the average daily temperature and the identification of snowmelt events; (b) soil temperatures; (c) liquid soil moisture, with pre-freezing values shown as circles; and (d) the groundwater level measured in piezometers, with the screen depth indicating the midpoint of the screen interval. In panel (b), blue shading indicates frozen ground, purple indicates partially frozen ground, and red indicates unfrozen ground.
The melt event MW2 occurred on 31 January but was very brief and resulted in only minor thermal and moisture responses under both landscape positions. The MW3 event occurred on 16 February and caused complete snow cover depletion on uplands and ponding in the depression (Fig. 4b). Water balance components for this event are shown in Table 3. The freezing of the pond surface prevented observations of the pond recession. However, an air-filled space was observed beneath the ice on 3 March, indicating that all unfrozen water had infiltrated. Depression ponding during MW3 was associated with sharp increases in liquid soil moisture at depths up to 1.5 m (i.e. below the frost zone) followed by a rise in the groundwater level (Fig. 4d and e). These soil moisture responses below the frost zone occurred just before temperatures in the frozen zone reached 0 ∘C (Fig. 4c), indicating that pore ice was still present in the frost zone when recharge occurred. After the MW3 event, the decrease in liquid moisture at depths of up to 0.3 m with soil temperatures remaining at 0 ∘C (Fig. 4c) is consistent with the refreezing of previously infiltrated water.
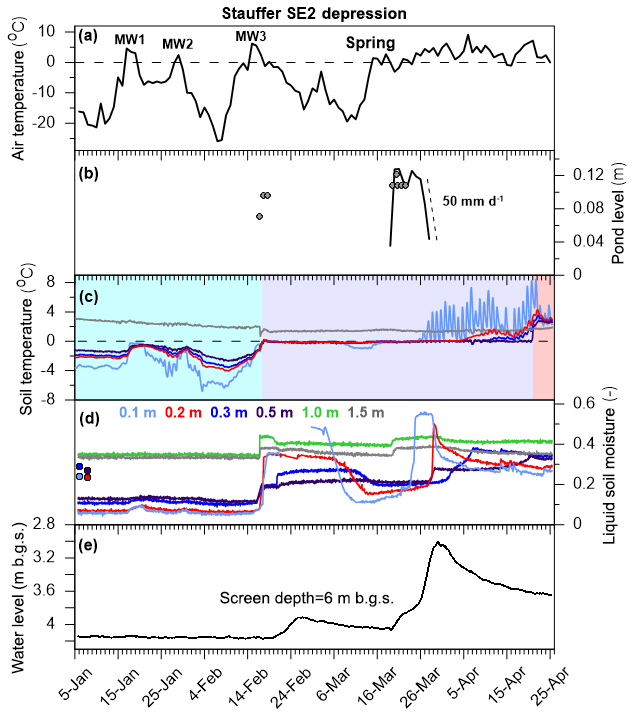
Figure 4Temporal variability of hydrologic variables during the monitoring period for depression SE2 at Stauffer showing (a) the average daily temperature and the identification of snowmelt events; (b) the depression pond level, with grey circles indicating manual reading from snow gauges, the black line indicating the pond depth measured by a pressure transducer, and the dashed line indicating the recession rate during the Spring snowmelt event; (c) soil temperatures; (d) liquid soil moisture, with pre-freezing values shown as circles; and (e) the groundwater level measured in piezometers, with the screen depth indicating the midpoint of the screen interval. In panel (b), blue shading indicates frozen ground, purple indicates partially frozen ground, and red indicates unfrozen ground.
Table 3Water balance components for individual snowmelt events at the study sites.
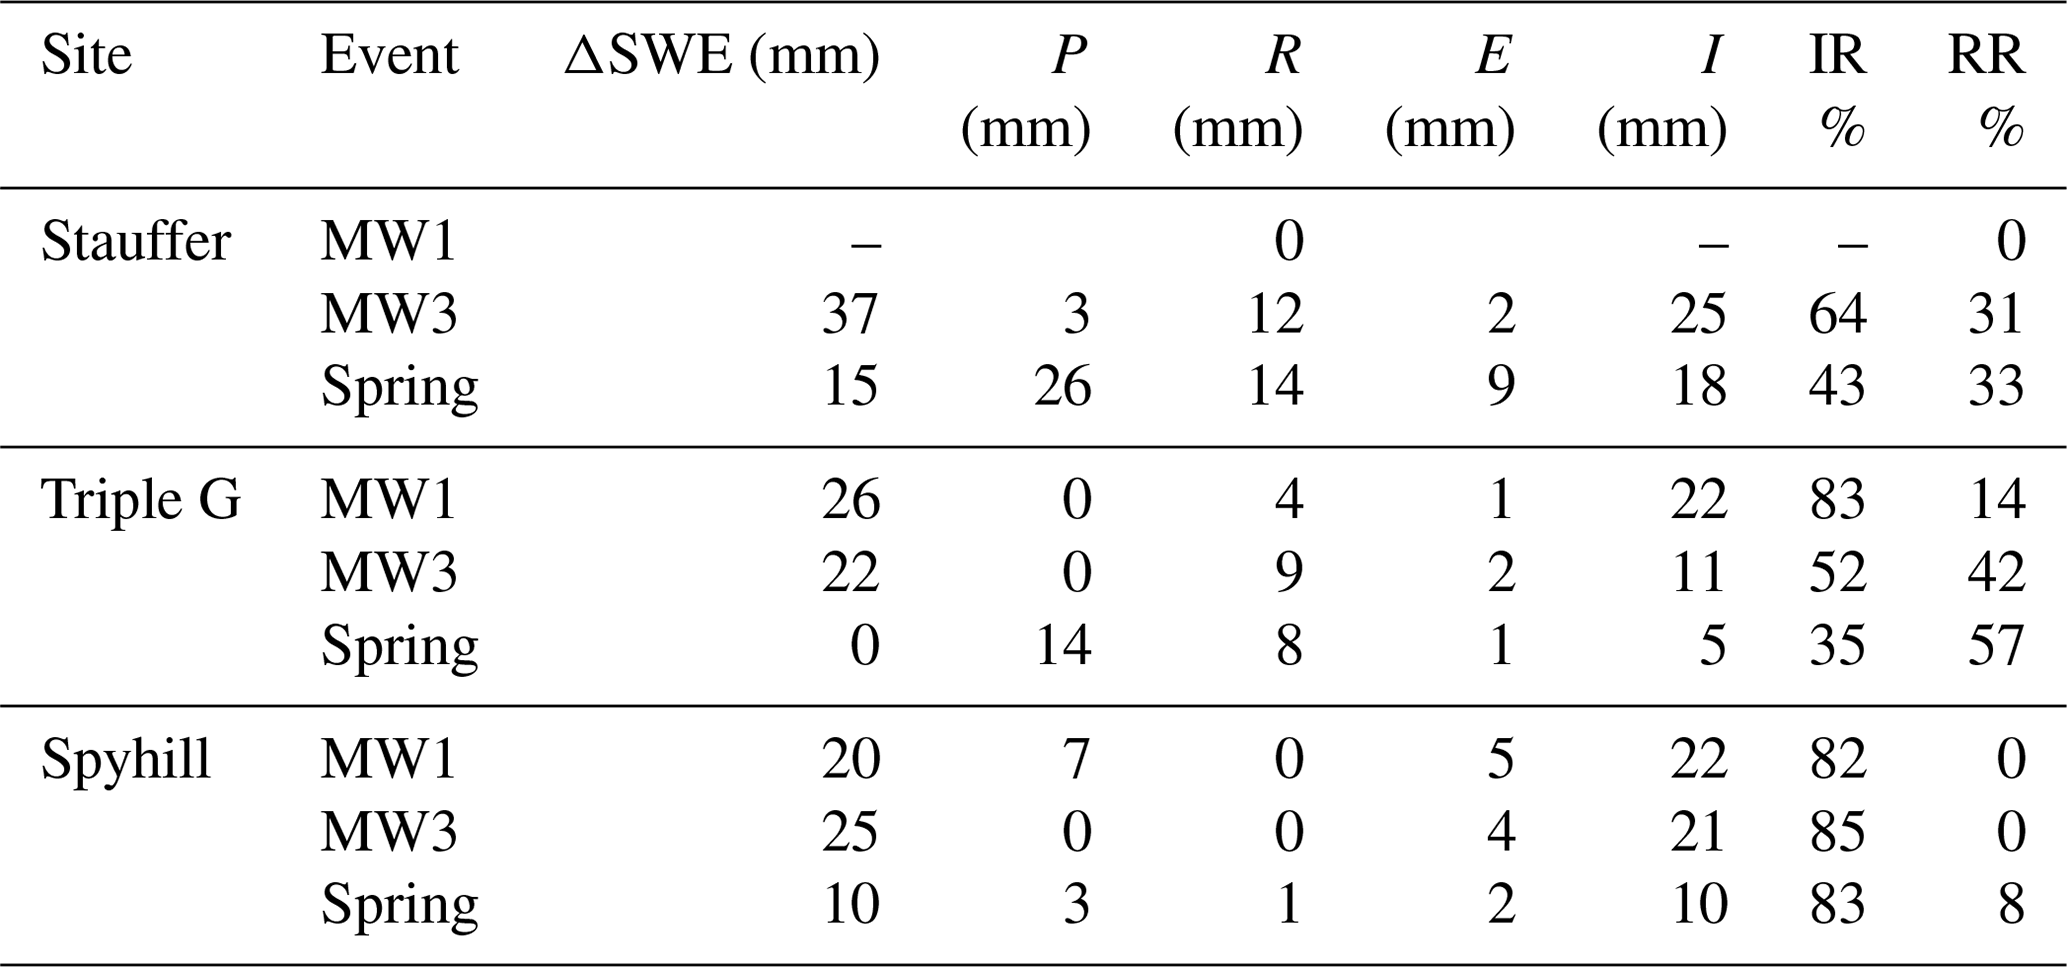
IR – infiltration ratio. RR – runoff ratio.
The Spring snowmelt event occurred on 21 March and again resulted in complete snow cover depletion and runoff ponding in the depression (Fig. 4b). Water balance calculations for this event showed an increased runoff ratio compared to MW3 (Table 3). Concurrent with ponding (21 March), the soil moisture increased below the frost zone (1.0 and 1.5 m) along with a rise in groundwater levels, indicating that meltwater was infiltrating even though pond levels remained stable (Fig. 4d and e). Soil water contents in the frost zone increased before the soil temperatures responded (at the same depths) due to the “zero-degree” curtain effect (Fig. 4c and d), in which latent heat transfer prevented soil temperatures from rising above 0 ∘C until pore ice had completely melted. Soil frost was therefore still present when recharge occurred. Non-sequential wetting was also observed as soil moisture and the groundwater level increased below the frost zone despite little-to-no soil moisture response at 0.1 to 0.5 m depths (Fig. 4d), which were still partially frozen (Fig. 4c). The pond water level recession began on 26 March at a rate of 50 mm d−1 ( m s−1). The geometric mean of Ksat for soil samples at depths of 1.0–2.5 m measured with core permeameters was m s−1 (Table 2). Considering that core permeameter tests tend to underestimate field-scale Ksat values, the pond recession rate is comparable to the Ksat value of the subsoil beneath the frost zone under the assumption that ponded infiltration takes place under a unit hydraulic gradient. The ground was still partially frozen by the time all ponded water infiltrated and remained so until the complete ground thaw on 20 April, 30 d after the Spring recharge event began (Fig. 4c).
The ground beneath the upland remained frozen during all MW events (Fig. 3b), with infiltrated water refreezing between events (Fig. 3c), and it did not completely thaw until 22 April. Time-lapse cameras showed that there was complete snow cover depletion by 24 March, indicating that all snowmelt occurred while the ground was still frozen, and the frost thickness was approximately 1 m (Fig. 3b). During the Spring event, all upland soil moisture sensors showed increases in soil moisture relative to pre-freezing conditions. A non-sequential response was observed as the 1 m sensor showed an increase prior to shallow sensors (Fig. 3c). There was a slight increase in the hydraulic head beneath the upland (Fig. 3d), but this rise is interpreted as a response due to groundwater mound formation under the depression causing lateral flow to adjacent uplands.
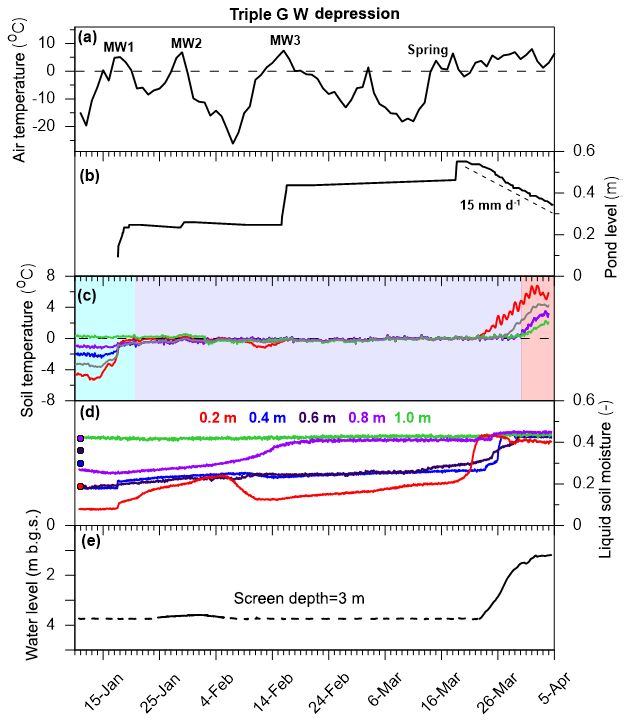
Figure 5Temporal variability of hydrologic variables during the monitoring period for depression W at Triple G showing (a) the average daily temperature and the identification of snowmelt events; (b) the depression pond level measured on snow gauges using time-lapse cameras and the dashed line indicating the recession rate during the Spring snowmelt event; (c) soil temperatures; (d) liquid soil moisture, with pre-freezing values shown as circles; and (e) the groundwater level measured in piezometers with the screen depth indicating the midpoint of the screen interval. In panel (b), blue shading indicates frozen ground, purple indicates partially frozen ground, and red indicates unfrozen ground.
4.2 Triple G site
Runoff and ponding in depression W occurred during all four warming events (Fig. 5b). Unlike Stauffer, visual inspection showed that the ponded water in the depression completely froze after each ponding event, and the pond water level did not decline between events (Fig. 5b). Complete snowpack depletion on the uplands during the MW1, MW3, and Spring events allowed the water balance to be closed. Calculations show that each subsequent melt event had an increase in runoff ratio (Table 3).
Liquid soil moisture at depths from 0.2 to 0.8 m under the depression gradually increased between events MW1 and MW2 (Fig. 5d) along with a slight response in the groundwater level in the piezometer which was dry prior to MW1 (Fig. 5e), indicating some infiltration had taken place. After MW2, liquid soil moisture at 0.2 m decreased simultaneously with a temperature decrease to below 0 ∘C, consistent with refreezing of infiltrated water. After MW3, liquid soil moisture at 0.2 m increased gradually, but no event-specific changes in liquid soil moisture and soil temperature occurred below that depth (Fig. 5d) despite the rise in the pond level (Fig. 5b). This suggests little infiltration in the depression occurred during this event due to the refreezing of meltwater at 0.2 m after MW2.
The ponded water level recession started on 22 March at an average rate of 15 mm d−1 ( m s−1) (Fig. 5b), which was the same order of magnitude as the Ksat value of the subsoil at 3 m depth (beneath the frost zone) of m s−1 measured by slug tests (Table 2). Groundwater recharge occurred on 24 March (Fig. 5e) and coincided with the thawing of the top 0.2 m of the soil while the soil was partially frozen between 0.4–1.0 m depth (Fig. 5c). The pond recession rate did not change once the soil thawed completely on 28 March (i.e. the infiltration rate during partially frozen ground conditions was the same as the infiltration rate during unfrozen conditions), with approximately 45 % of the water in the pond infiltrated before the soil had completely thawed. After 9 April, when the water level in the piezometer reached the ground surface of the depression, the pond recession rate slowed to 6.5 mm d−1 ( m s−1) (data not shown), which was similar to the Ksat value of m s−1 measured by slug tests on the sediments at approximately 6 m depth. From 3 April, the hydraulic head under depression W remained stable during pond recession (Fig. 5e).
On several occasions, time delays were observed between snow cover depletion in the uplands and the corresponding pond level rise in the depression (Fig. 6). For example, during MW1, most snowmelt occurred on 17 January, and only lower parts of the slopes retained snow by the morning of 18 January. Pond levels increased throughout 18 January despite very limited change to the remaining snow-covered area. The largest time delay occurred during the Spring snowmelt event, when most snow cover disappeared on 14 and 15 March, while the pond level in the depression rose by ∼0.1 m on 18 March (Figs. 6c and S3). The other observed time delays were shorter (Figs. 6a and b and S1–S2 in the Supplement).
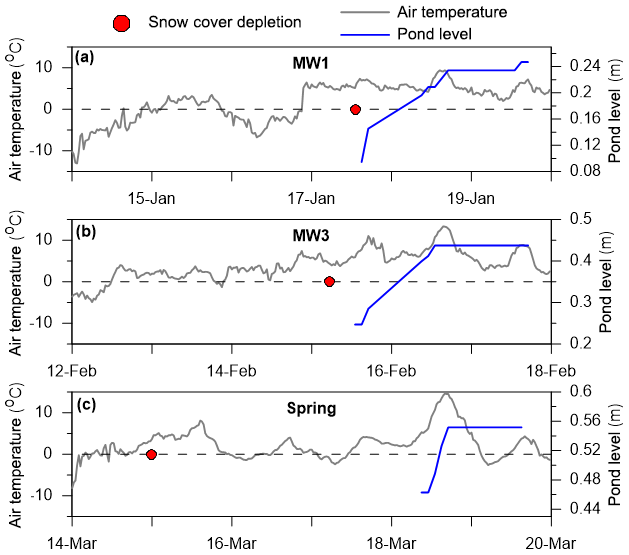
Figure 6Dates of snow cover depletion and the timing of pond level increases in depression W at Triple G. The red circles indicate the date by which most snow cover depletion occurred. Grey lines show the average hourly air temperature, and blue lines show the pond level.
The upland soil profile remained at least partially frozen during all melt events, with the soil thaw beginning on 20 March and the ground becoming completely thawed on 13 April (Fig. 7b). All upland soil moisture sensors up to 1 m depth showed increased soil moisture relative to pre-freezing conditions; however almost no change at 1.5 m indicated a lack of deep flow over the MW and Spring events. During the entire winter and spring snowmelt period, no groundwater response was observed under the upland (Fig. 7d).
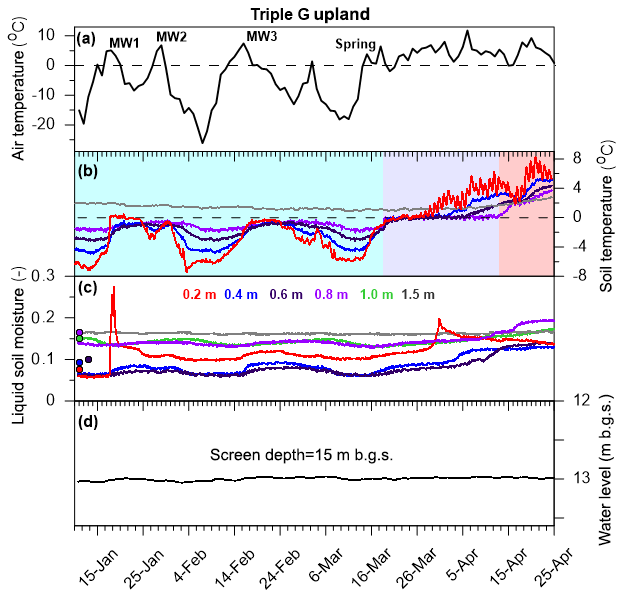
Figure 7Temporal variability of hydrologic variables during the monitoring period for the Triple G upland location showing (a) the average daily temperature and the identification of snowmelt events; (b) soil temperatures; (c) liquid soil moisture, with pre-freezing values shown as circles; and (d) the groundwater level measured in piezometers with the screen depth indicating the midpoint of the screen interval. In panel (b), blue shading indicates frozen ground, purple indicates partially frozen ground, and red indicates unfrozen ground.
4.3 Spyhill site
No ponding of runoff was observed in depression GP during midwinter snowmelt events. At the same time, complete snowpack depletion on the uplands during the MW1, MW3, and Spring events allowed for the calculation of the water balance (Table 3). Despite the infiltration of over 80 % of the snowmelt derived from the water balance during both MW events, soil moisture probes only showed responses to the MW3 event. During this event, the liquid soil moisture increased under the depression at depths up to 0.5 m (Fig. 8d), and it increased under the upland throughout the entire profile (Fig. 9c). Soil temperatures became negative at depths up to 0.5 m after the MW3 event under both the upland and depression (Figs. 8c, 9b) with corresponding drops in liquid soil moisture consistent with the refreezing of infiltrated water (Figs. 8d, 9c).
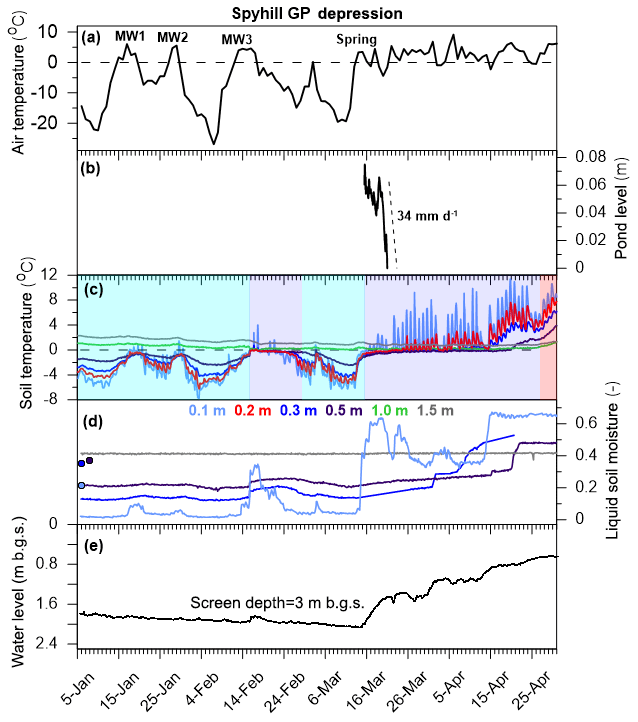
Figure 8Temporal variability of hydrologic variables during the monitoring period for Spyhill GP depression showing (a) the average daily temperature and the identification of snowmelt events; (b) the depression pond level measured by a pressure transducer, with the dashed lines indicating the recession rate during the Spring snowmelt event; (c) soil temperatures; (d) liquid soil moisture, with pre-freezing values shown as circles; and (e) the groundwater level measured in piezometers, with the screen depth indicating the midpoint of the screen interval. In panel (b), blue shading indicates frozen ground, purple indicates partially frozen ground, and red indicates unfrozen ground.
The Spring snowmelt event occurred on 15 March and caused ponding within depression GP (Fig. 8b). The ponding coincided with an increase in liquid soil moisture at 0.1 m depth (Fig. 8d) and onset of groundwater recharge (Fig. 8e). The liquid soil moisture at 0.3 and 0.5 m remained relatively stable until after complete pond infiltration. The recession of the pond level accelerated on 19 March, reaching a maximum rate of circa 34 mm d−1 ( m s−1), which approximated the Ksat value to be m s−1 at 3 m depth measured by slug tests (Table 2). The pond in the depression disappeared on 22 March, whereas complete ground thaw did not occur until a month later on 22 April, indicating all infiltration occurred before ground thaw.
The Spring event caused a simultaneous increase in liquid soil moisture throughout the upland profile (Fig. 9c); all sensors showed an increase relative to pre-freezing conditions, indicating percolation to a depth of at least 1.5 m during the Spring event. Time-lapse cameras confirmed that snow cover was fully depleted by 14 March, indicating all snowmelt occurred while the ground was still frozen. The groundwater level in the upland piezometer showed a change in an upward trend coinciding with complete thaw of the ground (Fig. 9d), which may be indicative of recharge under uplands and/or of groundwater mound formation under the depression causing lateral flow to adjacent uplands. The reason for the upward trend in the hydraulic head prior to ground thaw is attributed to a recharge event from the previous year, highlighting the piezometer's extremely long response time (on the order of months) (Fig. 10).
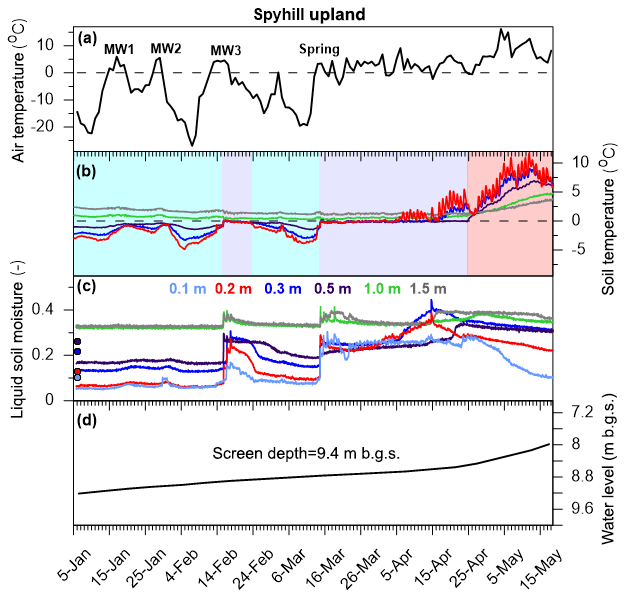
Figure 9Temporal variability of hydrologic variables during the monitoring period for the Spyhill upland location showing (a) the average daily temperature and identification of snowmelt events; (b) soil temperatures; (c) liquid soil moisture, with pre-freezing values shown as circles; and (d) groundwater level measured in piezometers, with the screen depth indicating the midpoint of the screen interval. In panel (b), blue shading indicates frozen ground, purple indicates partially frozen ground, and red indicates unfrozen ground.
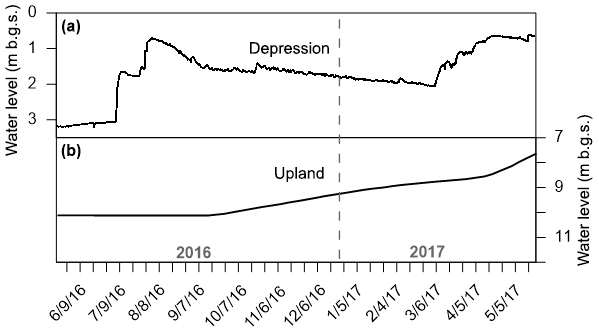
Figure 10Groundwater levels in piezometers at Spyhill (a) depression GP and (b) the upland from June 2016 to mid-May 2017. The grey dashed line indicates the beginning of 2017.
5.1 Snowmelt partitioning and runoff generation
The infiltrability of frozen soils strongly affects the partitioning of snowmelt into infiltration or runoff and, thus, the quantity of water available for groundwater recharge under depressions. Snowmelt event water balances (Table 3) show that the majority of the snowmelt was infiltrated under uplands despite the ground being frozen/partially frozen, as evident by temperatures within the frost zone remaining at or below 0 ∘C during all snowmelt events. In addition to frozen soil infiltrability, runoff generation at a given site also depends on snowmelt rates during a melt event; however some useful insight can be gained from comparing runoff ratios here with other studies. The snowmelt runoff ratios from all sites ranged between 0 % and 57 %, with a mean of 21 %. These values are lower than those reported by Hayashi et al. (1998) for a cultivated depression–upland catchment in the Canadian Prairies, who reported snowmelt runoff ratios ranging from 28 % to 60 % with an average of 43 %. The lower runoff ratios in this grassland study are expected as the lack of cultivation would allow for the formation of well-developed macropore networks and higher frozen soil infiltrability (van der Kamp et al., 2003; Bodhinayake and Si, 2004). In a more humid climate, Greenwood and Buttle (2018) reported average snowmelt runoff ratios for contrasting grassland and cultivated depression–upland catchments of 52 % and 72 %, respectively. The authors also attributed the lower runoff in grassland catchments to enhanced macropore flow.
Infiltration–runoff partitioning in frozen soils is strongly affected by the air-filled porosity and amount of unblocked preferential flow pathways in the upper tens of centimetres of the soil at the time of snowmelt (Gray et al., 2001) as well as the temperature of the frozen soil (Stähli et al., 1999). All sites in this study had the lowest runoff ratios during MW1, and MW events had lower runoff ratios than the Spring melt event (Table 3), although the increase at Stauffer between MW3 and Spring is very small and likely within measurement error. Dry frozen soils early in the winter would have a relatively high air-filled porosity and low ice content, and thus they would offer little obstruction to meltwater infiltration (Kane and Stein, 1983; Granger et al., 1984; van der Kamp et al., 2003). Macropores in this situation would be air filled and open for infiltration after freezing (Espeby, 1992). However, the refreezing of infiltrated water in the soil matrix and macropores near the infiltration source (i.e. ground surface) reduces infiltrability and flow-path connectivity due to pore blockage with ice (Stähli et al., 1996; Watanabe and Kugisaki, 2017). Consequently, soil temperatures remaining below 0 ∘C between MW events (Figs. 3b, 7b, 9b) and the associated refreezing of infiltrated water would reduce infiltrability and, thus, increase runoff during subsequent melt events. Such an effect likely contributed to the sequential increase in runoff ratios during melt events at the Stauffer and Triple G sites (Table 3). These observations of the refreezing of infiltrated meltwater are generally consistent with the “pre-fill” phase of the conceptual model of runoff generation in frozen soil proposed by Appels et al. (2018), in which the refreezing of initially infiltrated water is necessary to reduce infiltrability before runoff can occur. To the best of our knowledge, no other study has demonstrated the time sequencing of this infiltration–refreezing effect on enhancing subsequent runoff partitioning over multiple snowmelt events.
At Spyhill, no runoff was produced during MW events, and > 80 % of the snowmelt infiltrated under uplands over all events (Table 3). A possible explanation for the enhanced infiltration is that grasslands at Spyhill are ungrazed, in contrast to the other two sites. Grazing has been shown to compact the soil surface and reduce air-filled porosity and macroporosity in the uppermost 50 cm of the soil (Naeth et al., 1991). Grasses allowed to grow over multiple years also tend to have deeper rooting depths and macropore networks compared to grazed fields (Naeth et al., 1990a, b). Both these effects would increase the infiltrability and preferential flow paths within the frozen soil, resulting in higher infiltration ratios at Spyhill. The conversion of fields to ungrazed grasslands has also been shown to cause the drying out of prairie wetlands by drastically reducing snowmelt runoff due to the increased infiltration capacity of frozen soils (van der Kamp et al., 1999).
Observed delays between snowpack depletion and depression ponding (Fig. 6) suggest that preferential pathways can play an important role in runoff routing on a hillslope scale. Very dry soils at the Triple G site would allow near-surface macropores to remain open and connected, allowing subsurface flow along the topographical gradient from the upland to the depression. Following snowmelt depletion after each event, the ground under the upland remained frozen, and soil moisture probes below the frost zone showed no response (Fig. 7b and c). Groundwater levels showed no response (Figs. 5e and 7d), ruling out any groundwater upwelling to the depression surface. This indicates there must be a mechanism in the frozen soil that simultaneously perches infiltrated meltwater while also providing a pathway to transport it downslope. Shallow subsurface flow can be a major runoff mechanism in structured soils, where the presence of a low-permeability horizon underlying a more permeable layer causes a portion of vertically percolating water to be deflected laterally and transported downslope (Weiler et al., 2006; Chifflard et al., 2019). Macropore-rich soil horizons overlaying lower permeability soils or bedrock have been identified as an environment for this type of lateral subsurface flow (Whitson et al., 2004; Redding and Devito, 2010). At Triple G, the preferential pathways contributing to infiltration are probably interconnected at a shallow depth (0–0.2 m), as this is the zone with the highest density of macropores (Pittman et al., 2019). Macropores may provide a conductive subsurface pathway above a less conductive layer (in this case, frozen soil with less macropores). Thus, lateral subsurface flow or interflow, in addition to overland flow, can be a factor in snowmelt routing on prairie hillslopes.
5.2 Focused infiltration and preferential flow dynamics governing groundwater recharge
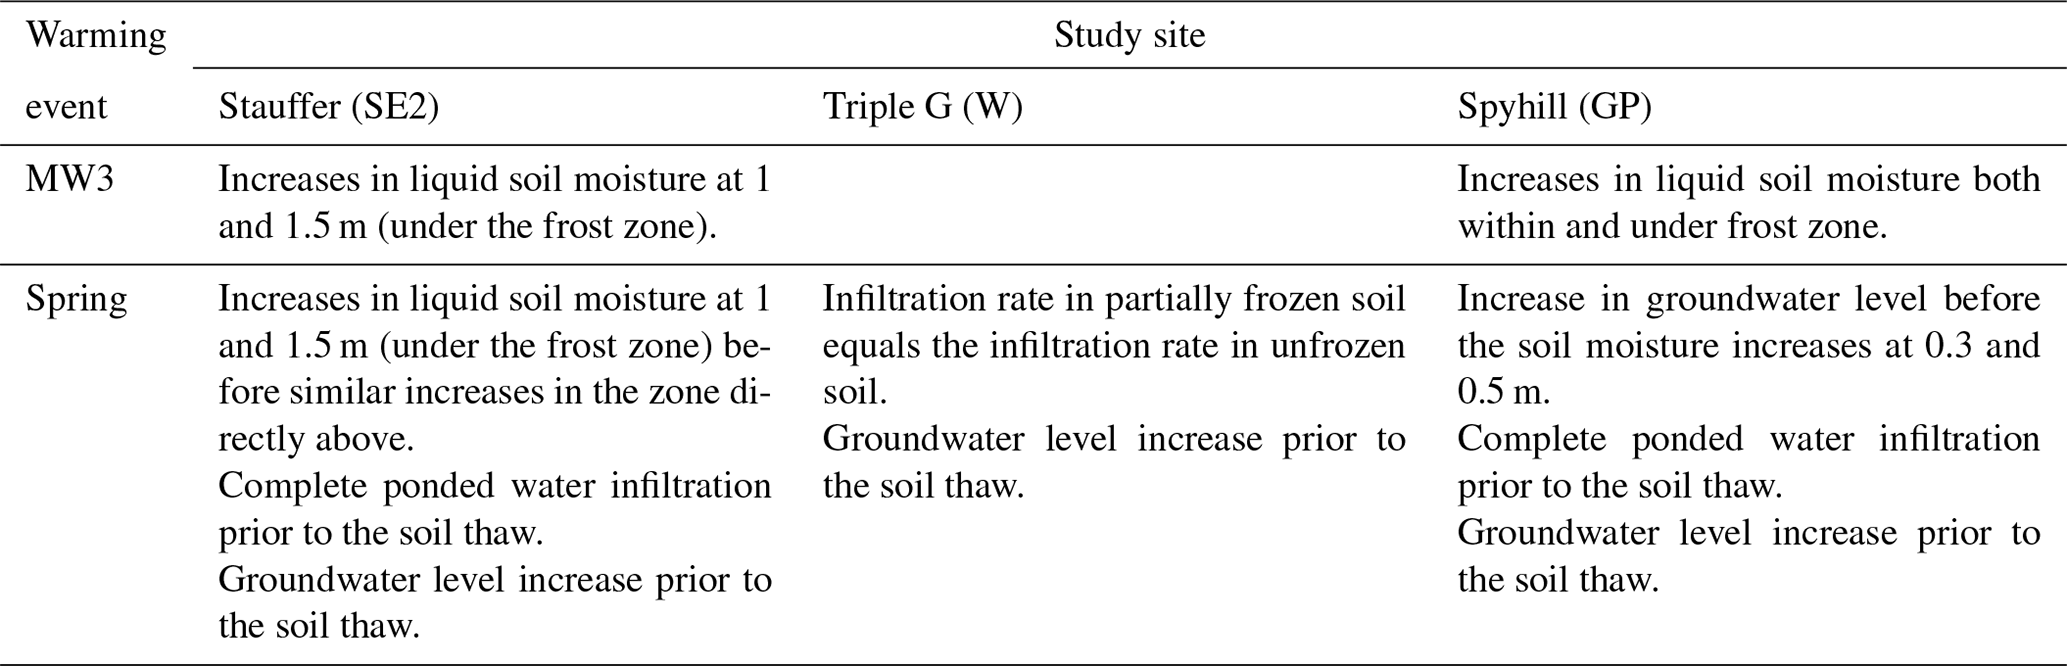
There were several observations linking infiltration within ponded depressions to preferential flow through the frozen ground (Table 4). At all sites during the Spring event, depression-focused infiltration and recharge began prior to complete ground thaw and occurred despite the presence of an approximately 1 m thick frost zone (Figs. 4, 5, 8). At Stauffer and Spyhill, 100 % of ponded water infiltration took place while the soil was partially frozen, while at Triple G, 45 % of the runoff collected in depression W infiltrated before complete ground thaw.
Table 4Observations of the preferential flow in frozen soil under depressions at the study sites.
The evidence for preferential flow paths includes the detection of non-sequential wetting (Allaire et al., 2009; Graham and Lin, 2011), indicated by the soil moisture or groundwater recharge responses during focused infiltration events (Table 4). These responses show that surface water bypassed the frost layer. Furthermore, this flow occurred when ponding began and near-surface (0.1–0.2 m) layers became saturated (Figs. 4d, 5d, 8d), consistent with other studies that concluded that near-saturated conditions in partially frozen topsoil during snowmelt can supply water to deeper macropores (e.g. Ishikawa et al., 2006; Scherler et al., 2010). Groundwater recharge events occurred when soil in the frost zone was still partially frozen, suggesting that the ponding of water and filling of the unfrozen pore space can activate preferential flow pathways and cause channelling of snowmelt to groundwater before the complete thawing of the soil profile.
Further evidence for a dominant role of preferential flow includes the relative independence of pond recession rates from soil frost conditions. A clear illustration of this can be seen at Triple G, where the pond infiltration rate remained steady as the soil transitioned from partially frozen to unfrozen (Fig. 5b), even though soil freezing is normally associated with a decrease in hydraulic conductivity by orders of magnitude for non-macroporous soils (Burt and Williams, 1976; Watanabe et al., 2013). At all sites pond recession rates were similar to the Ksat value of the subsoil, despite the presence of a 0.8–1.0 m thick layer of partially frozen soil. The infiltration rate in all cases was limited by the hydraulic conductivity of the layers beneath the frost zone, suggesting the existence of a mechanism facilitating rapid flow through the frost zone that is consistent with the presence of conductive macropores. This finding contradicts a previous study in cropped fields (Hayashi et al., 2003) that noted the pond infiltration rate was limited to the soil-thaw rate when soil frost was present, and it then increased to values similar to the subsoil Ksat value when unfrozen, giving rise to groundwater recharge only after complete ground thaw. The likely explanation for this inconsistency is that tillage in cropped fields destroyed shallow macropore networks that enable preferential flow through the frost zone (Schwen et al., 2011). Observations here indicate that when a macropore network is present, in addition to enhanced infiltration at the ground surface (van der Kamp et al., 2003), deeper percolation of meltwater and groundwater recharge can occur prior to ground thaw as well.
5.3 Hydrological implications of preferential flow in frozen soils
As shown above, preferential flow in frozen soils plays an important role in both vertical flow through the soil and the lateral transport of meltwater between topographical positions. Observations indicate that rates of ponded water infiltration into frozen soil are decoupled from the hydraulic conductivity of the frozen soil matrix and are largely dependent on the hydraulic conductivity of the soil beneath the frost zone. Such decoupling means that infiltration rates can routinely surpass the typically low hydraulic conductivity values of the frozen soil matrix. This enables large volumes of ponded water to infiltrate deeper in the soil profile relatively early in the spring season, before transpiration begins and when evaporation is still low. Thus, this initial recharge pulse through the frozen ground may escape the effects of evapotranspiration and shallow groundwater cycling and contribute disproportionately to deeper recharge. Recent studies investigating the isotopic nature of groundwater in aquifers across the Canadian Prairies have noted that the isotopic composition shows the prevalence of winter precipitation which has not been subject to significant evaporation (Stumpp and Hendry, 2012; Pavlovskii et al., 2018; Bam, 2018), even though ponded water in depressions (from snowmelt) will exhibit an evaporative signature later in spring (Pavlovskii et al., 2018). The preferential recharge of this early snowmelt infiltration shown here may be an important mechanism responsible for this phenomenon. Furthermore, by facilitating a reduction in ponded volume of depressions, preferential flow reduces the connectivity of ponds in depression-dominated catchments, thereby influencing “fill and spill” runoff routing and streamflow generation on a watershed scale (Shaw et al., 2012; Brannen et al., 2015).
Similarly, snowmelt infiltration (and, by extension, runoff generation) in the uplands appears to be controlled by an interplay between snowmelt inputs, soil temperature, and preferential flow dynamics, with the latter being controlled by the antecedent soil moisture and infiltration–refreezing history of previous snowmelt events. Uplands that remain frozen during snowmelt events cause the refreezing of infiltrated water, which reduces soil infiltrability and allows for greater runoff generation to depressions during later events. In addition, the observed delays between snowmelt and depression ponding indicates that subsurface flow is an important runoff mechanism on frozen hillslopes. How this process affects the timing and magnitude of runoff generation compared to overland flow in these environments (e.g. Coles and McDonnell, 2018) is unclear and warrants further investigation.
From a water quality perspective, preferential flow creates a pathway from the surface to groundwater that bypasses much of the soil matrix. Such bypass flow has the potential to facilitate transport of labile nutrients and surface-applied chemicals to groundwater during snowmelt (e.g. Grant et al., 2019). In contrast to preferential flow in unfrozen soils, there are limited opportunities for mass exchange with the frozen matrix, which can further reduce the filtering effect of the soil (Holten et al., 2018).
This study highlighted the effects of preferential flow in frozen soils and infiltration–refreezing mechanisms on the hydrologic functioning and winter water balance of prairie grasslands. Despite the ground remaining frozen throughout snowmelt events, infiltration into frozen soil was the major sink of snowmelt at all three sites, and this modulated the amount of runoff available for depression-focused recharge. In addition, focused infiltration and preferential flow in frozen soil enabled meltwater to bypass a portion of the soil profile and groundwater recharge prior to ground thaw. Field data suggested that the refreezing of infiltrated meltwater during midwinter snowmelt enhanced runoff generation in frozen grassland soils, highlighting the feedback effect of previous melt events on later snowmelt event partitioning. Time delays between snow cover depletion and ponding in depressions demonstrated that shallow subsurface flow, in addition to overland flow, can be an important runoff mechanism on frozen prairie hillslopes. Both of these flow paths may facilitate preferential mass transport to groundwater.
Midwinter snowmelt events are a regular occurrence in the Canadian Prairies and other seasonally frozen landscapes (Bayard et al., 2005; Sutinen et al., 2008; Pavlovskii et al., 2019b) and are projected to increase in frequency and magnitude due to climate change (Henry, 2008). Thus, a better understanding of the dynamics of subsurface processes in response to such meteorological forcing is required to predict the effects of melt events on water partitioning in cold regions. However, the coupled hydrodynamic mechanisms and thermal processes are still not clearly understood (Mohammed et al., 2018). Further research investigating preferential flow and soil freeze–thaw interactions is needed to understand how these processes will affect the winter water balance and cold-region hydrological processes under different land use and climate conditions.
The data used to calculate the values in Table 3 are available from the corresponding author upon reasonable request and are also available at the University of Calgary PRISM repository at http://hdl.handle.net/1880/111213 (Mohammed, 2019).
The supplement related to this article is available online at: https://doi.org/10.5194/hess-23-5017-2019-supplement.
AAM installed vadose zone instrumentation and piezometers at the study sites, collected data, processed and analyzed data (except eddy-covariance data), and wrote the paper. IP performed snow surveys and processed eddy-covariance data and provided recommendations and revisions to the paper prior to submission. EEC oversaw data collection and analysis and provided numerous recommendations and revisions to the paper prior to submission. MH installed weather stations at the study sites and provided recommendations and revisions to the paper prior to submission.
The authors declare that they have no conflict of interest.
This article is part of the special issue “Understanding and predicting Earth system and hydrological change in cold regions”. It is not associated with a conference.
The authors wish to thank Shelby Snow, Brandon Hill, and Polina Abdrakhimova for field assistance; Larry Bentley and Saskia Noorduijn for helpful discussions; and Alberta Innovates, Alberta Environment and Parks, the Alberta Energy Regulator of the Alberta Geological Survey, and the Natural Sciences and Engineering Research Council of Canada for funding support.
This research has been supported by Alberta Innovates (grant no. AI2075) and the Natural Science and Engineering Research Council of Canada (grant no. 03822-2017).
This paper was edited by Sean Carey and reviewed by Andrew Ireson and one anonymous referee.
Allaire, S. E., Roulier, S., and Cessna, A. J.: Quantifying preferential flow in soils: A review of different techniques, J. Hydrol., 378, 179–204, 2009.
Appels, W. M., Coles, A. E., and McDonnell, J. J.: Infiltration into frozen soil: From core-scale dynamics to hillslope-scale connectivity, Hydrol. Process., 32, 66–79, 2018.
Baker, J. M. and Spaans, E. J. A.: Mechanics of meltwater movement above and within frozen soil, in: International Symposium on Physics, Chemistry, and Ecology of Seasonally Frozen Soils, edited by: Iskander, I. K., Wright, E. A., Radke, J. K., Sharratt, B. S., Groenevelt, P. H., and Hinzman, L. D., US Army Cold Regions Research and Engineering Laboratory, Fairbanks, AK, 31–36, 1997.
Bam, E. K.: Understanding hydrological processes and water fluxes linking wetland ponds and groundwater in the Prairie Pothole Region, Doctoral dissertation, University of Saskatchewan, 2018.
Bayard, D., Stähli, M., Parriaux, A., and Flühler, H.: The influence of seasonally frozen soil on the snowmelt runoff at two Alpine sites in southern Switzerland, J. Hydrol., 309, 66–84, 2005.
Berthold, S., Bentley, L. R., and Hayashi, M.: Integrated hydrogeological and geophysical study of depression-focused groundwater recharge in the Canadian prairies, Water Resour. Res., 40, W06505, https://doi.org/10.1029/2003WR002982, 2004.
Bodhinayake, W. and Si, B. C.: Near-saturated surface soil hydraulic properties under different land uses in the St Denis National Wildlife Area, Saskatchewan, Canada, Hydrol. Process., 18, 2835–2850, 2004.
Brannen, R., Spence, C., and Ireson, A.: Influence of shallow groundwater–surface water interactions on the hydrological connectivity and water budget of a wetland complex, Hydrol. Process., 29, 3862–3877, 2015.
Burt, T. P. and Williams, P. J.: Hydraulic conductivity in frozen soils, Earth Surf. Proc. Land., 1, 349–360, https://doi.org/10.1002/esp.3290010404, 1976.
Chifflard, P., Blume, T., Maerker, K., Hopp, L., van Meerveld, I., Graeff, T., Gronz, O., Hartmann, A., Kohl, B., Martini, E., and Reinhardt-Imjela, C.: How can we model subsurface stormflow at the catchment scale if we cannot measure it?, Hydrol. Process., 33, 1378–1385, https://doi.org/10.1002/hyp.13407, 2019.
Coles, A. E. and McDonnell, J. J.: Fill and spill drives runoff connectivity over frozen ground, J. Hydrol., 558, 115–128, 2018.
Demand, D., Selker, J. S., and Weiler, M.: Influences of macropores on infiltration into seasonally frozen soil, Vadose Zone J., 18, 180147, https://doi.org/10.2136/vzj2018.08.0147, 2019.
Espeby, B.: Coupled simulations of water flow from a field-investigated glacial till slope using a quasi-two-dimensional water and heat model with bypass flow, J. Hydrol., 131, 105–132, 1992.
Fenton, M. M., Waters, E. J., Pawley, S. M., Atkinson, N., Utting, D. J., and Mckay, K.: Digital Data 2013–0002 Surficial geology of Alberta, 1:1,000,000 scale (GIS data, polygon features), available at: https://ags.aer.ca/publications/DIG_2013_0002.html (last access: 6 August 2018), 2013.
Flury, M., Flühler, H., Jury, W. A., and Leuenberger, J.: Susceptibility of soils to preferential flow of water: A field study, Water Resour. Res., 30, 1945–1954, 1994.
French, H. and Binley, A.: Snowmelt infiltration: monitoring temporal and spatial variability using time-lapse electrical resistivity, J. Hydrol., 297, 174–186, 2004.
Gerke, H. H., Koszinski, S., Kalettka, T., and Sommer, M.: Structures and hydrologic function of soil landscapes with kettle holes using an integrated hydropedological approach, J. Hydrol., 393, 123–132, 2010.
Graham, C. B. and Lin, H. S.: Controls and frequency of preferential flow occurrence: A 175-event analysis, Vadose Zone J., 10, 816–831, 2011.
Granger, R. J., Gray, D. M., and Dyck, G. E.: Snowmelt infiltration to frozen prairie soils, Can. J. Earth Sci., 21, 669–677, 1984.
Grant, K. N., Macrae, M. L., Rezanezhad, F., and Lam, W. V.: Nutrient leaching in soil affected by fertilizer application and frozen ground, Vadose Zone J., 18, 180150, https://doi.org/10.2136/vzj2018.08.0150, 2019.
Gray, D. M., Toth, B., Zhao, L., Pomeroy, J. W., and Granger, R. J.: Estimating areal snowmelt infiltration into frozen soils, Hydrol. Process., 15, 3095–3111, https://doi.org/10.1002/hyp.320, 2001.
Greenwood, W. J. and Buttle, J. M.: Land cover controls on depression-focused recharge on the Oak Ridges Moraine, southern Ontario, Canada Hydrol. Process., 32, 1909–1926, 2018.
Hayashi, M.: The cold vadose zone: Hydrological and ecological significance of frozen-soil processes, Vadose Zone J., 12, https://doi.org/10.2136/vzj2013.03.0064, 2013.
Hayashi, M. and Farrow, C. R.: Watershed-scale response of groundwater recharge to inter-annual and inter-decadal variability in precipitation (Alberta, Canada), Hydrogeol. J., 22, 1825–1839, 2014.
Hayashi, M., van der Kamp, G., and Rudolph, D. L.: Water and solute transfer between a prairie wetland and adjacent uplands, 1. Water balance, J. Hydrol., 207, 42–55, 1998.
Hayashi, M., van der Kamp, G., and Schmidt, R.: Focused infiltration of snowmelt water in partially frozen soil under small depressions, J. Hydrol., 270, 214–229, https://doi.org/10.1016/S0022-1694(02)00287-1, 2003.
Hayashi, M., Jackson, J. F., and Xu, L.: Application of the Versatile Soil Moisture Budget model to estimate evaporation from prairie grassland, Can. Water Resour. J., 35, 187–208, 2010.
Henry, H. A.: Climate change and soil freezing dynamics: historical trends and projected changes, Climatic Change, 87, 421–434, 2008.
Holten, R., Bøe, F. N., Almvik, M., Katuwal, S., Stenrød, M., Larsbo, M., Jarvis, N., and Eklo, O. M.: The effect of freezing and thawing on water flow and MCPA leaching in partially frozen soil, J. Contam. Hydrol., 219, 72–85, 2018.
Hvorslev, M. J.: Time lag and soil permeability in groundwater observations. Corps of Engineers, US Army, Waterways Experiment Station, Bull, No. 36, 1951.
Ireson, A. M., van der Kamp, G., Ferguson, G., Nachshon, U., and Wheater, H. S.: Hydrogeological processes in seasonally frozen northern latitudes: understanding, gaps and challenges, Hydrogeol. J., 21, 53–66, 2013.
Ishikawa, M., Zhang, Y., Kadota, T., and Ohata, T.: Hydrothermal regimes of the dry active layer. Water Resour. Res., 42, W04401, https://doi.org/10.1029/2005WR004200, 2006.
Kane, D. L. and Stein, J.: Water movement into seasonally frozen soils, Water Resour. Res., 19, 1547–1557, 1983.
Lundberg, A., Ala-Aho, P., Eklo, O., Klöve, B., Kværner, J., and Stumpp, C.: Snow and frost: implications for spatiotemporal infiltration patterns – a review, Hydrol. Process., 30, 1230–1250, https://doi.org/10.1002/hyp.10703, 2016.
Maulé, C. P., Chanasyk, D. S., and Muehlenbachs, K.: Isotopic determination of snow-water contribution to soil water and groundwater, J. Hydrol., 155, 73–91, 1994.
Mohammed, A. A., Kurylyk, B. L., Cey, E. E., and Hayashi, M.: Snowmelt infiltration and macropore flow in frozen soils: overview, knowledge gaps, and a conceptual framework, Vadose Zone J., 17, 180084, https://doi.org/10.2136/vzj2018.04.0084, 2018.
Mohammed, G. A., Hayashi, M., Farrow, C. R., and Takano, Y.: Improved characterization of frozen soil processes in the Versatile Soil Moisture Budget model, Can. J. Soil Sci., 93, 511–531, 2013.
Mohammed, A. A.: Measurement and simulation of preferential flow in frozen soils, PhD thesis, University of Calgary, Calgary, Alberta, Canada, available at: http://hdl.handle.net/1880/111213, last access: 3 December 2019.
Naeth, M. A., Pluth, D. J., Chanasyk, D. S., Bailey, A. W., and Fedkenheuer, A. W.: Soil compacting impacts of grazing in mixed prairie and fescue grassland ecosystems of Alberta, Can. J. Soil Sci., 70, 157–167, 1990a.
Naeth, M. A., Rothwell, R. L., Chanasyk, D. S., and Bailey, A. W.: Grazing impacts on infiltration in mixed prairie and fescue grassland ecosystems of Alberta, Can. J. Soil Sci., 70, 593–605, 1990b.
Naeth, M. A., Chanasyk, D. S., Rothwell, R. L., and Bailey, A. W.: Grazing impacts on soil water in mixed prairie and fescue grassland ecosystems of Alberta, Can. J. Soil Sci., 71, 313–325, 1991.
Nkemdirim, L. C.: Canada's chinook belt, Int. J. Climatol., 16, 441–462, 1996.
Pavlovskii, I., Hayashi, M., and Lennon, M. R.: Transformation of snow isotopic signature along groundwater recharge pathways in the Canadian Prairies, J. Hydrol., 563, 1147–1160, 2018.
Pavlovskii, I., Hayashi, M., and Itenfisu, D.: Midwinter melts in the Canadian prairies: energy balance and hydrological effects, Hydrol. Earth Syst. Sci., 23, 1867–1883, https://doi.org/10.5194/hess-23-1867-2019, 2019b.
Pittman, F., Mohammed, A. A., and Cey, E. E.: Effects of antecedent moisture and macroporosity on infiltration and water flow in frozen soil, Hydrol. Process., 1–15, https://doi.org/10.1002/hyp.13629, 2019.
Redding, T. and Devito, K.: Mechanisms and pathways of lateral flow on aspen-forested, Luvisolic soils, Western Boreal Plains, Alberta, Canada, Hydrol. Process., 24, 2995–3010, 2010.
Scherler, M., Hauck, C., Hoelzle, M., Stähli, M., and Völksch, I.: Meltwater infiltration into the frozen active layer at an alpine permafrost site, Permafrost Periglac., 21, 325–334, 2010.
Schulze-Makuch, D., Carlson, D. A., Cherkauer, D. S., and Malik, P.: Scale dependency of hydraulic conductivity in heterogeneous media. Groundwater, 37, 904–919, 1999.
Schwen, A., Bodner, G., Scholl, P., Buchan, G. D., and Loiskandl, W.: Temporal dynamics of soil hydraulic properties and the water-conducting porosity under different tillage, Soil Till. Res., 113, 89–98, 2011.
Seyfried, M. S. and Murdock, M. D.: Calibration of time domain reflectometry for measurement of liquid water in frozen soils, Soil Sci., 161, 87–98, 1996.
Shaw, D. A., van der Kamp, G., Conly, F. M., Pietroniro, A., and Martz, L.: The fill–spill hydrology of prairie wetland complexes during drought and deluge, Hydrol. Process., 26, 3147–3156, 2012.
Soil Classification Working Group: The Canadian system of soil classification, Agriculture and agri-food Canada publication 1646:187, 1998.
Stähli, M.: Freezing and thawing phenomena in soils, in: Encyclopedia of the Hydrological Sciences, edited by: Anderson, M. G., John Wiley & Sons, New York, 1069–1076, 2006.
Stähli, M., Jansson, P., and Lundin L. C.: Preferential water flow in a frozen soil – A two-domain model approach, Hydrol. Process., 10, 1305–1316, 1996.
Stähli, M., Jansson, P., and Lundin, L. C.: Soil moisture redistribution and infiltration in frozen sandy soils, Water Resour. Res., 35, 95–103, https://doi.org/10.1029/1998WR900045, 1999.
Stumpp, C. and Hendry, M. J.: Spatial and temporal dynamics of water flow and solute transport in a heterogeneous glacial till: The application of high-resolution profiles of δ18O and δ2H in pore waters, J. Hydrol., 438, 203–214, 2012.
Sutinen, R., Hänninen, P., and Venäläinen, A.: Effect of mild winter events on soil water content beneath snowpack, Cold Reg. Sci. Technol., 51, 56–67, 2008.
Tiessen, K. H. D., Elliott, J. A., Yarotski, J., Lobb, D. A., Flaten, D. N., and Glozier, N. E.: Conventional and conservation tillage: Influence on seasonal runoff, sediment, and nutrient losses in the Canadian prairies, J. Environ. Qual., 39, 964–980, 2010.
Topp, G. C., Davis, J. L., and Annan, A. P.: Electromagnetic determination of soil water content: Measurements in coaxial transmission lines, Water Resour. Res., 16, 574–582, 1980.
van der Kamp, G. and Hayashi, M.: The groundwater recharge function of small wetlands in the semi-arid northern prairies, Great Plains Res., 8, 39–56, 1998.
van der Kamp, G., Stolte, W. J., and Clark, R. G.: Drying out of small prairie wetlands after conversion of their catchments from cultivation to permanent brome grass, Hydrolog. Sci. J., 44, 387–397, 1999.
van der Kamp, G., Hayashi, M., and Gallen, D.: Comparing the hydrology of grassed and cultivated catchments in the semi-arid Canadian prairies, Hydrol. Process., 17, 559–575, 2003.
van der Kamp, G. and Hayashi, M.: Groundwater-wetland ecosystem interaction in the semiarid glaciated plains of North America, Hydrogeol. J., 17, 203–214, 2009.
Watanabe, K., Kito, T., Dun, S., Wu, J. Q., Greer, R. C., and Flury, M.: Water infiltration into a frozen soil with simultaneous melting of the frozen layer, Vadose Zone J., 12, https://doi.org/10.2136/vzj2011.0188, 2013.
Watanabe, K. and Kugisaki, Y.: Effect of macropores on soil freezing and thawing with infiltration, Hydrol. Process., 31, 270–208, https://doi.org/10.1002/hyp.10939, 2017.
Weiler, M., McDonnell, J. J., Tromp-van Meerveld, I., and Uchida, T.: Subsurface stormflow, in: Encyclopedia of Hydrological Sciences, edited by: Anderson, M. G., John Wiley & Sons, New York, 2006.
Winter, T. C. and Rosenberry, D. O.: Hydrology of prairie pothole wetlands during drought and deluge: a 17-year study of the Cottonwood Lake wetland complex in North Dakota in the perspective of longer term measured and proxy hydrological records, Climatic Change, 40, 189–209, 1998.
Whitson, I. R., Chanasyk, D. S., and Prepas, E. E.: Patterns of water movement on a logged Gray Luvisolic hillslope during the snowmelt period, Can. J. Soil Sci., 84, 71–82, 2004.