the Creative Commons Attribution 4.0 License.
the Creative Commons Attribution 4.0 License.
 | 07 Feb 2019
Long-term groundwater recharge rates across India by in situ measurements
Soumendra N. Bhanja
Abhijit Mukherjee
R. Rangarajan
Bridget R. Scanlon
Pragnaditya Malakar
Shubha Verma
Groundwater recharge sustains groundwater discharge, including natural discharge through springs and the base flow to surface water as well as anthropogenic discharge through pumping wells. Here, for the first time, we compute long-term (1996–2015) groundwater recharge rates using data retrieved from several groundwater-level monitoring locations across India (3.3 million km2 area), the most groundwater-stressed region globally. Spatial variations in groundwater recharge rates (basin-wide mean: 17 to 960 mm yr−1) were estimated in the 22 major river basins across India. The extensive plains of the Indus–Ganges–Brahmaputra (IGB) river basins are subjected to prevalence of comparatively higher recharge. This is mainly attributed to occurrence of coarse sediments, higher rainfall, and intensive irrigation-linked groundwater-abstraction inducing recharge by increasing available groundwater storage and return flows. Lower recharge rates (<200 mm yr−1) in most of the central and southern study areas occur in cratonic, crystalline fractured aquifers. Estimated recharge rates have been compared favorably with field-scale recharge estimates (n=52) based on tracer (tritium) injection tests. Results show that precipitation rates do not significantly influence groundwater recharge in most of the river basins across India, indicating human influence in prevailing recharge rates. The spatial variability in recharge rates could provide critical input for policymakers to develop more sustainable groundwater management in India.
- Article
(11856 KB) -
Supplement
(213 KB) - BibTeX
- EndNote


India represents ∼18 % of the global population but occupies <3 % of the global land area (Food and Agriculture Organization of the United Nations, 2013). Agricultural activity is intensive, and parts of India support the highest rate of irrigated arable land globally (Siebert et al., 2013). The World Bank and Government of India (1998) estimate that groundwater contributes ∼9 % to India's GDP. However, few studies have reported groundwater recharge at a limited number of locations (Goel et al., 1975; Bhandari et al., 1982; Athavale et al., 1992, 1998; Rangarajan et al., 1995, 1997, 1998; Rangarajan and Athavale, 2000; Scanlon et al., 2010; Fig. 1). Out of the total irrigation-linked freshwater withdrawal, more than 50 % is attributed to groundwater in India (Central Ground Water Board, 2011).
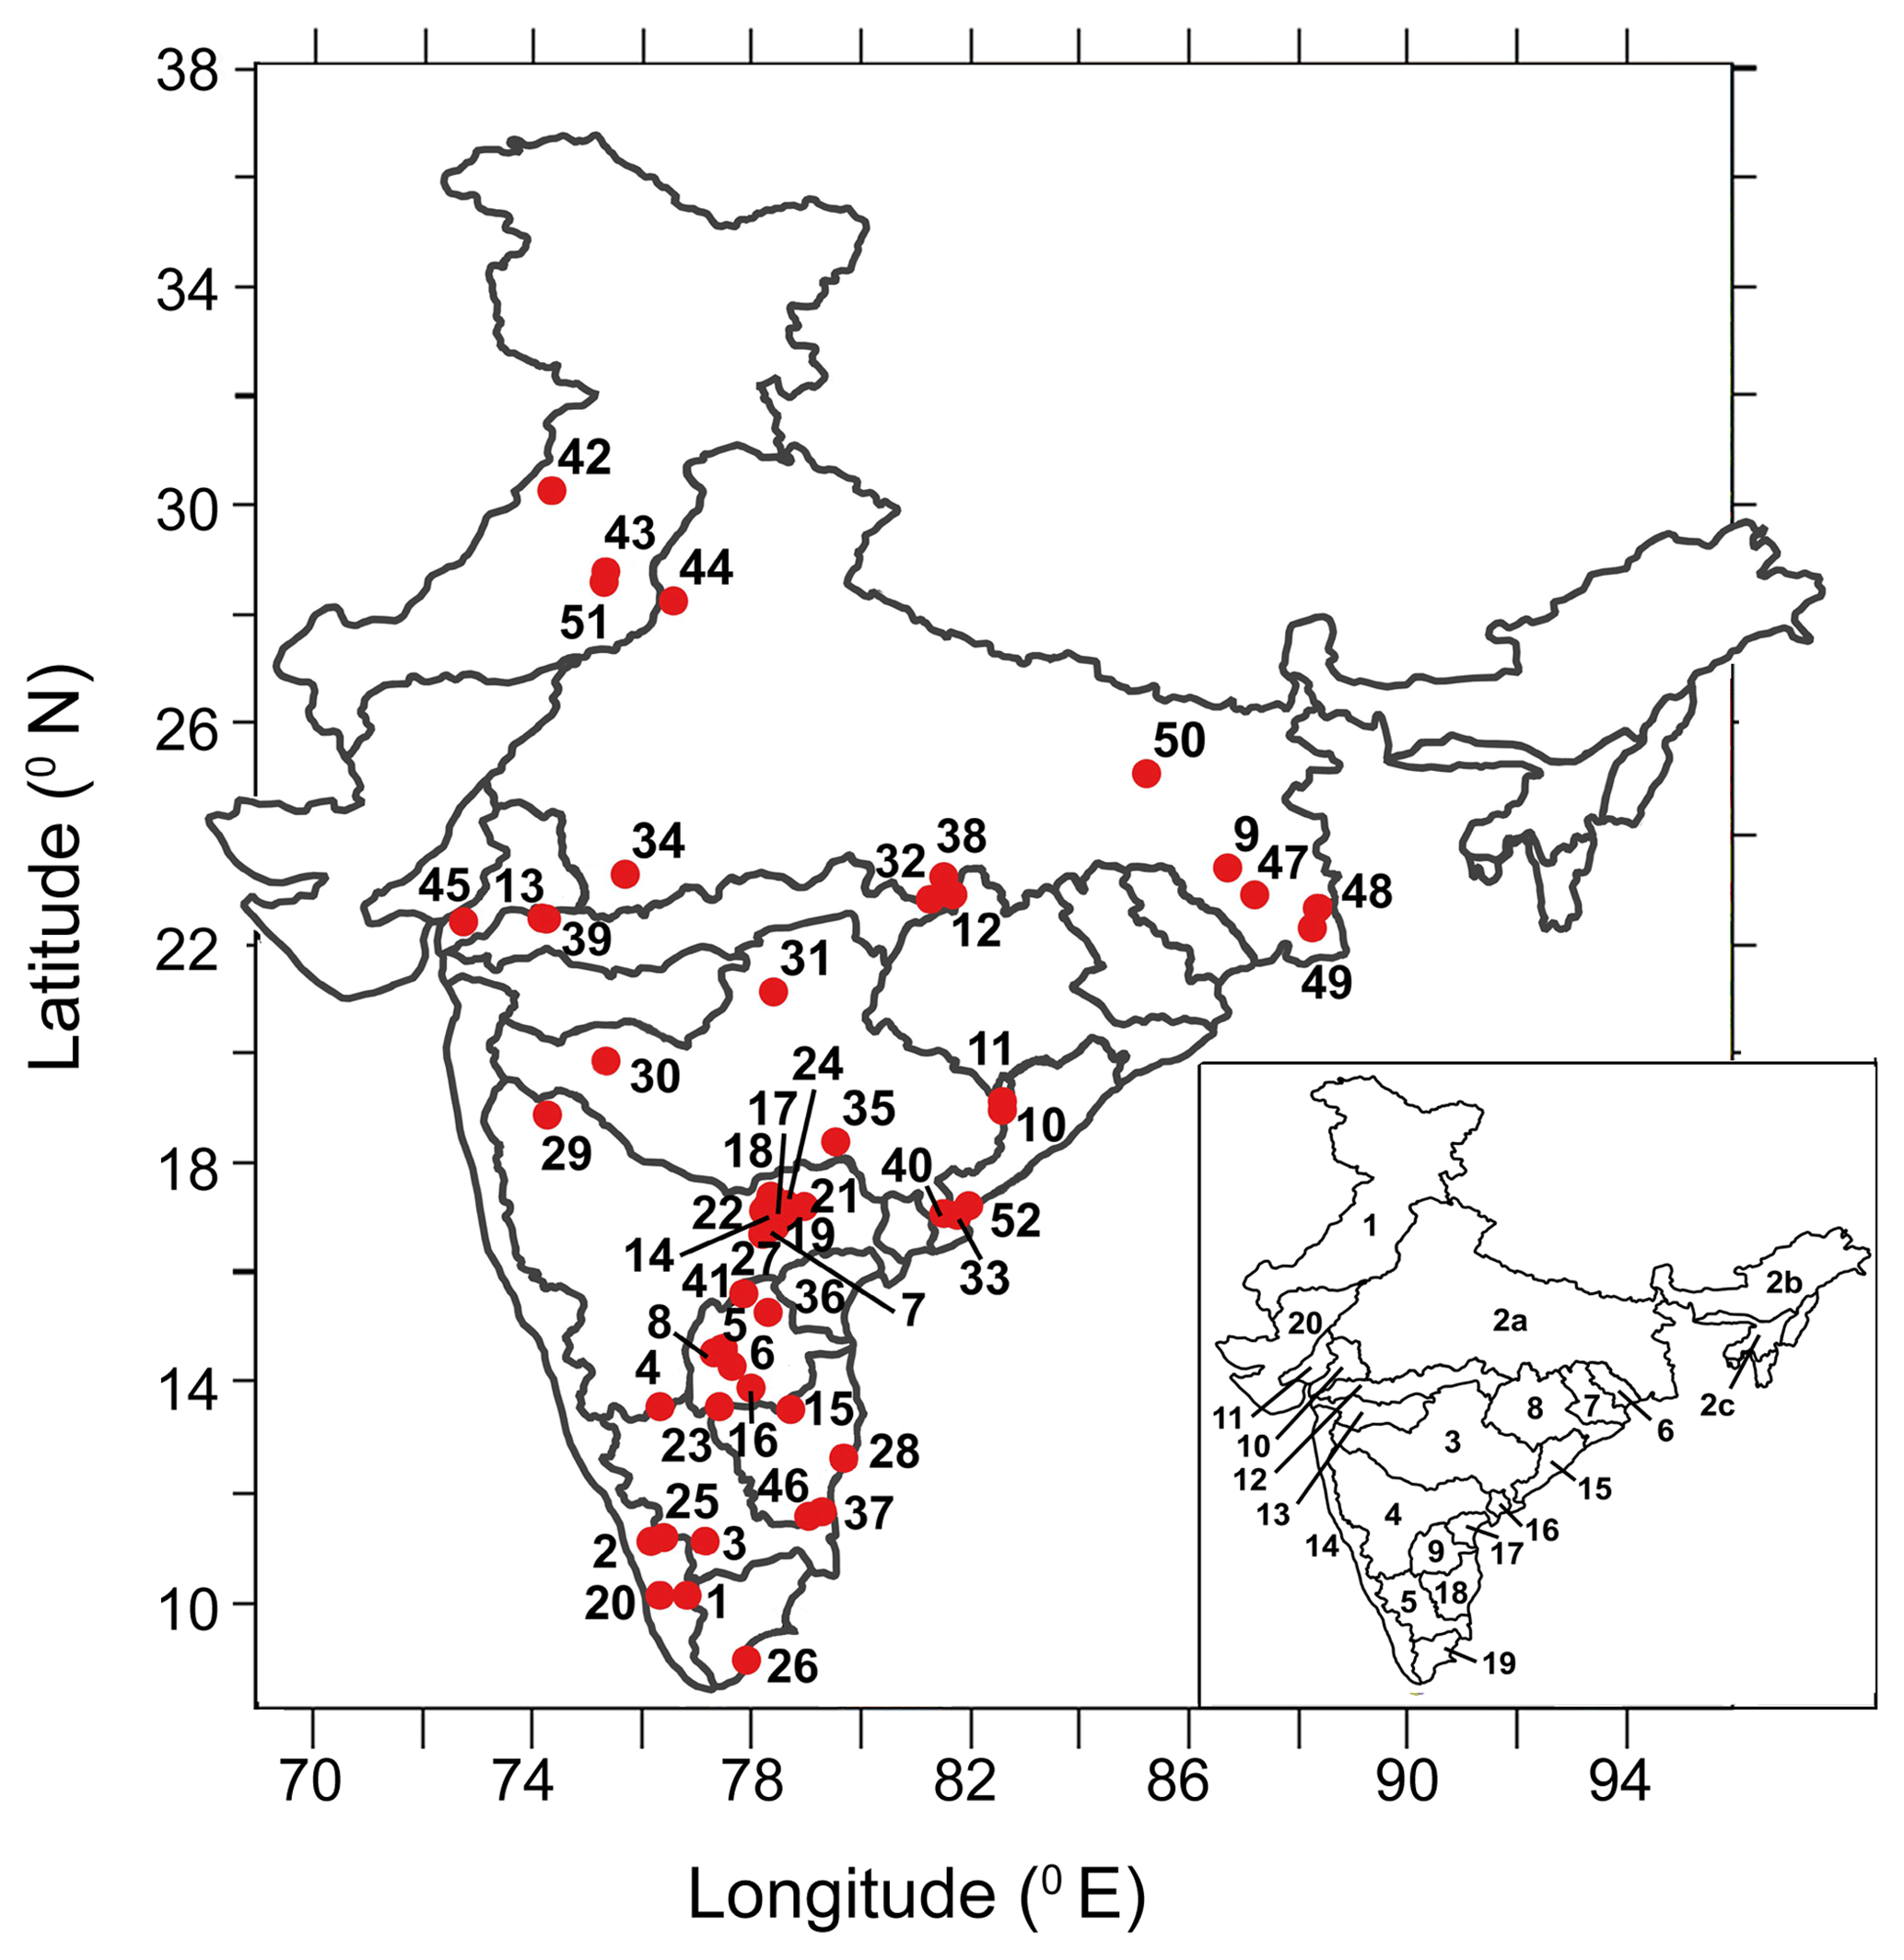
Figure 1Map of India showing the 22 major river basins and locations (circles) of 52 field-scale recharge measurements used in this study, which were derived from the tritium injection; numbers beside these locations correspond to sites reported in Table 1. River basin numbers are shown in inset. Field-scale recharge data are taken from the following studies and unpublished estimates: Goel et al. (1975), Athavale et al. (1998, 1992), Rangarajan and Athavale (2000), Bhandari et al. (1982) and Rangarajan et al. (1995, 1997, 1998, 2000).
Groundwater recharge can be defined as “the downward movement of water” that reaches the water table (Healy, 2010). Recharge can occur directly from the infiltration of rainfall as well as indirectly via irrigation return flows, leakage from surface water bodies or a combination of the two (Scanlon et al., 2006). In India, the large-scale, anthropogenic redistribution of water impacting recharge has occurred through both canal-driven and groundwater-fed irrigation (Mukherjee et al., 2007; MacDonald et al., 2016). In addition, dry-season groundwater-fed irrigation can increase available groundwater storage, enabling increased recharge during the subsequent monsoons (Revelle and Lakshminarayana, 1975; Shamsudduha et al., 2011).
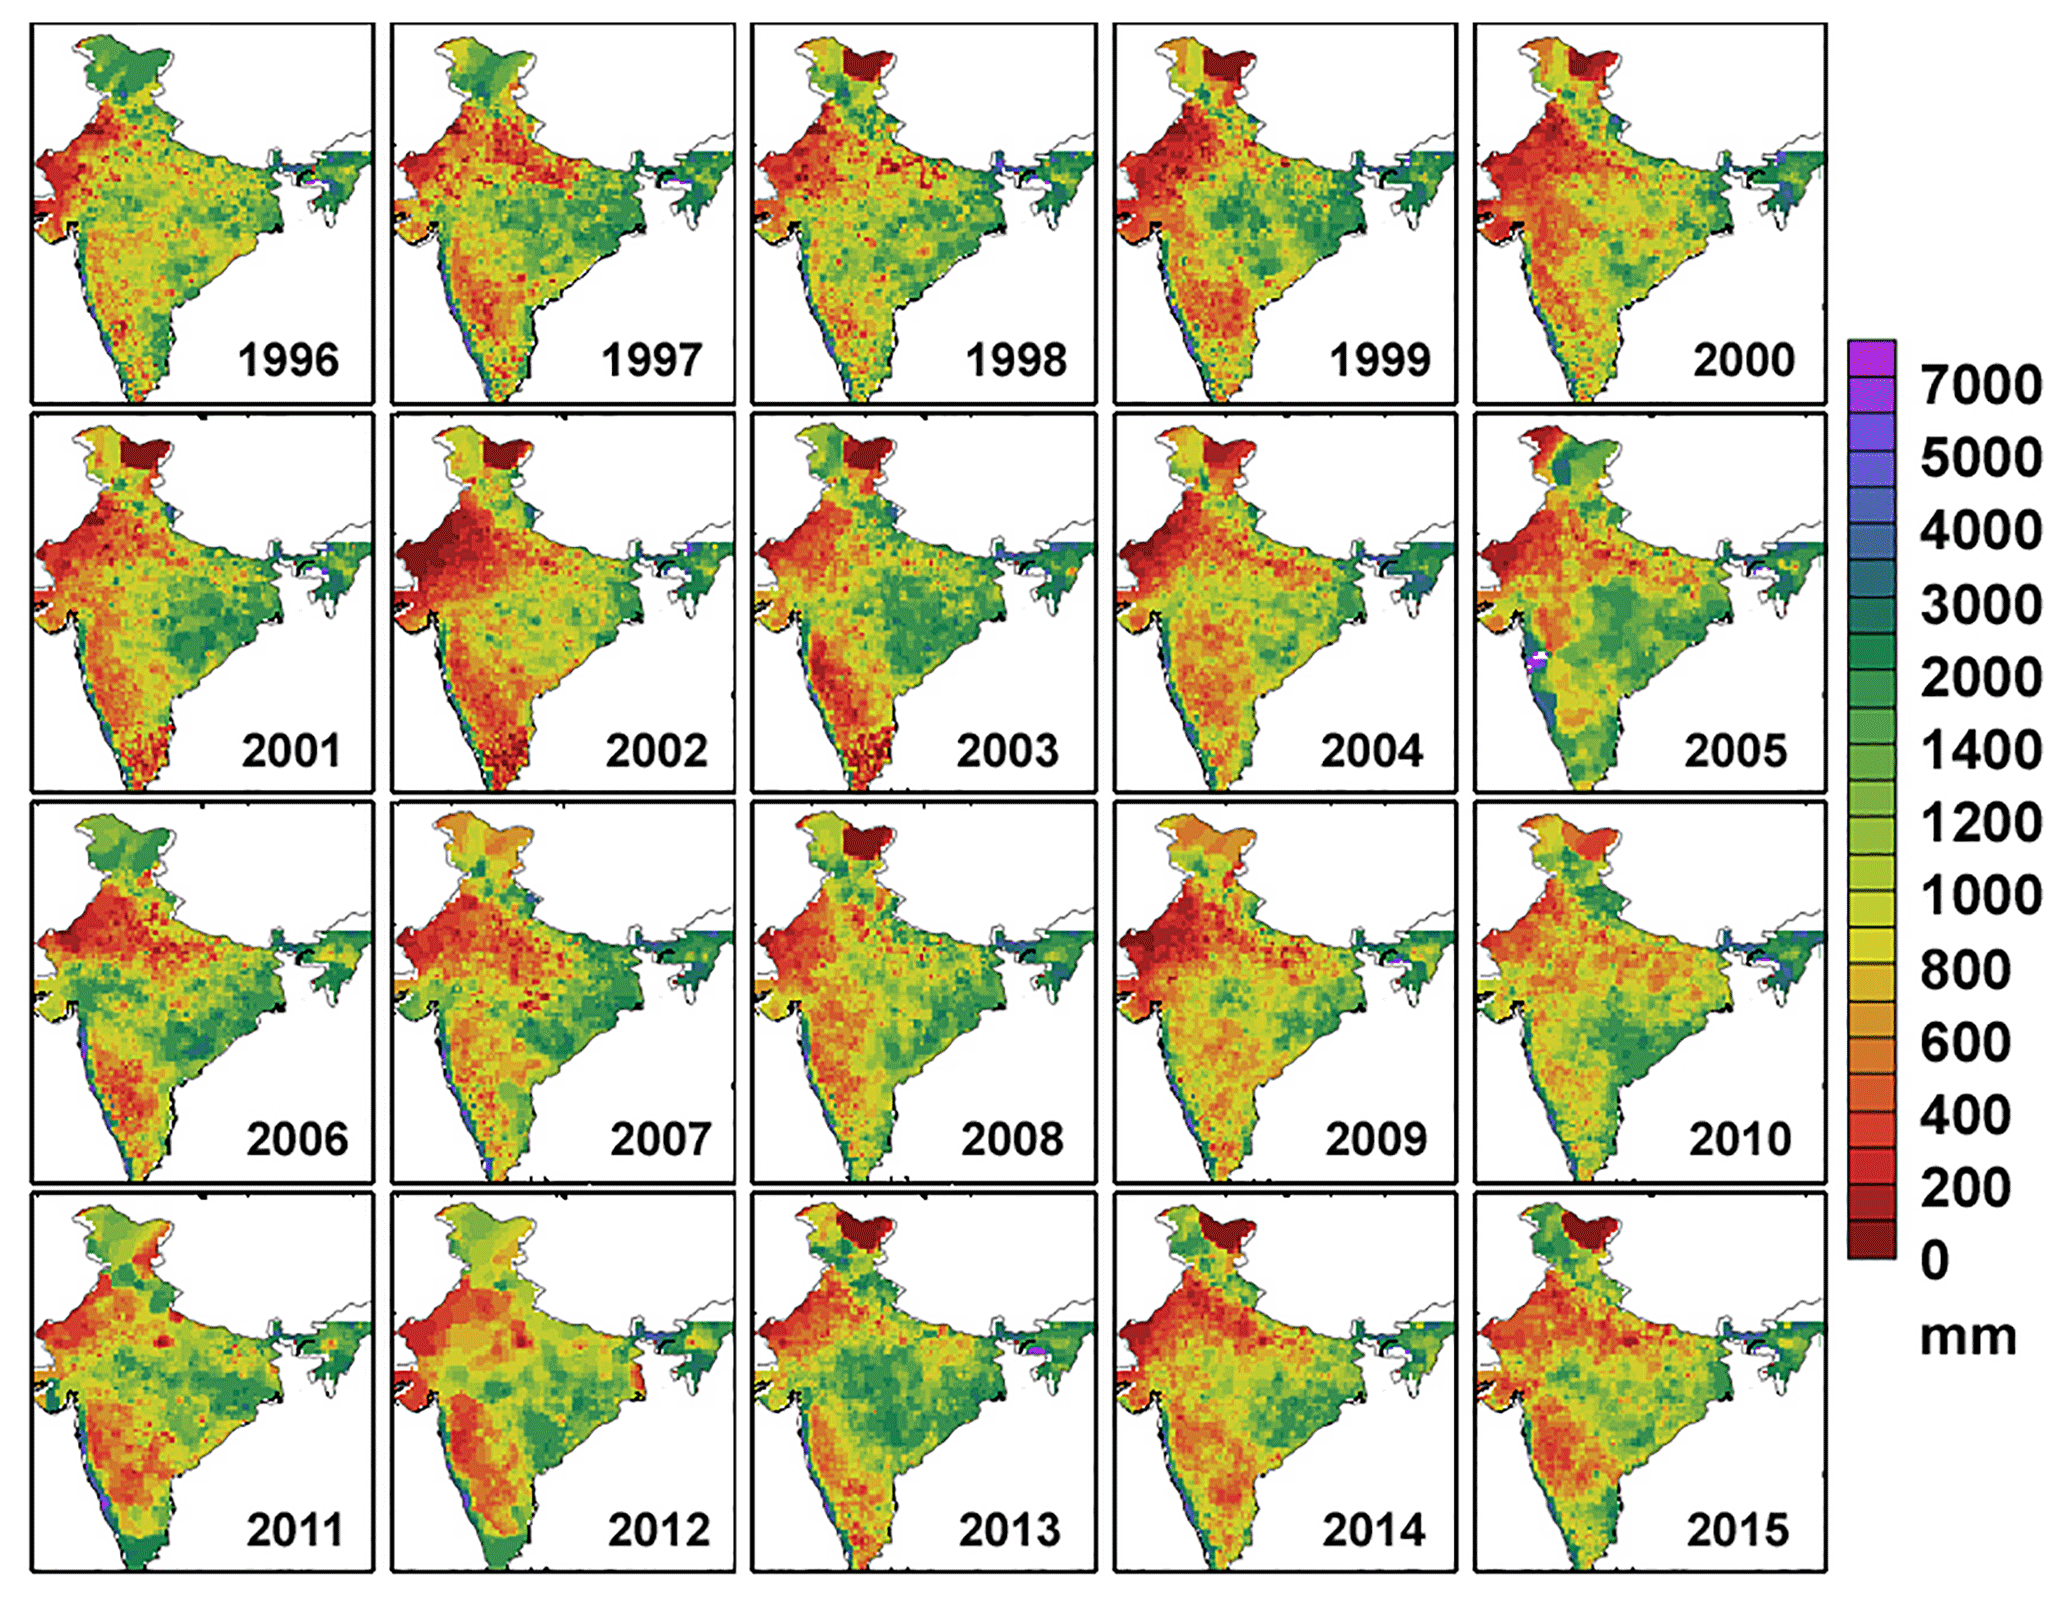
In India, groundwater recharge (Fig. 1) is believed to be derived primarily from a continuous spell of rainfall during the monsoon season (extending from June to September); the majority of the total annual precipitation (>74 %) across this region has been occurring during the monsoon (Guhathakurta and Rajeevan, 2008). Precipitation varies substantially across India; southern India also receives a moderate amount of precipitation during the pre-winter months (October–November). Figure 2 shows annual precipitation patterns between 1996 and 2015. Droughts occurred in 2002, 2004, 2009 and 2014 in India (Fig. 2). Precipitation data also reveal distinct spatial variations that range from humid to arid climates. Twenty-two major river basins have been characterized in India (Fig. 1; Bhanja et al., 2017b). The largest river basin in the region is the Ganges basin in terms of area, followed by Indus basin and Godavari basin (Fig. 1; Bhanja et al., 2017b). Brahmaputra (basin 2a) and Barak (basin 2c) basins have the highest annual rainfall occurrence (>2000 mm yr−1; Table 1), while the Indus basin (basin 1) receives the minimum amount of rainfall (Table 1). India includes a range of hydrogeological settings (Fig. 3) that vary between highly fertile alluvial formations within Indus–Ganges–Brahmaputra (IGB) basin aquifers and less permeable, fractured rock aquifers in parts of central and southern India. Thus, the IGB basin is intensively cultivated leading to comparatively higher rates of groundwater withdrawal.
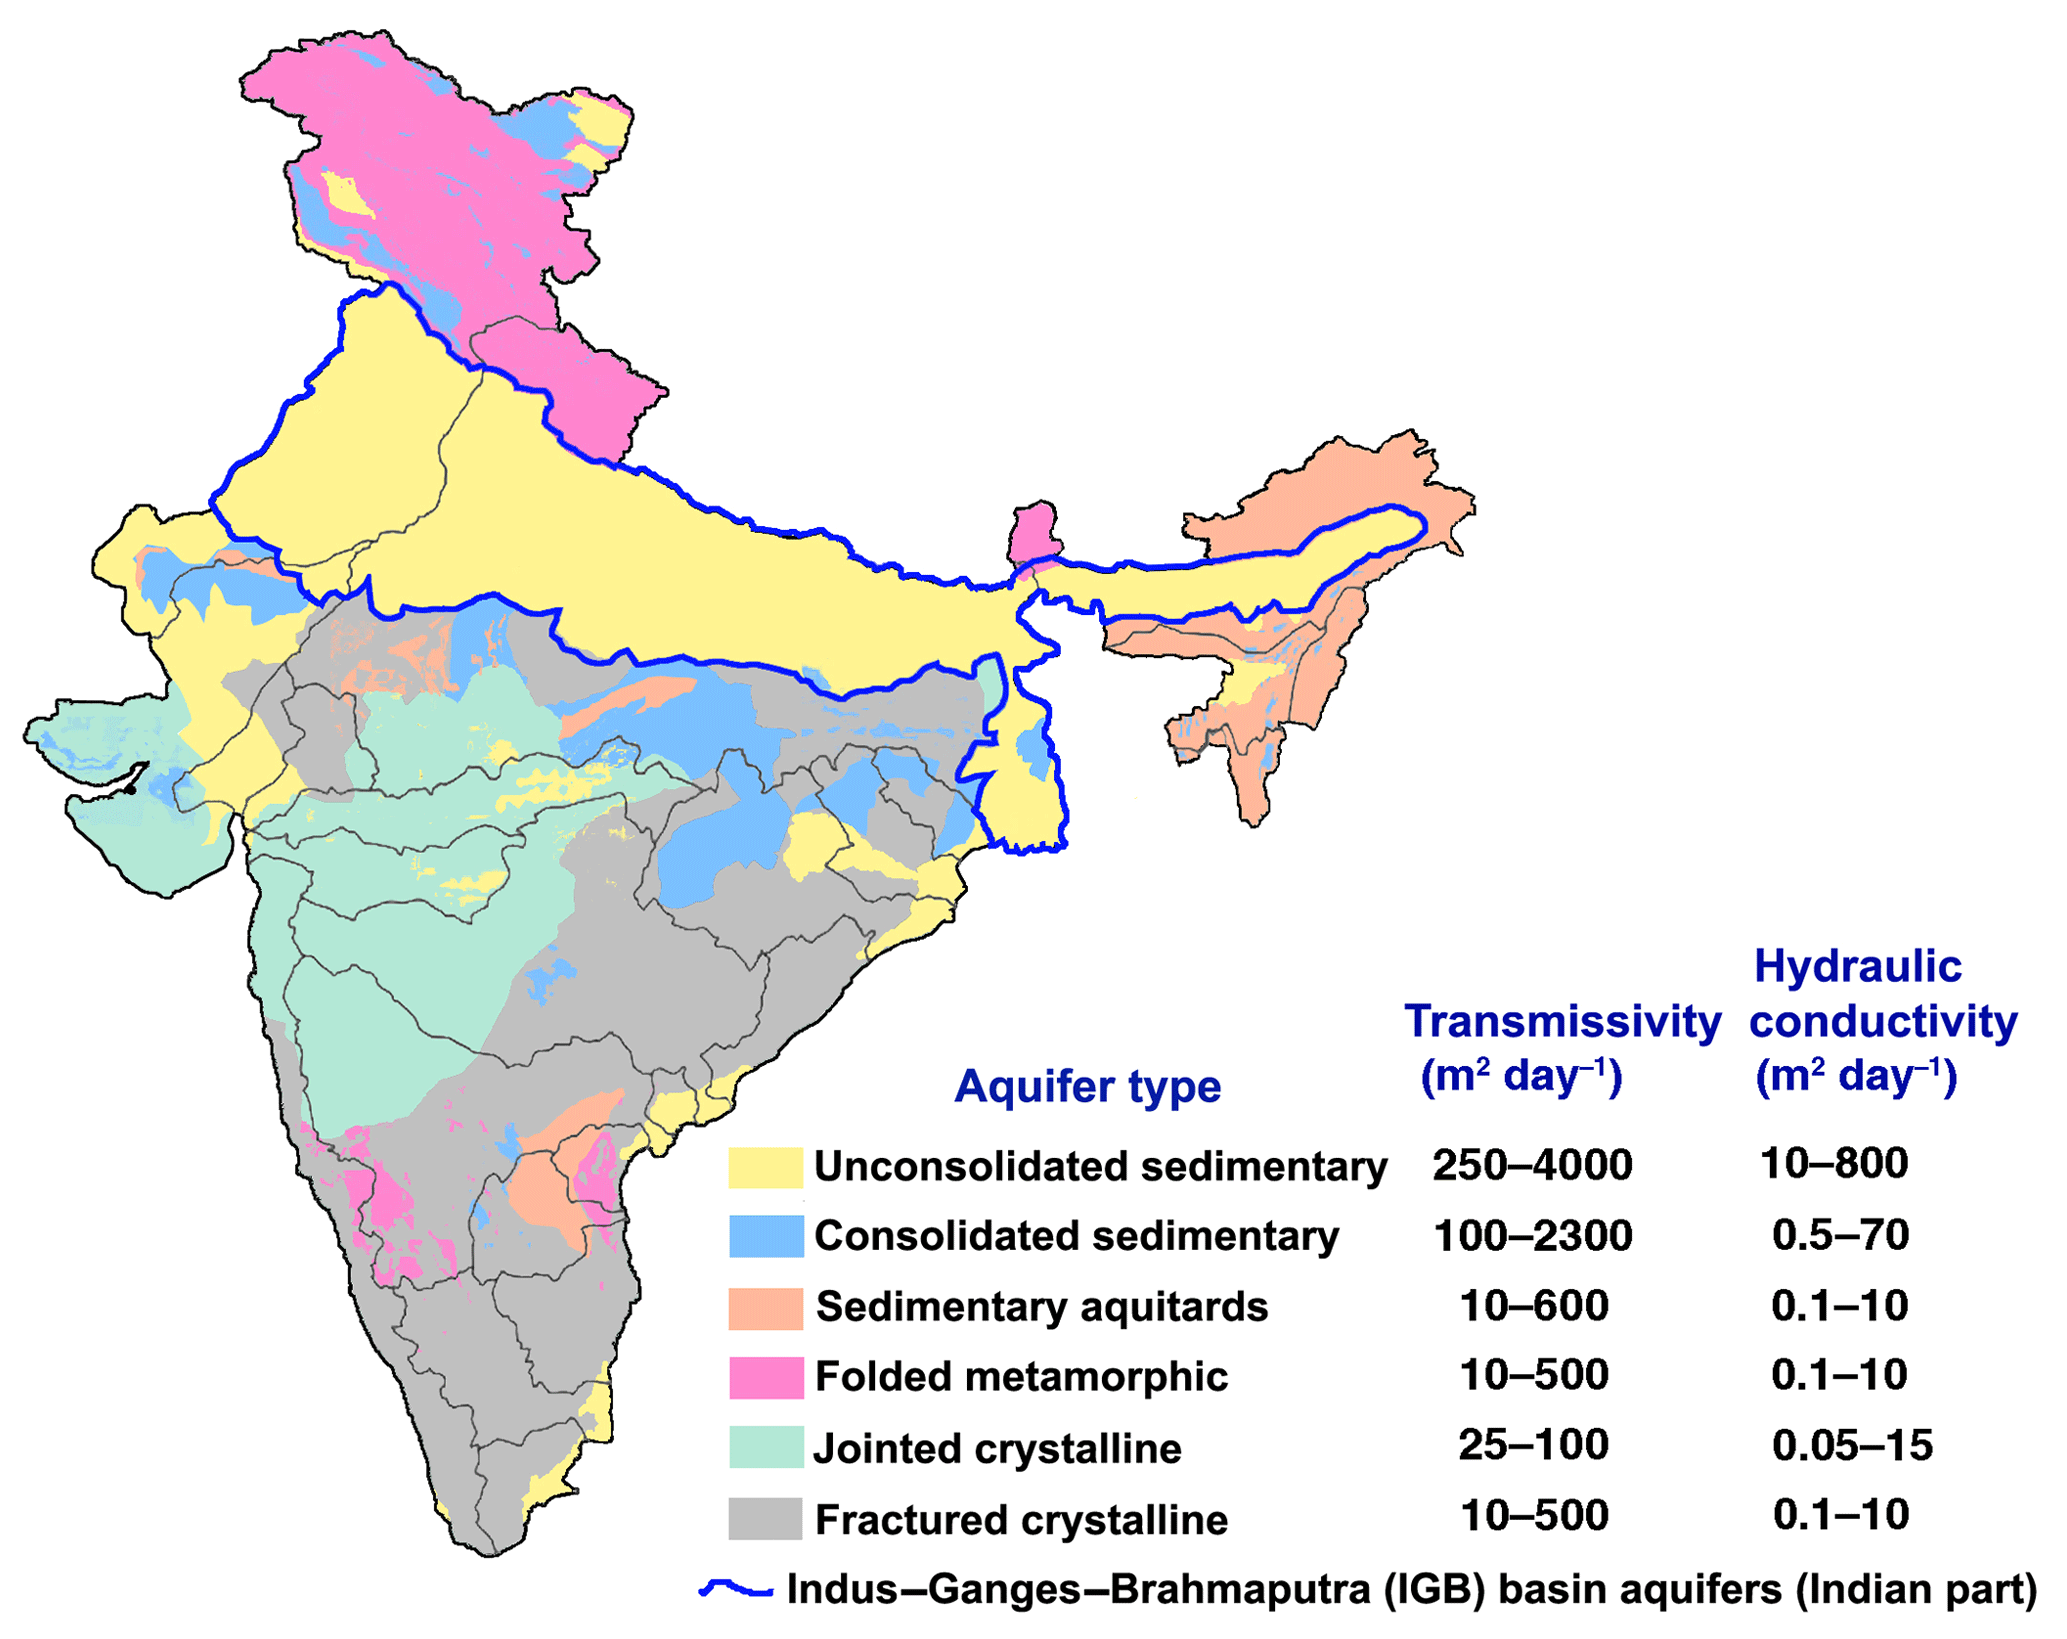
Figure 3Aquifer types, transmissivity (m2 day−1) and horizontal hydraulic conductivity values (m day−1). Transmissivity and horizontal hydraulic conductivity values are obtained from the Central Ground Water Board (2012) and Groundwater Resource Estimation Methodology (1997). IGB basin aquifers are shown with blue line.
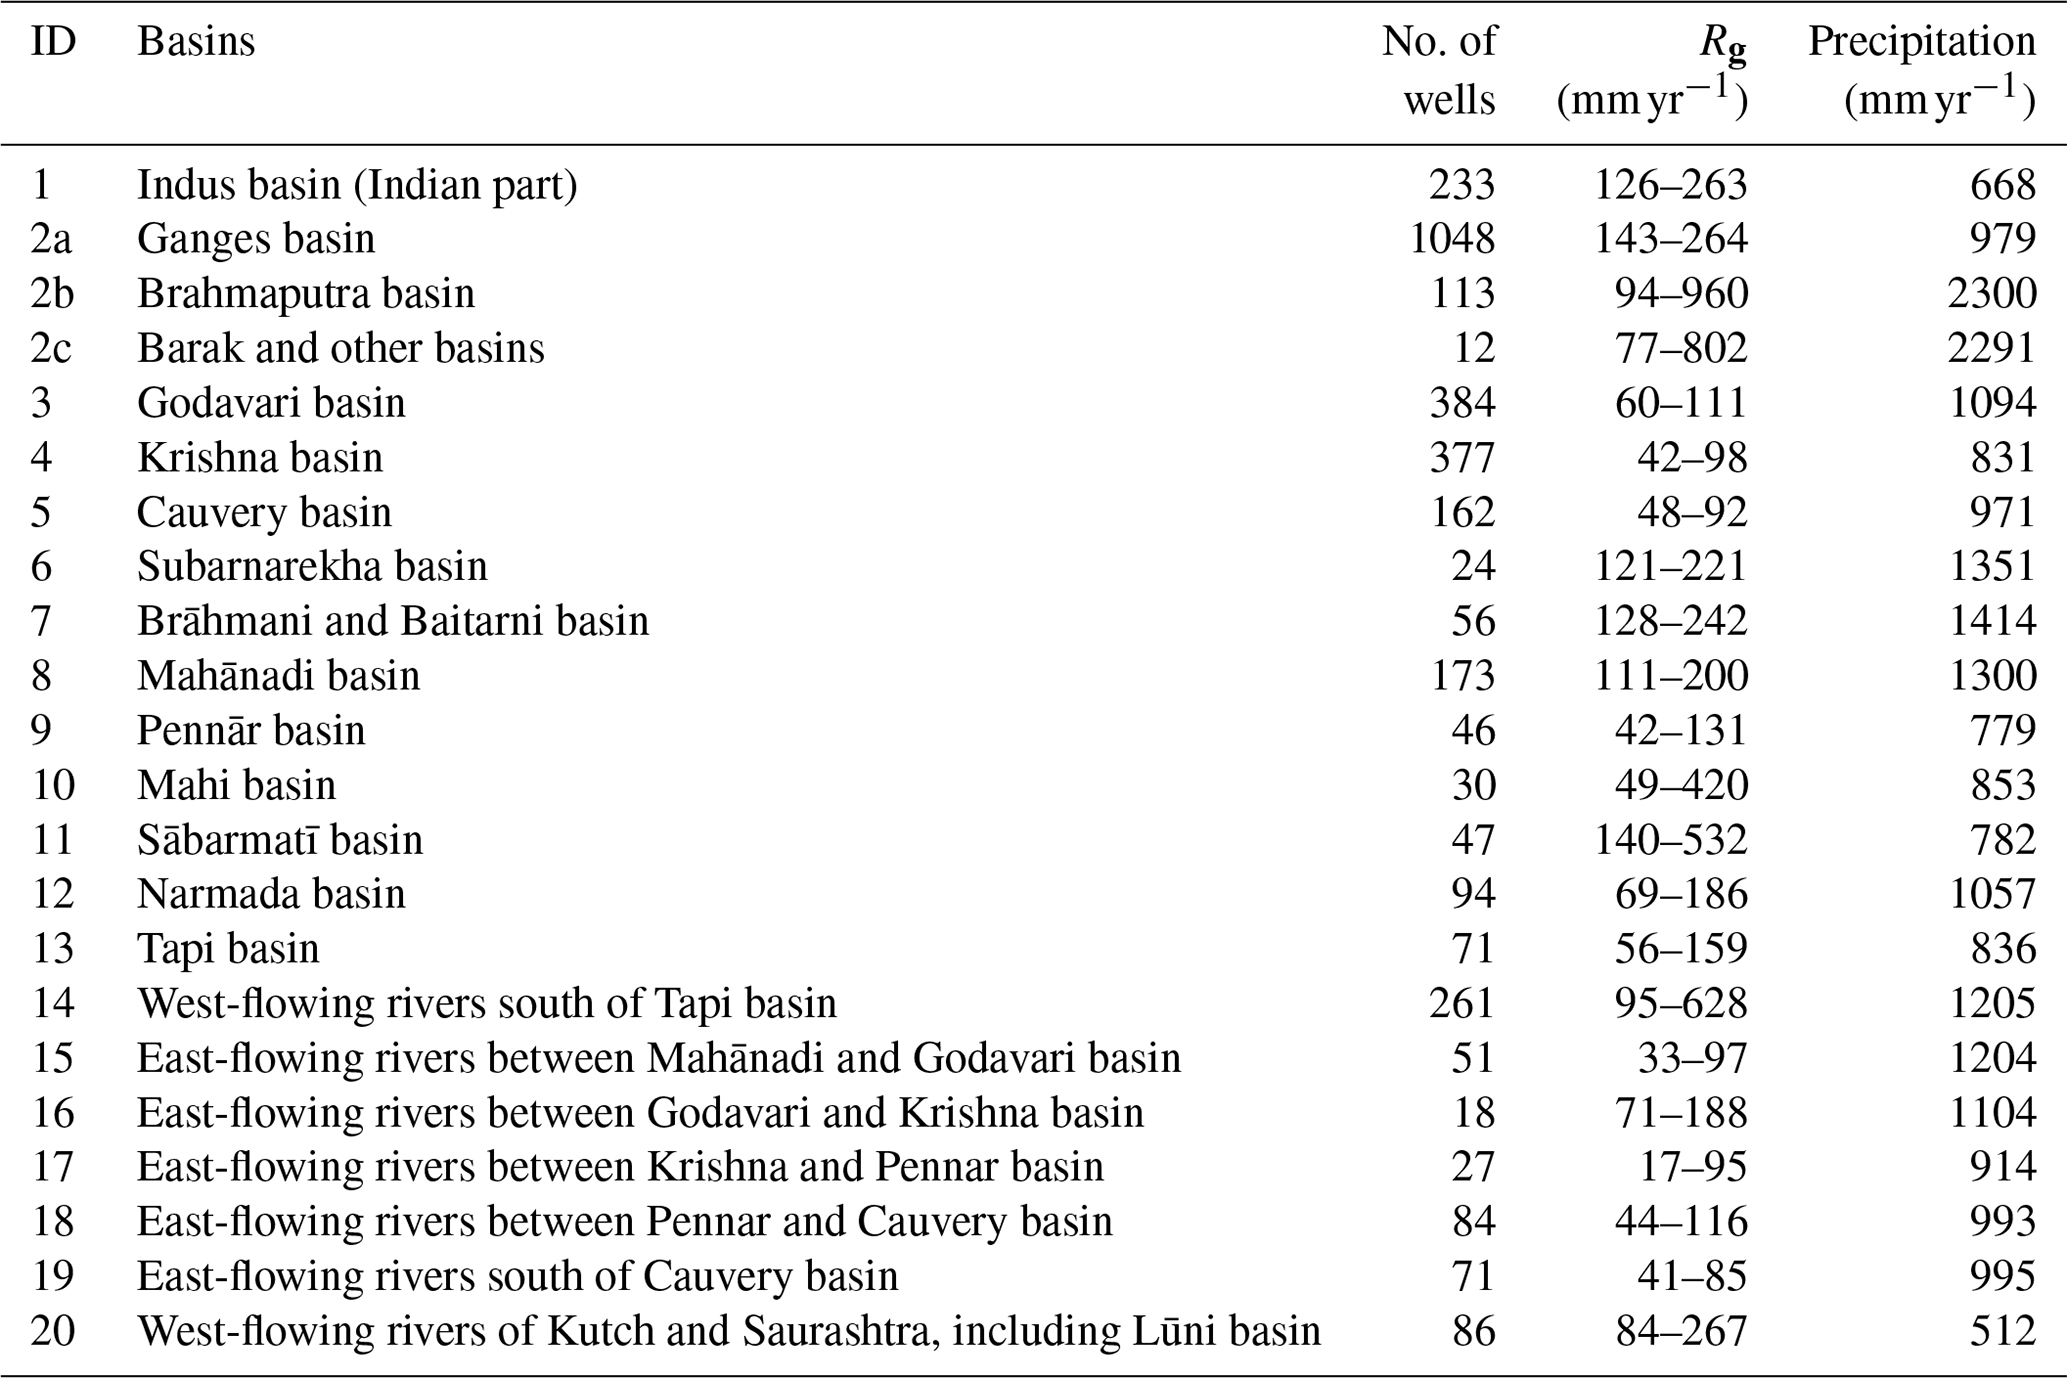
Table 1Basin-wide annual mean recharge rates (mm yr−1), and average precipitation rates in 1996–2015.
Recharge data are critical for developing sustainable groundwater management policies in India. Understanding the controls on groundwater recharge is also valuable for managing recharge. Currently there are almost no restrictions on groundwater development in India. Electricity policies in India actually promote the overdevelopment of groundwater. Groundwater has played a large role in agricultural production, supported in large part by intensive irrigation and resulting in poverty reduction (Zaveri et al., 2016). However, low recharge rates relative to rates of pumping have resulted in large groundwater-level declines, particularly in northwestern India (Bhanja et al., 2017a). The region would face groundwater drought if not managed properly. Bhanja et al. (2017a) showed replenishment of groundwater storage as a function of implementation of sustainable management policies in parts of the study area.
The objective of this study was to estimate spatial variability in groundwater recharge across India and compare with hydrogeologic environments, precipitation and irrigation intensities to better understand controls on recharge variability. Unique aspects of this study include the availability of a network of ∼19 000 groundwater-level monitoring locations with ∼2 decades of data (1996 to 2015), the range of hydroclimatic (arid to humid) and hydrogeologic settings (sedimentary to cratonic) sampled, and the varying intensity of irrigation. Recharge estimates were compared with independent field-scale recharge estimates from 52 locations distributed across India to assess the reliability of the regional-scale estimates. Controls on spatial variability of recharge were also assessed, including precipitation and irrigation intensity across the 22 major river basins (Fig. 1). The river basins provide natural subdivisions of the country that reflect varying hydroclimatic, hydrogeologic and anthropogenic activity (Fig. 1; Table 1).
2.1 Groundwater-level monitoring
Seasonal (i.e., quarterly or four times per year) ground-based monitoring data (n>15 000) for 20 years (from 1996 to 2015) were a part of the Central Ground Water Board's (CGWB, Government of India) groundwater monitoring mission. Most (∼85 %) of the studied wells represent shallow, unconfined aquifers (Central Ground Water Board, 2014); however, these aquifers have not been characterized in CGWB reports and products. Initially, groundwater-level data were filtered for attaining a temporally continuous dataset in the study area for each year. The data were collected once during the months of January, May, August and November in individual years (Groundwater Resource Estimation Methodology, 1997). Outliers were removed following Tukey's fence approach (Tukey, 1977), reducing the usable number of monitoring data points to 3468. The annual change in groundwater levels was determined using the highest and lowest groundwater head elevation (highest and lowest groundwater level generally occur in post-monsoon and pre-monsoon times, respectively) for each year. Finally, gridded data were obtained following the ordinary kriging technique.
2.2 Groundwater recharge estimation using the water-table fluctuation (WTF) method
One of the major challenges is the absence of high-resolution, observed data of climatic parameters and other controlling factors that could be used in groundwater recharge measurement. High spatiotemporal variability of groundwater recharge is another concern for the regional-scale recharge estimates (Healy, 2010). In the absence of field-scale data to estimate recharge, simpler methods, such as the water-table fluctuation (WTF) technique, are more widely used to estimate recharge (Rg; Healy and Cook, 2002). Rg may be defined as
where Δh represents seasonal changes in groundwater levels.
Specific yield (Sy) of the aquifer material is one of the important components for the recharge estimation. Sy information was retrieved following the Central Ground Water Board (2012) and Bhanja et al. (2016). Mean Sy values vary between 0.02 and 0.13, varying with identified aquifers (Figs. 3 and 4a). The IGB basins are heavily irrigated, with intensive groundwater withdrawals (Fig. 4b; Supplement Fig. S1) relative to other parts of the country.
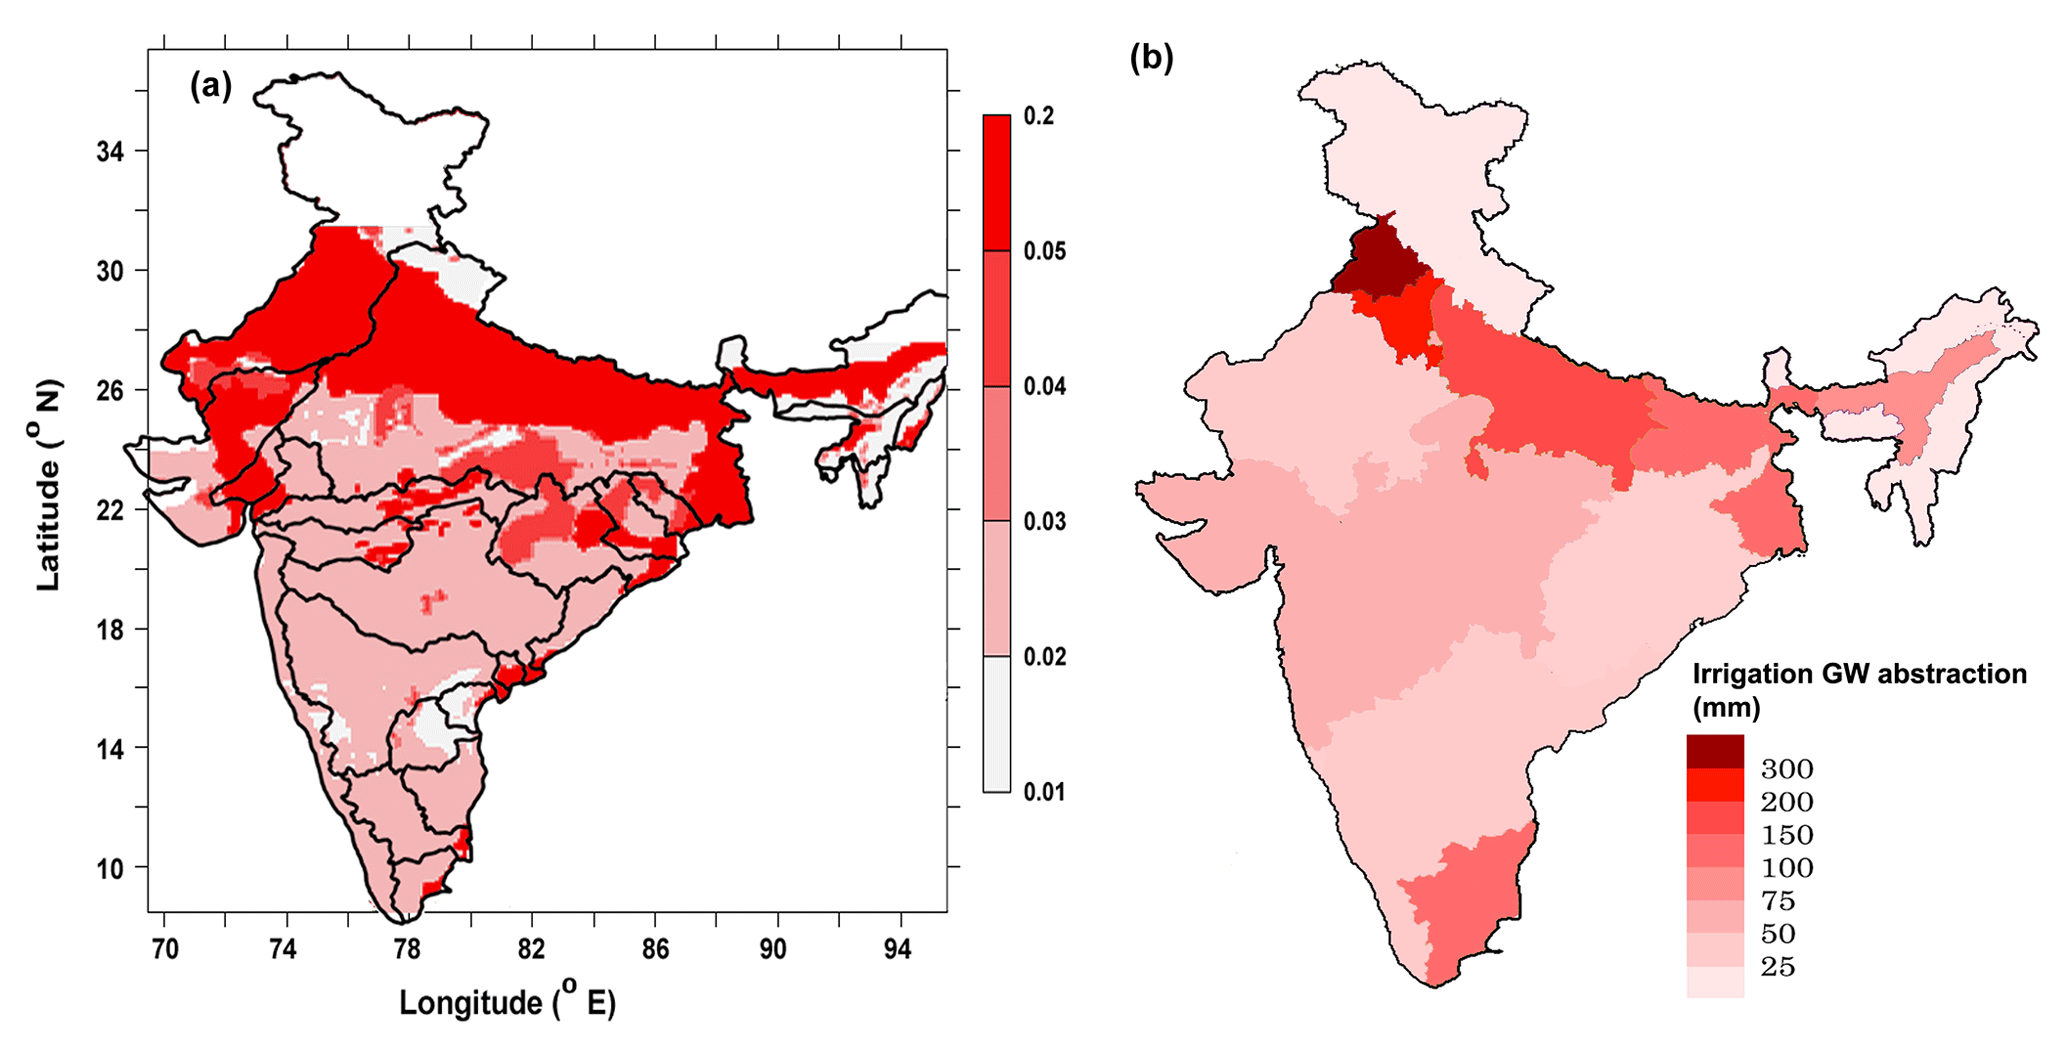
Figure 4Maps of (a) specific yield data (modified from Bhanja et al., 2016). Blank areas represent areas of no data availability; (b) state-wide groundwater abstraction for irrigation (mm; estimates are for the year 2009; Central Ground Water Board, 2012).
2.3 Field-scale recharge estimation using tritium injection approach
A tracer in the form of ions, isotope or gases move with water and can be tracked to estimate water infiltration through unsaturated zone (Healy, 2010). Here, the tritium injection method has been used to estimate recharge rates in 52 locations across India (Fig. 1). The equivalent depth of water of the peak movement can be represented as the total infiltrated water flux (Healy, 2010). The piston-flow method, which has been a major assumption in tracer movement technique, is linked with the vertically downward movement of water and dissolved solutes without mixing and change in velocity (Healy, 2010). Tritium injection is performed during the pre-monsoon seasons, and the soil core is collected after the monsoon in order to estimate the monsoon recharge rate (Rangarajan and Athavale, 2000). More details on the tritium injection method can be found in the Supplement and in Rangarajan et al. (2000).
2.4 Non-linear trend analysis
Non-linearity in the recharge and precipitation data can be represented through Hodrick–Prescott (HP) trend analysis (Hodrick and Prescott, 1997), which separates cyclical components present (ct) in the data (yt) from the trend (Tt) after solving the following equations:
where λ is a constant (Hodrick and Prescott, 1997; Ravn and Uhlig, 2002).
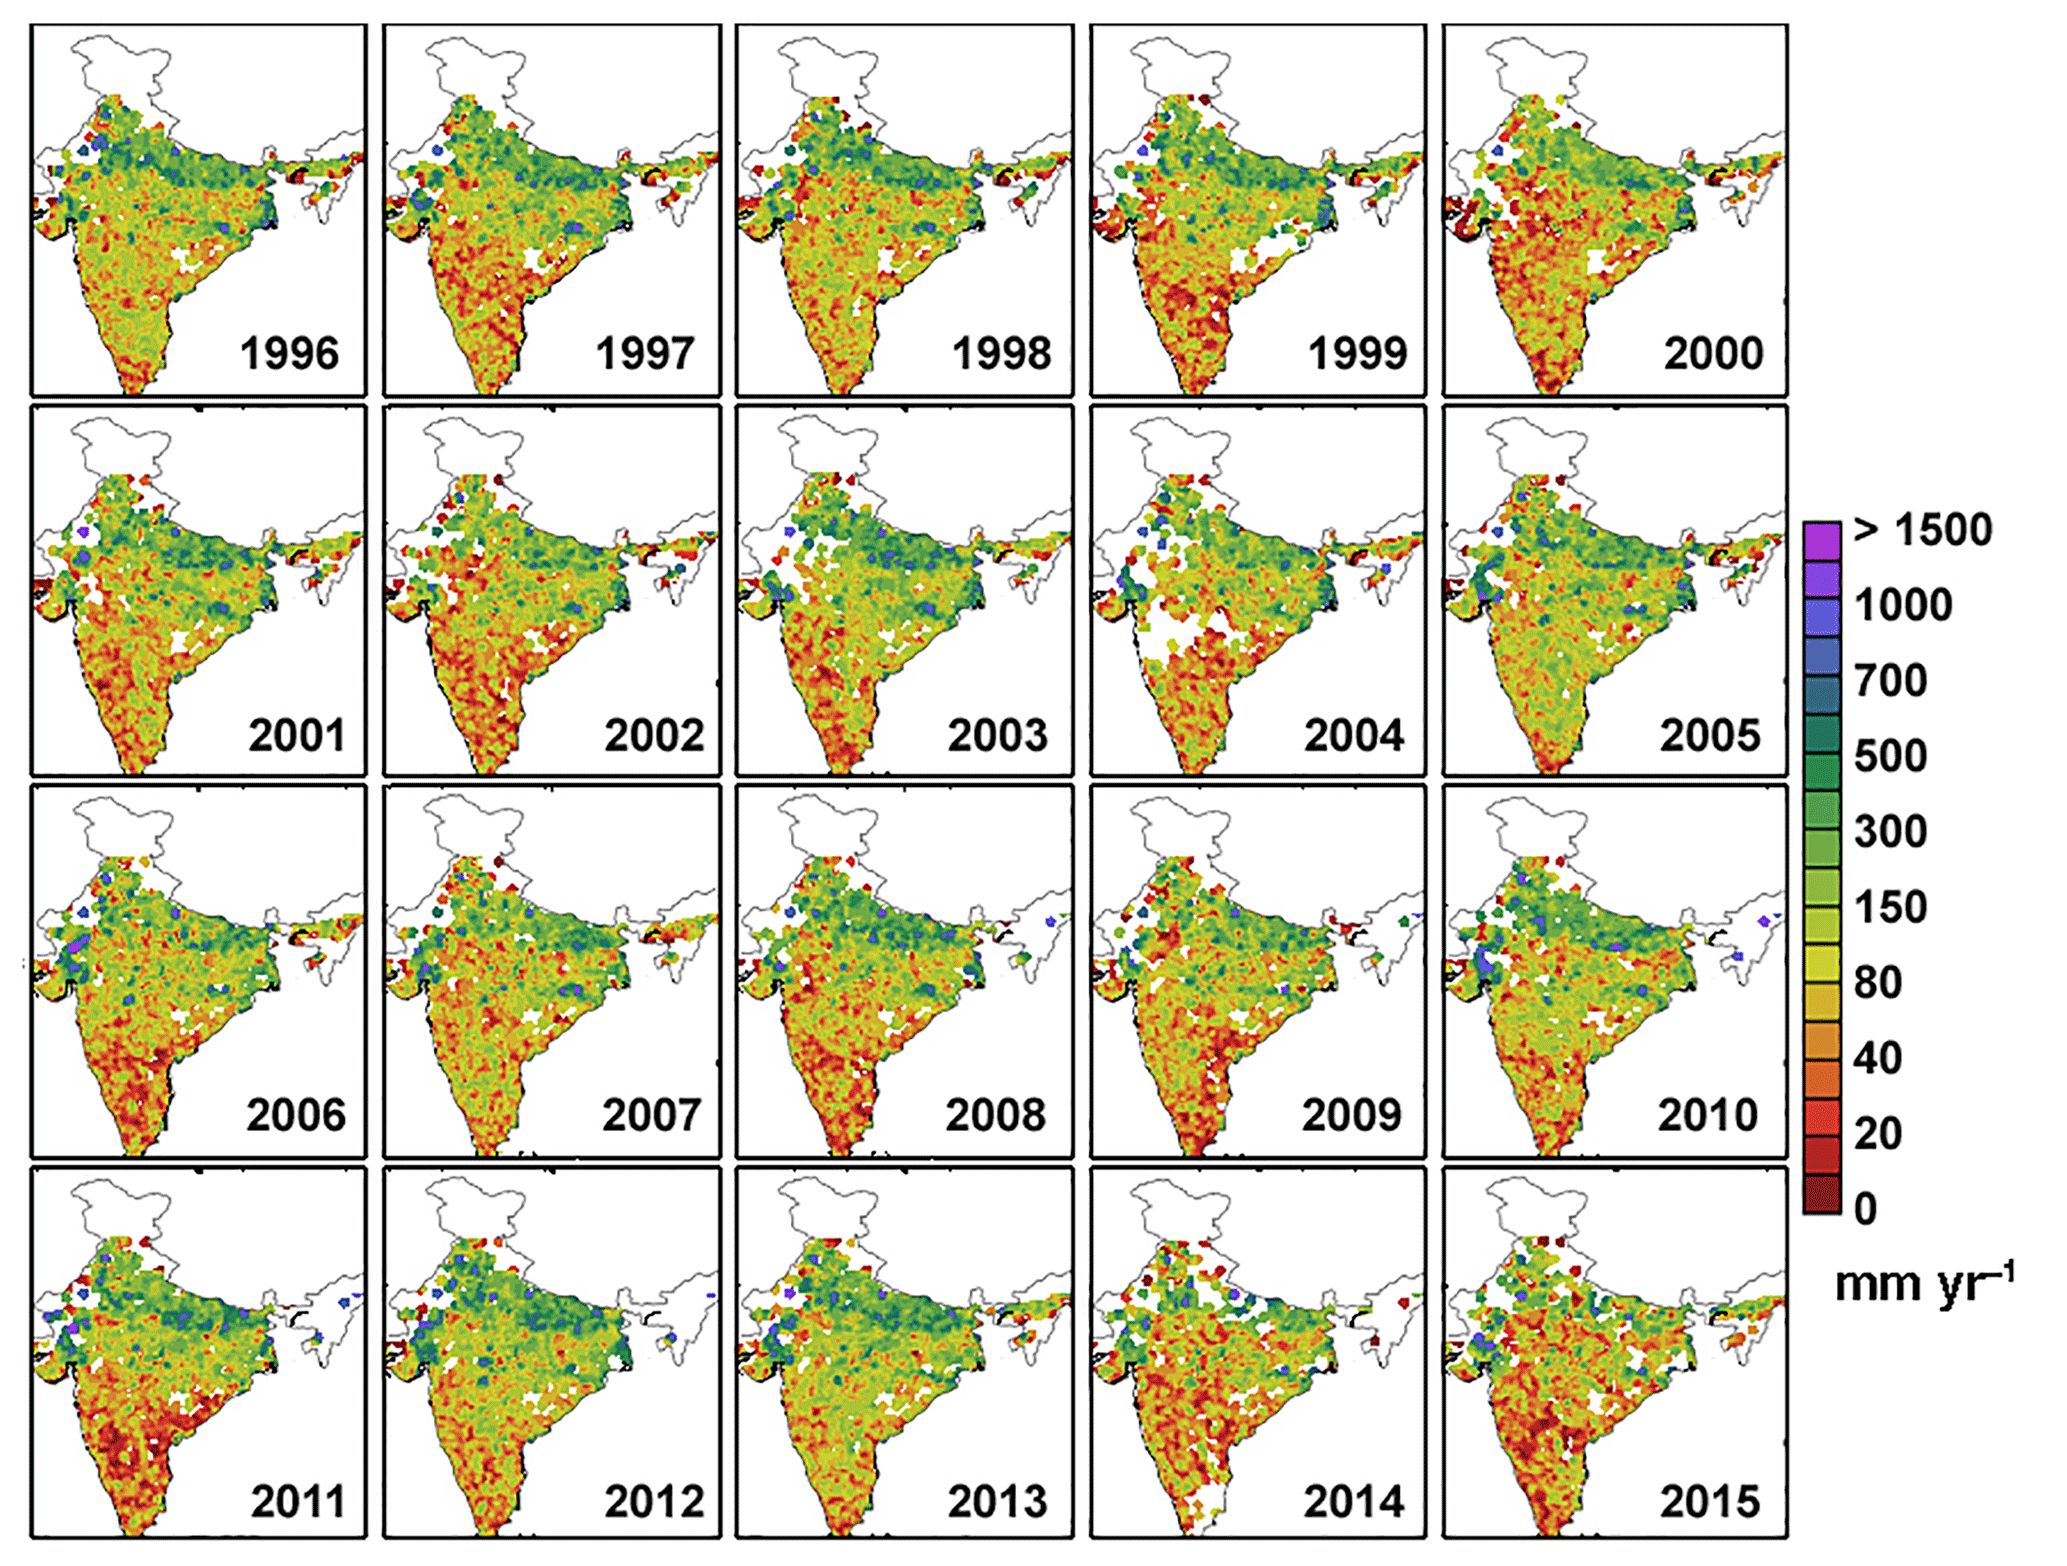
Figure 5Maps showing gridded () groundwater recharge (mm yr−1) calculated using WTF method. Blank areas represent areas of no data availability.
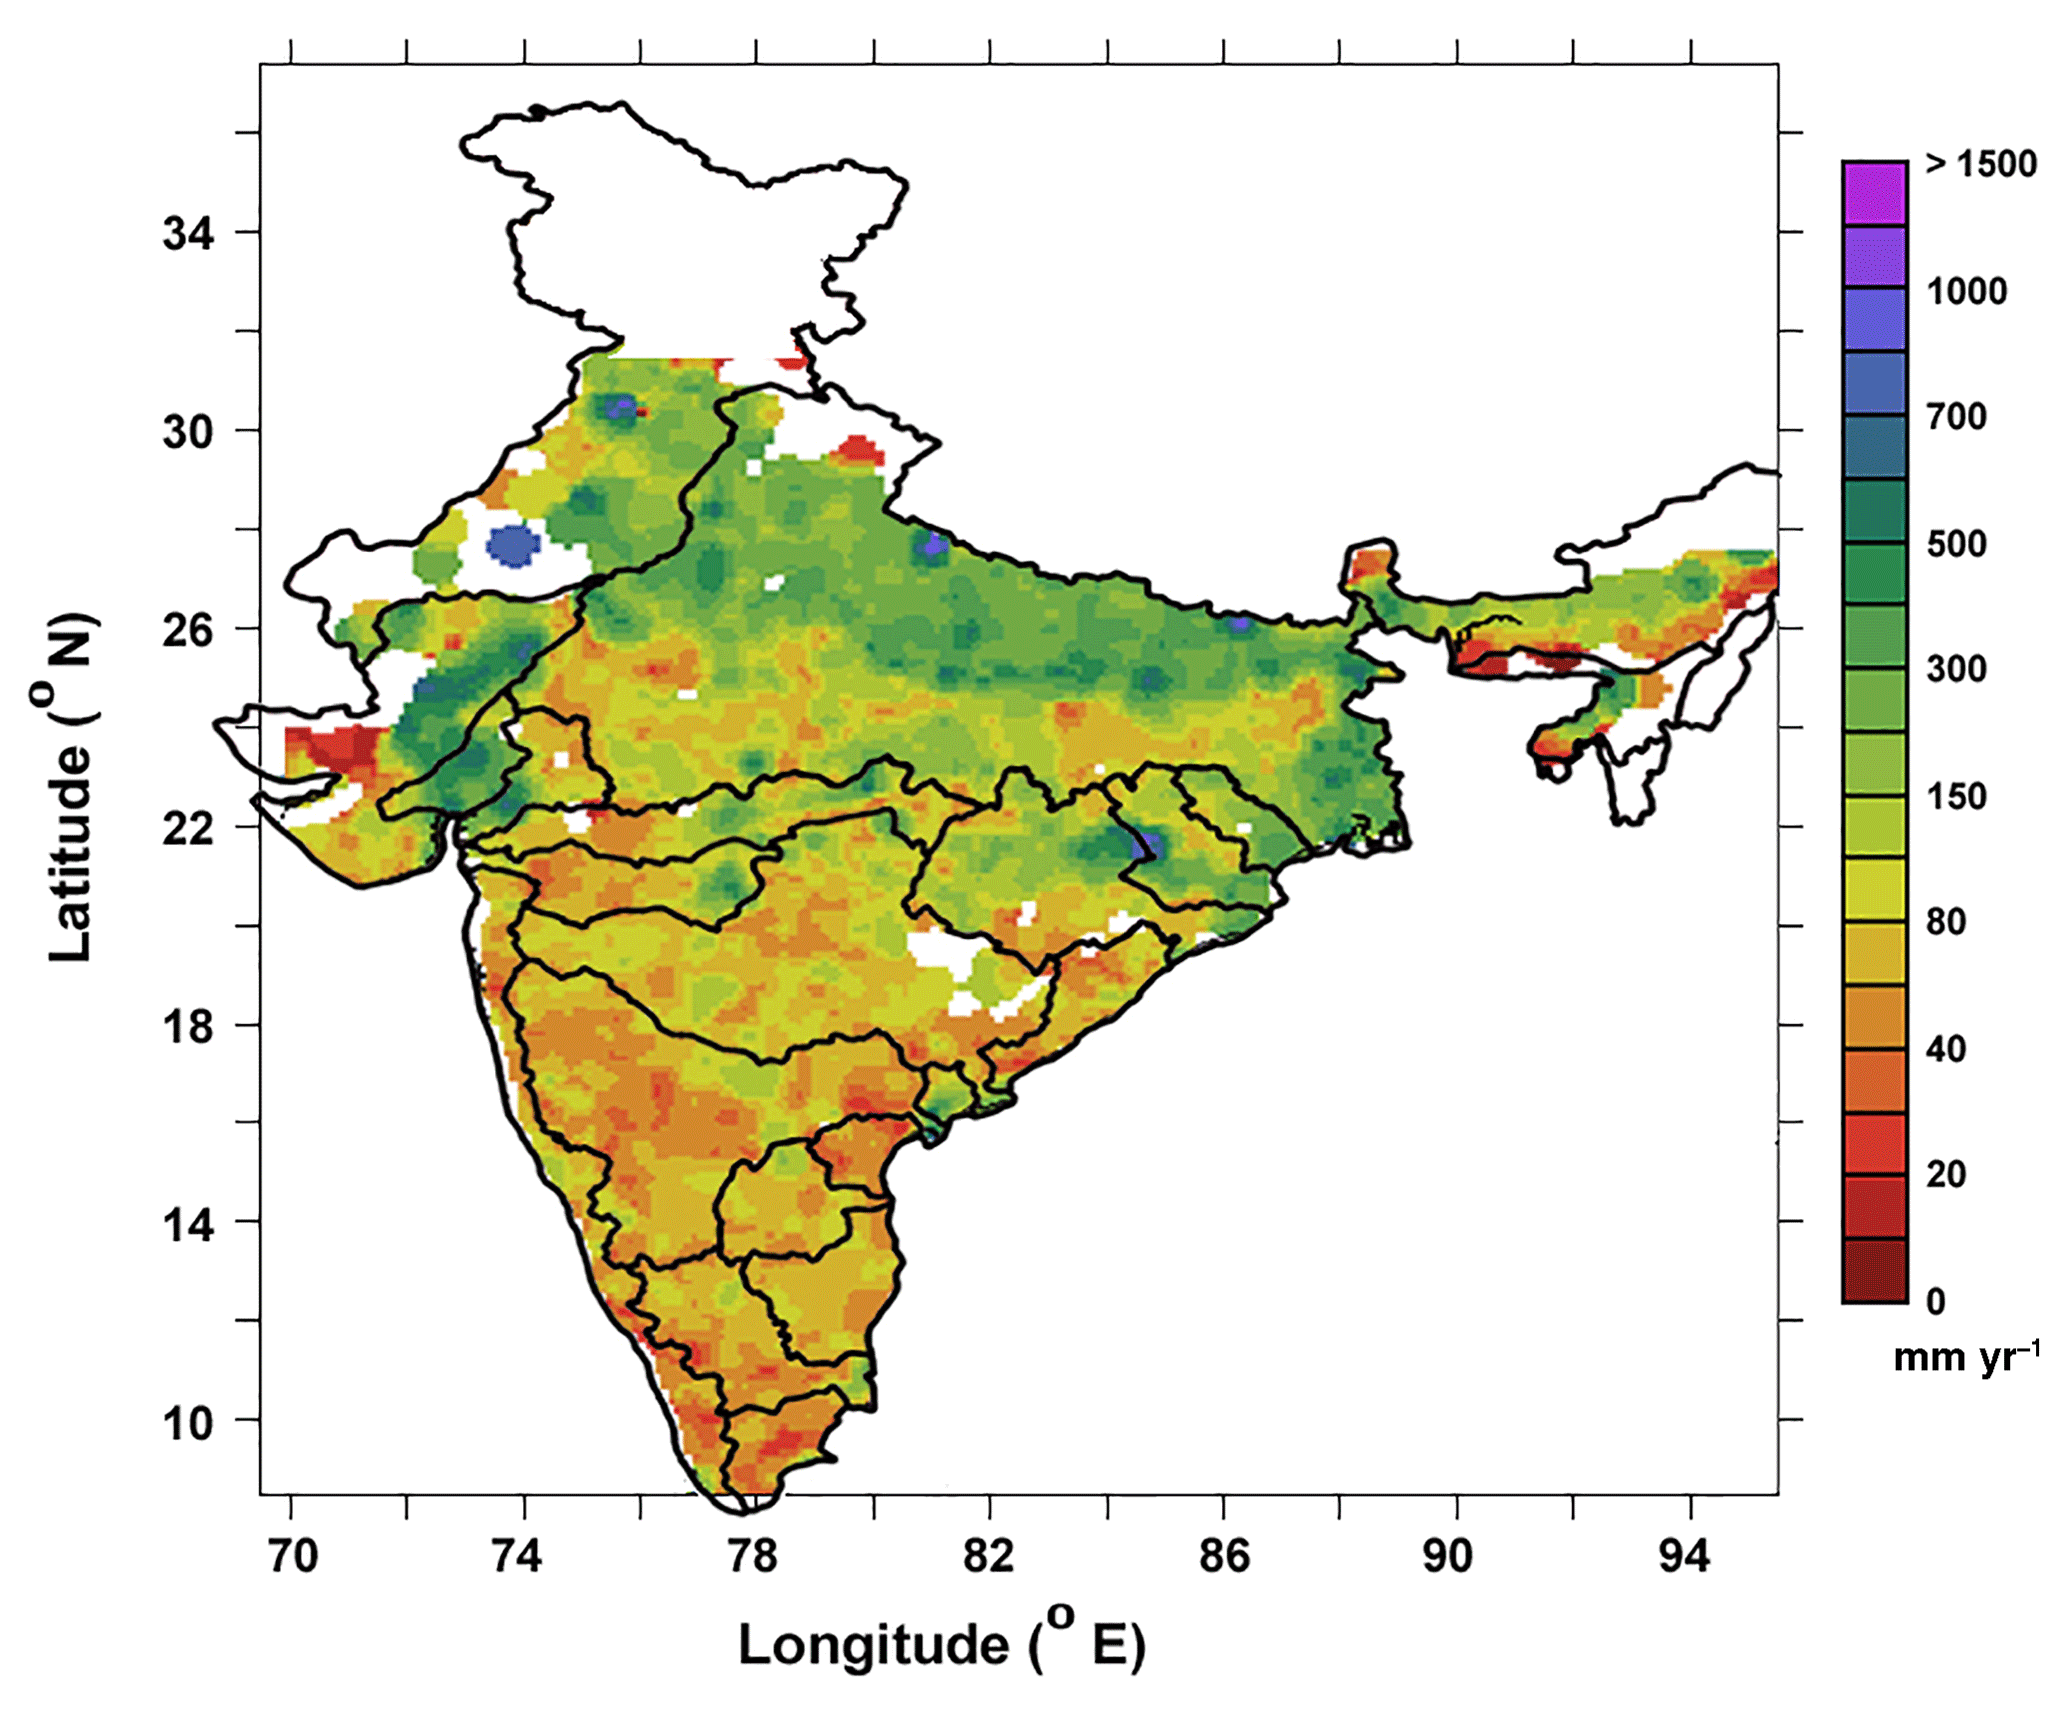
Figure 6Map of mean recharge in the study period (1996–2015). Blank areas represent areas of no data availability.
3.1 Recharge estimates from the water-table fluctuation method
Calculation of the Rg, based on water-level data from 1996 to 2015, exhibits both spatial and temporal variability over the years (Fig. 5). In general, the years of lowest groundwater recharge, i.e., 2002, 2004, 2009 and 2014, correspond to years of lowest precipitation (Figs. 2 and 5). An Rg exceeding 300 mm yr−1 is found over most regions of the IGB basin (Figs. 5 and 6). Central and southern India have been subjected to comparatively lower recharge rates (< 200 mm yr−1). Basin-wide data show highest recharge rates in basins 1, 2a, 2b, 2c, 10, 11, 14 and 20 (Fig. 6; Table 1); parts of the basins are composed of alluvial sediments that are also intensively irrigated and are linked to groundwater withdrawal. The highest annual recharge rate was calculated for 2010 in most basins. High recharge rates in 2010 are attributed to increased space for recharge related to lower precipitation in 2009 (Fig. 2), with 22 out of 26 meteorological subdivisions declared as rainfall deficit in India (National Climate Centre, 2013). Linear regression analysis of recharge rates between 1996 and 2015 show simultaneous occurrence of increased and decreased trends in recharge rates in different parts of India (Fig. 7). Parts of the Ganges basin (basin 2a) have been experiencing rapid declines in recharge rates, while parts of western and northwestern India are experiencing increases in recharge in the study period (Fig. 7). Non-linear trend analysis shows high temporal variation in recharge in all of the studied basins (Fig. 8); maximum recharge amplitudes are found in basins 2b, 2c, 11 and 14 (Fig. 8). The basins are located in comparatively higher precipitation zones of northeastern and western–coastal India, respectively.
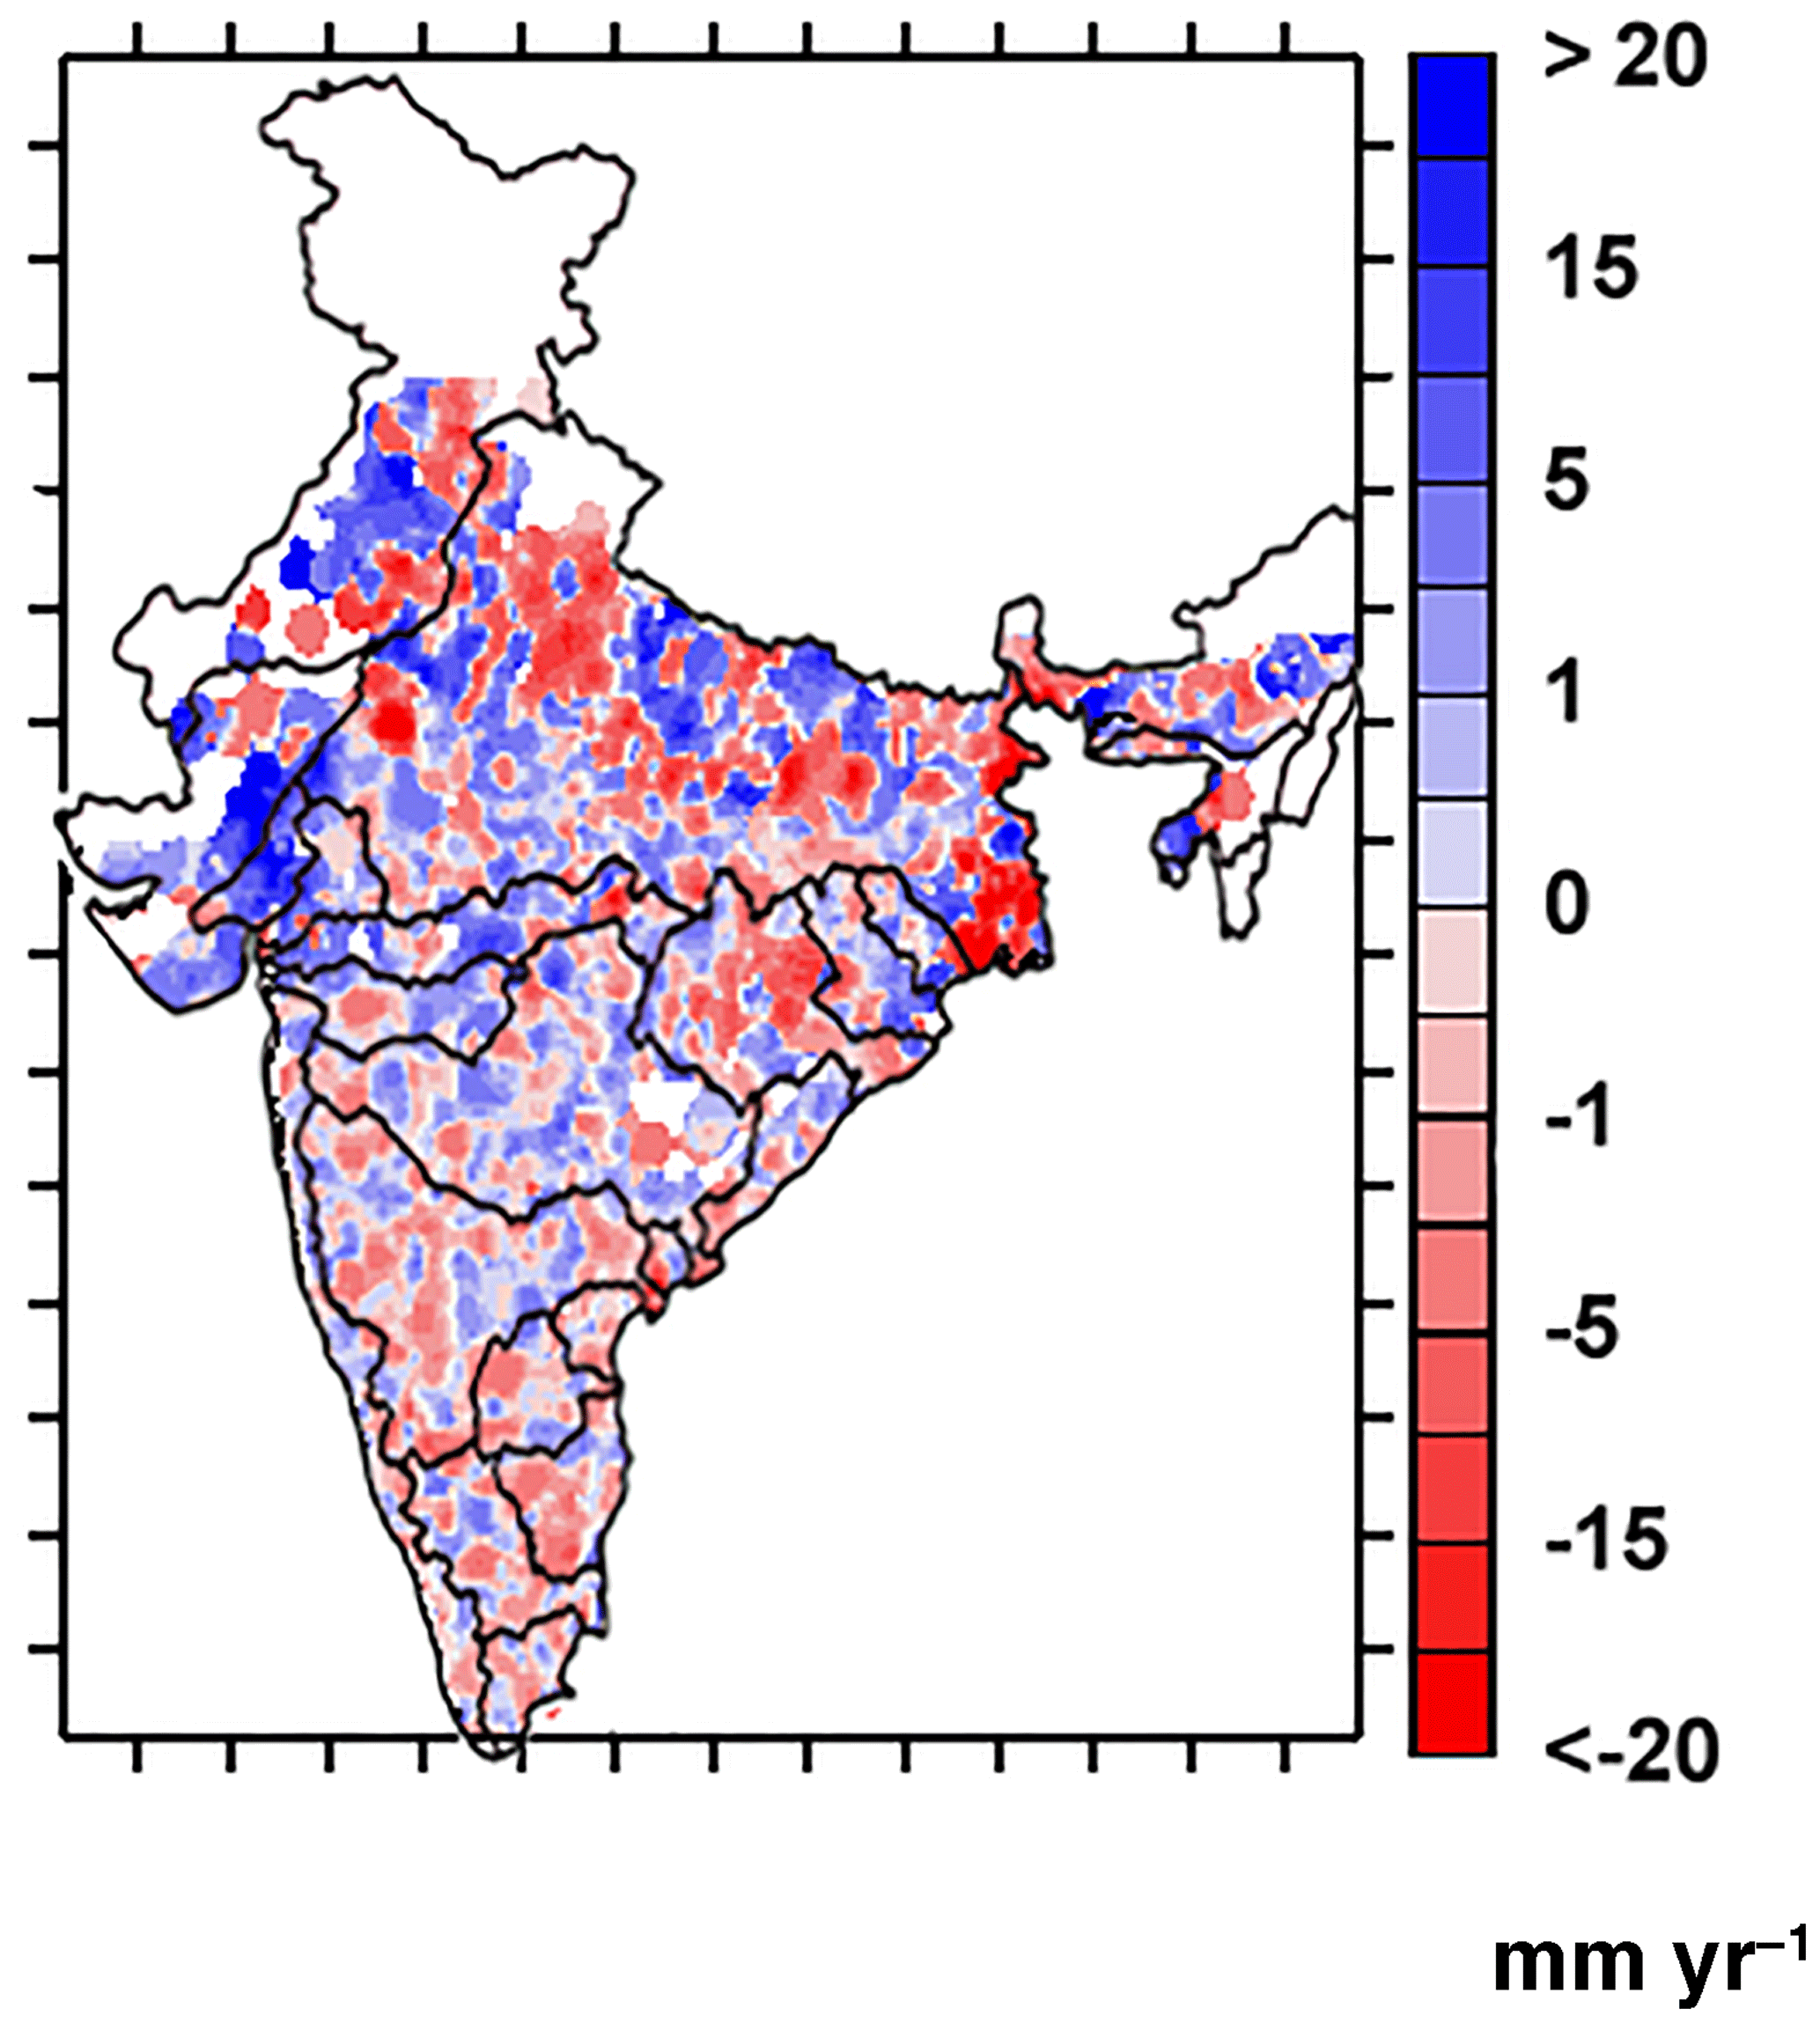
Figure 7Maps of positive and negative trends of groundwater recharge in 1996–2015. Basin boundaries are overlaid. Blank areas represent areas of no data availability.
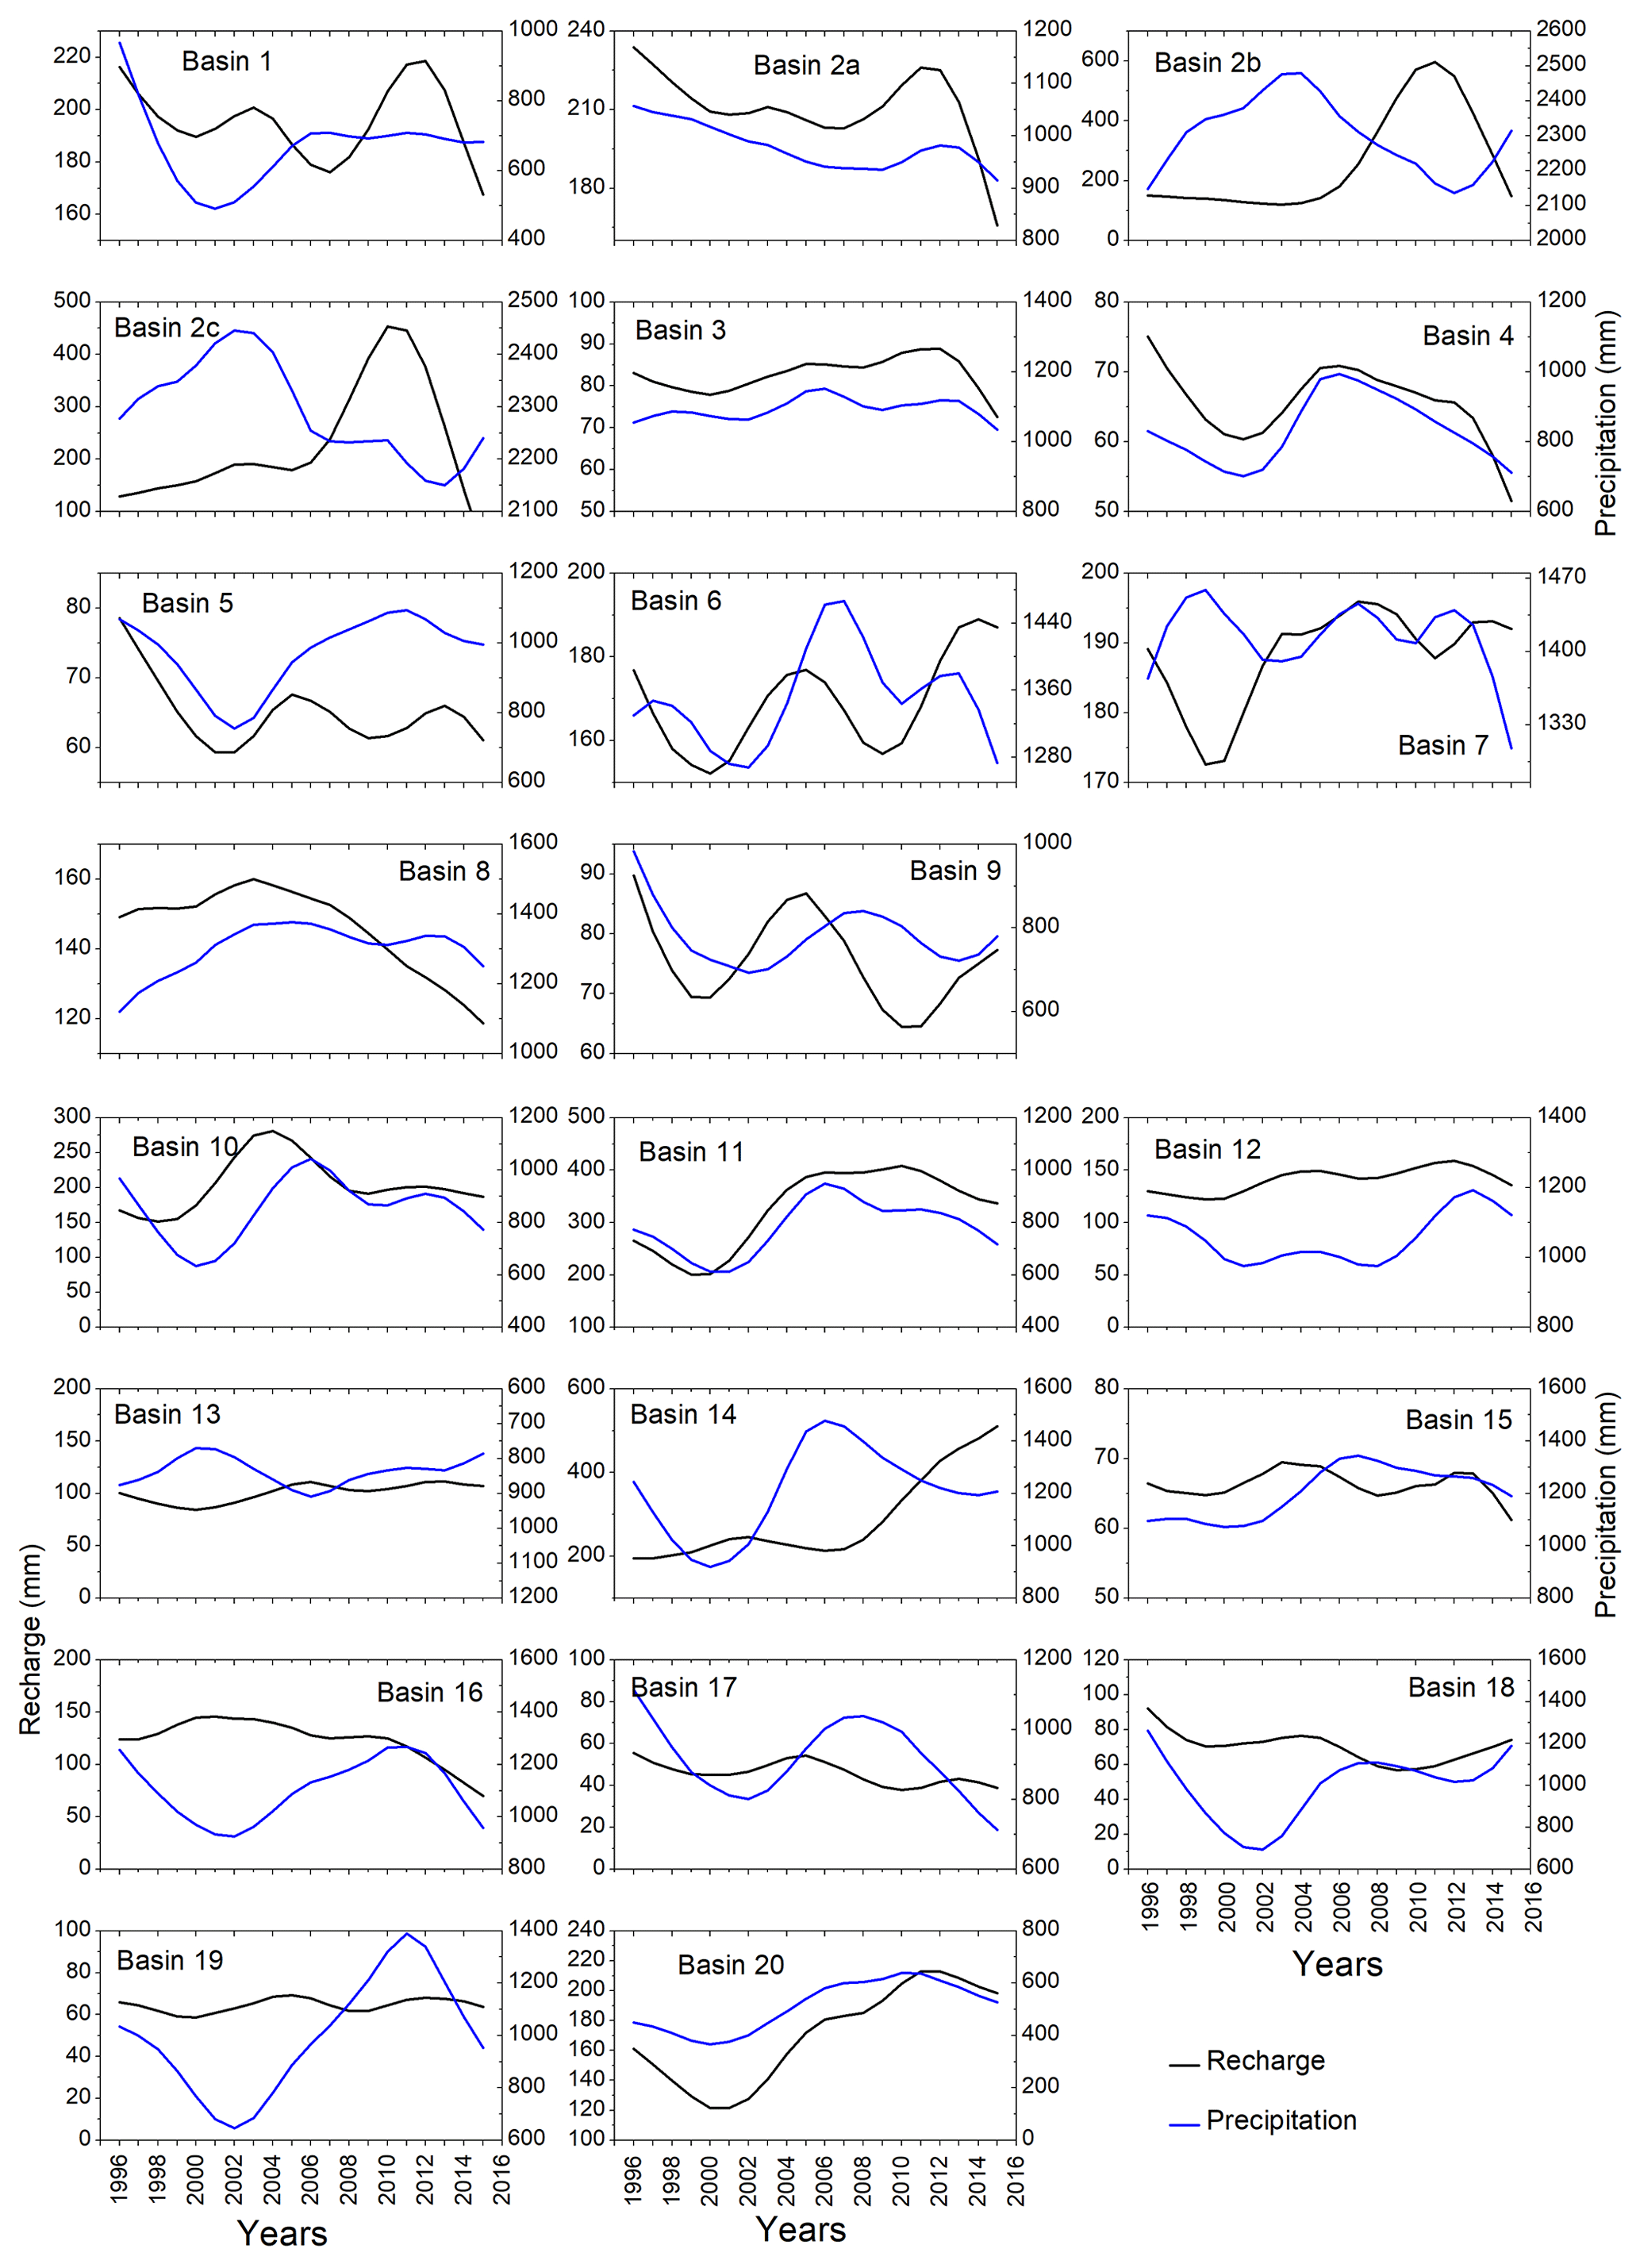
Figure 8Basin-wide estimates of Hodrick–Prescott trend analysis of Rg (mm yr−1) and precipitation (mm yr−1). For basin locations, see Fig. 1.
Table 2Field-scale recharge (Rn) estimates across 52 locations (Fig. 1), river basin ID number, hydrogeology and prevailing precipitation rates (mm yr−1).
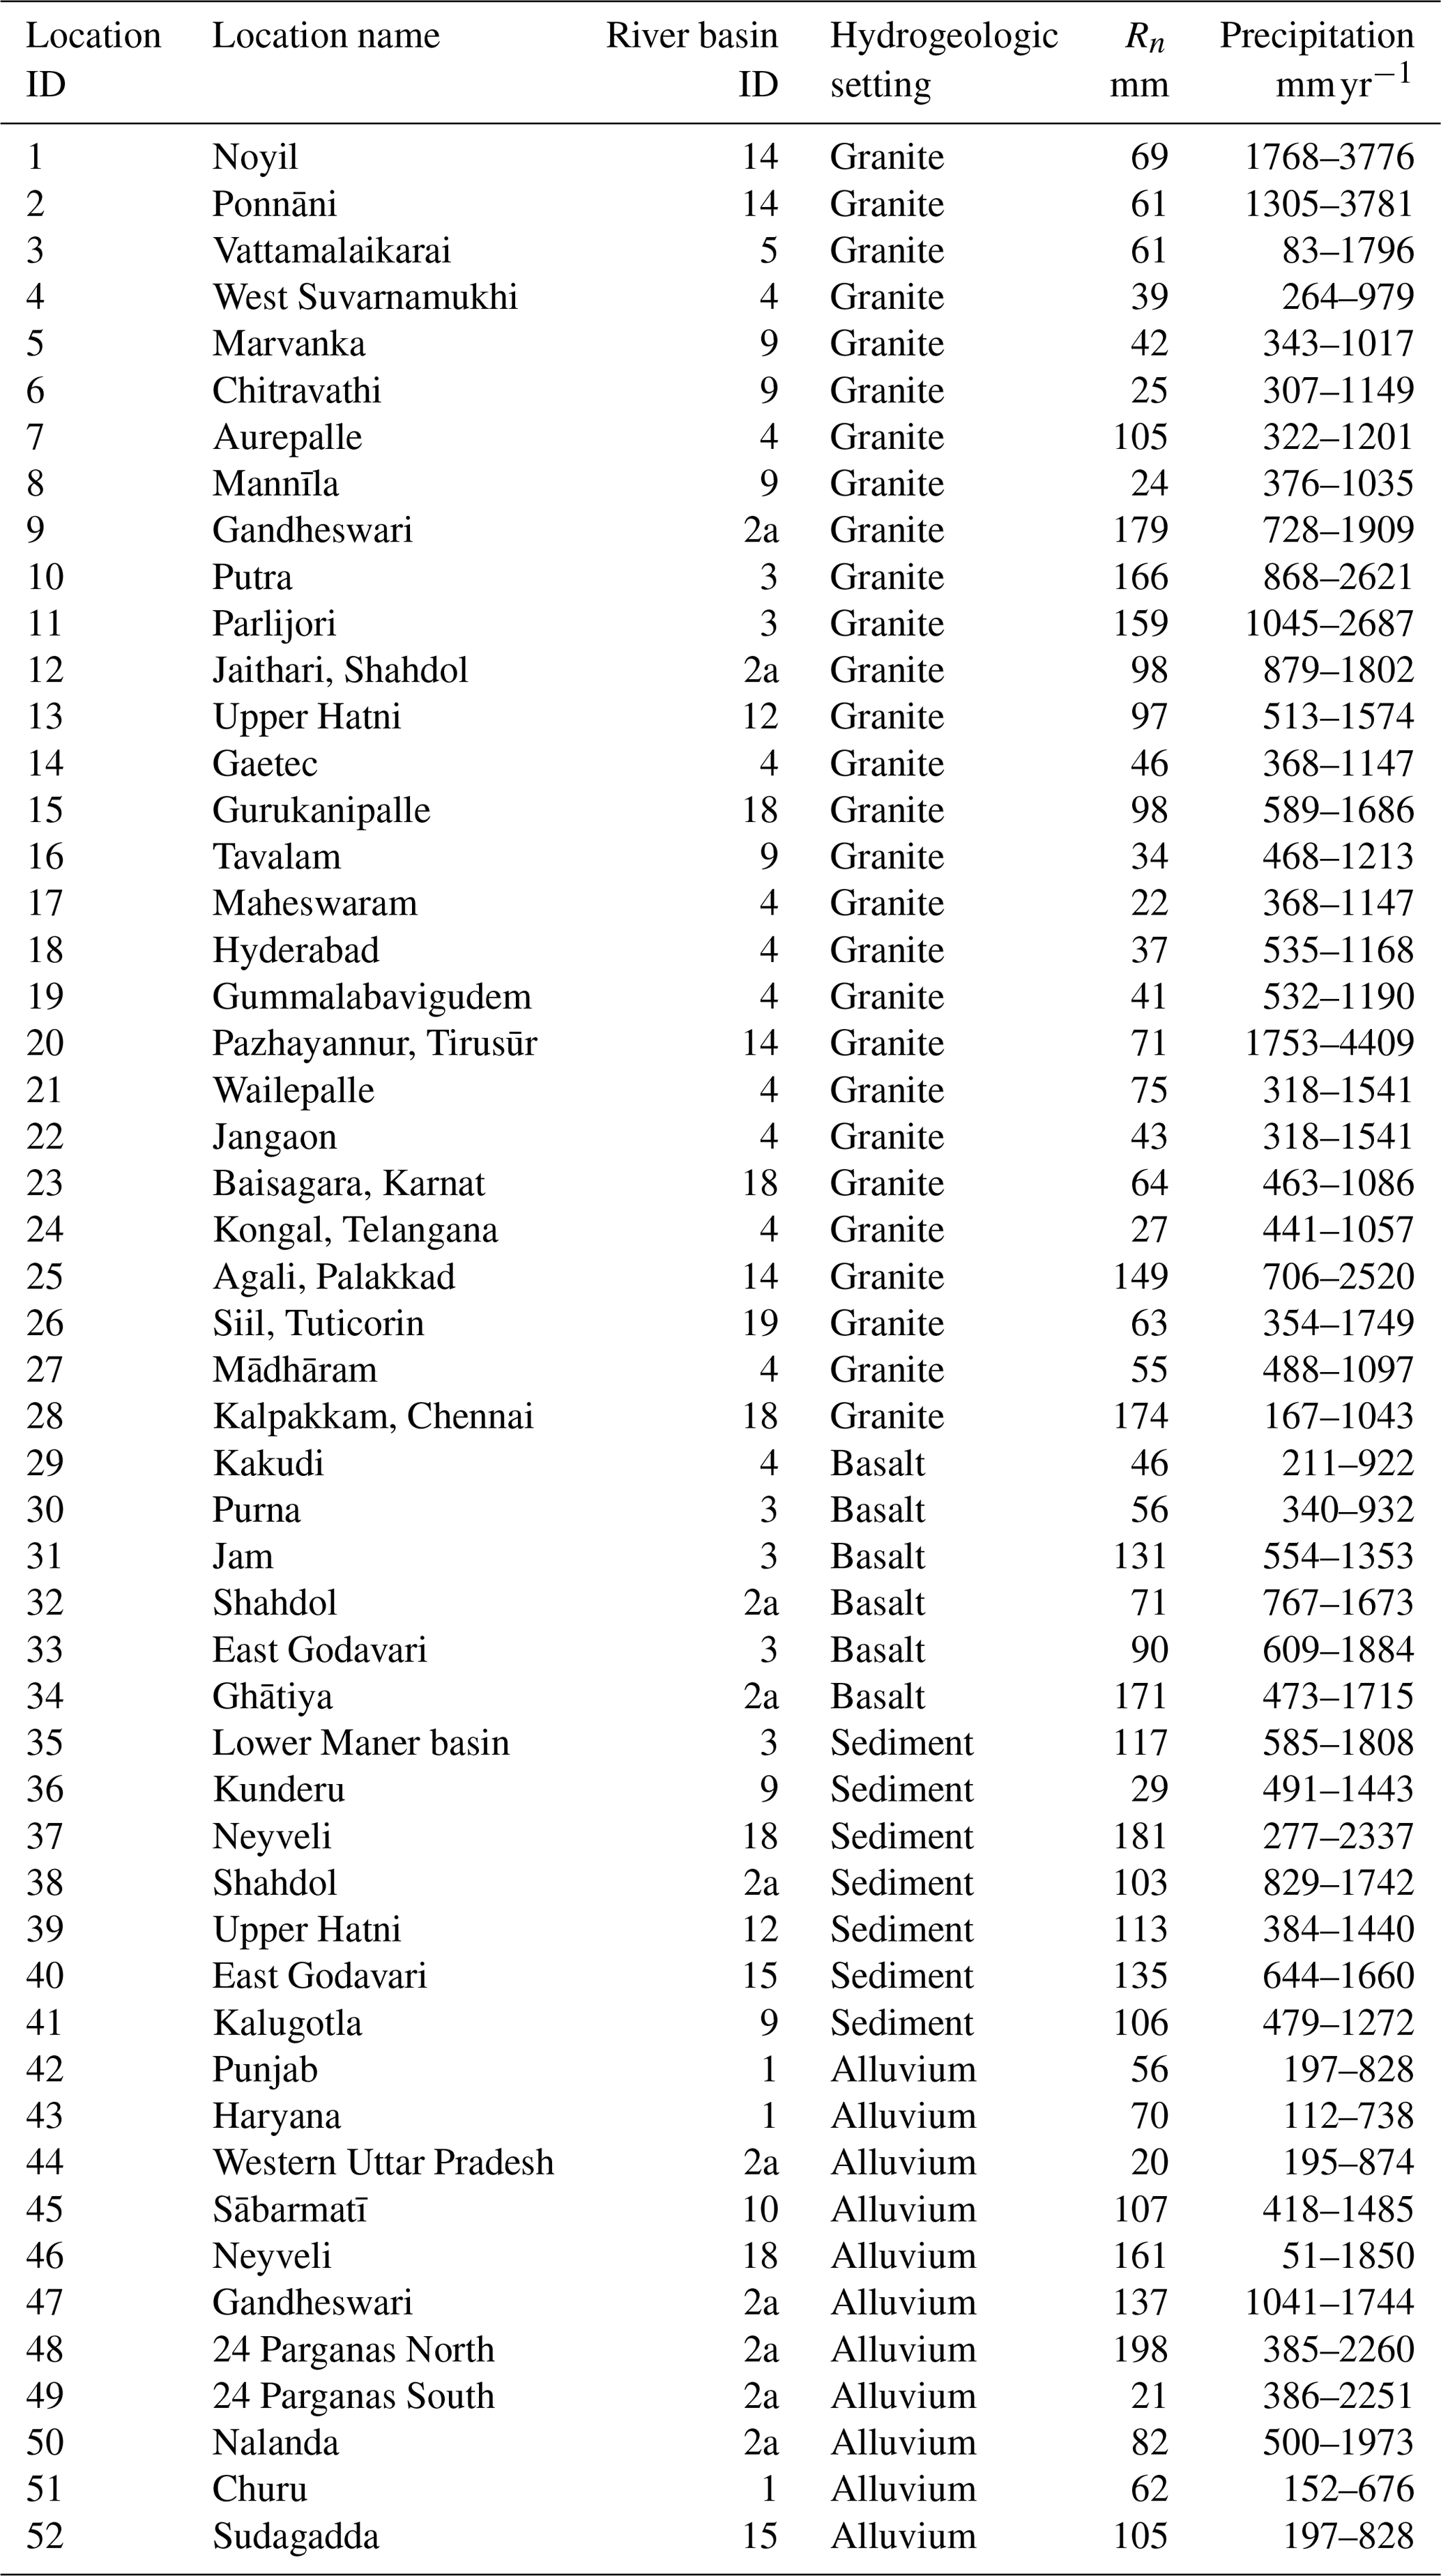
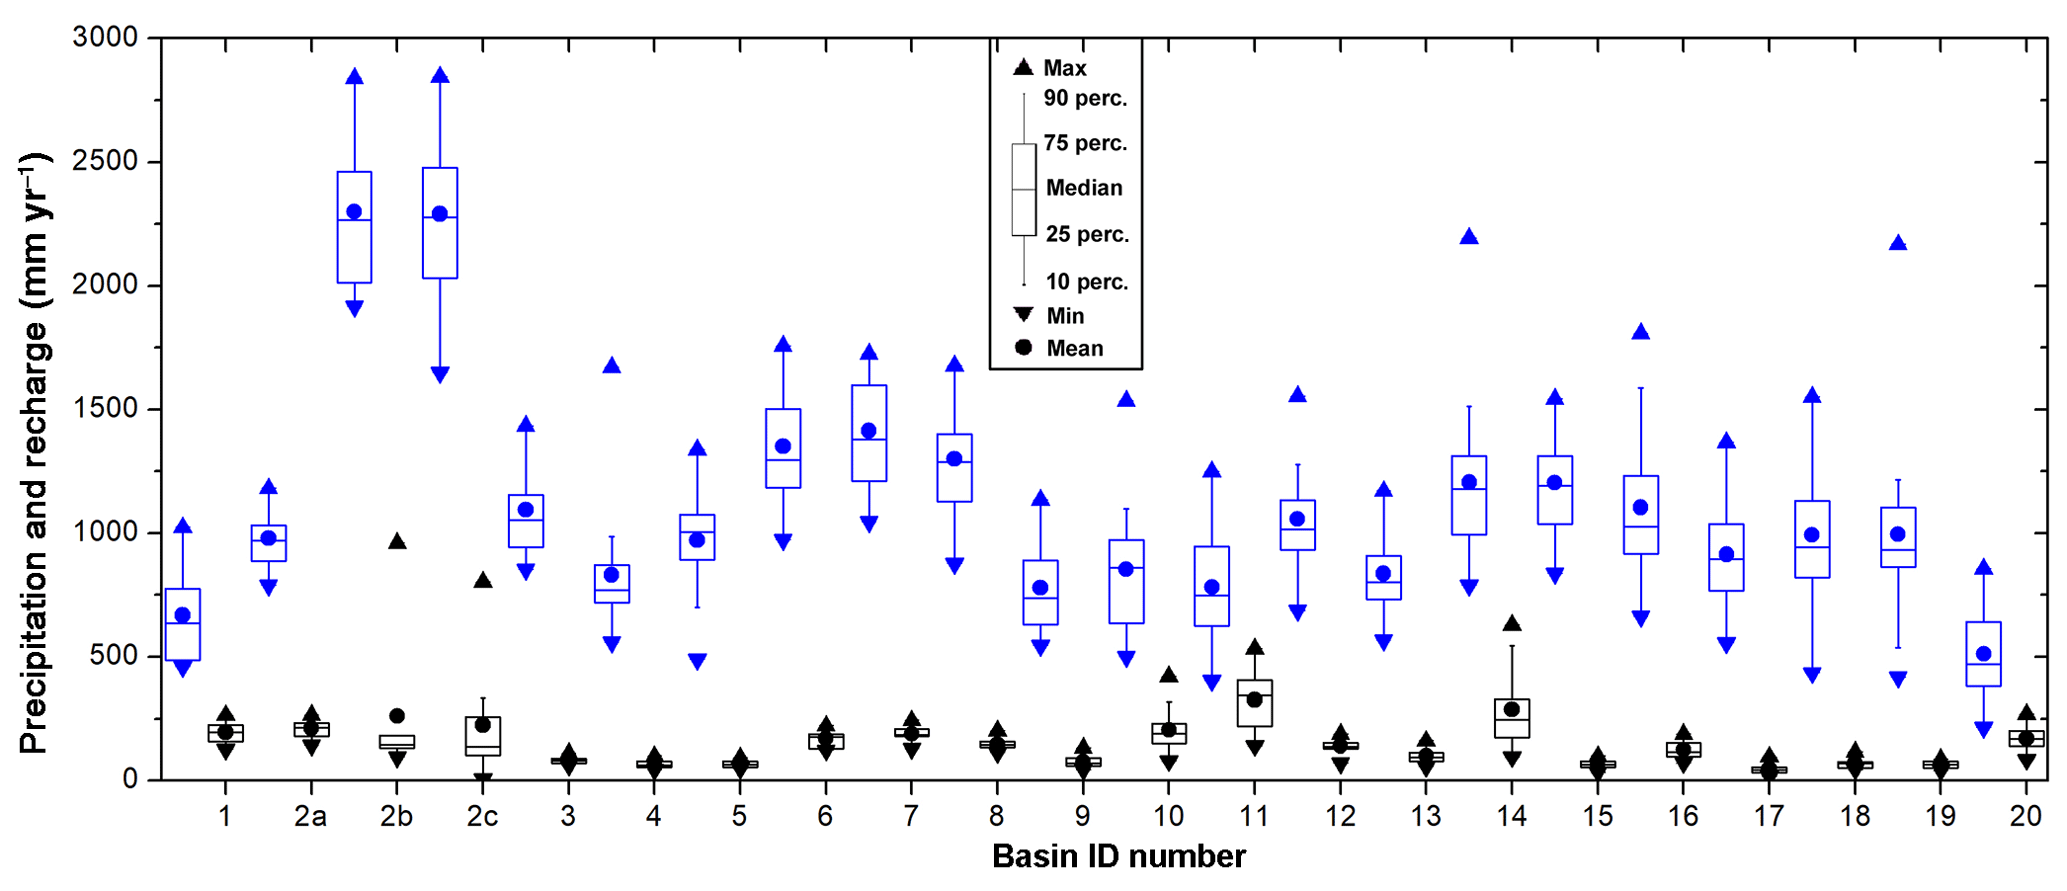
Figure 9Basin-wide box-whisker plot of precipitation (blue) and recharge rates (black). Symbols representing the mean, median, maximum value (max), minimum value (min), 10th percentile, 25th percentile, 75th percentile and 90th percentile are shown in inset of the bottom figure.
3.2 Groundwater recharge estimates as a function of climate, hydrogeology and irrigation
Comparatively higher rates of precipitation partly explain the high recharge rates in the IGB basin. Precipitation data show high annual variability in all of the basins (Fig. 9). Highly fertile sedimentary formations of IGB basin facilitate both direct and indirect recharge. Higher agricultural groundwater withdrawal in the IGB basin (Fig. 4b) leads to decreases in water storage, which can result in increased recharge by generating more recharge space. Subsequently, recharge rates are not homogenous throughout the IGB basins (Figs. 5 and 6). The unconsolidated formations of the IGB basin are highly transmissive for the water flow (transmissivity values varies from 250 to 4000 m2 day−1; Fig. 3). Horizontal hydraulic conductivity values are found to be higher in the IGB basin (hydraulic conductivity varies from 10 to 800 m day−1; Fig. 3). As a result, intense groundwater withdrawal at a region within the IGB basin would have a profound impact on the groundwater storage on the surrounding regions (particularly the areas within the periphery of the pumping influence). This would facilitate the creation of the additional recharge space within the entire region. In contrast, comparatively lower transmissivity and hydraulic conductivity values in aquifers of western, central and southern India restrict water to flow in the horizontal direction (Fig. 3). This inhibits the horizontal flow of water after a pumping event in those regions. Basin-wide mean recharge rates are found to be variable over the years (Fig. 9). Highest interannual variability has been obtained in basins 2b, 2c and 14 (Fig. 9); the basins are also experiencing highest precipitation rates (Table 1; Fig. 9). In contrast, basins located in Indian craton, i.e., basins 3, 4, 5 and 19, exhibit lowest interannual variability (Fig. 9). Lower recharge rates are found in central and southern parts of India (Figs. 5 and 6). The crystalline aquifers in these regions (Mukherjee et al., 2015) are not conducive enough for precipitation-based infiltration through the subsurface. The observation is consistent with Sukhija et al. (1996), who also found a lower recharge rate in fractured regions. Deeply weathered, lateritic soils that have developed on cratons often have low-matrix permeabilities due to concentration of kaolinite and development of ferricretes (laterites; Taylor and Howard, 1999). These low-matrix permeabilities promote infiltration via discontinuities. Soil permeabilities are substantially less than those of the sorted alluvial soils in the IGB basin.
3.3 Comparison with field-scale recharge estimates
We present field-scale recharge rates (Rn; Fig. 1) derived from the tritium injection approach (Rangarajan et al., 2000) in Table 2. The recharge rates were estimated in four different land use types, i.e., granite, basalt, sediment and alluvium. Rn varies within a range of 22–179 mm in locations within granite setting and the values reach 46–171 mm in basalt regions (Table 2 and Fig. 10). Recharge rates are found to be comparatively higher in the sediment and alluvial regions, with rates of 29–181 and 20–198 mm, respectively (Table 2 and Fig. 10). Similarly, Rg values also exhibit higher recharge in sediment and alluvium regions (Fig. 10).

Figure 10Comparison of groundwater recharge rates obtained from the present study (annual range) and some of the earlier studies conducted over the point locations shown in Fig. 1. Recharge estimates exceeding 700 mm yr−1 data are indicated on the top of the column.
Values of Rg from this study compare favorably with site-scale determinations in 42 out of the total 52 locations (Fig. 10). However, the Rg was found to be larger than the recharge rates in location identification (ID) numbers 44, 45, 49 and 50 in Figs. 1 and 10). Three out of four locations are located in IGB basin, which experiences intensive groundwater abstraction for irrigation (Fig. 4b). This discrepancy may be coming from the assumption that direct recharge is only through the unsaturated zone traced by radioisotopes (Healy, 2010). Also, the Rn includes only monsoon recharge, while the Rg includes both monsoon and pre-monsoon recharge that is dominated by the irrigation return flow. Hence, contributions from indirect recharge via irrigation return flows and recharge amplified by dry-season abstraction for irrigation are ignored in Rn estimates. Rg was found to be lower than Rn in some of the locations (location numbers 10, 11, 25, 28, 40 and 46 in Figs. 1 and 10). Each of the six locations is subjected to comparatively lower rates of irrigation-linked groundwater withdrawal (Fig. 4b). Therefore, the irrigation return flow and creation of additional recharge space are almost negligible in these locations. Furthermore, the locations are also experiencing comparatively higher rates of precipitation (Table 2). As the Rg will not consider a fraction of recharge particularly during aquifer full condition (Healy and Cook, 2002), it is likely the major reason for the observation of lower Rg values than Rn values in these six locations.
3.4 Groundwater recharge as a function of precipitation
Recharge rates are significantly (p value <0.01) correlated with precipitation in 10 out of the 22 basins. Non-linear trend analysis between basin-wide recharge rates and precipitation show good match in basins 2a, 3, 4, 12 and 20 (Fig. 8). In contrast, recharge and precipitation trends are negatively correlated in basins 2b, 2c, 7, 16 and 18 (Fig. 8). In order to study the relationship in more detail, we used the Granger causality analysis (Granger, 1988). Results show precipitation significantly (p value <0.01) causes Rg in six basins, i.e., 8, 11, 12, 13, 15 and 16. Most of these basins are not intensively irrigated; groundwater withdrawal rates are found to be lower in these regions, and irrigation groundwater withdrawal was found to be less than 75 mm in all of the basins (Fig. 4b). Therefore, natural processes, i.e., precipitation, still influence recharge rates in those basins. Alternatively, the relationship between recharge and precipitation is statistically insignificant in other basins, which are more intensively irrigated (50 to more than 300 mm; Fig. 4b). As a result, precipitation influence is found to be less dominant in recharge in these regions.
3.5 Assumptions and limitations
Minimal reliance on assumptions in measurement is an advantages of using the WTF method (Healy and Cook, 2002). Furthermore, the method can be followed to estimate recharge for a large region, simultaneously (Healy and Cook, 2002). Uncertainty in groundwater storage coefficients (e.g., Sy) influences the magnitude of computed recharge. In the WTF method, recharge rates exhibit minimum values in groundwater discharge regions. The antecedent recession during the peak groundwater level (Healy and Cook, 2002), which is a component of base flow and discharge, is difficult to measure accurately and hence results in underestimation of recharge during that time.
Groundwater recharge is computed from in situ observations between 1996 to 2015 in 22 major river basins across India. Differential spatial patterns of climate, geology and withdrawal linked to irrigation are the major reasons for spatial heterogeneity in groundwater recharge in India. Higher values (>300 mm yr−1) of groundwater recharge rates are observed in alluvial plains of northern and eastern India. Comparatively higher rates of precipitation, high permeability and intense groundwater abstraction, either alone or in combination, are the major reasons. In contrast, in central and southern India, comparatively lower recharge occurrence is attributed to lower permeability fractured-crystalline cratonic rocks. Comparatively lower precipitation and lower irrigation rates are also influencing recharge rates in those regions. Recharge rates based on WTF compare favorably with independent recharge estimates from tracer data in 42 out of 52 locations. Pre-monsoon time recharge and recharge from the irrigation return flow are the reasons for this mismatch in the four locations within alluvium formation. Controls on recharge include precipitation in less intensively irrigated basins. Results from this study should provide valuable input for policymakers developing more sustainable groundwater management plans.
Groundwater level data were obtained from the Central Ground Water Board (CGWB), Government of India (Central Ground Water Board, 2017). Precipitation data were obtained from the India Meteorological Department (IMD) (http://www.imd.gov.in, India Meteorological Department, 2016).
The supplement related to this article is available online at: https://doi.org/10.5194/hess-23-711-2019-supplement.
SNB and AM conceived the study. SNB retrieved the data and performed the analysis. Tritium injection analysis has been performed by RR. SNB and AM wrote the paper with inputs from RR, BRS, PM and SV.
The authors declare that they have no conflict of interest.
Soumendra N. Bhanja acknowledges the CSIR (Government of India) for their support in providing
the SPM fellowship. Soumendra N. Bhanja also acknowledges U.S. Department of State for the
Fulbright fellowship. We acknowledge the Central Ground Water Board of India and the IMD, India, for the
water-level data and precipitation data, respectively. We thank Robert C. Reedy, UT Austin, for his help with the improvement of the figures. We thank
Charudutta M. Nirmale for his help in data retrieval.
Edited by: Graham Fogg
Reviewed by: two anonymous referees
Athavale, R. N., Rangarajan, R., and Muralidharan, D.: Measurement of natural recharge in India, J. Geol. Soc. India, 39, 235–244, 1992.
Athavale, R. N., Rangarajan, R., and Muralidharan, D.: Influx and efflux of moisture in a desert soil during a one year period, Water Resour. Res., 34, 2871–2877, 1998.
Bhandari, N., Gupta, S. K., Sharma, P., Premsagar, Ayachit, V., and Desai, B. I.: Hydrogeological investigations in Sabarmati basin and coastal Saurashtra using radioisotope methods, Final scientific report, PRL, Ahmedabad, India, 220 pp., 1982.
Bhanja, S. N., Mukherjee, A., Saha, D., Velicogna, I., and Famiglietti, J. S.: Validation of GRACE based groundwater storage anomaly using in-situ groundwater level measurements in India, J. Hydrol., 543, 729–738, https://doi.org/10.1016/j.jhydrol.2016.10.042, 2016.
Bhanja, S. N., Mukherjee, A., Rodell, M., Wada, Y., Chattopadhyay, S., Velicogna, I., Pangaluru, K., and Famiglietti, J. S.: Groundwater rejuvenation in parts of India influenced by water-policy change implementation, Sci. Rep.-UK, 7, 7453, https://doi.org/10.1038/s41598-017-07058-2, 2017a.
Bhanja, S. N., Rodell, M., Li, B., Saha, D., and Mukherjee, A.: Spatio-temporal variability of groundwater storage in India, J. Hydrol., 544, 428–437, https://doi.org/10.1016/j.jhydrol.2016.11.052, 2017b.
Central Ground Water Board: Dynamic groundwater resources, Govt. of India, Ministry of Water Resources, Faridabad, 225 pp., 2009.
Central Ground Water Board: Aquifer Systems of India, Govt. of India, Ministry of Water Resources, Faridabad, 92 pp., 2011.
Central Ground Water Board: Ground Water Year Book, India, 2013–2014, Govt. of India, Ministry of Water Resources, Faridabad, 76 pp., 2014.
Central Ground Water Board: Ground Water level (Post Monsoon 2016) Data, Government of India, available at: http://www.india-wris.nrsc.gov.in/GWL/GWL.html?UType=R2VuZXJhbA==?UName=, last access: 20 June 2017.
Food and Agriculture Organization of the United Nations: FAO Statistical Yearbook 2013, World Food and Agriculture, Rome, 289 pp., 2013.
Goel, P. S., Datta, P. S., Rama, Sanghal, S. P., Hans Kumar, Prakash Bahadur, Sabherwal, R. K., and Tanwar, B. S.: Tritium tracer studies on ground water recharge in the alluvial deposits of Indo-Gangetic plains of western U.P., Punjab and Haryana, in: Proceedings of Indo-German Workshop on Approaches and Methodologies for Development of Ground Water Resources, edited by: Athavale, R. N., NGRI, Hyderabad, 309–322, 1975.
Granger, C. W.: Causality, cointegration, and control, J. Econ. Dyn. Control, 12, 551–559, 1988.
Groundwater Resource Estimation Methodology: Report of the groundwater resource estimation committee, Ministry of Water Resources, Government of India, New Delhi, 1997.
Guhathakurta, P. and Rajeevan, M.: Trends in the rainfall pattern over India, Int. J. Climatol., 28, 1453–1469, 2008.
Healy, R. W.: Estimating groundwater recharge, Cambridge University Press, New York, 245 pp., 2010.
Healy, R. W. and Cook, P. G.: Using groundwater levels to estimate recharge, Hydrogeol. J., 10, 91–109, 2002.
Hodrick, R. J. and Prescott, E. C.. Postwar US business cycles: an empirical investigation, J. Money Credit Bank., 29, 1–16, 1997.
India Meteorological Department: Data Products of NCC, Government of India, available at: http://www.imd.gov.in/advertisements/20170320_advt_34.pdf, last access: 25 May 2016.
MacDonald, A. M., Bonsor, H. C., Ahmed, K. M., Burgess, W. G., Basharat, M., Calow, R. C., Dixit, A., Foster, S. S. D., Gopal, K., Lapworth, D. J., and Lark, R. M.: Groundwater quality and depletion in the Indo-Gangetic Basin mapped from in situ observations, Nat. Geosci., 9, 762–766, 2016.
Mukherjee, A., Fryar, A. E., and Howell, P. D.: Regional hydrostratigraphy and groundwater flow modeling in the arsenic-affected areas of the western Bengal basin, West Bengal, India, Hydrogeol. J., 15, 1397–1418, 2007.
Mukherjee, A., Saha, D., Harvey, C. F., Taylor, R. G., Ahmed, K. M., and Bhanja, S. N.: Groundwater systems of the Indian Sub-Continent, J. Hydrol. Regional Studies, 4, 1–14, 2015.
National Climate Centre: India Meteorological Department, Monsoon report 2012, Pune, 193 pp., 2013.
Rangarajan, R. and Athavale, R. N.: Annual replenishable ground water potential of India – an estimate based on injected tritium studies, J. Hydrol., 234, 38–53, 2000.
Rangarajan, R., Deshmukh, S. D., Prasada Rao, N. T. V., and Athavale, R. N.: Natural recharge measurements in Shahdol district, Madhya Pradesh using injected tritium method, Tech. Report No. NGRI-95-GW-174, Hyderabad, 26 pp., 1995.
Rangarajan, R., Deshmukh, S. D., Ramesh, G. V. ., Prasad, A. L. V., and Athavale, R. N.: Natural recharge studies using injected tritium technique in Bankura, North 24 Paraganas and South 24 Paraganas districts of West Bengal, Hyderabad, Tech. Report No. NGRI-97-GW-214, 45 pp., 1997.
Rangarajan, R., Deshmukh, S. D., Sarma, M. V. B. M., Kesava Ramprasad, B., and Athavale, R. N.: Natural recharge measurements in GAETEC watershed near Hyderabad city, Andhra Pradesh, Tech. Report No. NGRI-98-GW-223, Hyderabad, 25 pp., 1998.
Ravn, M. O. and Uhlig, H.: On adjusting the Hodrick-Prescott filter for the frequency of observations, Rev. Econ. Stat., 84, 371–376, 2002.
Revelle, R. and Lakshminarayana, V.: The Ganges Water Machine, Science, 188, 611–616, 1975.
Scanlon, B. R., Keese, K. E., Flint, A. L., Flint, L. E., Gaye, C. B., Edmunds, W. M., and Simmers, I.: Global synthesis of groundwater recharge in semiarid and arid regions, Hydrol. Process., 20, 3335–3370, 2006.
Scanlon, B. R., Mukherjee, A., Gates, J., Reedy, R. C., and Sinha, A. K.: Groundwater recharge in natural dune systems and agricultural ecosystems in the Thar Desert region, Rajasthan, India, Hydrogeol. J., 18, 959–972, 2010.
Shamsudduha, M., Taylor, R. G., Ahmed, K. M., and Zahid, A.: The impact of intensive groundwater abstraction on recharge to a shallow regional aquifer system: evidence from Bangladesh, Hydrogeol. J., 19, 901–916, 2011.
Siebert, S., Henrich, V., Frenken, K., and Burke, J.: Update of the global map of irrigation areas to version 5, University of Bonn/FAO, Bonn, Germany, Rome, Italy, 10, 2660–6728, 2013.
Sukhija, B. S., Nagabhushanam, P., and Reddy, D. V.: Groundwater recharge in semi-arid regions of India: an overview of results obtained using tracers, Hydrogeol. J., 4, 50–71, 1996.
Taylor, R. G. and Howard, K. W. F.: Lithological evidence for the evolution of weathered mantles in Uganda by tectonically controlled cycles of deep weathering and stripping, Catena, 35, 65–94, 1999.
Tukey, J. W.: Exploratory Data Analysis, Addison-Wesley, Reading, Massachusetts, 1977.
World Bank and Government of India: India-water resources management sector review: groundwater regulation and management report, World Bank Government of India, Washington D.C., New Delhi, 1998.
Zaveri, E., Grogan, D. S., Fisher-Vanden, K., Frolking, S., Lammers, R. B., Wrenn, D. H., Prusevich, A., and Nicholas, R. E.: Invisible water, visible impact: groundwater use and Indian agriculture under climate change, Environ. Res. Lett., 11, 084005, https://doi.org/10.1088/1748-9326/11/8/084005, 2016.