the Creative Commons Attribution 4.0 License.
the Creative Commons Attribution 4.0 License.
 | 14 Feb 2019
Influence of three phases of El Niño–Southern Oscillation on daily precipitation regimes in China
Aifeng Lv
Bo Qu
Shaofeng Jia
Wenbin Zhu
In this study, the impacts of the El Niño–Southern Oscillation (ENSO) on daily precipitation regimes in China are examined using data from 713 meteorological stations from 1960 to 2013. We discuss the annual precipitation, frequency and intensity of rainfall events, and precipitation extremes for three phases (eastern Pacific El Niño – EP, Central Pacific El Niño – CP, and La Niña – LN) of ENSO events in both ENSO developing and ENSO decaying years. A Mann–Whitney U test was applied to assess the significance of precipitation anomalies due to ENSO. Results indicated that the three phases each had a different impact on daily precipitation in China and that the impacts in ENSO developing and decaying years were significantly different. EP phases caused less precipitation in developing years but more precipitation in decaying years; LN phases caused a reverse pattern. The precipitation anomalies during CP phases were significantly different than those during EP phases, and a clear pattern was found in decaying years across China, with positive anomalies over northern China and negative anomalies over southern China. Further analysis revealed that anomalies in frequency and intensity of rainfall accounted for these anomalies in annual precipitation; in EP developing years, negative anomalies in both frequency and intensity of rainfall events resulted in less annual precipitation, while in CP decaying years, negative anomalies in either frequency or intensity typically resulted in reduced annual precipitation. ENSO events tended to trigger extreme precipitation events. In EP and CP decaying years and in LN developing years, the number of very wet day precipitation (R95 p), the maximum rainfall in 1 day (), and the number of consecutive wet days (CWD) all increased, suggesting an increased risk of flooding. On the other hand, more dry spells (DSs) occurred in EP developing years, suggesting an increased likelihood of droughts during this phase. Possible mechanisms responsible for these rainfall anomalies are speculated to be the summer monsoon and tropical cyclone anomalies in ENSO developing and decaying years.


The El Niño–Southern Oscillation (ENSO), a coupled ocean–atmosphere phenomenon in the tropical Pacific Ocean, exerts enormous influence on climate around the world (Zhou and Wu, 2010). Traditionally, ENSO events can be divided into a warm phase (El Niño) and a cool phase (La Niña – LN) based on sea surface temperature (SST) anomalies. An El Niño produces warming SSTs in the central and eastern Pacific, while La Niña produces an anomalous westward shift in warm SSTs (Gershunov and Barnett, 1998). Precipitation appears especially susceptible to ENSO events over a range of spatio-temporal scales and has therefore been the focus of many ENSO-related studies (Lü et al., 2011). Global annual rainfall over the land drops significantly during El Niño phases (Gong and Wang, 1999), and a wetter climate occurs in eastern Asia during El Niño winters due to a weaker-than-normal winter monsoon (Wang et al., 2008), but these anomalies are generally reversed during La Niña phases. Various studies also extensively document the teleconnections between ENSO and precipitation variation in China (Huang and Wu, 1989; Lin and Yu, 1993; Gong and Wang, 1999; Zhou and Wu, 2010; Lü et al., 2011; Zhang et al., 2013; Ouyang et al., 2014). Zhou and Wu (2010) found that El Niño phases induced anomalous strong southwesterly winds in winter along the southeastern coast of China, contributing to an increase in rainfall over southern China. In the summer after an El Niño, less rainfall occurs over the Yangtze River, while excessive rainfall occurs in northern China (Lin and Yu, 1993). During La Niña phases, annual precipitation anomalies are spatially opposite of those during El Niño phases in China (Ouyang et al., 2014). Typically, ENSO events progress over the previous winter and into the following spring and summer, thus influencing the climate of China or other areas in both the developing and decaying years (Ropelewski and Halpert, 1987; Lü et al., 2011). There was also a significant time lag in the responses of climate in China to ENSO evolution (Wu et al., 2004). The delayed response of climate variability to ENSO provides valuable information for making regional climate predictions (Lü et al., 2011).
ENSO events are well known for causing extreme hydrological events (Moss et al., 1994; Chiew and McMahon, 2002; Veldkamp et al., 2015) such as floods (Mosley, 2000; Räsänen and Kummu, 2013; Ward et al., 2014) and droughts (Zhang et al., 2015), which in turn cause broad-ranging socio-economic and environmental impacts. Various approaches have been introduced to reveal these impacts at global and regional scales. For example, Ward et al. (2014) examined peak daily discharge in river basins across the world to identify flood-vulnerable areas sensitive to ENSO. Water storage is an index typically used to detect the frequency and magnitude of droughts during ENSO events (Veldkamp et al., 2015; Zhang et al., 2015).
The physical mechanisms by which ENSO affects the climate of eastern Asia have also been discussed extensively in recent decades. Many studies have revealed that anomalous summer monsoons contribute to rainfall anomalies in eastern Asia during ENSO. A wet eastern Asian summer monsoon tends to occur after warm eastern or central equatorial Pacific SST anomalies during the previous winter (Chang et al., 2000). Floods and droughts during ENSO are also associated with the anomalous water vapor transport caused by the anomalous summer monsoon (Chang, 2004). On the other hand, tropical cyclones (TCs) over the western North Pacific (WNP) are also key contributors to rainfall events in China. When TCs move westward, a huge amount of moisture is transported into eastern Asia, accompanied by strong winds and heavy and continuous rainfall. By using satellite-derived Tropical Rainfall Measuring Mission (TRMM) data, Guo et al. (2017) revealed that TCs occurring during the peak TC season (from July to October – JASO) contributed ∼ 20 % of monthly rainfall and ∼ 55 % of daily extreme rainfall over the eastern Asian coast. Strong TC activity suggests that there is excessive transport of water vapor into China.
Until recently, most studies have focused on changes in annual or seasonal total precipitation related to ENSO rather than changes in individual precipitation events. Changes in precipitation frequency and intensity are crucial for accurate assessment of ENSO impacts, but changes in mean precipitation cannot identify such changes. Recently, however, possible shifts in the characteristics of precipitation events (e.g., frequency and intensity) have been highlighted in studies of global climate change (Fowler and Hennessy, 1995; Karl et al., 1995; Gong and Wang, 2000). In China, it has been reported that the number of wet days per year decreased in recent decades, even while total annual precipitation has changed very little (Zhai et al., 2005). Precipitation intensity has also changed significantly across China (Qu et al., 2016), and, as a result, drought and flood events occur more frequently (Zhang and Cong, 2014). Thus, separating the impacts of ENSO events on precipitation frequency and intensity is critical to understanding ENSO-precipitation teleconnections in China. Although the link between hydrological extremes and ENSO is usually discussed in the context of the physical mechanisms that influence local precipitation (Zhang et al., 2015), direct precipitation indices such as the number of consecutive wet days and dry spells have rarely been addressed in these studies. Thus, our knowledge of how daily precipitation extremes respond to ENSO events is still very limited and requires a comprehensive set of precipitation indices that describe ENSO-induced precipitation extremes. A number of recent studies suggest that a new type of El Niño should be defined that is different from the canonical El Niño (Ren and Jin, 2011). This newly discovered El Niño develops in regions of warming SSTs in the Pacific near the International Date Line (McPhaden et al., 2006) and has been called the “Date Line El Niño” or “central Pacific (CP) El Niño.” Studies have revealed that the CP El Niño appears to induce climate anomalies around the globe that are distinctly different than those produced by the canonical eastern Pacific (EP) El Niño (Yeh et al., 2009). In addition, CP El Niño has been occurring more frequently in recent decades (Yu and Kim, 2013). Despite a long-term focus on ENSO-climate teleconnections, relatively little attention has been paid to the impacts of the new CP El Niño in China.
The current study aimed to provide a better understanding of how daily precipitation responds to the ENSO events over China. The main objectives of this work are to document (1) any changes in daily rainfall in China during three phases of ENSO events, (2) the number and duration of precipitation extremes occurring in ENSO developing and decaying years, (3) anomalous summer monsoon and TC activity induced by ENSO, and their relationships with rainfall anomalies. We discuss the total precipitation anomaly, anomalies of precipitation frequency and intensity patterns, and changes in precipitation extremes and propose possible mechanisms responsible for the various rainfall anomalies.
In this study, we used daily values of climate Chinese surface stations compiled by the National Meteorological Center in China. This dataset (http://data.cma.cn/, last access: 25 June 2016) comprises detailed spatial coverage of precipitation across China, but only 400 stations were operational in the 1950s (Xu et al., 2011). Non-climatic noise can complicate the accuracy of the dataset analysis (Qu et al., 2016). Stations that experienced observation errors, missing values, or data homogeneity problems were omitted from analysis in this study, according to similar methods used by Qian and Lin (2005). Of the 819 meteorological stations across China, data from 713 were ultimately selected for analysis, which covered the time period 1960–2013 (Fig. 1). Precipitation indices were calculated based on daily observations at the stations (Table 1). Annual total precipitation, as well as intensity and frequency of daily precipitation events, were used to formulate precipitation characteristics. Four other indices were introduced (Zhang et al., 2011) and used to analyze precipitation extremes in this study (Table 1). Precipitation indices were calculated for ENSO developing and decaying years. Indices for precipitation anomalies (Aij, the i precipitation index at the j meteorological station) were analyzed as follows:
where is the average of the i precipitation index at the j meteorological station during a specific time period, and is the average of the i precipitation index at the j station for a multi-year average (1971–2000).
To quantify the variability of the summer monsoon and ENSO impacts over China, the monsoon index proposed by Wang and Fan (1999) was used in this study. It is defined as the 850 hPa wind speed averaged over 5–15∘ N, 100–130∘ E, minus the wind speed averaged over 20–30∘ N, 110–140∘ E, and is frequently used to study interannual and decadal variability of summer monsoons over the western North Pacific and eastern Asian region (WNP-EA). For TC activity, the best-track dataset from the Joint Typhoon Warning Center was obtained at http://www.metoc.navy.mil/jtwc/jtwc.html (last access: 22 August 2018). Following the methods by Kim et al. (2011), the TC genesis and track density were generated for ENSO developing and decaying years for the period 1960–2013. Track density anomalies are defined as the annual average TC frequency during a specific type of ENSO event minus the long-term mean value in each grid box.

Figure 1Distribution of the 713 meteorological stations used in this study. China is divided into four regions based on climatic type. The two non-monsoon regions are the continental climate zone (northwest – NW) and the highland climate zone (Tibetan Plateau – TP). The monsoon region is divided into two regions: the tropical and subtropical monsoon zone (south – S) and the temperate monsoon zone (north – N).
Table 1Definitions of precipitation indices used in this study.
∗ 95th percentile of multi-year daily precipitation is the 95th quantile of the daily precipitation distribution over 1971–2000 (percentiles near 100 represent extremely intense precipitation).
In this study, two indices, created by Ren and Jin (2011) by transforming the traditionally used Niño 3 and Niño 4 indices, were used to distinguish between CP and EP El Niño phases. La Niña years were identified using the methods of McPhaden and Zhang (2009). The ENSO events (1960–2013) analyzed in this study are displayed in Table 2. As an EP El Niño evolves, positive SST anomalies expand latitudinally and negative signals expand eastward, reaching a maximum amplitude in autumn and winter (Feng et al., 2011). The first year was defined as the developing year of an EP El Niño in this study. Warm SST anomalies disappear and are replaced by cool anomalies in the eastern Pacific during summer of the next year (defined as the decaying year). Similarly, the emerging and vanishing years of CP El Niño and La Niña events are defined as the developing and decaying years, respectively.
The significance of ENSO-induced precipitation anomalies is tested using a Mann–Whitney U approach. The Mann–Whitney U test is a nonparametric test applied to the site data which do not conform to normality even after several transformations are performed (Teegavarapu et al., 2013). It tests whether two series are independent from each other. One series represents precipitation during an ENSO event phase (EP, CW, or LN), while the other series represents precipitation during average years. This test was applied to evaluate the significance of precipitation anomalies at a significance level of 5 %.
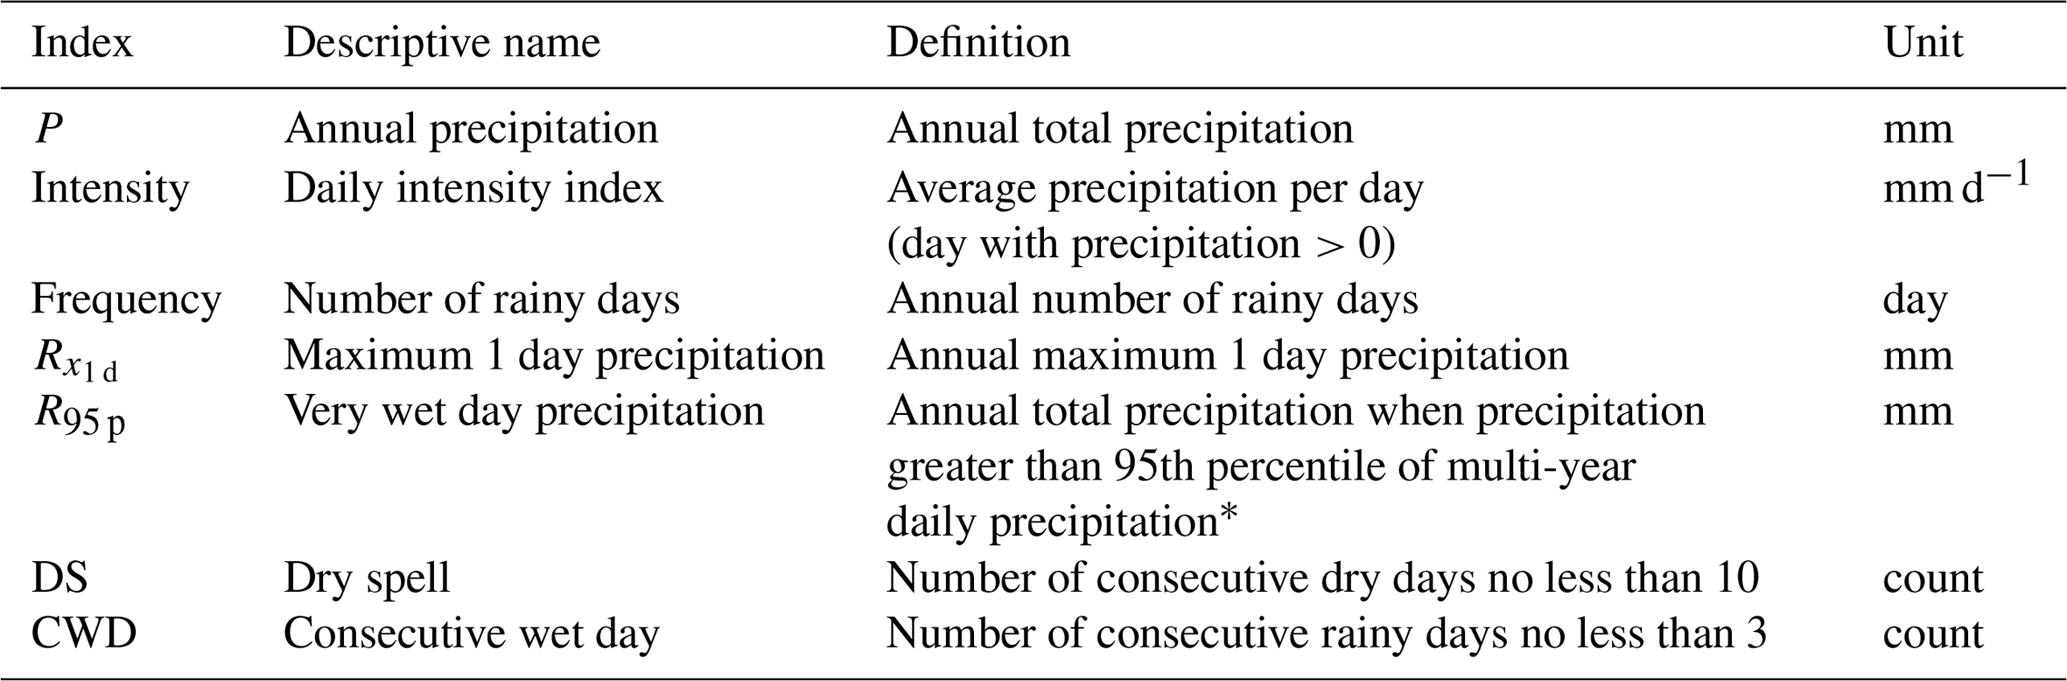
Figure 2Anomalies of annual precipitation in developing years (a) and decaying years (b) of EP, CP, and LN phases. Stations experiencing significant anomalies are represented by large points. The percentage of stations experiencing increases or decreases in the number of rainfall anomalies are shown in (c), with significant increase (blue), increase (light blue), decrease (light red), and significant decrease (red). Y1 and Y2 represent developing years and decaying years, respectively.
3.1 Annual rainfall anomalies
In EP developing years, 628 stations across China (∼ 80 %) had negative anomalies, and for 80 of these stations the anomalies were significant. These significant stations were mainly located in the continental climate zone (NW) and the temperate monsoon zone (N; Fig. 2). All subregions experienced negative average annual precipitation anomalies (Fig. 3), especially in the NW region, where precipitation was 12.83 % lower than the mean. Large positive anomalies of annual precipitation were found during LN developing years (Fig. 2); more than 70 % of the stations showed positive anomalies, of which 10 % were significant. Similarly, the stations with significant anomalies were mainly in the NW and N regions. In CP developing years, precipitation anomalies were quite different from those in EP developing years (Fig. 2). The proportion of stations with negative anomalies was 57 %, but with no clear pattern of distribution.
The impacts of EP phases on precipitation in decaying and developing years displayed opposite patterns. Positive anomalies were detected across China during decaying years (Fig. 2), especially in the NW and N regions at 8.8 % and 8.9 % higher than the mean, respectively (Fig. 3). And negative anomalies were common across China in LN decaying years (Fig. 2). In the NW region, average annual precipitation was 5.95 % lower than the mean. These results suggested that in both the decaying years of EP and the developing years of LN, more water vapor would be transported from the Pacific Ocean to China, while in the decaying years of LN and the developing years of EP, drier conditions would prevail. In the CP decaying phases, average annual precipitation in the NW, Tibetan Plateau (TP), and N regions was much greater than the mean but was lower than the mean in the subtropical monsoon zone (S; Fig. 3).

Figure 3Average annual precipitation anomaly by subregion during EP, CP, and LN phases. Light green represents developing years, and dark green represents decaying years.
3.2 Rainfall frequency and intensity anomalies
In EP developing years, only negative anomalies of precipitation intensity and frequency occurred, with decreases of 3.04 % and 3.01 %, respectively, across all of China (Fig. 6). Stations with significant decreases in precipitation frequency were mainly located in the NW region (Fig. 4), and stations with significant decreases in precipitation intensity were mainly located in the N region (Fig. 5). In contrast, anomalies of precipitation intensity and frequency in EP decaying years were positive, presenting a reverse pattern to the developing phase. Anomalies of precipitation intensity and frequency were also positive in LN developing years, with stations of significance concentrated in the N region.
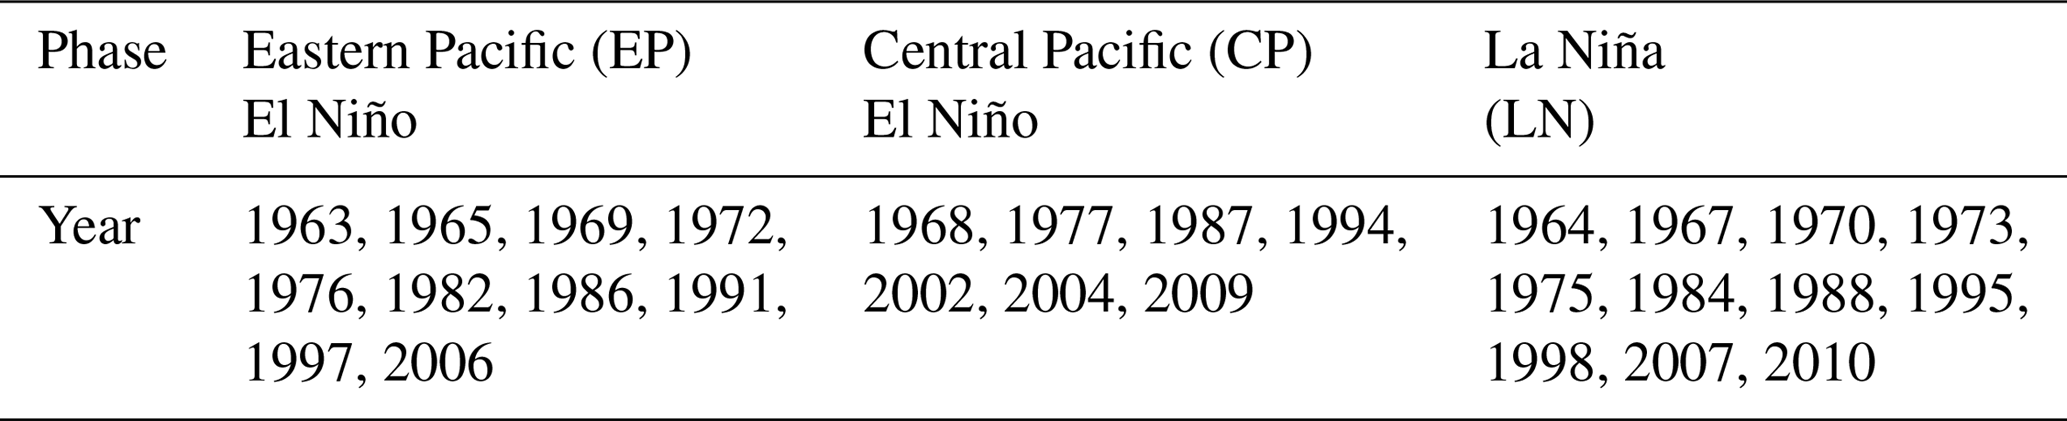
Figure 4Anomalies of precipitation frequency in developing years (a) and decaying years (b) of EP, CP, and LN phases. Stations experiencing significant anomalies are represented by large points. The percentage of stations experiencing anomalies of precipitation frequency are shown in (c), with significant increase (blue), increase (light blue), decrease (light red), and significant decrease (red). Y1 and Y2 represent developing years and decaying years, respectively.
In the CP phases, anomalies of precipitation intensity and frequency displayed more complex patterns than those in the EP years. In developing years, slightly more than half of the stations experienced positive anomalies of precipitation intensity (Fig. 5), while more than 70 % experienced negative anomalies in precipitation frequency (Fig. 4). Of the stations experiencing negative precipitation frequency anomalies, 64 were significant (Fig. 4) and were concentrated in the S and N regions (Fig. 4). Precipitation frequency anomalies also formed a clear distribution pattern in CP decaying years (Fig. 4). Of all the meteorological stations, 145 (20 %) experienced significant negative anomalies and were concentrated in the S region. In contrast, all regions experienced positive anomalies of precipitation intensity.
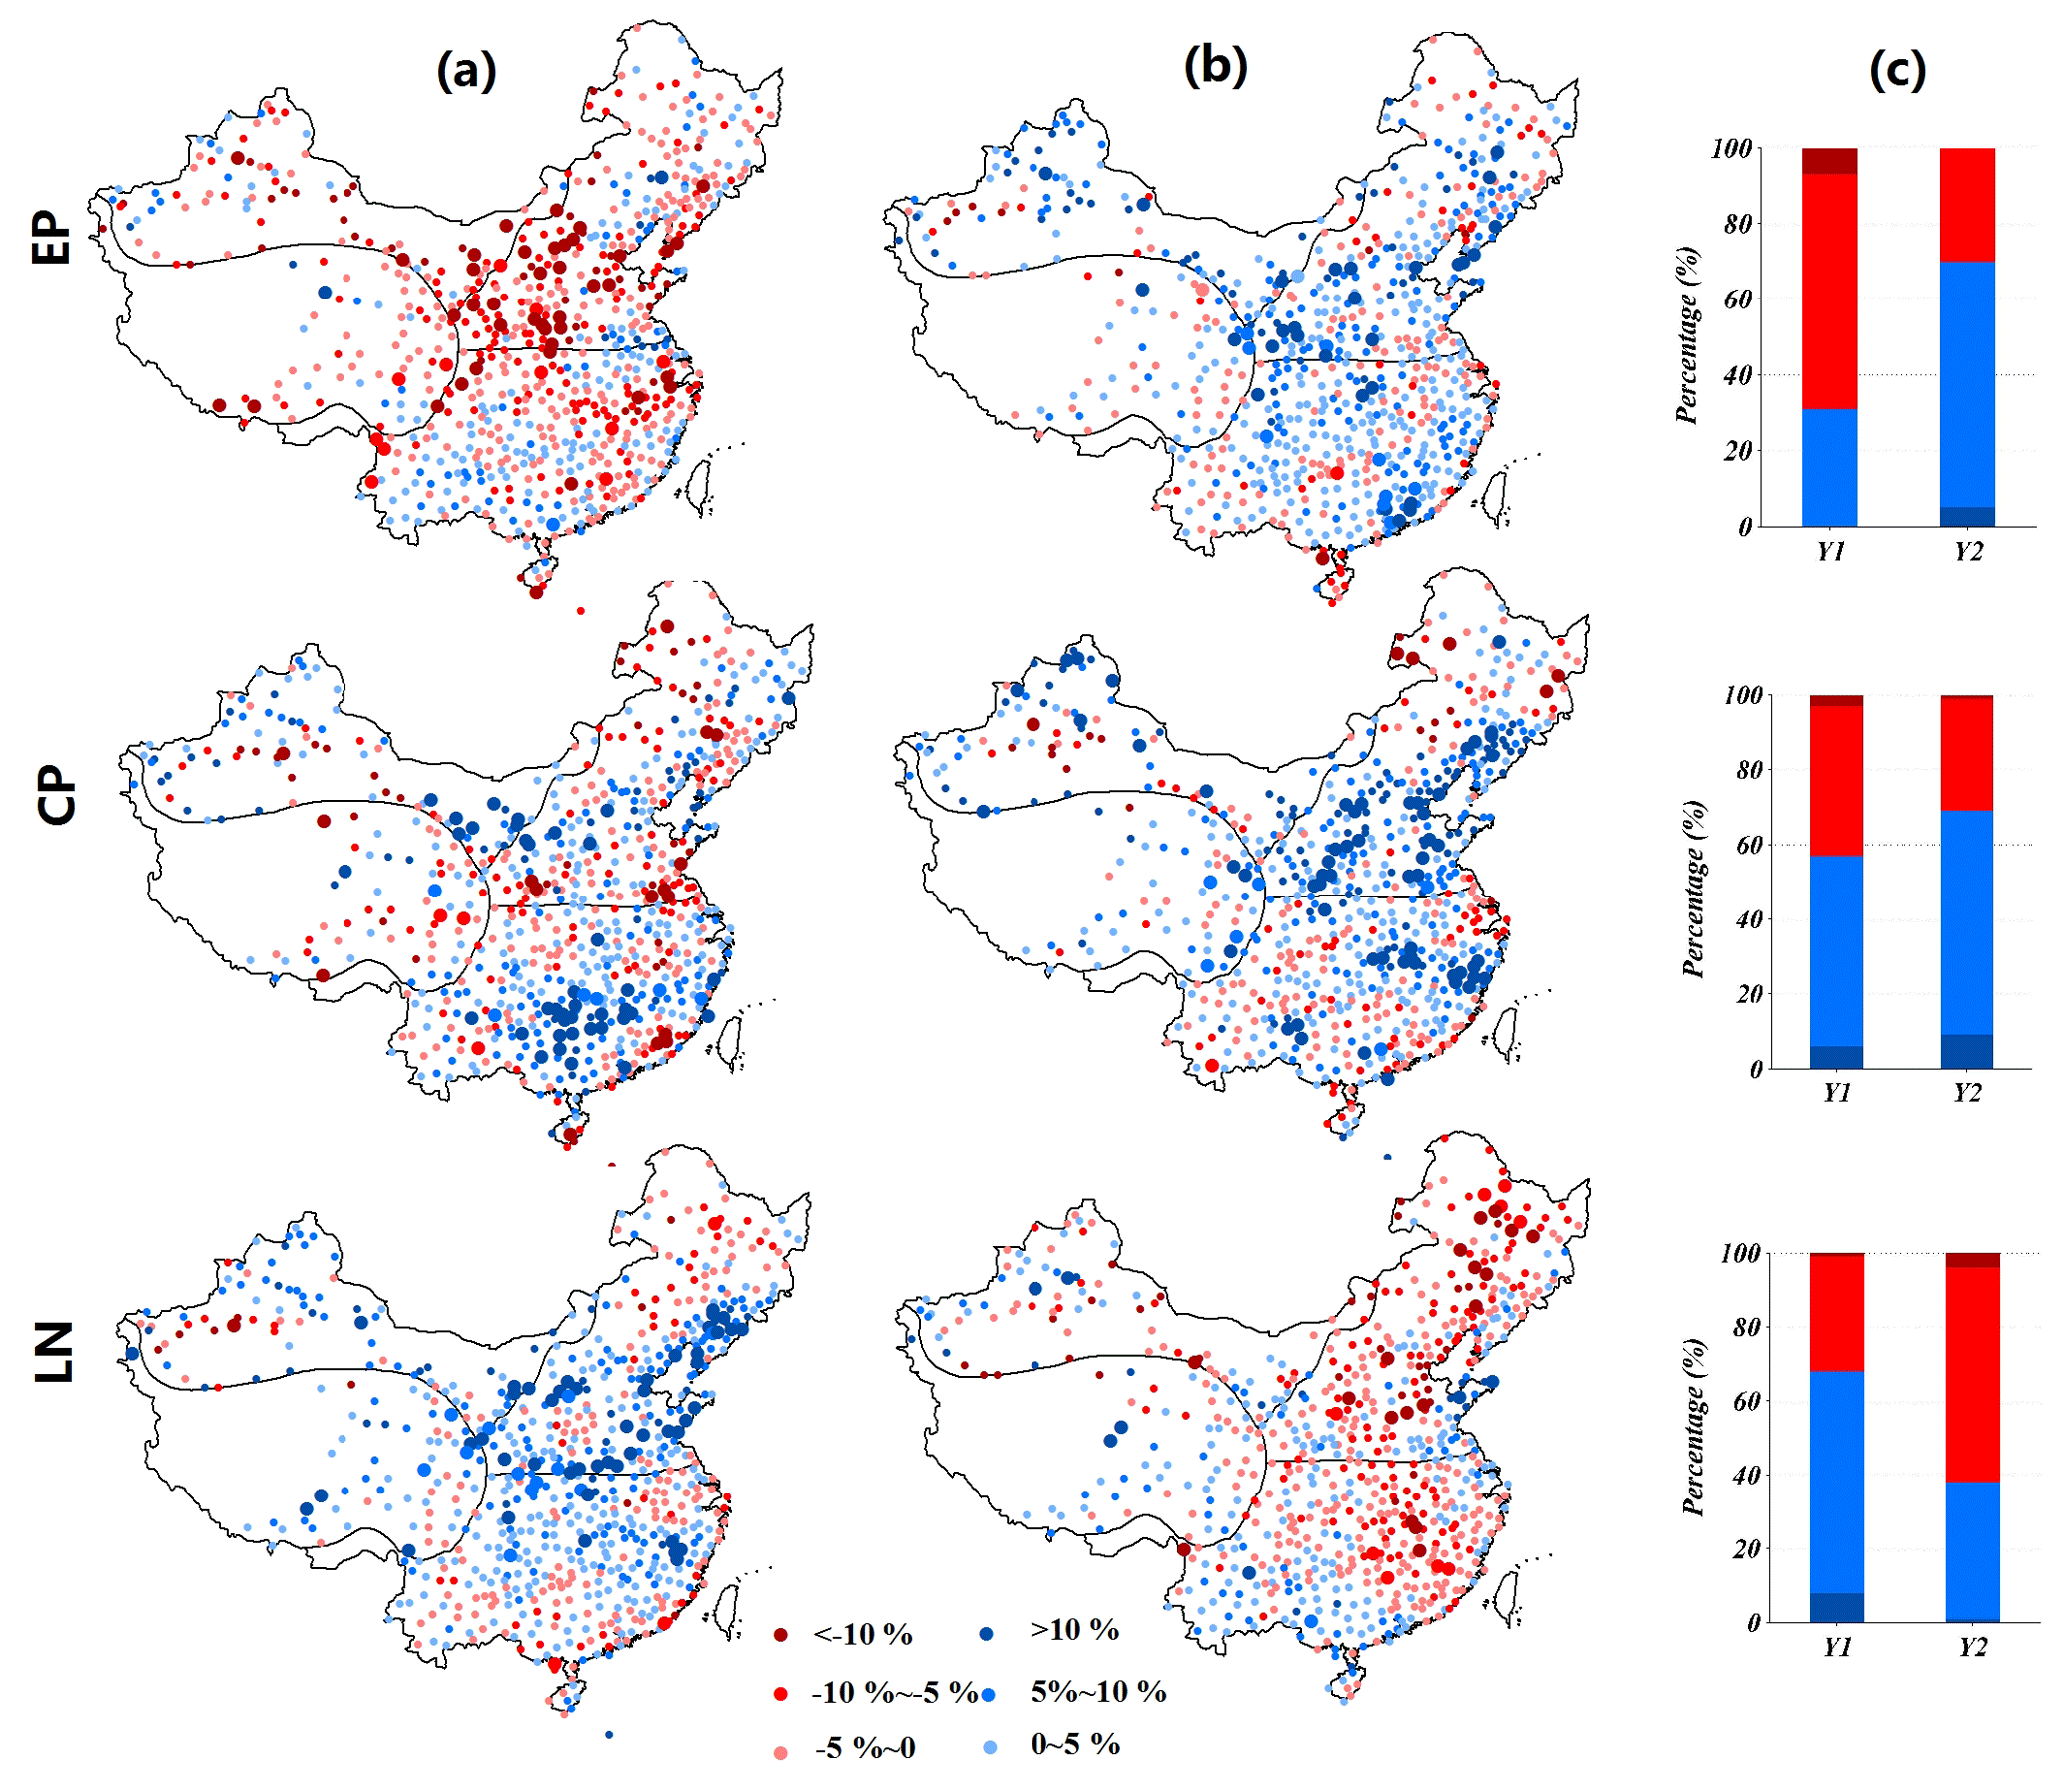
Figure 5Anomalies of precipitation intensity in developing years (a) and decaying years (b) of EP, CP, and LN phases. Stations experiencing significant anomalies are represented by large points. The percentage of stations experiencing anomalies of precipitation frequency are shown in (c), with significant increase (blue), increase (light blue), decrease (light red), and significant decrease (red). Y1 and Y2 represent developing years and decaying years, respectively.
In general, anomalies of total precipitation tend to result from changes in both the frequency and intensity of precipitation events. Combined with the analysis in Sect. 3.1, the results suggest that increases in precipitation frequency and intensity during EP decaying years and LN developing years resulted in the positive anomalies of annual precipitation across China during these phases, and the decreases in precipitation frequency and intensity during EP developing years and LN decaying years resulted in the negative anomalies of annual precipitation. But in the CP phases, few regions displayed such clear relationships between anomalies in total precipitation and precipitation events. For example, in the N region, precipitation frequency changed very little, and the observed positive anomalies of annual rainfall in CP decaying phases appear to have resulted from increased precipitation intensity. Likewise, in the S region, precipitation intensity increased by 1.77 %, even though the precipitation frequency and total precipitation decreased.
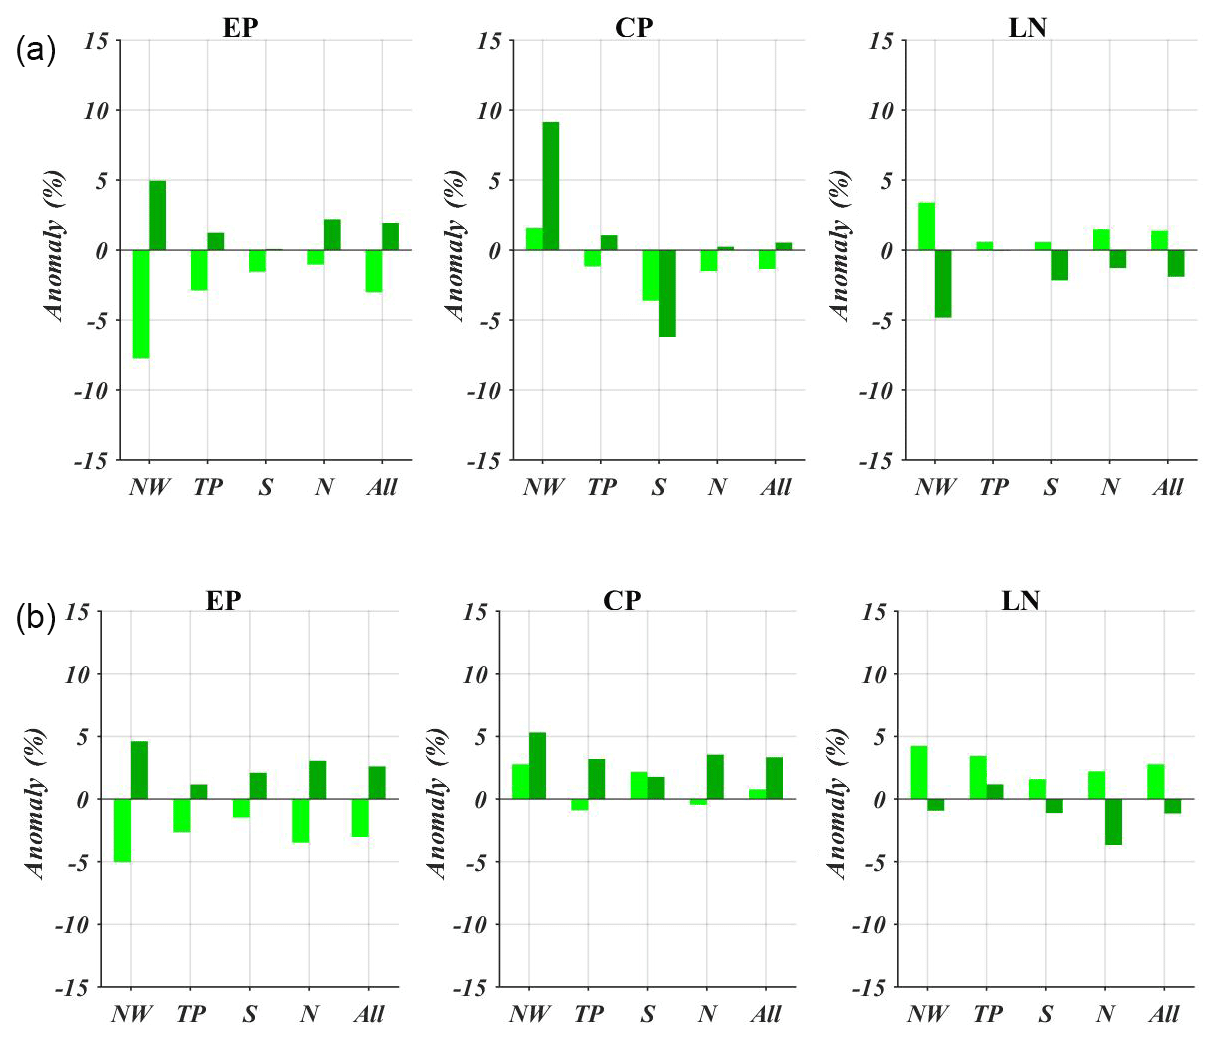
Figure 6Average anomalies of precipitation frequency (a) and precipitation intensity (b) by subregion during EP, CP, and LN phases. Light green represents developing years, and dark green represents decaying years.
3.3 Precipitation extremes
ENSO can trigger extreme hydro-climatological events such as floods, droughts, and cyclones (Zhang et al., 2013). Table 3 shows the average percent change in the number of extreme precipitation events (anomalies of precipitation extremes) in subregions and the whole of China, based on data from all meteorological stations.
Table 3Average anomalies of precipitation extremes during EP, CP, and LN phases (%).
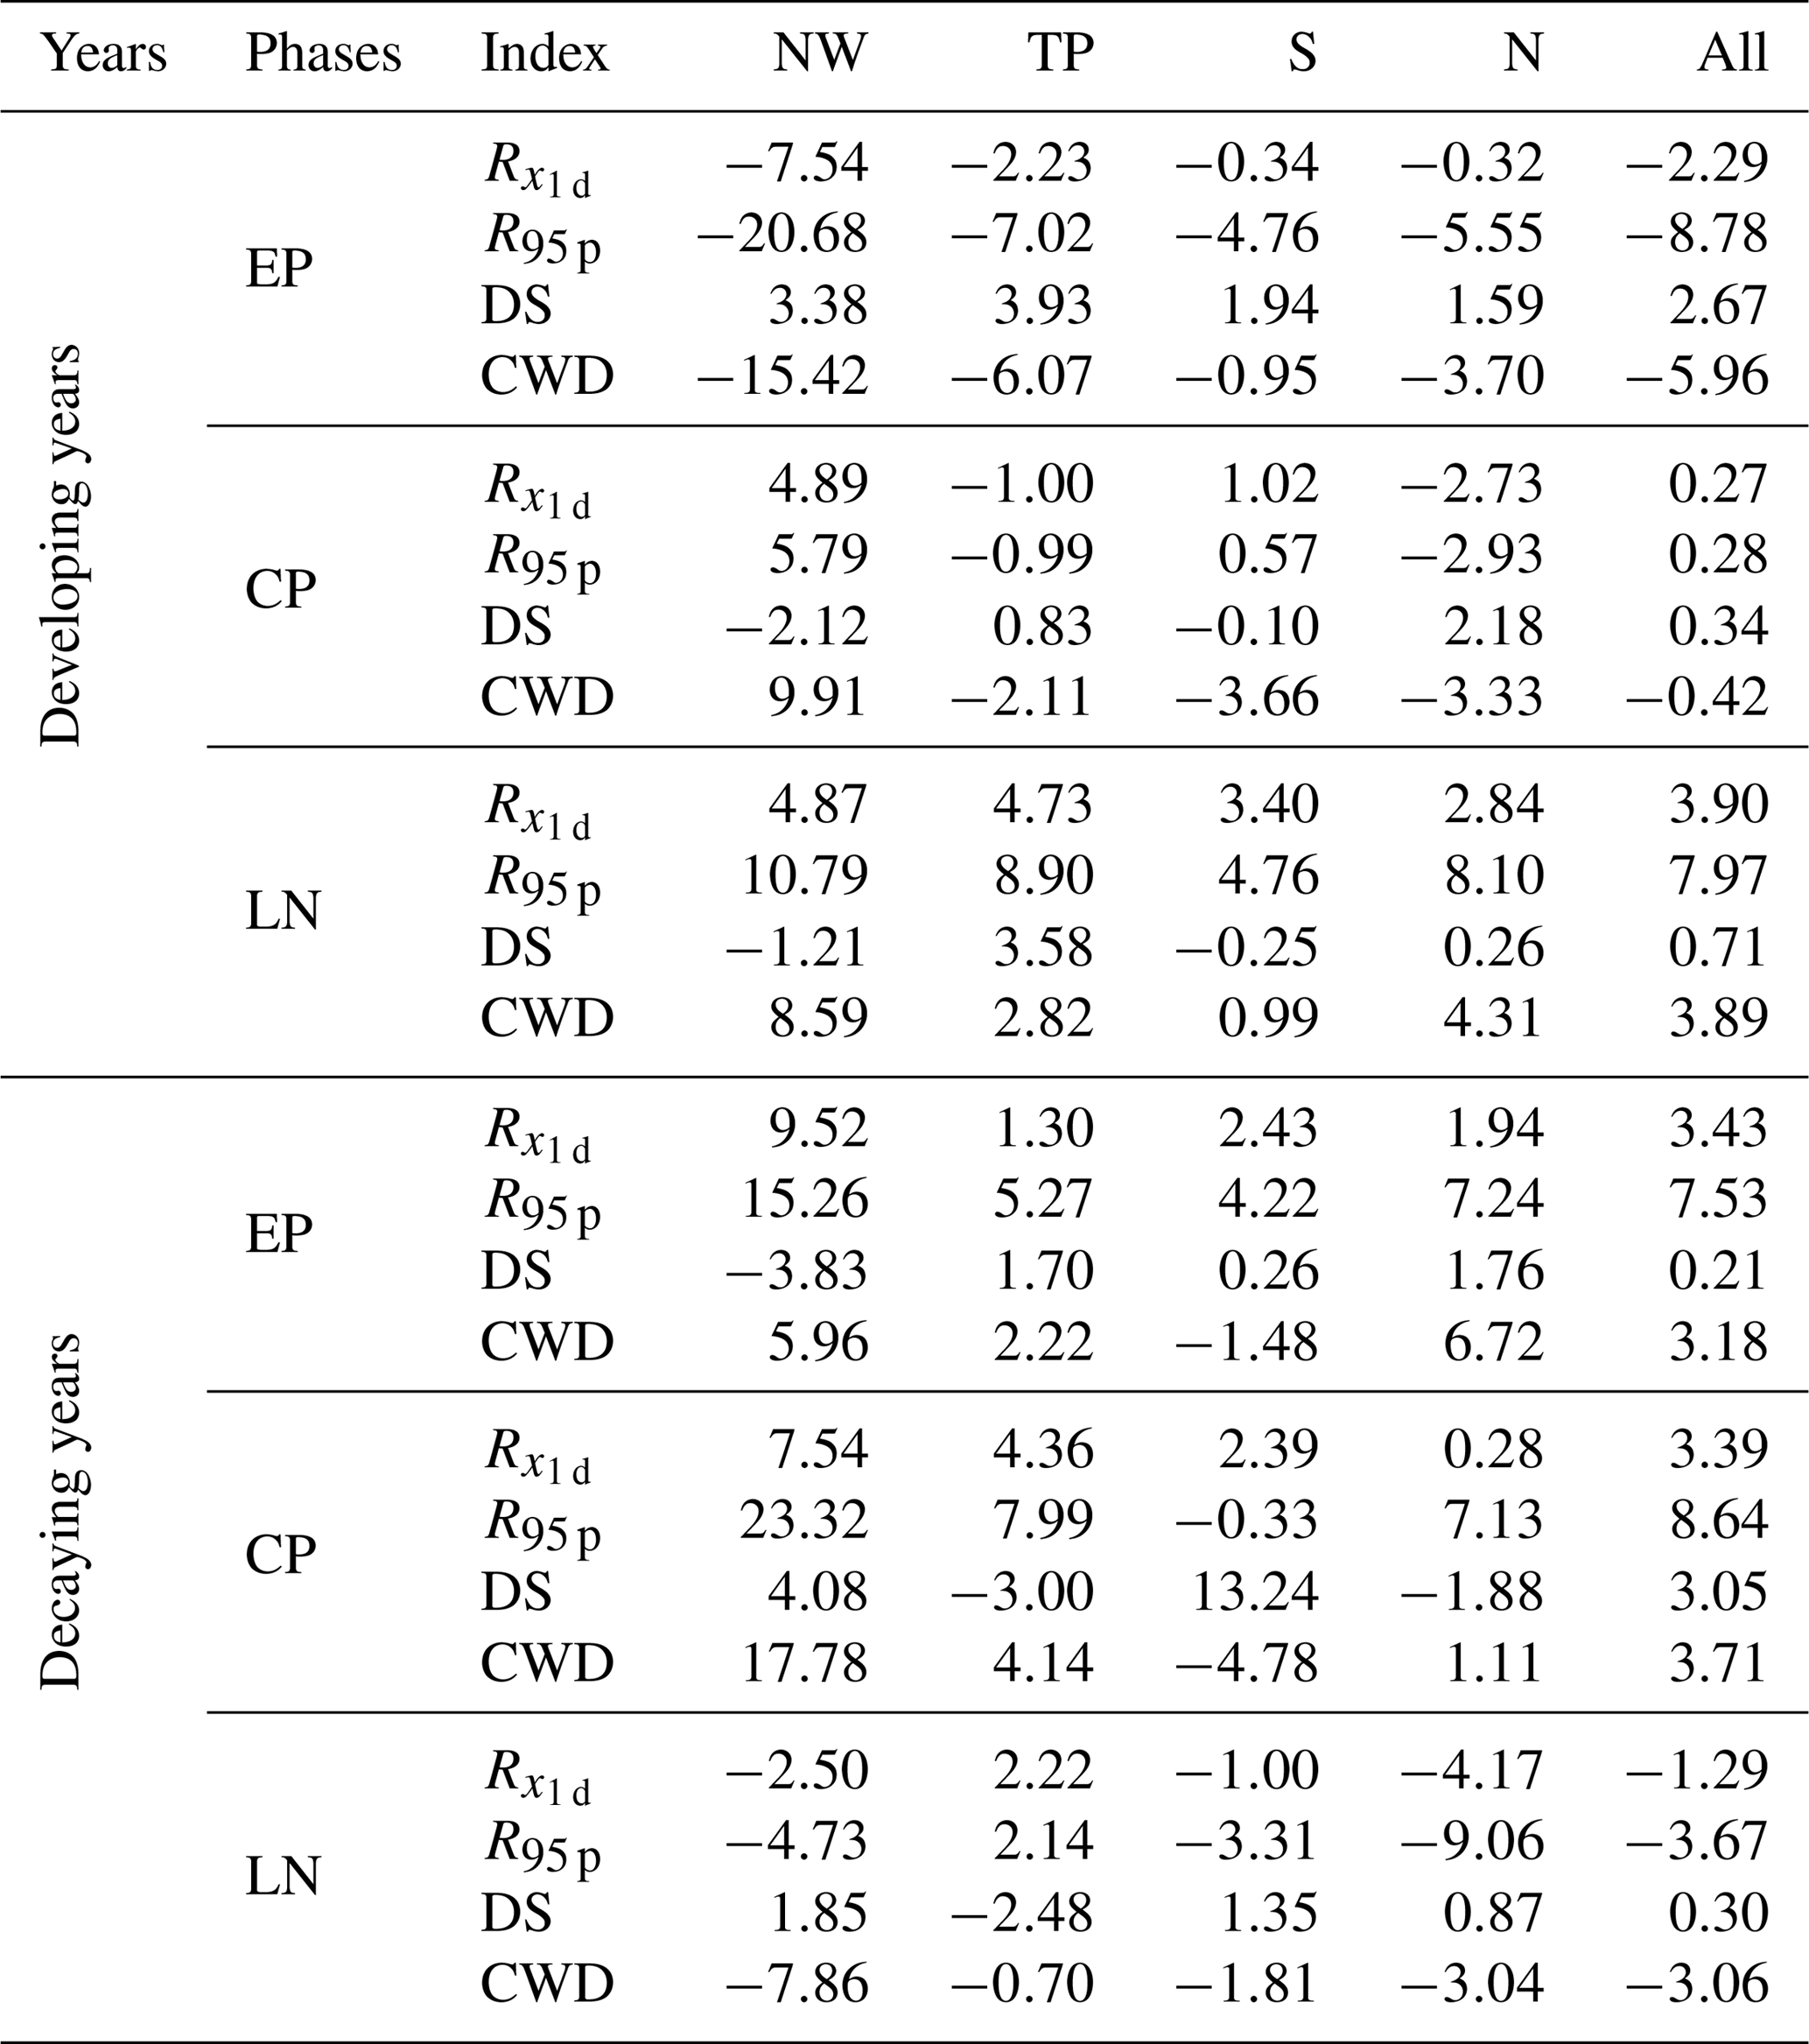
During EP developing years and LN decaying years China experienced markedly negative anomalies in very wet daily rainfall, as expressed by the R95 p index, and positive anomalies during EP decaying years and LN developing years. These impacts of the EP and LN phases on R95 p were observed in nearly all subregions of China. An R95 p positive anomaly was also observed in CP decaying years, but only in the NW, TP, and N regions. In CP developing years, the R95 p identified no significant anomalies. The index, a measure of maximum daily rainfall, revealed similar patterns to those identified by the R95 p index. Positive R95 p and values during EP and CP decaying years and LN developing years indicate an increased likelihood of extreme precipitation events during these years than normal.
As shown in Table 3, negative anomalies of consecutive wet days (CWD) occurred in EP developing years and LN decaying years across China, while the opposite pattern occurred in EP and CP decaying years and in LN developing years. The CWD is a measure of wet conditions that is closely related to soil moisture and river runoff. A greater number of CWDs will enhance soil moisture, runoff, and the risk of floods. The NW region, a continental climate zone, is the most sensitive of China's subregions to ENSO events in terms of CWDs. In EP developing years, the N, TP, and NW regions experienced large decreases in CWDs (5.69 %, 6.07 %, and 15.42 %, respectively). Such decreases have the potential to induce droughts in these subregions as soil moisture decreases. But the dry conditions in these subregions reversed in EP decaying years. Although a positive anomaly occurred in annual precipitation during CP decaying years in the N region, it experienced smaller CWD anomalies. This was possibly due to the increase in intensity of rainfall events.
Dry spells (DSs) are extended periods of 10 days or more of no precipitation and are a strong predictor of droughts. As shown in Table 3, all subregions of China experienced positive anomalies in DSs during EP developing years, displaying an inverse pattern to that observed for the CWDs discussed above. In other words, fewer CWDs and more DSs occurred simultaneously and indicated an increased risk of drought. Negative anomalies in DSs were observed in the NW and N regions during EP decaying years. In CP decaying years, DSs displayed dipole anomalies across China which were the opposite of observed CWD patterns during the same period. But during the same years, DS anomalies were positive in the NW region even though annual precipitation had increased. DSs displayed far weaker anomalies during both LN developing years and decaying years.
Summer monsoons over eastern Asia (EA) consist of staged progressions of zonally oriented rain belts as fronts advance and retreat. Huang and Wu's (1989) study first revealed that these summer monsoon rain belts are closely linked with ENSO cycle phases. Figure 7 shows the mean WNP-EA monsoon index and its significant difference from average conditions (1971–2000).
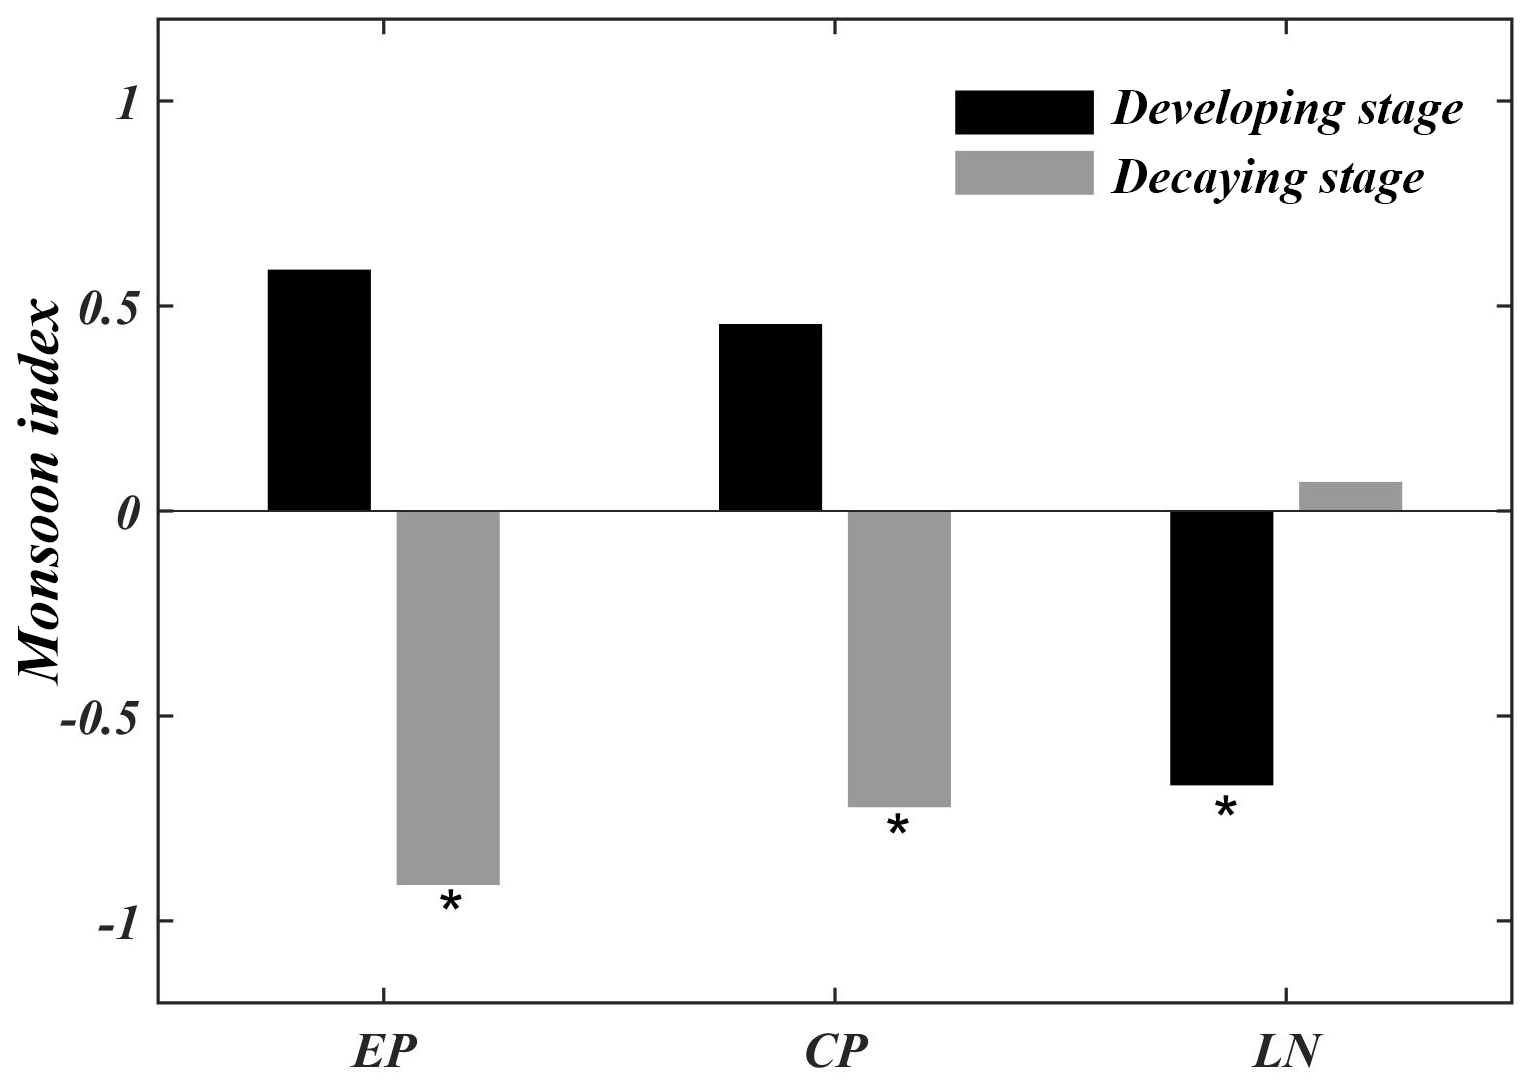
Figure 7The western North Pacific and eastern Asian (WNP-EA) summer monsoon index during different ENSO phases (average for 1971–2000 is −0.007). The asterisk indicates 95 % significance.
Results reveal that the WNP-EA monsoons tend to be weak during EP decaying years (Fig. 7). Wang et al. (2001) showed that a weak WNP-EA monsoon usually features enhanced rainfall along the monsoon's front over eastern Asia. As for the mechanism, anomalous anticyclones in the subtropical WNP are the key systems linking the ENSO and the eastern Asian climate (Feng et al., 2011; Wang and Chan, 2002; Wang et al., 2001; Yuan et al., 2012). An anomalous WNP anticyclone during a weak WNP-EA monsoon brings plentiful moisture to southern China; meanwhile, it can also shift the ridge of the subtropical high westward (Feng et al., 2011). When summer monsoons advance and retreat along WNP anticyclone fronts, heavy and continuous rainfall typically develops along the monsoon fronts (Chang, 2004). In this study, our examination of variations in precipitation anomalies reveals that rainfall is largely enhanced over the NW and N region during EP decaying years (Fig. 2).
Weak WNP-EA summer monsoons also tend to occur during CP decaying and LN developing years (Fig. 7). Typically, anomalous WNP anticyclones originate and develop during the previous autumn in the El Niño developing year and persist until the following spring and summer before intensities decrease (Wang et al., 2003). Yuan et al. (2012) found that WNP anticyclones display distinct location, intensity, and lifetime evolutions in the CP and EP El Niños due to the different anomalous SSTs in the equatorial Pacific. The EP El Niño tends to create stronger, wider, and longer-lived WNP anticyclones than the CP El Niño (Shi and Qian, 2018). In terms of rainfall pattern, the CP El Niño induced asymmetric anomalies that do not follow the patterns seen in the EP El Niño (Fig. 2). For example, during CP decaying years, the S region experienced a negative annual precipitation anomaly. Anomalous WNP anticyclones may explain this incongruity between the influences of the EP and CP El Niño phases, reflecting the potential for changes in atmospheric diabatic forcing over the tropics. In contrast, weak WNP-EA summer monsoons during LN developing years possibly correlate with the disappearance of EP during decaying years, when WNP anticyclones tend to reinvigorate and extend northwestward and inland (Feng et al., 2011). Precipitation anomalies in China also reveal a marked consistency between EP decaying years and LN developing years (Fig. 2).
Figure 7 further reveals that strong WNP-EA summer monsoons occur during EP or CP developing years, although not significantly. However, only the EP developing stage induces a negative rainfall anomaly over China (Fig. 2). Similar results were observed by Wu et al. (2003), who documented seasonal rainfall anomalies in eastern Asia, finding that the rainfall correlation distribution displayed pronounced differences between developing and decaying ENSO years. A reverse monsoon signal between developing and decaying years suggests that WNP anticyclones respond in terms of location and intensity to the evolution of SST anomalies over the tropical Pacific (Chang, 2004).
Using a climate model, Chou et al. (2012) found that changes in precipitation frequency and intensity are closely associated with changes in atmospheric water vapor and vertical motion. As demonstrated by Chou et al. (2012), an increase in water vapor reduces the magnitude of the vertical motion required to generate the same strength of precipitation, resulting in an increase in precipitation frequency and intensity. Therefore, large amounts of water vapor transported during EP and CP decaying years, or during LN developing years, when WNP-EA summer monsoons are relatively weak, may enhance both precipitation frequency and intensity. On the other hand, atmospheric vertical motion also tends to be intense during these periods, as summer monsoons over China feature strong southerly winds (Chen et al., 2013). This leads to further anomalous R95 p, , and CWDs, resulting in increased flood risk during these years (Table 3). However, a reduction in water vapor availability and vertical motion may occur during EP and CP developing years, as WNP-EA summer monsoons tend to be strong (Fig. 7), resulting in a negative anomaly in frequency and intensity of precipitation (Figs. 4 and 5).
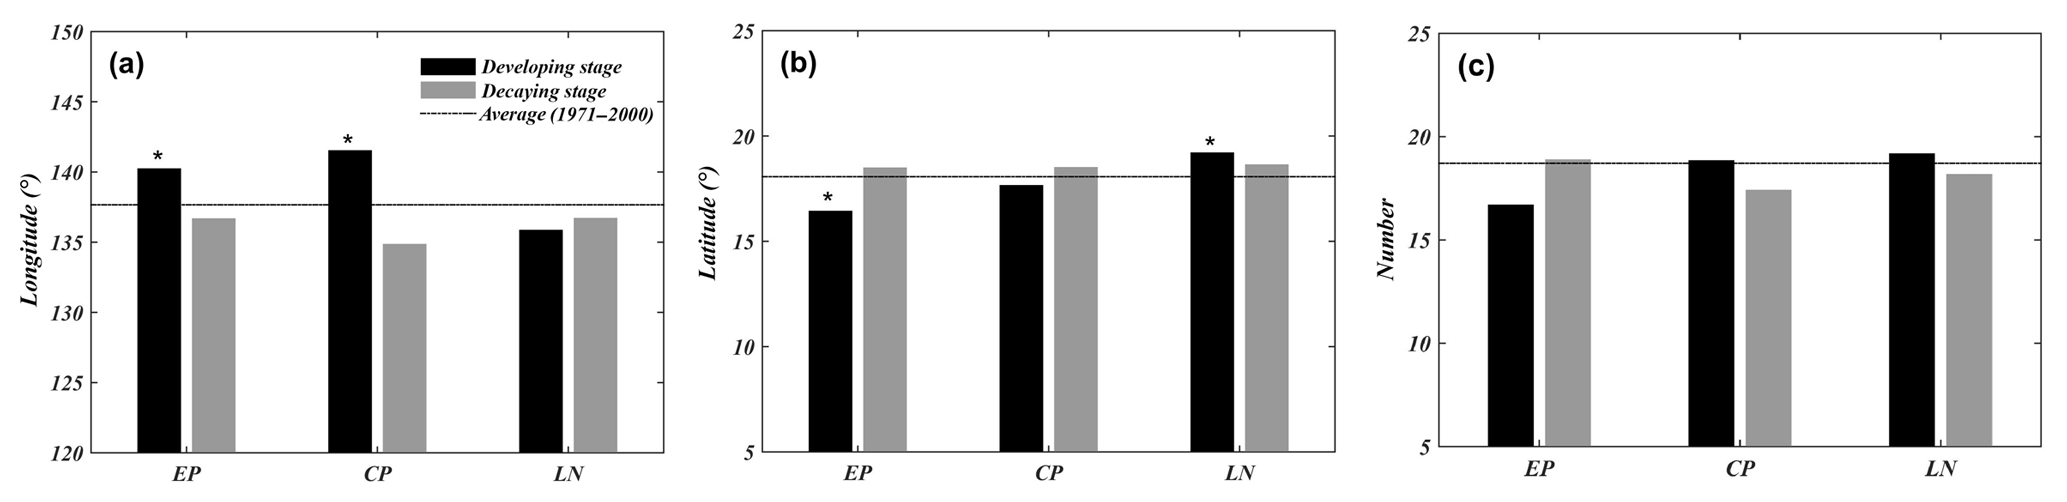
Figure 8Anomalies in TC genesis longitude (a), latitude (b), and number (c) during JASO over the WNP. The dashed line indicates the average value for 1971–2000. The asterisk indicates 95 % significance.
In addition, the relative stability of the atmosphere tends to reduce the frequency and intensity of precipitation by reducing vertical motion (Chou et al., 2012). The WNP subtropical high is a prime circulation system over the WNP-EA, and anomalies of location and intensity largely affect summer monsoon activities in eastern Asia (Wang et al., 2013). Huang and Wu (1989) found that when the location of a subtropical high is shifted unusually northward, hot and dry weather occurs in eastern China due to the dominance of the stable atmosphere. The location and intensity of subtropical highs are also closely associated with the development of WNP anticyclones, and the northward shift usually coincides with strong WNP-EA summer monsoons (Wang et al., 2001). Therefore, anomalous WNP subtropical highs possibly exacerbate negative precipitation frequency anomalies and positive DS anomalies in the S region during LN decaying years (Fig. 4 and Table 3). This may also explain the strong reductions in precipitation frequency in the S region during CP decaying years (Fig. 4), because WNP anticyclones display different anomalies than EP phases.
ENSO is one of the most important factors affecting TC activity over the WNP (Wu et al., 2012). In this study, the modulation of TC activity by ENSO was analyzed during developing and decaying phases for the period 1960–2013. Figure 8 shows ENSO-induced anomalies in terms of TC number and location of formation. Track density anomalies are shown in Fig. 9.
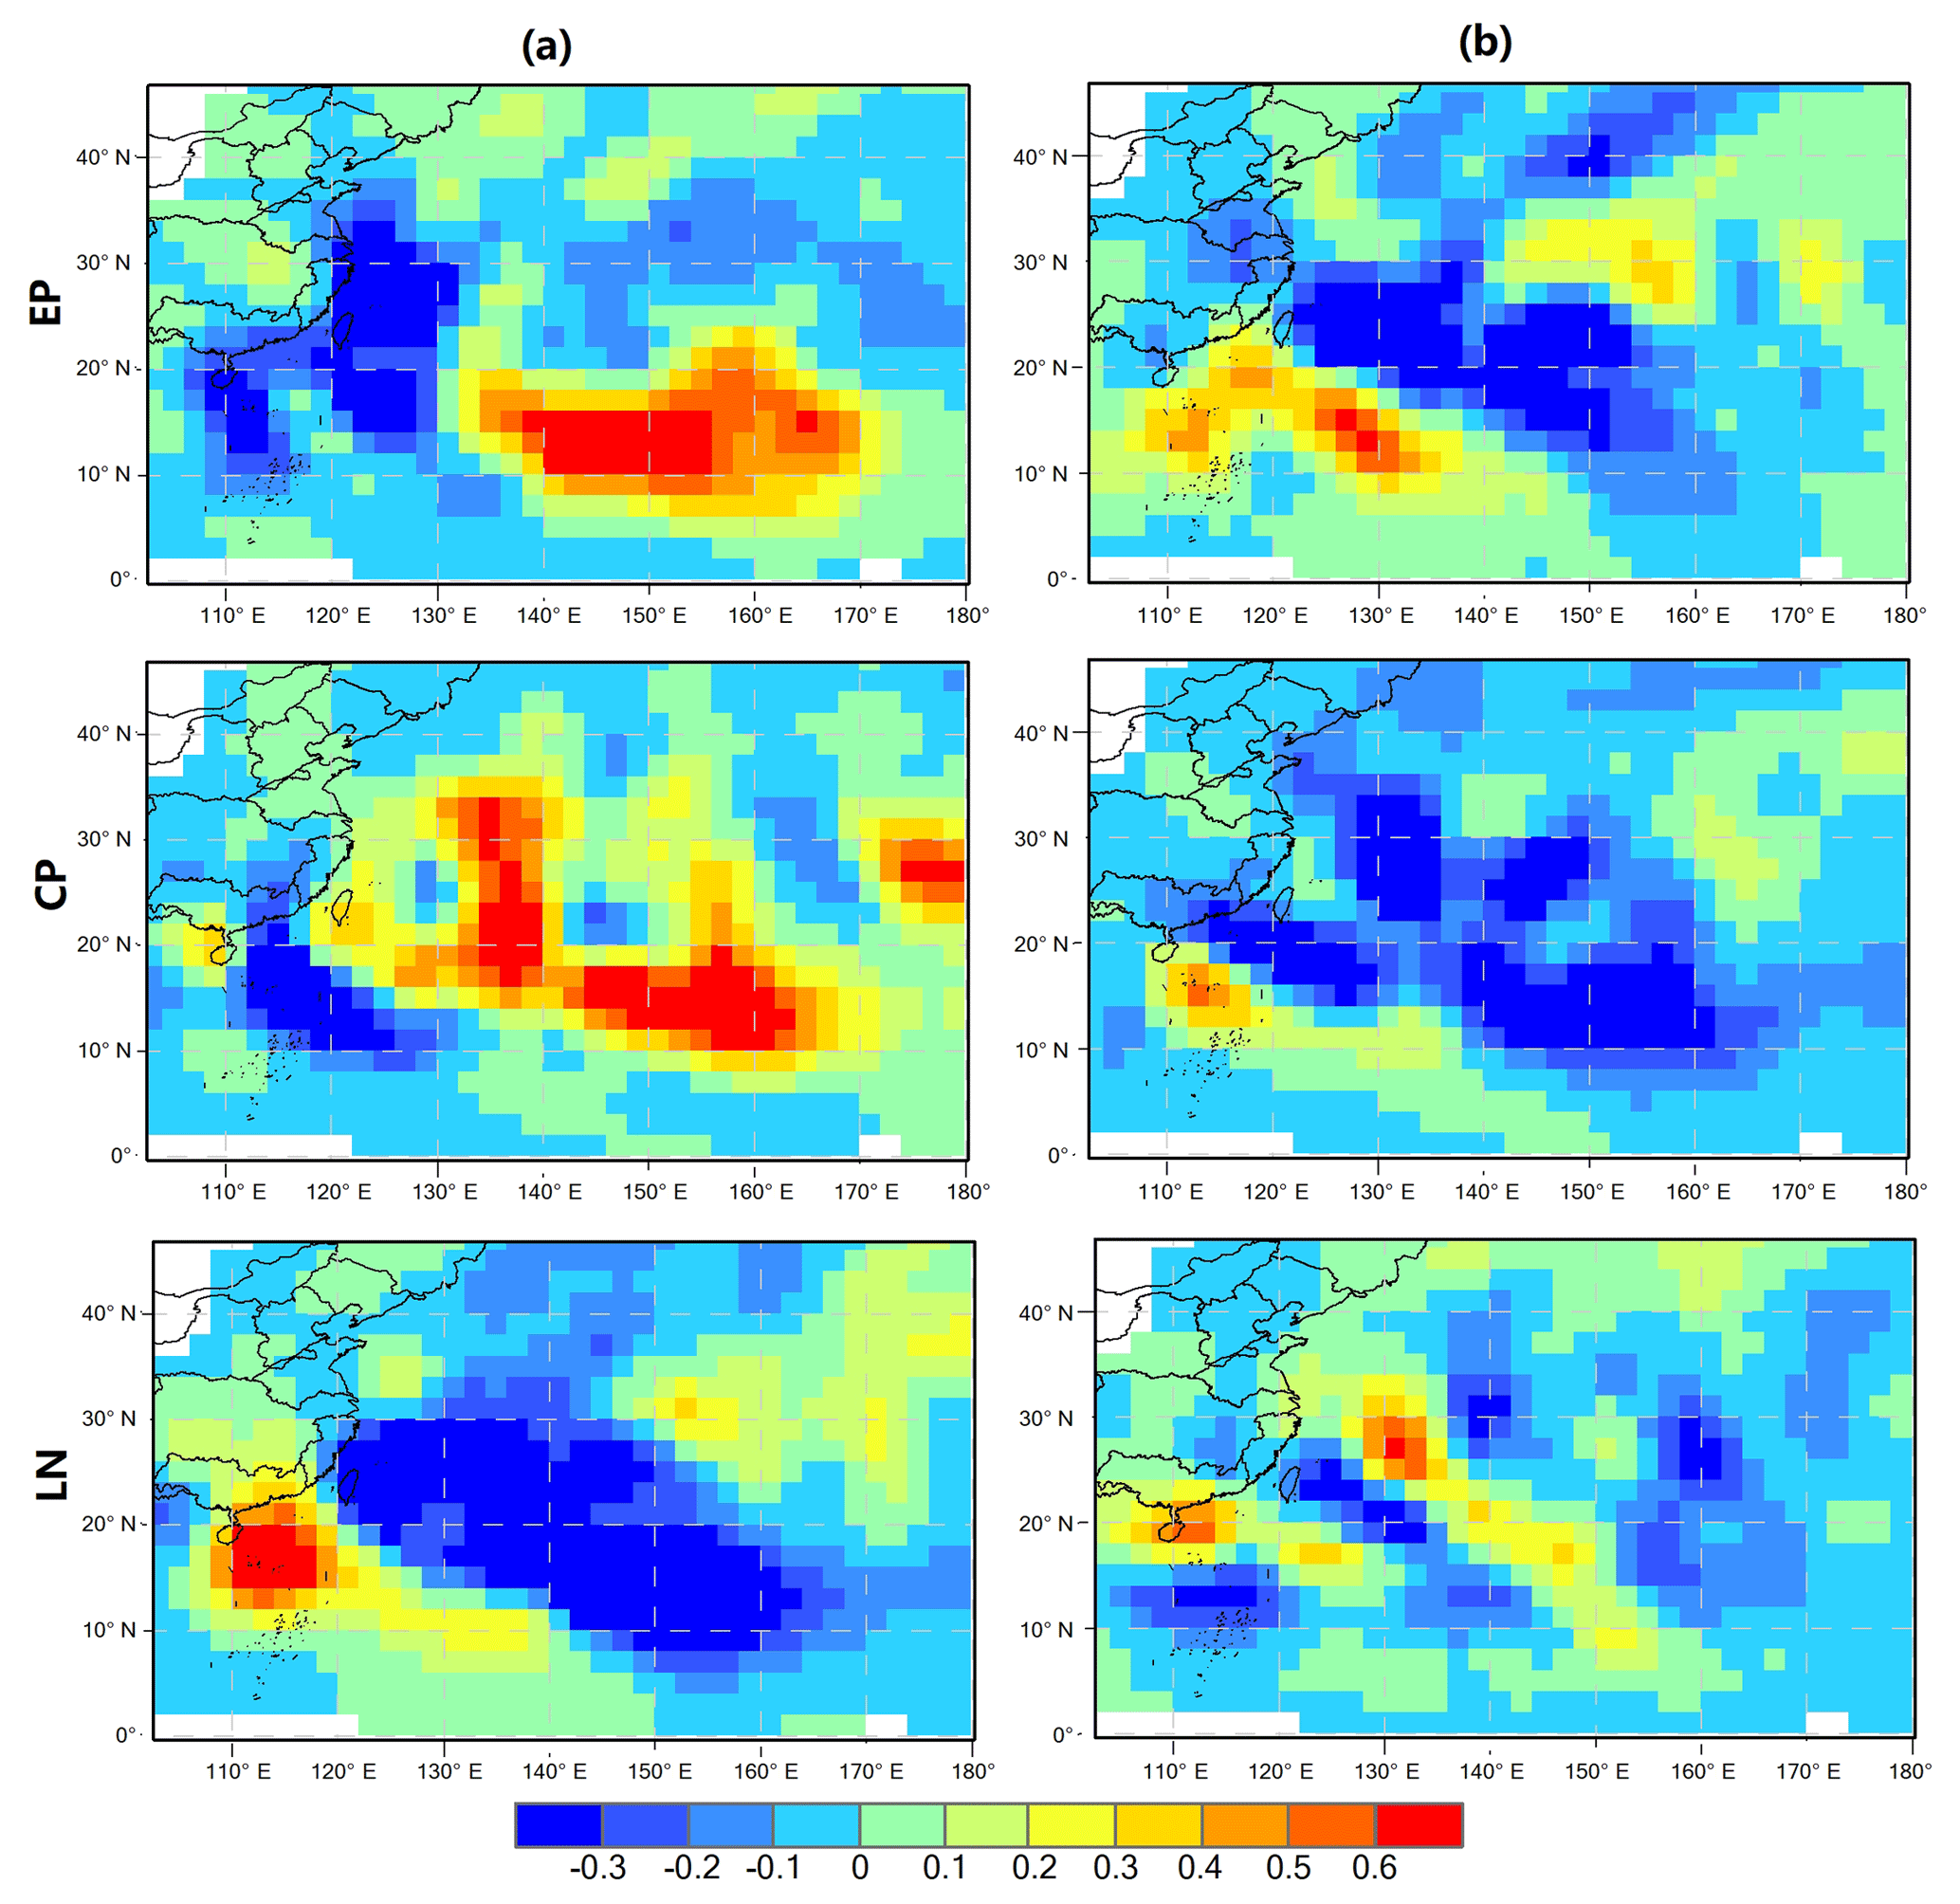
Figure 9Track density anomalies during JASO in developing years (a) and decaying years (b) of EP, CP, and LN phases.
Although the total number of TCs formed in the WNP did not vary significantly from year to year, TCs tended to form further east and south during EP developing years (Fig. 8). This shift in the location of the TC genesis constrained TCs westward propagation into eastern Asia (Wang and Chan, 2002). Therefore, track density was largely reduced over the coast of China (Fig. 9). This suggests that the EP developing stage induces a smaller impact by TC on rainfall in China. Conversely, during LN developing years, TCs tend to form further north (Fig. 8), and the track density shows a remarkable increase in the South China Sea (Fig. 8). The enhancement of TC activity tends to induce heavier rainfall events, leading to positive anomalies of precipitation intensity, , R95 p, and CWD during such years (Figs. 4 and 5; Table 3). TCs during CP developing years also form at higher latitudes than during EP phases, but the average latitude is lower than during the LN phase (Fig. 8). In contrast, the CP developing stage increases track density from the central–western Pacific to the eastern China coast and decreases it over the South China Sea (Fig. 9). Kim et al. (2011) revealed that a shift in the TC genesis location during CP years is closely associated with anomalous westerly winds induced by the westward shift in ocean heating and that this shift further provides more favorable conditions for westward TC propagation. Zhang et al. (2012) also claimed that TCs during CP summers are more likely to make landfall over eastern Asia because of a westward shift in subtropical highs and a northward shift in the TC genesis. However, TCs during CP developing years do not exert significant rainfall anomalies over China. The anomalous WNP-EA summer monsoons induced by ENSO may further explain this discrepancy. As discussed above, the strong WNP-EA monsoons during CP developing years do not induce negative rainfall anomalies over China (Fig. 7). This suggests that enhanced TC activity may cause a reduction in rainfall along monsoon fronts, resulting in neutral conditions over China. However, further studies are needed to examine how the CP developing stage influences rainfall over China.
In contrast, no significant shifts in the locations of the TC genesis occurred during decaying years (Fig. 8). This suggests that the impact of ENSO on TC formation may decrease after ENSO maturation. However, nearly opposite TC track density patterns occur over the WNP during developing and decaying years of an EP or CP El Niño (Fig. 9). For example, in EP decaying years, TC activity increased in the South China Sea and decreased from the western Pacific to the eastern China coast. This shift in track density affected water vapor transport and contributed to a reversed pattern of rainfall anomalies between developing and decaying years.
Using a nonparametric hypothesis test, this study investigated the impacts of three different ENSO phases on daily rainfall regimes in China during the past half century. Rainfall data collected from meteorological stations across the country revealed that the impacts of the three phases were significantly different from each other on a daily timescale. ENSO events triggered large changes in the frequency and intensity of precipitation events and in the occurrence of precipitation extremes. This finding is significant, because past studies examining teleconnections between ENSO events and climate variation in China have primarily focused on annual and/or monthly rainfall rather than on daily precipitation events. Since ENSO events can be predicted 1 to 2 years in advance using various coupled ocean–atmosphere models (Lü et al., 2011), this study can provide a means of climate prediction on a daily timescale and enable the prioritization of adaptation efforts ahead of extreme events.
Previous studies have revealed that some regions in China are especially vulnerable to ENSO events via teleconnections, such as the South China Sea (Qu et al., 2004; Rong et al., 2007; Zhou and Chan, 2007; Liu et al., 2011) and the Yangtze River (Huang and Wu, 1989; Tong et al., 2006; Zhang et al., 2007, 2015). However, using daily precipitation indices, we found that the continental climate zone (NW) is more sensitive than other regions to ENSO events due to the high incidence and magnitude of its anomalous precipitation events (Figs. 4, 5, and Table 3). For example, the NW region experienced the largest R95 p and CWD anomalies during all ENSO event phases. In an earlier study on daily river discharges at a global scale, Ward et al. (2014) found that ENSO has a greater impact on annual floods in arid regions than in non-arid regions. In China, Hui et al. (2006) analyzed inter-decadal variations in summer rainfall in response to the SST anomaly over the Niño 3 region. They found that summer rainfall in northwestern China was well predicted by ENSO events in 1951–1974 (Hui et al., 2006). But little research has been conducted on the mechanisms behind climatic responses to ENSO events in China's continental climate zone, because most studies have focused on monsoon zones (Matsumoto and Takahashi, 1999; Wen et al., 2000; Wang et al., 2008; Zhou and Wu, 2010).
Although the primary physical processes and mechanisms responsible for precipitation anomalies have been discussed in the context of summer monsoons and TC activity, approaches to understanding the forces influencing daily precipitation events coinciding with ENSO are more complex than those directed toward precipitation influences on a monthly or annual scale. This complexity can be illustrated by the observation that in CP decaying years, the N region experienced a positive anomaly of annual precipitation due to an increase in precipitation intensity, but the S region experienced a negative anomaly due to a large decrease in precipitation frequency. Therefore, even though some physical mechanisms may explain precipitation variabilities related to ENSO events, there is a need for more research on the mechanisms driving atmospheric circulation to advance our understanding of these influences over temporal and spatial scales. In addition, the year-to-year variability of eastern Asian summer monsoons is likely influenced by complex air–sea–land and tropical–extratropical interactions in addition to ENSO events. These interactions may include Tibetan Plateau heating, Eurasian snow cover, and polar ice coverage (Wang et al., 2000). Other factors that may contribute to precipitation anomalies in China during ENSO events include forces that generate large-scale circulation events, such as global warming. In a warmer climate, water vapor in the atmosphere tends to increase, which destabilizes the atmosphere and enhances precipitation (Chou et al., 2012). Therefore, most positive precipitation anomalies are expected from a theoretical point of view, in spite of the associated atmospheric circulation that does not change too much.
All the data used in our study were downloaded from websites indicated in Sect. 2.
AL conceived the study. AL and BQ performed the data analysis and wrote the paper. AL, SJ and WZ read and edited the manuscript. All authors reviewed and approved the manuscript.
The authors declare that they have no conflict of interest.
This study was funded by the National Key Research and Development Program
of China (grant no. 2016YFC0401307) and the National Natural Science
Foundation of China (grant no. 41671026). We appreciate the editors and
anonymous reviewers for their constructive comments on improving the
original paper.
Edited by: Luis Samaniego
Reviewed by: two anonymous referees
Chang, C. P., Zhang, Y., and Li, T.: Interannual and interdecadal variations of the East Asian summer monsoon and tropical Pacific SSTs, Part I: Roles of the subtropical ridge, J. Climate, 13, 4310–4325, 2000.
Chang, C. P.: East Asian Monsoon, World Scientific Series on Asia-Pacific Weather and Climate, Volume 2, Page 572, World Scientific, 2004.
Chen, W., Feng, J., and Wu, R.: Roles of ENSO and PDO in the link of the East Asian winter monsoon to the following summer monsoon, J. Climate, 26, 622–635, 2013.
Chiew, F. H. S. and McMahon, T. A.: Global ENSO-streamflow teleconnection, streamflow forecasting and interannual variability, Hydrolog. Sci. J., 47, 505–522, 2002.
Chou, C., Chen, C. A., Tan, P. H., and Chen, K. T.: Mechanisms for global warming impacts on precipitation frequency and intensity, J. Climate, 25, 3291–3306, 2012.
Feng, J., Chen, W., Tam, C. Y., and Zhou, W.: Different impacts of El Niño and El Niño Modoki on China rainfall in the decaying phases, Int. J. Climatol., 31, 2091–2101, 2011.
Fowler, A. and Hennessy, K.: Potential impacts of global warming on the frequency and magnitude of heavy precipitation, Nat. Hazards, 11, 283–303, 1995.
Gershunov, A. and Barnett, T. P.: Interdecadal modulation of ENSO teleconnections, B. Am. Meteorol. Soc., 79, 2715–2725, 1998.
Gong, D. Y. and Wang, S. W.: Severe summer rainfall in China associated with enhanced global warming, Clim. Res., 16, 51–59, 2000.
Gong, D. and Wang, S.: Impacts of ENSO on rainfall of global land and China, Chinese Sci. Bull., 44, 852–857, 1999.
Guo, L., Klingaman, N. P., Vidale, P. L., Turner, A. G., Demory, M. E., and Cobb, A.: Contribution of tropical cyclones to atmospheric moisture transport and rainfall over East Asia, J. Climate, 30, 3853–3865, 2017.
Huang, R. and Wu, Y.: The influence of ENSO on the summer climate change in China and its mechanism, Adv. Atmos. Sci., 6, 21–32, 1989.
Huang, R. and Wu, Y.: The influence of ENSO on the summer climate change in China and its mechanism, Adv. Atmos. Sci., 6, 21–32, 1989.
Hui, G., Yongguang, W., and Jinhai, H.: Weakening significance of ENSO as a predictor of summer precipitation in China, Geophys. Res. Lett., 33, L09807, 2006.
Karl, T. R., Knight, R. W., and Plummer, N.: Trends in high-frequency climate variability in the twentieth century, Nature, 377, 217–220, 1995.
Kim, H. M., Webster, P. J., and Curry, J. A.: Modulation of North Pacific tropical cyclone activity by three phases of ENSO, J. Climate, 24, 1839–1849, 2011.
Lin, X. C. and Yu, S.Q.: El Nino and rainfall during the flood season (June–August) in China, Acta Meteorol. Sin., 51, 434–441, 1993.
Liu, Q., Feng, M., and Wang, D.: ENSO-induced interannual variability in the southeastern South China Sea, J. Oceanogr., 67, 127–133, 2011.
Lü, A., Jia, S., Zhu, W., Yan, H., Duan, S., and Yao, Z.: El Niño-Southern Oscillation and water resources in the headwaters region of the Yellow River: links and potential for forecasting, Hydrol. Earth Syst. Sci., 15, 1273–1281, https://doi.org/10.5194/hess-15-1273-2011, 2011.
Matsumoto, J. and Takahashi, K.: Regional differences of daily rainfall characteristics in East Asian summer monsoon season, Geographical review of Japan, Series B, 72, 193–201, 1999.
McPhaden, M. J. and Zhang, X.: Asymmetry in zonal phase propagation of ENSO sea surface temperature anomalies, Geophys. Res. Lett., 36, 88–97, 2009.
McPhaden, M. J., Zebiak, S. E., and Glantz, M. H.: ENSO as an integrating concept in earth science, Science, 314, 1740–1745, 2006.
Mosley, M. P.: Regional differences in the effects of El Niño and La Niña on low flows and floods, Hydrolog. Sci. J., 45, 249–267, 2000.
Moss, M. E., Pearson, C. P., and McKerchar, A. I.: The Southern Oscillation index as a predictor of the probability of low streamflows in New Zealand, Water Resour. Res., 30, 2717–2723, 1994.
Ouyang, R., Liu, W., Fu, G., Liu, C., Hu, L., and Wang, H.: Linkages between ENSO/PDO signals and precipitation, streamflow in China during the last 100 years, Hydrol. Earth Syst. Sci., 18, 3651–3661, https://doi.org/10.5194/hess-18-3651-2014, 2014.
Qian, W. and Lin, X.: Regional trends in recent precipitation indices in China, Meteorol. Atmos. Phys., 90, 193–207, 2005.
Qu, B., Lv, A., Jia, S., and Zhu, W.: Daily Precipitation Changes over Large River Basins in China, 1960–2013, Water, 8, 185, https://doi.org/10.3390/w8050185, 2016.
Qu, T., Kim, Y. Y., Yaremchuk, M., Tozuka, T., Ishida, A., and Yamagata, T.: Can Luzon Strait transport play a role in conveying the impact of ENSO to the South China Sea, J. Climate, 17, 3644–3657, 2004.
Räsänen, T. A. and Kummu, M.: Spatiotemporal influences of ENSO on precipitation and flood pulse in the Mekong River Basin, J. Hydrol., 476, 154–168, 2013.
Ren, H. L. and Jin, F. F.: Niño indices for two types of ENSO, Geophys. Res. Lett., 38, L0470, 2011.
Rong, Z., Liu, Y., Zong, H., and Cheng, Y.: Interannual sea level variability in the South China Sea and its response to ENSO, Global Planet. Change, 55, 257–272, 2007.
Ropelewski, C. F. and Halpert, M. S.: Global and regional scale precipitation patterns associated with the El Niño/Southern Oscillation, Mon. Weather Rev., 115, 1606–1626, 1987.
Shi, J. and Qian, W.: Asymmetry of two types of ENSO in the transition between the East Asian winter monsoon and the ensuing summer monsoon, Clim. Dynam., 51, 3907–3926, 2018.
Teegavarapu, R. S. V., Goly, A., and Obeysekera, J.: Influences of Atlantic multidecadal oscillation phases on spatial and temporal variability of regional precipitation extremes, J. Hydrol., 495, 74–93, 2013.
Tong, J., Qiang, Z., Deming, Z., and Yijin, W.: Yangtze floods and droughts (China) and teleconnections with ENSO activities (1470–2003), Quatern. Int., 144, 29–37, 2006.
Veldkamp, T. I. E., Eisner, S., Wada, Y., Aerts, J. C. J. H., and Ward, P. J.: Sensitivity of water scarcity events to ENSO-driven climate variability at the global scale, Hydrol. Earth Syst. Sci., 19, 4081–4098, https://doi.org/10.5194/hess-19-4081-2015, 2015.
Wang, B. and Fan, Z.: Choice of South Asian summer monsoon indices, B. Am. Meteorol. Soc., 80, 629–638, 1999.
Wang, B., Wu, R., and Fu, X.: Pacific-East Asian teleconnection: how does ENSO affect East Asian climate?, J. Climate, 13, 1517–1536, 2000.
Wang, B., Wu, R., and Lau, K.: Interannual variability of the Asian summer monsoon: Contrasts between the Indian and the western North Pacific–East Asian monsoons, J. Climate, 14, 4073–4090, 2001.
Wang, B. and Chan, J. C.: How strong ENSO events affect tropical storm activity over the western North Pacific, J. Climate, 15, 1643–1658, 2002.
Wang, B., Clemens, S. C., and Liu, P.: Contrasting the Indian and East Asian monsoons: implications on geologic timescales, Mar. Geol., 201, 5–21, 2003.
Wang, B., Xiang, B., and Lee, J. Y.: Subtropical high predictability establishes a promising way for monsoon and tropical storm predictions, P. Natl. Acad. Sci. USA, 110, 2718–2722, 2013.
Wang, L., Chen, W., and Huang, R.: Interdecadal modulation of PDO on the impact of ENSO on the East Asian winter monsoon, Geophys. Res. Lett., 35, L20702, 2008.
Ward, P. J., Eisner, S., Flörke, M., Dettinger, M. D., and Kummu, M.: Annual flood sensitivities to El Niño-Southern Oscillation at the global scale, Hydrol. Earth Syst. Sci., 18, 47–66, https://doi.org/10.5194/hess-18-47-2014, 2014.
Wen, C., Graf, H. F., and Ronghui, H.: The interannual variability of East Asian winter monsoon and its relation to the summer monsoon, Adv. Atmos. Sci., 17, 48–60, 2000.
Wu, M., Chang, W., and Leung, W.: Impacts of El Niño–Southern Oscillation events on tropical cyclone landfalling activity in the western North Pacific, J. Climate, 17, 1419–1428, 2004.
Wu, R., Hu, Z. Z., and Kirtman, B. P.: Evolution of ENSO-related rainfall anomalies in East Asia, J. Climate, 16, 3742–3758, 2003.
Xu, X., Du, Y., Tang, J., and Wang, Y.: Variations of temperature and precipitation extremes in recent two decades over China, Atmos. Res., 101, 143–154, 2011.
Yeh, S. W., Kug, J. S., Dewitte, B., Kwon, M. H., Kirtman, B. P., and Jin, F. F.: El Niño in a changing climate, Nature, 461, 511–514, 2009.
Yuan, Y., Yang, S., and Zhang, Z.: Different evolutions of the Philippine Sea anticyclone between the eastern and central Pacific El Niño: Possible effects of Indian Ocean SST, J. Climate, 25, 7867–7883, 2012.
Yu, J. Y. and Kim, S. T.: Identifying the types of major El Niño events since 1870, Int. J. Climatol., 33, 2105–2112, 2013.
Zhai, P., Zhang, X., Wan, H., and Pan, X.: Trends in total precipitation and frequency of daily precipitation extremes over China, J. Climate, 18, 1096–1108, 2005.
Zhang, Q., Xu, C. Y., Jiang, T., and Wu, Y.: Possible influence of ENSO on annual maximum streamflow of the Yangtze River, China, J. Hydrol., 333, 265–274, 2007.
Zhang, Q., Li, J., Singh, V. P., Xu, C. Y., and Deng, J.: Influence of ENSO on precipitation in the East River basin, South China, J. Geophys. Res.-Atmos., 118, 2207–2219, 2013.
Zhang, X. and Cong, Z.: Trends of precipitation intensity and frequency in hydrological regions of China from 1956 to 2005, Global Planet. Change, 117, 40–51, 2014.
Zhang, X., Alexander, L., Hegerl, G. C., Jones, P., Tank, A. K., Peterson, T. C., and Zwiers, F. W.: Indices for monitoring changes in extremes based on daily temperature and precipitation data, Wiley Interdisciplinary Reviews, Climate Change, 2, 851–870, 2011.
Zhang, Z., Chao, B., Chen, J., and Wilson, C.: Terrestrial water storage anomalies of Yangtze River Basin droughts observed by GRACE and connections with ENSO, Global Planet. Change, 126, 35–45, 2015.
Zhang, W., Graf, H. F., Leung, Y., and Herzog, M.: Different El Niño types and tropical cyclone landfall in East Asia, J. Climate, 25, 6510–6523, 2012.
Zhou, L. T. and Wu, R.: Respective impacts of the East Asian winter monsoon and ENSO on winter rainfall in China, J. Geophys. Res.-Atmos., 115, D02107, 2010.
Zhou, W. and Chan, J. C.: ENSO and the South China Sea summer monsoon onset, Int. J. Climatol., 27, 157–167, 2007.