the Creative Commons Attribution 4.0 License.
the Creative Commons Attribution 4.0 License.
 | 20 Mar 2020
BESS-STAIR: a framework to estimate daily, 30 m, and all-weather crop evapotranspiration using multi-source satellite data for the US Corn Belt
Kaiyu Guan
Ming Pan
Youngryel Ryu
Bin Peng
Sibo Wang
With increasing crop water demands and drought threats, mapping and monitoring of cropland evapotranspiration (ET) at high spatial and temporal resolutions become increasingly critical for water management and sustainability. However, estimating ET from satellites for precise water resource management is still challenging due to the limitations in both existing ET models and satellite input data. Specifically, the process of ET is complex and difficult to model, and existing satellite remote-sensing data could not fulfill high resolutions in both space and time. To address the above two issues, this study presents a new high spatiotemporal resolution ET mapping framework, i.e., BESS-STAIR, which integrates a satellite-driven water–carbon–energy coupled biophysical model, BESS (Breathing Earth System Simulator), with a generic and fully automated fusion algorithm, STAIR (SaTallite dAta IntegRation). In this framework, STAIR provides daily 30 m multispectral surface reflectance by fusing Landsat and MODIS satellite data to derive a fine-resolution leaf area index and visible/near-infrared albedo, all of which, along with coarse-resolution meteorological and CO2 data, are used to drive BESS to estimate gap-free 30 m resolution daily ET. We applied BESS-STAIR from 2000 through 2017 in six areas across the US Corn Belt and validated BESS-STAIR ET estimations using flux-tower measurements over 12 sites (85 site years). Results showed that BESS-STAIR daily ET achieved an overall R2=0.75, with root mean square error RMSE =0.93 mm d−1 and relative error RE =27.9 % when benchmarked with the flux measurements. In addition, BESS-STAIR ET estimations captured the spatial patterns, seasonal cycles, and interannual dynamics well in different sub-regions. The high performance of the BESS-STAIR framework primarily resulted from (1) the implementation of coupled constraints on water, carbon, and energy in BESS, (2) high-quality daily 30 m data from the STAIR fusion algorithm, and (3) BESS's applicability under all-sky conditions. BESS-STAIR is calibration-free and has great potentials to be a reliable tool for water resource management and precision agriculture applications for the US Corn Belt and even worldwide given the global coverage of its input data.


Accurate field-level management of water resources urgently demands reliable estimations of evapotranspiration (ET) at high spatial and temporal resolutions. ET is the sum of water loss from the soil surface through evaporation and that from plant components through leaf transpiration and evaporation, and ET at cropland is usually considered for crop water use (Allen et al., 1998). ET consumes up to 90 % of total water inputs (precipitation plus irrigation) in agro-ecosystems in the western and Midwestern United States (Irmak et al., 2012). In the US Corn Belt, where more than 85 % of corn and soybean is produced in the US (Grassini et al., 2015), increasing vapor pressure deficit (VPD) and drought sensitivity have been recognized as severe threats to future crop security (Lobell et al., 2014; Ort and Long, 2014). The vulnerability to drought in this region is further exacerbated by elevated rates of grass-to-crop conversion and expansion of irrigated areas (Brown and Pervez, 2014; Wright and Wimberly, 2013). Furthermore, precision water resource management requires the capacity to account for spatial heterogeneity and to guide real-time decision-making (GAO, 2019). Accordingly, reliable tools are urgently needed to estimate, map, and monitor the total amount and spatial and temporal variations of cropland ET.
One critical requirement for the accurate estimations of ET at high spatiotemporal resolutions is reliable and advanced satellite-based models. This is challenging because the process of ET is complex and difficult to model. ET results from balance between atmospheric water demand and soil water supply, and it is also regulated by plants through canopy development and stomatal behaviors in order to optimize their water, carbon, and energy use strategies (Katul et al., 2012; Wang and Dickinson, 2012). A large number of satellite-based ET estimation methods have been developed based on different theories and techniques. In general, they can be grouped into many categories: statistical or machine-learning methods (Jung et al., 2010; Lu and Zhuang, 2010), water balance methods (Pan et al., 2012; Wan et al., 2015), energy balance methods (Anderson et al., 1997; Su, 2002), triangular or trapezoid space methods (Jiang and Islam, 1999; Li et al., 2009), Priestley–Taylor methods (Fisher et al., 2008; Miralles et al., 2011), and Penman–Monteith methods (Mu et al., 2011; Yebra et al., 2013). Kalma et al. (2008), Li et al. (2009), and K. Zhang et al. (2016) have provided detailed reviews of the pros and cons of different remote-sensing approaches.
Given the complexity of the ET process, we argue that a reliable ET model should include both necessary biophysical processes and high-quality multi-source observations to constrain ET estimations (Loew et al., 2016). While remote-sensing-based approaches tend to focus on constraints from various satellite data, land-surface models (LSMs) are proficient at including processes that account for interactions between environment and plant structure and functions. Given the gaps between remote sensing and LSMs, a distinct ET model, the Breathing Earth System Simulator (BESS), was developed (Jiang and Ryu, 2016; Ryu et al., 2011). Different from the above-mentioned remote-sensing models, BESS is a biophysical model, which adopts modules commonly implemented in LSMs but uses various satellite remote-sensing data as direct inputs. Specifically, BESS is a two-leaf water–carbon–energy coupled model driven by environmental and vegetation variables derived from multi-source satellite data. As the energy cycle, carbon cycle, and water cycle are jointly modeled and mutually constrained in BESS, it has produced a series of high-quality global long-term (2000–2017) products, including the 5 km resolution global radiation (Rg), photosynthetically active radiation (PAR) and diffuse PAR products (Ryu et al., 2018), and 1 km resolution gross primary productivity (GPP) and ET products (Jiang and Ryu, 2016), which enables tracking of crop growth and yields too (Huang et al., 2018). In particular, the 1 km resolution BESS ET product is able to capture the total amount and spatial and temporal variations in arid/semi-arid areas like Australia (Whitley et al., 2016, 2017), California (Baldocchi et al., 2019), and northwestern China (Wei et al., 2019). The fidelity of the coarse-resolution BESS ET product suggests its potential at fine resolutions.
The other critical requirement for accurate estimations of ET at high spatiotemporal resolutions is satellite input data at high resolutions in both space and time. This is challenging because existing satellite missions cannot satisfy the two conditions simultaneously. Data fusion techniques, which take multi-sensor data to generate fusion data with high resolutions in both space and time, provide a possible and scalable solution. Several such algorithms have been developed over the past decade (Gao et al., 2006; Houborg and Mccabe, 2018; Zhu et al., 2010), and they have been successful for localized applications (Gao et al., 2017; Gómez et al., 2016; Wu et al., 2015). Notably, energy balance and thermal-based ET models such as ALEXI/DisALEXI and SEBS have been combined with the fusion algorithms such as STARFM and ESTARFM to generate daily 30 m ET estimations with favorable performance at several sites (Anderson et al., 2018; Cammalleri et al., 2013; Li et al., 2017; Ma et al., 2018).
Here we propose and present a new ET estimation framework that combines BESS with a novel fusion algorithm, SaTallite dAta IntegRation (STAIR) (Luo et al., 2018), for accurate ET estimation at high resolution in both time and space. BESS has demonstrated its high performance in estimating ET at medium to coarse resolutions, but the major obstacle of moving BESS's ET estimation to finer resolutions is the lack of key vegetation status variables at higher spatial resolutions, including leaf area index (LAI) and visible and near-infrared albedo (αVIS and αNIR). In BESS, this surface information is critical for resolving spatial heterogeneity, while environmental information such as radiation, temperature, humidity, and CO2 concentration is relatively homogeneous. To cope with the absence of high spatiotemporal resolution vegetation data, we propose coupling STAIR with BESS. STAIR is a generic and fully automated fusion algorithm to generate a cloud-/gap-free surface reflectance product at high spatiotemporal resolution (Luo et al., 2018). Instead of manually selecting image pairs adopted by most other data fusion algorithms, STAIR automatically takes full advantage of time series of daily coarse-resolution images and fine-resolution but less frequent images. Moreover, STAIR's high efficiency in computation allows scalability for large-scale productions, which enable this new framework to deliver daily 30 m ET at regional and decadal scales.
The objective of this study is to address a fundamental issue in agro-ecological science and applications: lack of high spatiotemporal gap-free ET data for decision-making. We implemented a new ET estimation framework, BESS-STAIR, and tested it in six study areas across the US Corn Belt from 2000 to 2017. This is the first attempt to couple a satellite-driven biophysical model with a data fusion technique to provide daily 30 m resolution ET estimations at regional and decadal scales. While existing frameworks retrieve clear-sky ET from satellite-observed land-surface temperature (LST) and fill ET gaps for cloudy-sky days, BESS-STAIR simulates all-sky ET and LST as a result of crop biophysical properties. This way has more referential significance for crop modeling studies and has the potential to forge a new path in agro-ecological science and applications. We conducted a comprehensive evaluation of the BESS-STAIR ET estimations with regards to the overall performance, spatial patterns, seasonal cycles, and interannual dynamics, benchmarked on the ET observations from 12 eddy-covariance flux towers across the US Corn Belt. The paper also discusses the performance, advantages, limitations, and potential improvements of the BESS-STAIR ET framework.
BESS-STAIR estimates cropland ET at 30 m resolution at a daily interval (Fig. 1). BESS is driven by environmental variables (radiation, temperature, humidity, and CO2 concentration), plant structural variables (LAI, αVIS, and αNIR), and plant functional variables (peak maximum carboxylation rate at 25 ∘C (peak Vcmax25) and Ball–Barry coefficients, for C3 and C4 plants, respectively). Among these key inputs, LAI, αVIS, and αNIR characterize crop canopy structure, which are usually very heterogeneous. In the global BESS ET product (Jiang and Ryu, 2016), these vegetation variables are derived from MODIS satellite data at 1 km resolution, while in BESS-STAIR they are derived from 30 m resolution surface reflectance fused from high spatial resolution Landsat data and high temporal resolution MODIS data by STAIR.
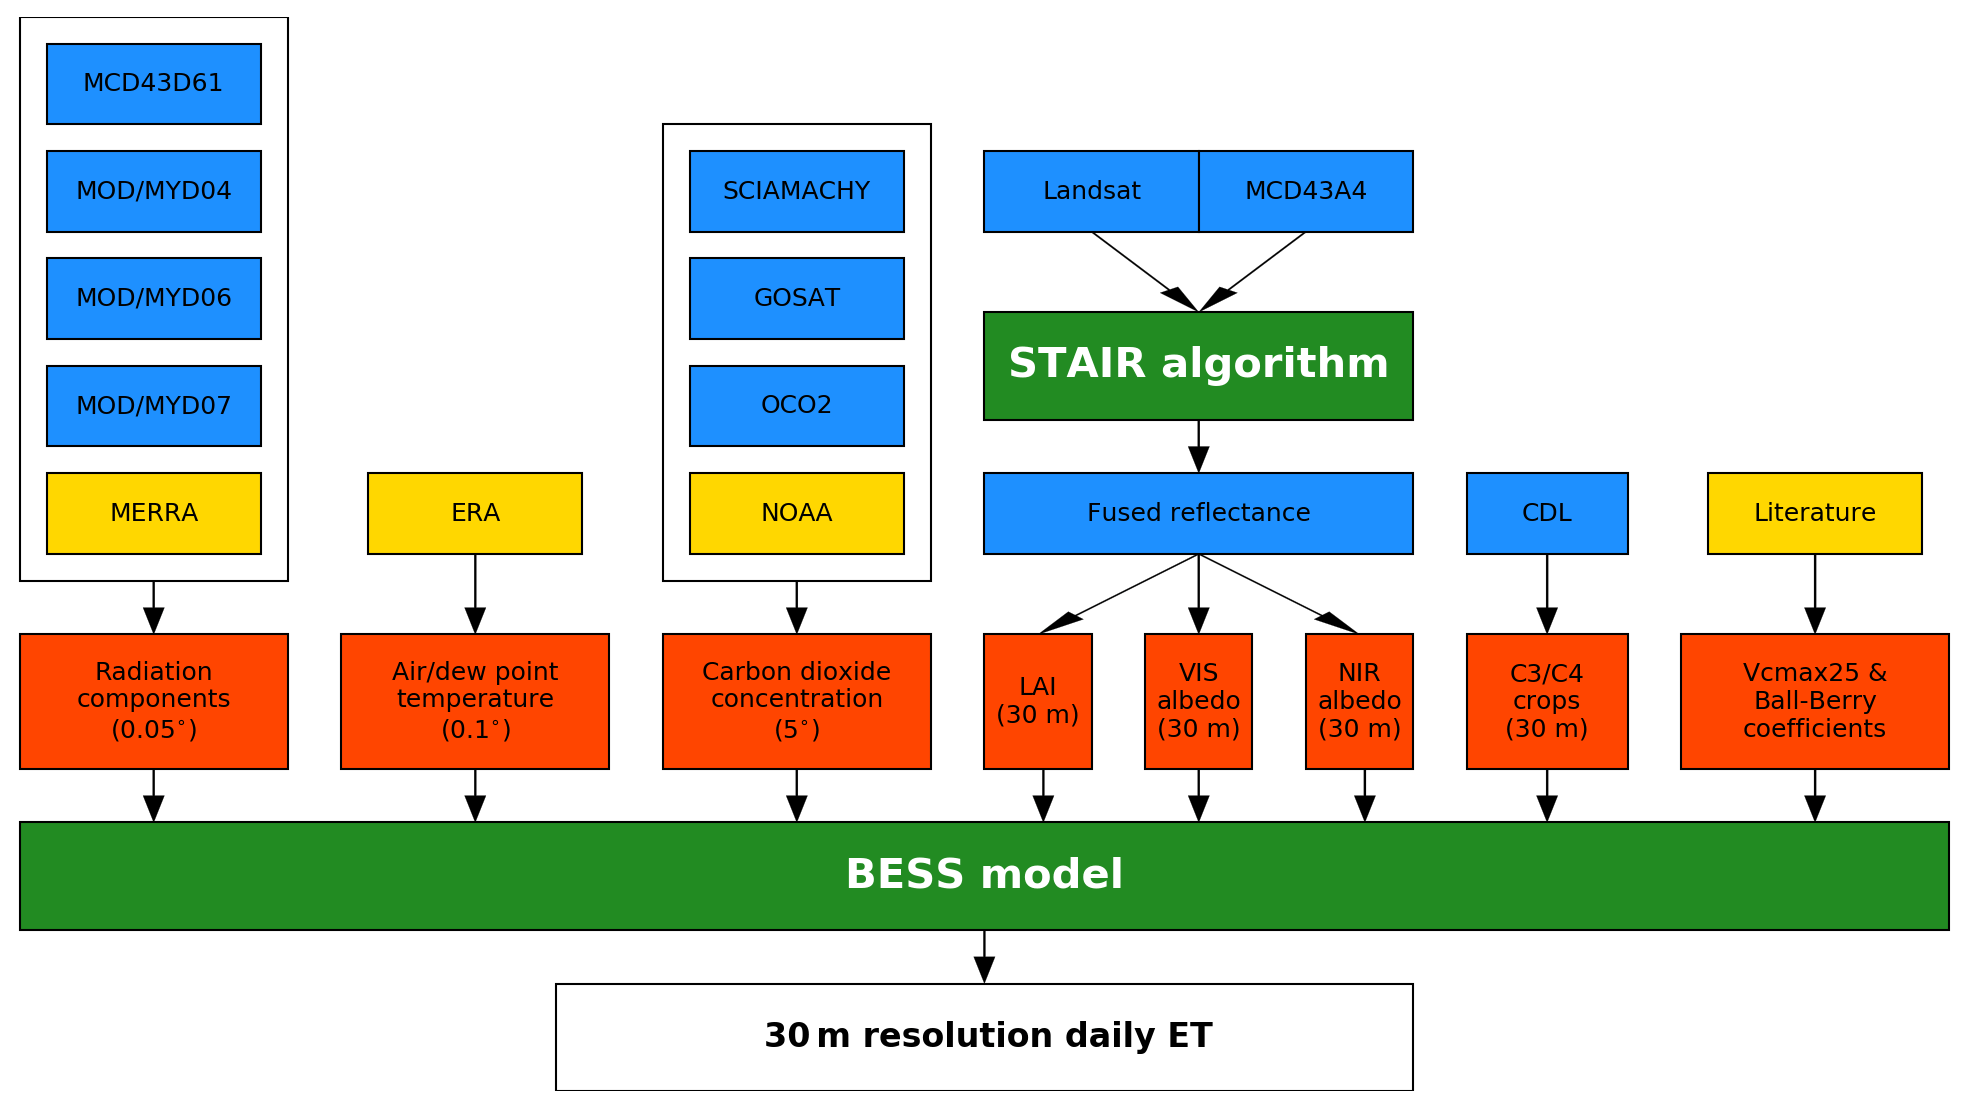
Figure 1The BESS-STAIR framework. The BESS ET estimation model and the STAIR data fusion algorithm are highlighted in green boxes. Blue boxes are satellite data, yellow boxes are ancillary data, and red boxes are key inputs to BESS. The output of BESS-STAIR is the 30 m resolution daily ET highlighted in a white box.
2.1 The ET estimation model: BESS
BESS is a sophisticated satellite-driven water–carbon–energy coupled biophysical model designed to continuously monitor and map water and carbon fluxes (Jiang and Ryu, 2016; Ryu et al., 2011). It is a simplified land-surface model, including an atmosphere radiative transfer module (Kobayashi and Iwabuchi, 2008; Ryu et al., 2018), a two-leaf canopy radiative transfer module (De Pury and Farquhar, 1997), and an integrated carbon assimilation–stomatal-conductance–energy balance module. Specifically, the Farquhar model for C3 and C4 plants (Collatz et al., 1991, 1992), the Ball–Berry model (Ball et al., 1987), and the quadratic form of the Penman–Monteith equation (Paw U and Gao, 1988) are used for the simulation of carbon assimilation, stomatal conductance, and energy balance, respectively. This carbon–water integrated module employs an iterative procedure to solve intercellular CO2 concentration, stomatal conductance, and leaf temperature for a sunlit/shaded canopy. Instantaneous sunlit/shade GPP and sunlit/shade/soil ET and net radiation at Terra and Aqua overpass times are simultaneously estimated, followed by a temporal upscaling procedure to derive daily GPP and ET using semi-empirical cosine functions (Ryu et al., 2012). The Priestley–Taylor equation is used to compute daily potential ET (PET) based on estimated daily net radiation and meteorological inputs.
A unique feature of BESS is that it takes full advantage of atmospheric and land products derived from multi-source satellite data. By using MOD/MYD 04 aerosol products (Sayer et al., 2014), MOD/MYD 06 cloud products (Baum et al., 2012), MOD/MYD 07 atmospheric profile products (Seemann et al., 2003), along with gap-free atmospheric data provided by MERRA-2 reanalysis products (Gelaro et al., 2017), BESS calculates direct/diffuse visible/near-infrared radiation components at 0.05∘ resolution. By coupling CO2 concentration derived from SCIAMACHY and GOSAT satellite data (Dils et al., 2014) with those from OCO-2 satellite data (Hammerling et al., 2012) as well as NOAA long-term field observations (https://www.esrl.noaa.gov/gmd/ccgg/trends/, last access: 11 March 2020), BESS derives long-term continuous monthly CO2 concentration maps. Finally, in this study BESS uses air temperature and dew point temperature provided by ERA5 reanalysis products at 0.1∘ resolution (Hersbach, 2016). In addition to these environmental variables, BESS also highly relies on vegetation structural and functional variables. By using a satellite-derived LAI, αVIS, and αNIR, BESS quantifies the absorption of ultraviolet/visible/near-infrared radiation by sunlit/shaded canopy through a canopy radiative transfer model. This model also upscales leaf level (Vcmax25) to sunlit/shaded canopy, which is used in the Farquhar photosynthesis model. Vcmax25 is a parameter depending on the plant functional type (Bonan et al., 2011; Kattge et al., 2009), and its seasonal variation is empirically parameterized by the LAI (Ryu et al., 2011).
2.2 The data fusion algorithm: STAIR
STAIR is a generic and fully automated method for fusing multi-spectral satellite data to generate high spatiotemporal resolution and cloud-/gap-free data (Luo et al., 2018). It fully leverages the complementary strengths in the high temporal resolution MCD43A4 nadir reflectance (daily but 500 m resolution) (Schaaf et al., 2002) and the high spatial resolution Landsat L2 nadir reflectance (30 m resolution but 16 d revisiting frequency) (Masek et al., 2006) time-series data. STAIR first imputes the missing pixels using an adaptive-average correction procedure and then employs a local interpolation model to capture finer spatial information provided by Landsat data, followed by a time-series refinement step that incorporates the temporal patterns provided by MODIS data. This strategy allows higher efficiency in missing-data interpolation as well as greater robustness against concurrently missed MODIS and Landsat observation, which is a common situation during continuous cloudy/snowy days.
The algorithm starts from the imputation of the missing pixels (due to cloud cover or Landsat 7 Scan Line Corrector failure) in satellite images. For MODIS images, a Savitzky–Golay filter is first applied to reconstruct continuous time series. For Landsat images, a two-step approach is employed using both temporal and spatial information from clear-sky observations. First, a temporal interpolation through a linear regression is applied as the initial gap-filling, based on the whole time series of images throughout a year. Second, an adaptive-average correction procedure is applied to remove inharmonic spatial patterns between gap-filled and original data. The target image is partitioned into multiple segments, each of which contains one type of homogeneous pixel. The relative difference between a gap pixel and neighborhood pixels of it within the same segment is calculated using clear-sky observations acquired at several dates close to the target image acquisition date. Based on the assumption that the relative difference remains roughly the same across different dates in a short time period (e.g., < 2–3 weeks), such a difference is used to correct the filled values of the gap pixel derived from temporal interpolation so that the spatial relationship between the gap-filled pixel and its neighborhood pixels within the same segment is consistent with those in clear-sky observations.
The STAIR fusion algorithm fully exploits the spatial and temporal information in the time series of gap-filled MODIS and Landsat images throughout the growing season (April–October). A nearest-neighbor sampling is conducted for all the MODIS images to achieve the same image size, pixel resolution, and projected coordinate system with Landsat images. A difference image is calculated for each pair of Landsat and resampled MODIS images, and a linear interpolation is applied to reconstruct the difference image for any given date when no Landsat image is available. Such a difference image is used to correct the resampled MODIS image on that date and to generate a fused Landsat image. In this manner, the fused image captures the most informative spatial information provided by the high spatial resolution Landsat data and incorporates the temporal patterns provided by the high temporal resolution MODIS data without any user interference. The fusion algorithm is applied to the six Landsat bands: blue, green, red, near-infrared (nir), shortwave infrared 1 (swir1), and shortwave infrared-2 (swir2).
2.3 Derivation of BESS inputs from STAIR data
At a global scale, LAI, αVIS, and αNIR can be obtained from MODIS and other satellite data, but for field-scale agricultural applications high spatial resolution data are needed to account for the spatial heterogeneity between fields or within a field. At this point, we employed two approaches to estimate 30 m resolution daily LAI from STAIR fused surface reflectance data: an empirical approach based on a linear relationship with vegetation indices (VIs) and a mechanistic approach based on inversion of a canopy radiative transfer model (RTM).
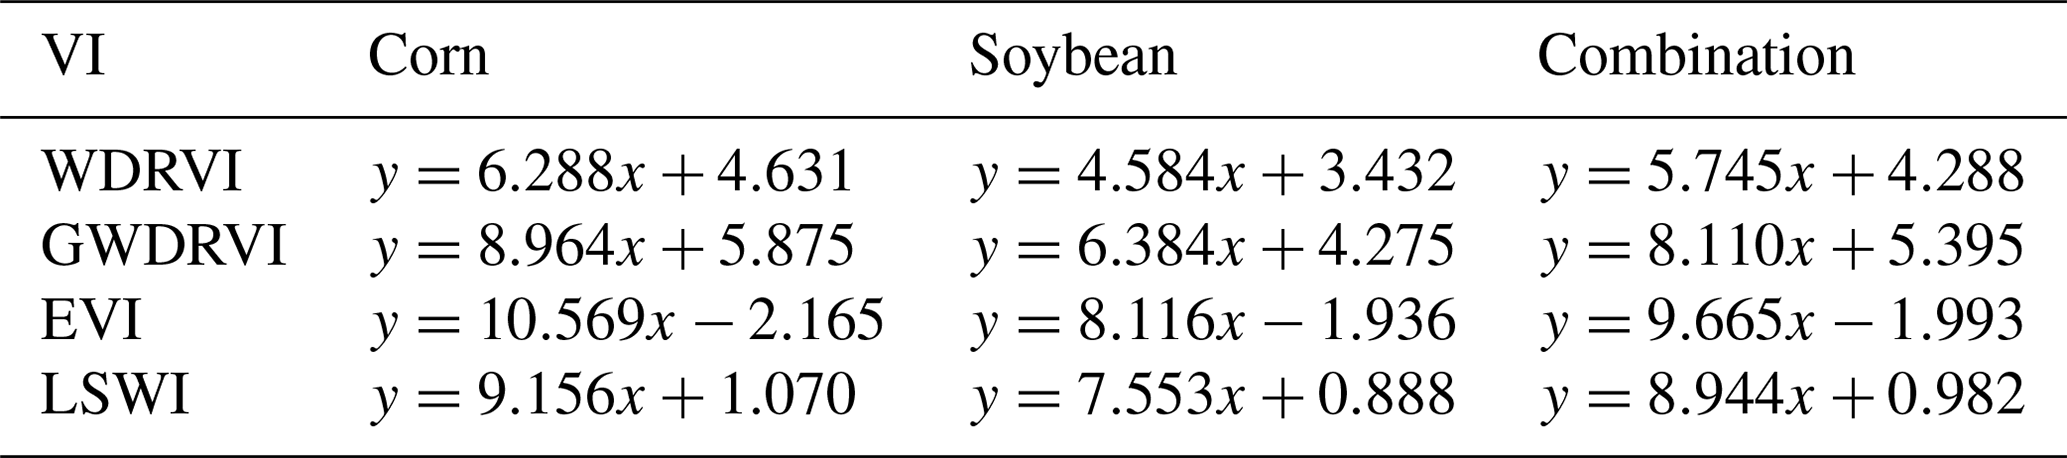
First, we estimated LAI using the empirical approach, because of availability of field LAI measurements in the study area. We calculated four VIs calculated from STAIR-derived spectral reflectance: Wide Dynamic Range Vegetation Index (WDRVI), Green Wide Dynamic Range Vegetation Index (GWDRVI), Enhanced Vegetation Index (EVI), and Land Surface Water Index (LSWI) for corn and soybean, respectively (Eqs. 1–3). These four VIs were chosen because they utilized information from different band combinations.
where ρB, ρG, ρR, ρN, and ρSW1 refer to the surface reflectance at blue, green, red, near-infrared, and the first shortwave-infrared band, respectively. Subsequently, we used field-measured LAI data collected using the destructive method at Mead, Nebraska, from 2001 through 2007 to build VI–LAI relationships (Gitelson et al., 2007). For each of the four VIs we build a linear regression between time series of VI and LAI for corn, soybean, and the combination of corn and soybean, respectively (Table 1). At this point, the equation derived from the combination of corn and soybean was used for vegetation cover other than corn and soybean. Although this might cause bias for forest LAI estimation, it is not a concern in this study as we focused on crop ET only. We applied linear regressions to four VIs separately and averaged the four derived LAIs as the final LAI estimation, with the expectation that such an average would reduce uncertainty caused by an individual VI–LAI relationship.
Table 1Linear equations for LAI (y) as a function of VI (x) for corn, soybean, and the combination of corn and soybean.
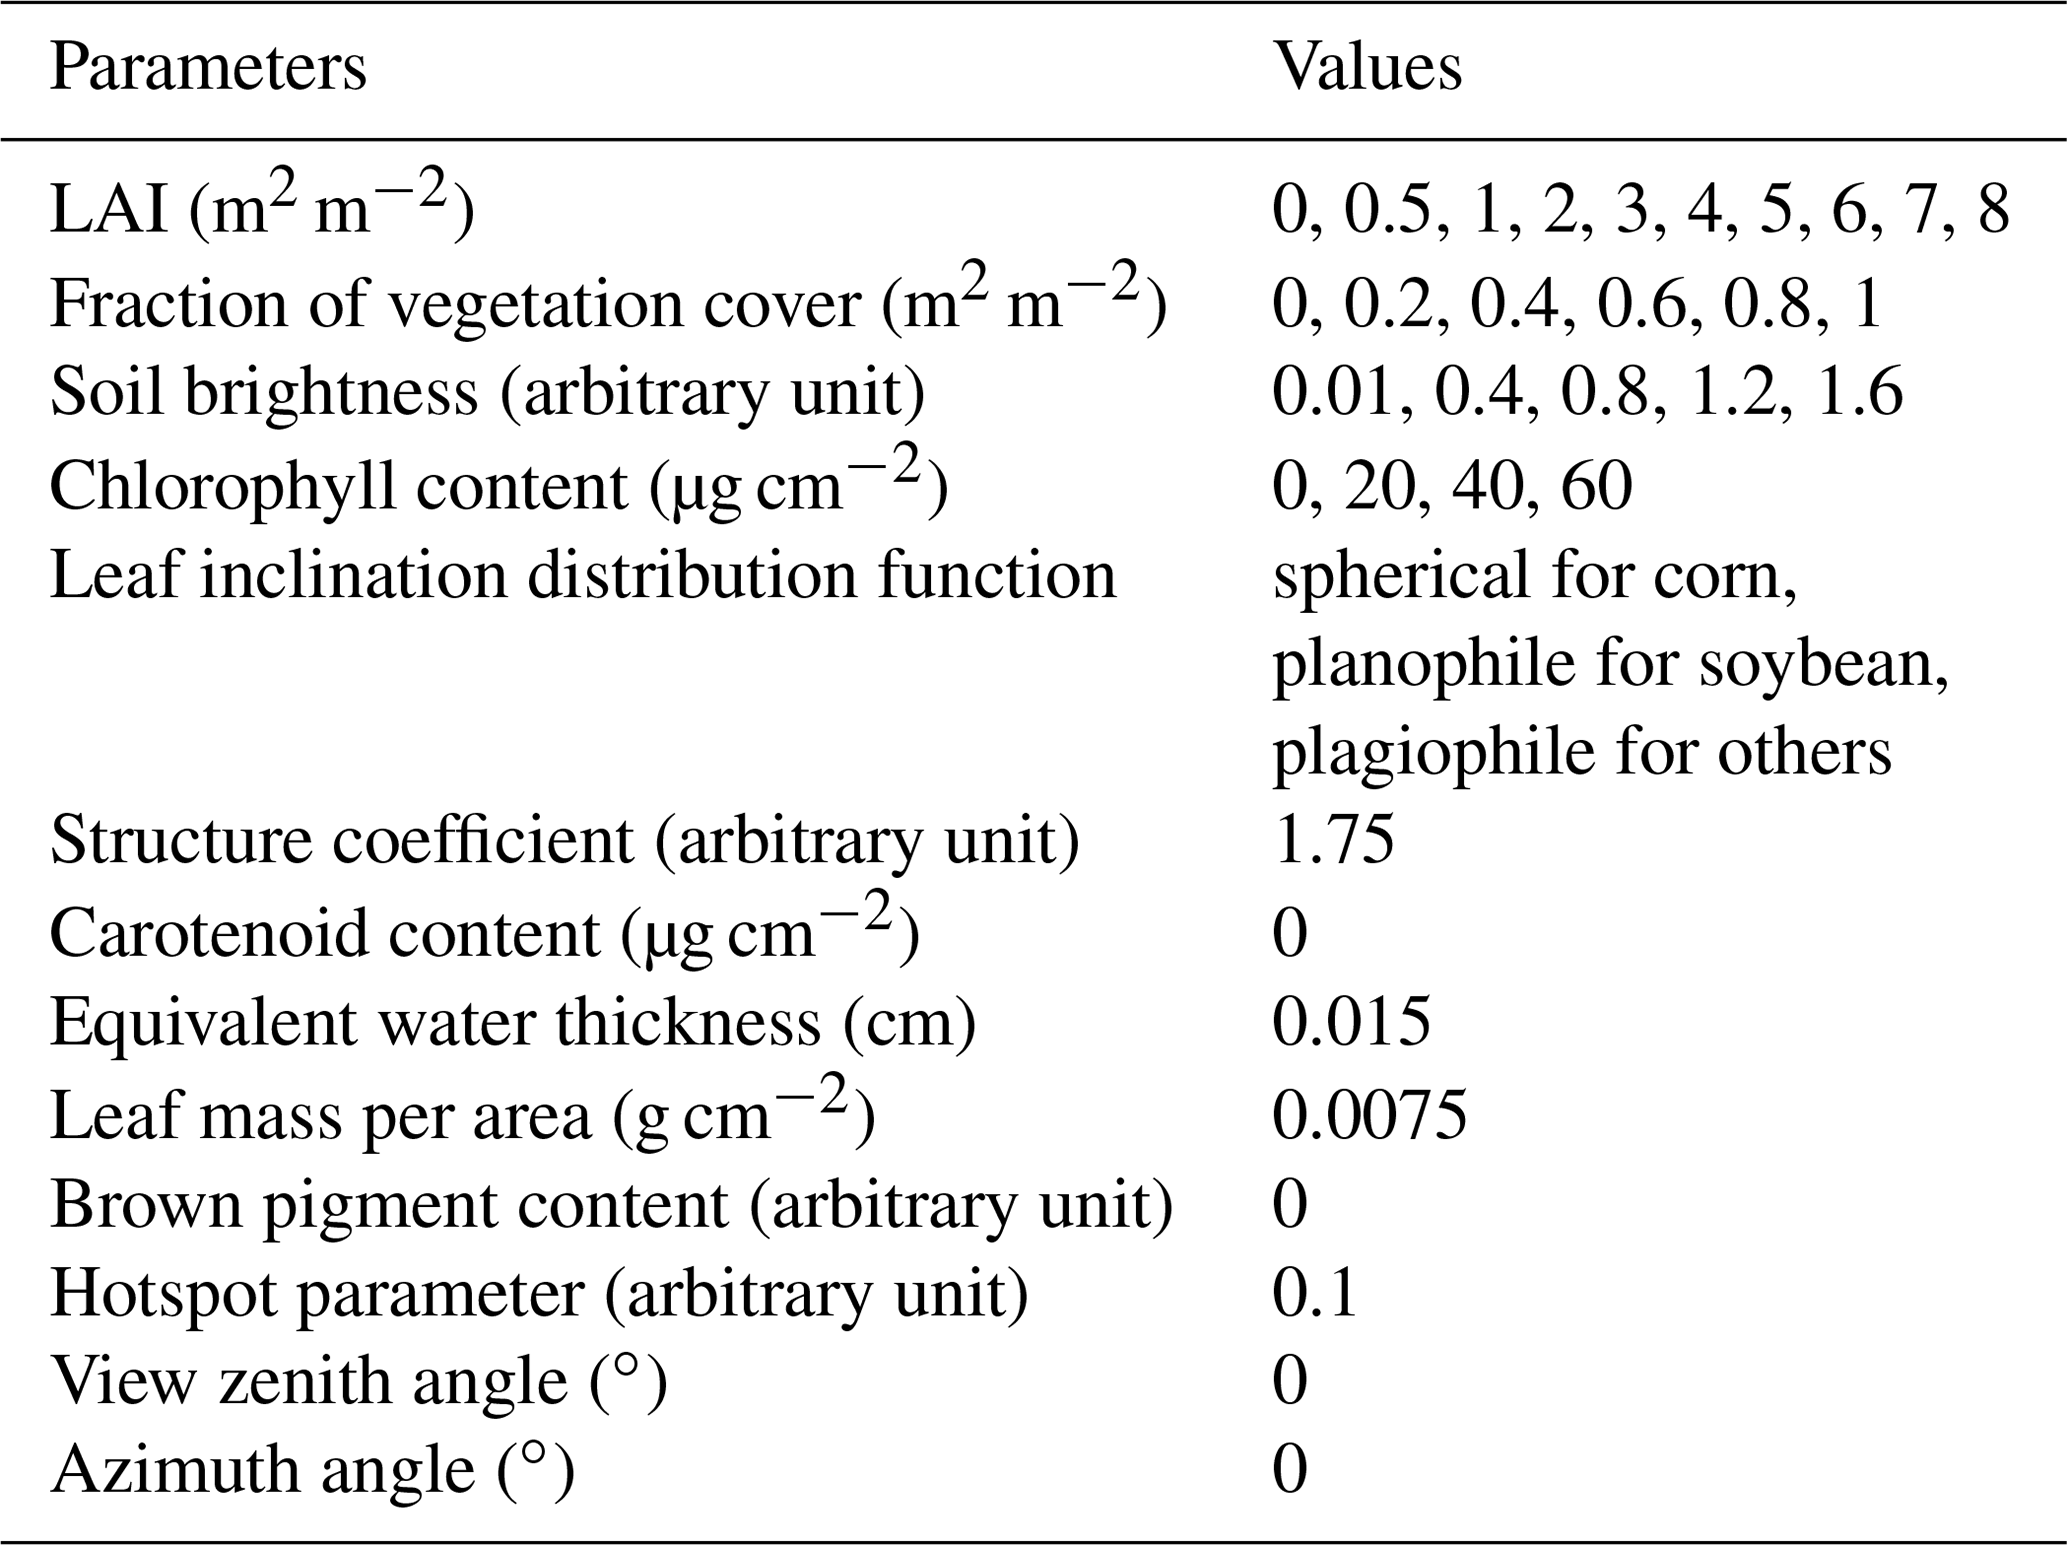
Second, we inversed the PROSAIL RTM using a look-up table (LUT) method. PROSAIL is an efficient and widely used model to simulate canopy reflectance given a set of sun-object-view geometry, canopy structure, leaf biochemical, and soil optical parameters (Jacquemoud et al., 2009). It is a combination of the PROSPECT leaf hyperspectral properties model (Jacquemoud et al., 1996; Jacquemoud and Baret, 1990) and the SAIL canopy bidirectional reflectance model (Verhoef, 1984, 1985). PROSAIL is particularly suitable for grasslands and croplands (Darvishzadeh et al., 2008; Xu et al., 2019) and is therefore used in this study. LUT is a robust and easy method to retrieve model parameters from observed canopy reflectance (Verrelst et al., 2018). It is based on the generation of a simulated canopy reflectance database for a number of plausible combinations of model parameter value ranges and the identification of parameter values in the database leading to the best agreement between simulated and observed canopy reflectance. LUT is particularly suitable for big data processing (Myneni et al., 2002) and is therefore used in this study.
We established a database by running PROSAIL with sampled parameter values listed in Table 2. For computation efficiency, we only sampled varied values for four parameters, while others were fixed. These four free parameters, including LAI (10 values), fraction of vegetation cover (6 values), soil brightness (5 values), and chlorophyll content (4 values), were chosen because they have been identified as the most sensitive parameters in canopy radiative transfer models (Bacour et al., 2002; Mousivand et al., 2014). Leaf inclination distribution function is also sensitive, but we set fixed types “spherical”, “planophile”, and “plagiophile” for corn, soybean, and other biomes, respectively (Nguy-Robertson et al., 2012; Pisek et al., 2013). The fixed values of other parameters were set according to the literature (Baret et al., 2007; Feret et al., 2008; Jacquemoud et al., 2009). Solar zenith angle at satellite overpass time can be calculated, so we did not set it as a free parameter. Instead, we built a set of databases with solar zenith angle values (∘) of 20, 25, 30, 35, 40, 45, and 50, respectively, representing the range during the growing season in the study area. In PROSAIL, specific absorption coefficients and the refractive index of leaf material are pre-measured hyperspectral data from 400 to 2500 nm with a 1 nm interval (Feret et al., 2008); we averaged them over wavelengths to match Landsat 7 bands and assumed differences of spectral ranges between Landsat 5, Landsat 7, and Landsat 8 have a marginal influence on LAI retrieval. We did not use the default soil spectrum in PROSAIL, but spatiotemporally averaged all cropland pixels' spectral reflectance in April when no crop is planted across the study area to derive representative soil spectral reflectance.
Table 2Parameter values needed to establish the canopy reflectance database by PROSAIL.
To retrieve LAI, we compared STAIR-derived surface reflectance (RSTAIR) with records in the canopy reflectance database simulated by PROSAIL (RPROSAIL) pixel by pixel. We used root mean square error (RMSE) as the cost function which was defined as
where indicates band number and l=6 for STAIR. Ideally, the simulated reflectance in the database yielding the smallest RMSE can be considered the best simulation, and the corresponding LAI value can be considered the solution for the satellite pixel. However, in reality the solution might not be unique, because different parameter combinations could derive similar reflectance simulations, and errors in both satellite and model could further amplify this problem (Verrelst et al., 2018). For this reason, we chose the top 10 % small RMSE simulations in the database and considered the average of the corresponding LAI values to be the final solution. The threshold of 10 % was decided by evaluating LUT-retrieved LAI against field-measured LAI at three Mead sites, and it was within a reasonable range from the top 50 records to the top 20 % of records suggested by previous studies (Duan et al., 2014; Weiss et al., 2000).
We further employed semi-empirical equations to calculate αVIS and αNIR (Liang, 2001) from STAIR-derived spectral reflectance in six Landsat bands:
where ρSW2 is the surface reflectance at the second shortwave-infrared band. For C3 crops/grasses, forests, and C4 crops/grasses, peak Vcmax25 values were set at 180, 60, and 45, respectively (Kattge et al., 2009; Zhang et al., 2014). Ball–Berry slope and intercept are another two important parameters used in the stomatal conductance model, and their values were set to 13.3 and 0.02 for C3 crops/grasses, 9.5 and 0.005 for forests, and 5.8 and 0.04 for C4 crops, respectively (Miner et al., 2017). Distributions of C3 and C4 crops were obtained from Crop Data Layer (CDL) data (Boryan et al., 2011).
2.4 Evaluation of BESS-STAIR ET
The BESS-STAIR ET estimations were evaluated against flux-tower ET measurements in the US Corn Belt. The US Corn Belt (Fig. 2) generally refers to a region in the Midwestern United States that has dominated corn and soybean production in the United States (Green et al., 2018), which currently produces about 45 % and 30 % of global corn and soybean, respectively (USDA, 2014). The region is characterized by relatively flat land, deep fertile soils, and high soil organic matter (Green et al., 2018). Most parts of the US Corn Belt have favorable growing conditions of temperature and rainfall. The majority of the croplands in the US Corn Belt are rainfed, with a small portion in the western part relying on irrigation.
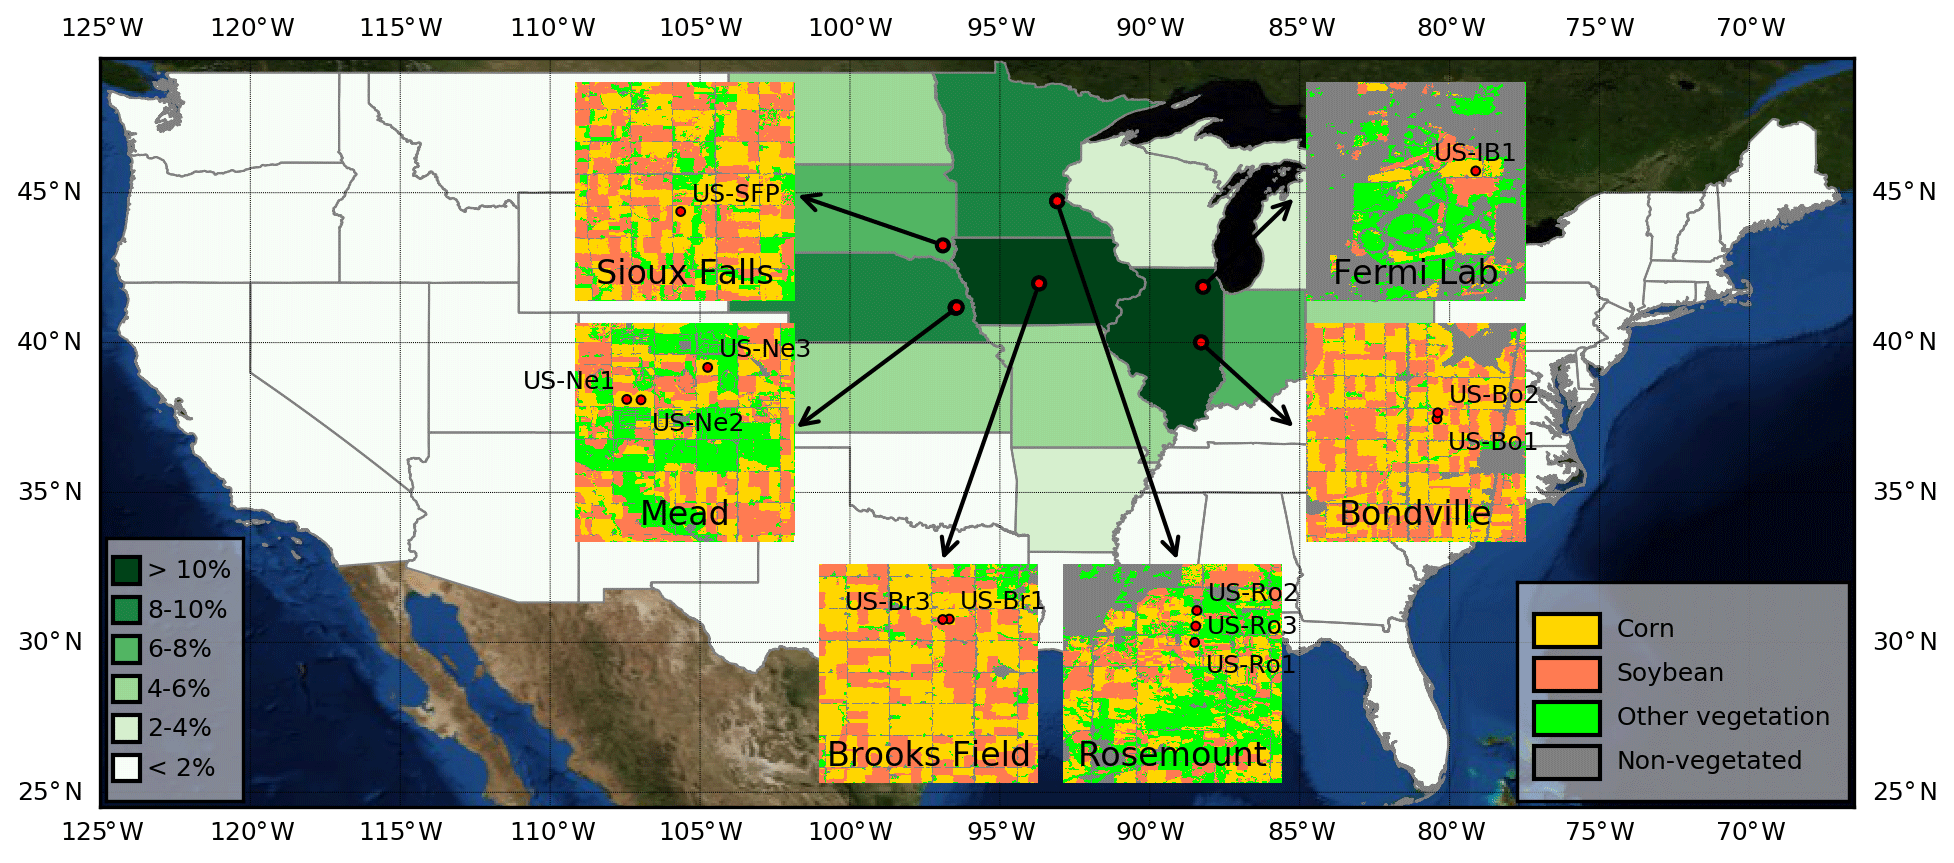
Figure 2Study areas. Red dots indicate 12 flux-tower sites scattered in six areas across the US Corn Belt. The background map indicates the percent each state contributes to the total national corn and soybean plantation area (USDA, 2018). The background image is a © NASA Blue Marble image.
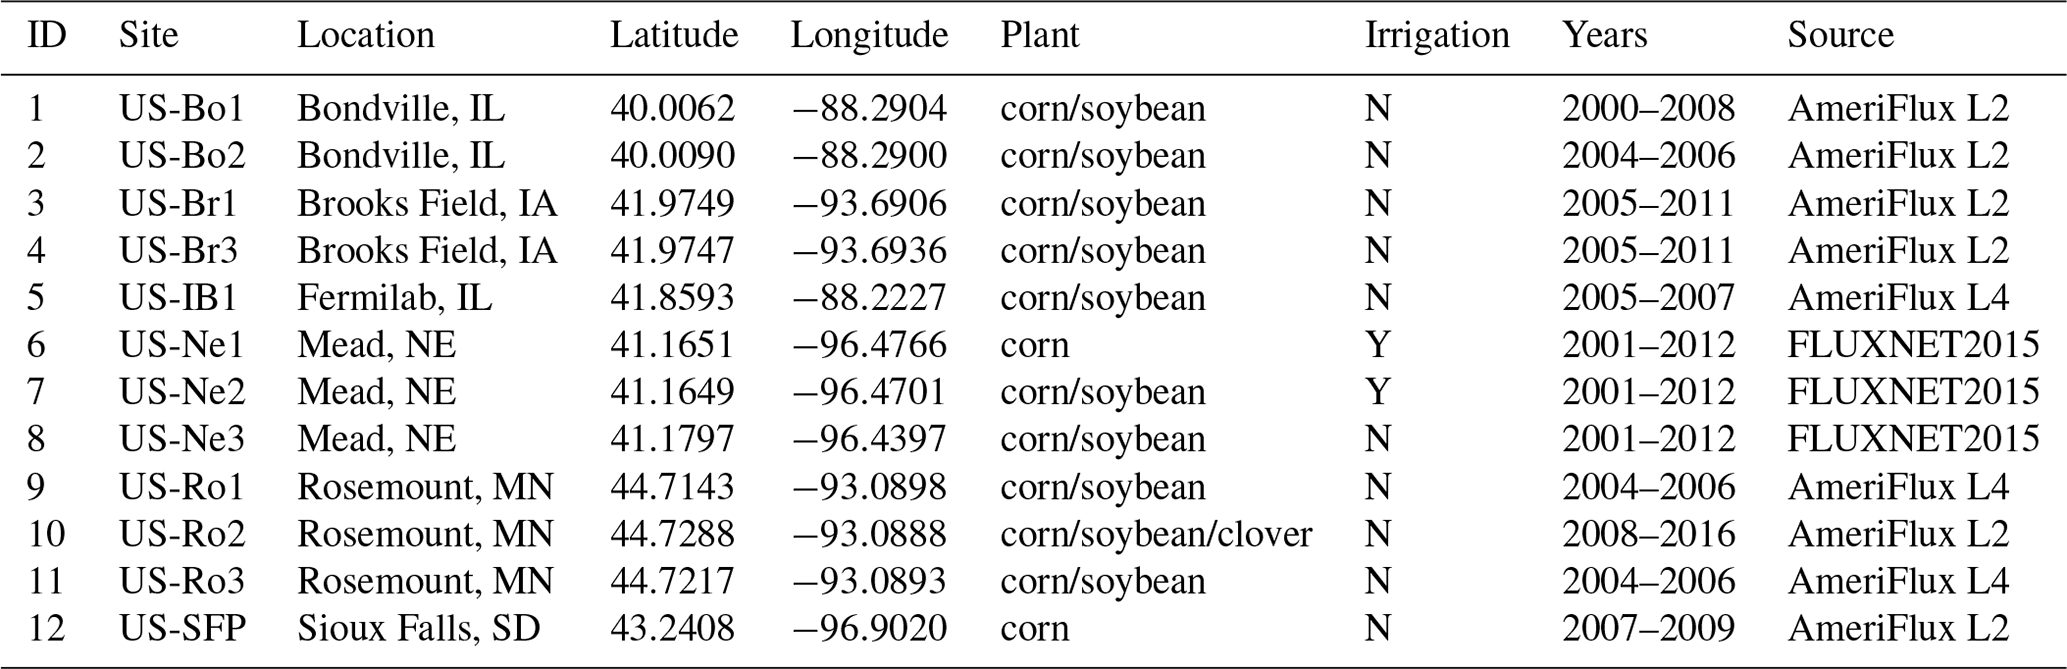
A total of 12 cropland sites scattered in six areas across the US Corn Belt are registered in the AmeriFlux or FLUXNET networks with publicly available ET data (Fig. 2 and Table 3). These sites include both corn only and corn–soybean rotation sites and both rainfed and irrigated sites, covering typical cropping patterns in the US Corn Belt. All of them were used in this study to ensure the representativeness of the validation for the precision agriculture applications in this region. For six sites, US-Bo1 (Meyers and Hollinger, 2004), US-Bo2 (Bernacchi et al., 2005), US-Br1 (Prueger et al., 2003), US-Br3 (Prueger et al., 2003), US-Ro2 (Turner et al., 2016), and US-SFP (Wilson and Meyers, 2007), level 2 half-hourly data were downloaded from the AmeriFlux website (http://ameriflux.lbl.gov/, last access: 11 March 2020). For three sites, US-IB1 (Matamala et al., 2008), US-Ro1 (Griffis et al., 2010), and US-Ro3 (Griffis et al., 2010), standardized gap-filled level 4 daily mean data were downloaded from the Carbon Dioxide Information Analysis Center data archive website (https://mirrors.asun.co/climate-mirror/cdiac.ornl.gov/pub/ameriflux/, last access: 11 March 2020). For the other three sites (Suyker et al., 2004), US-Ne1, US-Ne2, and US-Ne3, standardized high-quality gap-filled daily mean data were downloaded from the FLUXNET2015 website (http://fluxnet.fluxdata.org/data/fluxnet2015-dataset/, last access: 11 March 2020).
Table 3Information of 12 flux-tower sites used for validation.
By comparing with eddy-covariance ET, we evaluated three ET estimations: BESS-STAIR with VI-based LAI, BESS-STAIR with RTM-based LAI, and BESS-STAIR with MODIS LAI. MODIS LAI refers to the MCD15A3H 500 m resolution 4 d composite LAI product downloaded from https://lpdaac.usgs.gov/tools/data-pool/ (last access: 11 March 2020). Flux-tower measurements usually have an irregular and dynamic footprint at scales from 100 m to 1 km (Fu et al., 2014), but for simplicity, only 30 m resolution BESS-STAIR pixels containing the flux tower were used for the direct comparison. With regard to flux towers, measurement data were directly used without energy closure adjustment. For AmeriFlux level 2 data, half-hourly data were averaged to daily ET only if no gaps exist during the day to avoid sampling bias caused by missing data. For AmeriFlux level 4 data and FLUXNET2015 data, gap-filled daily ET was used directly.
3.1 Performance of STAIR LAI
LAI is the key input of BESS. The accuracy of high-resolution LAI estimations determines the validity of high-resolution ET estimations. We evaluated VI-based LAI and RTM-based LAI estimations derived from 30 m resolution STAIR fused surface reflectance data against field measurements. We also compared them with the 500 m resolution MODIS LAI. Overall, the STAIR-derived LAI agrees well with the measured LAI, with R2 > 0.85, RMSE < 0.8, and mean bias error (MBE) ≈0 (Fig. 3). The RTM-based method, which is calibration-free, yields the same performance as the VI-based method, which requires substantial field measurements to build empirical relationships. Misclassification of CDL data between corn and soybean is an important uncertainty source since both methods rely on crop types. During 2001–2007, 4 out of 21 site years (19 %) over the three Mead sites were misclassified. By using the correct classification (not shown), the accuracy of LAI estimations reaches R2=0.90 and RMSE =0.62 for the VI-based method and R2=0.89 and RMSE =0.68 for the RTM-based method. By comparison, the coarse-resolution MODIS LAI has relatively large errors, especially a negative bias (R2=0.55, RMSE =1.68, and MBE ).
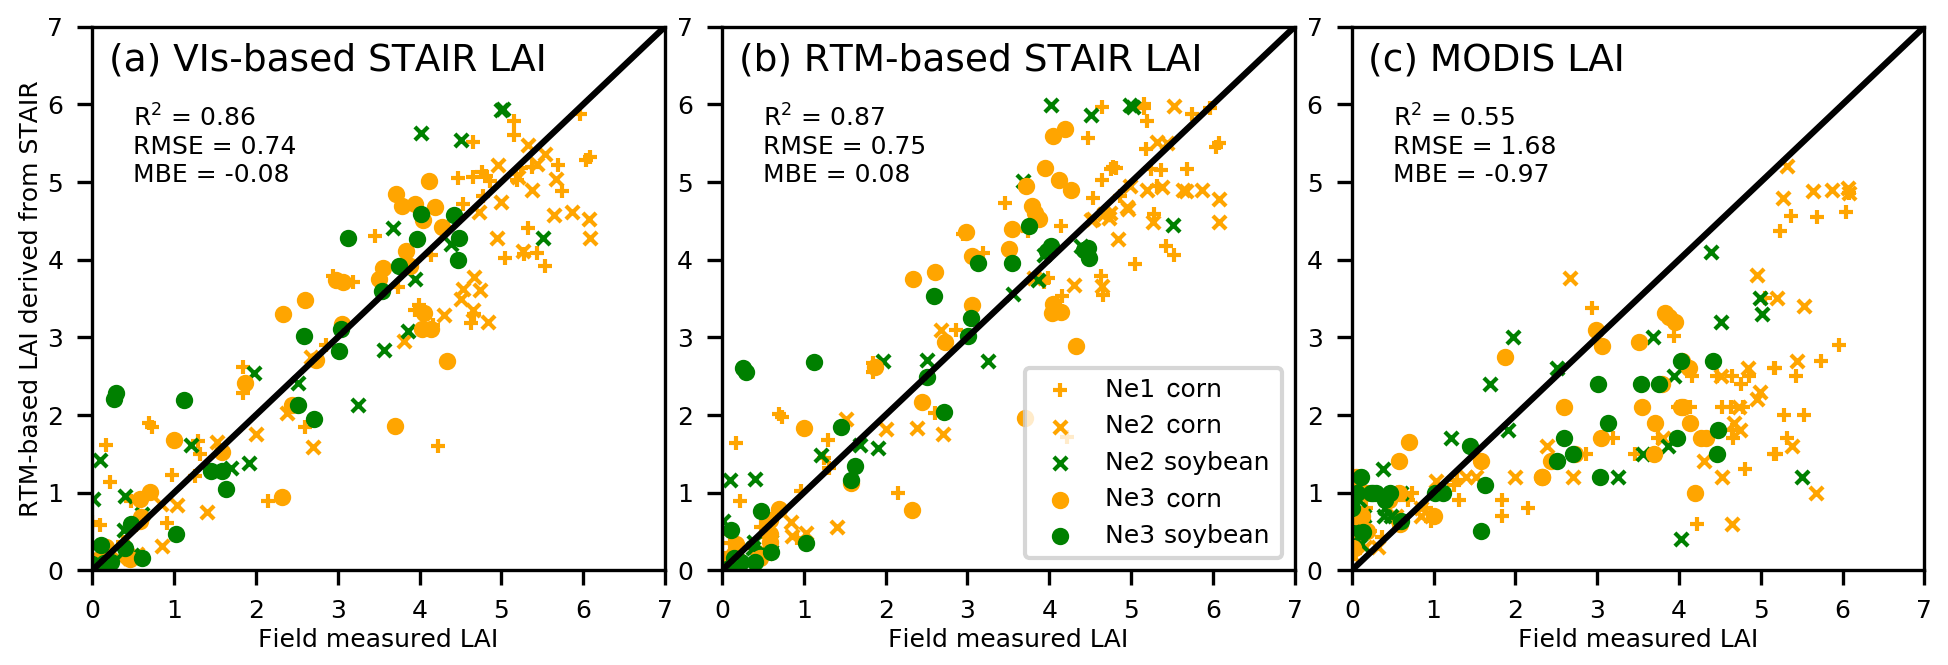
Figure 3Scatter plots between LAI measurements and LAI estimations. LAI measurements are destructively collected at the three Mead sites. (a–b) STAIR-derived daily 30 m resolution LAI using the VI-based method and the RTM-based method, respectively. (c) 500 m resolution MODIS LAI.
3.2 Performance of BESS-STAIR ET
BESS-STAIR daily ET estimations are in highly aligned agreement with ground truth from the 12 flux-tower measurements (Fig. 4). Across all of the 12 sites, BESS-STAIR ET with RTM-based LAI achieves an overall coefficient of determination (R2) of 0.75, a RMSE of 2.29 MJ m−2 d−1, a relative error , RE) of 27.9 %, and no overall bias. Figure 5 further exhibits its performance over all of the 12 flux-tower sites. R2 values range from 0.68 to 0.94 for corn and from 0.65 to 0.81 for soybean, highlighting the robustness of BESS-STAIR ET in the US Corn Belt. BESS-STAIR ET with VI-based LAI has similar performance (R2=0.75, RMSE =2.24 MJ m−2 d−1, and RE =27.4 %). Considering the relatively small difference between BESS-STAIR using RTM-based LAI and that using VI-based LAI, only the former one, which is calibration-free, is demonstrated in the following parts of this paper. By comparison, BESS ET with MODIS LAI shows larger errors (R2=0.65, RMSE =2.50 MJ m−2 d−1, and RE =30.2 %) compared to BESS-STAIR.
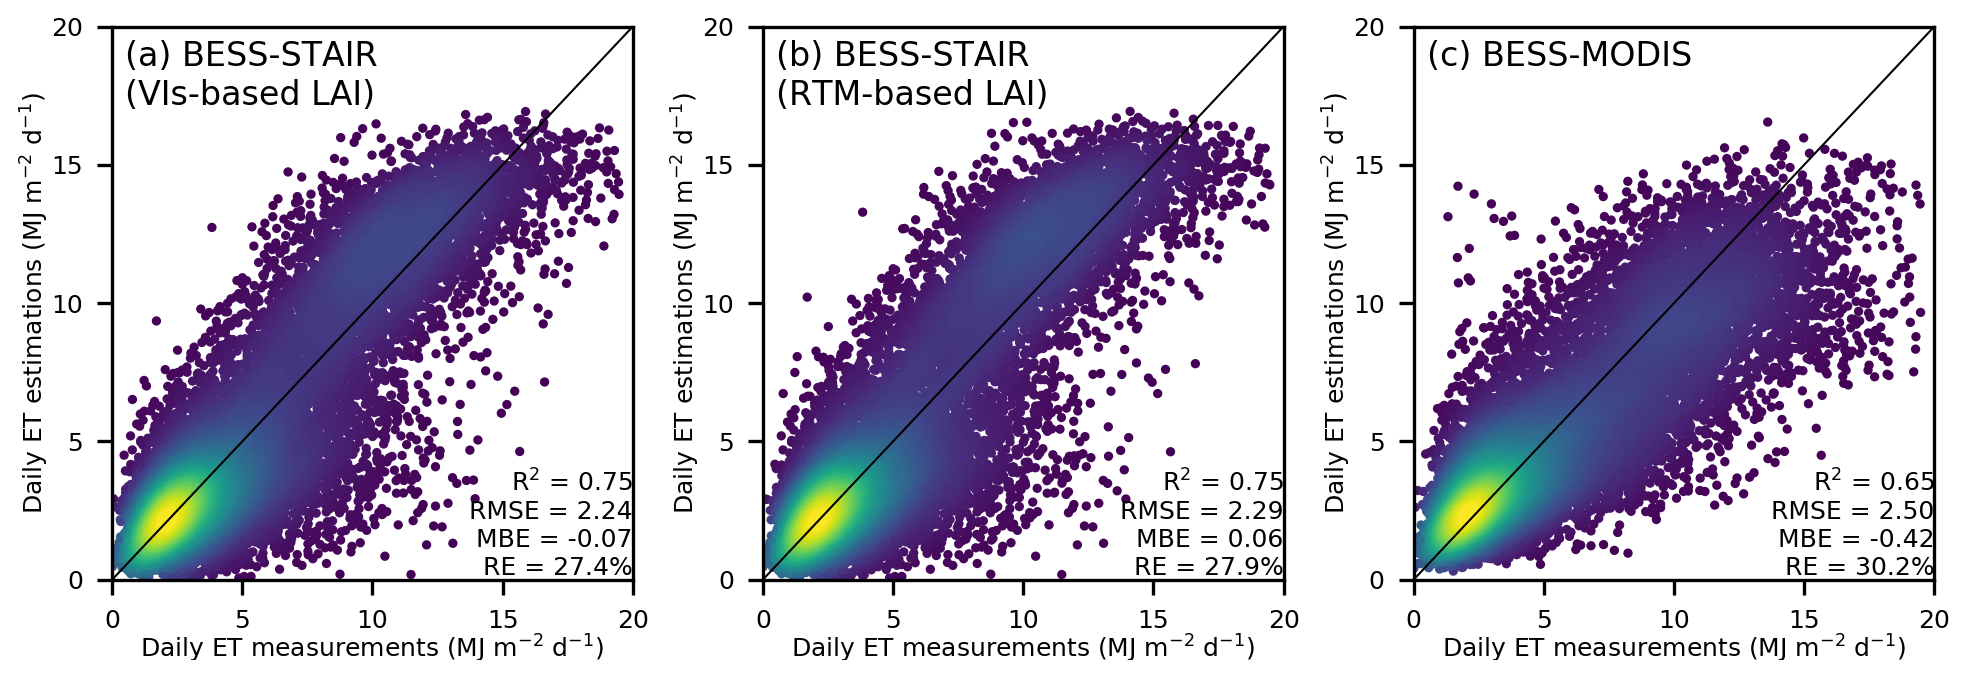
Figure 4Density scatter plots between ET measurements and ET estimations. ET measurements are from eddy-covariance data collected at 12 flux towers. (a, b) BESS-STAIR ET with VI-based LAI and RTM-based LAI, respectively. (c) 500 m BESS ET with MODIS LAI.
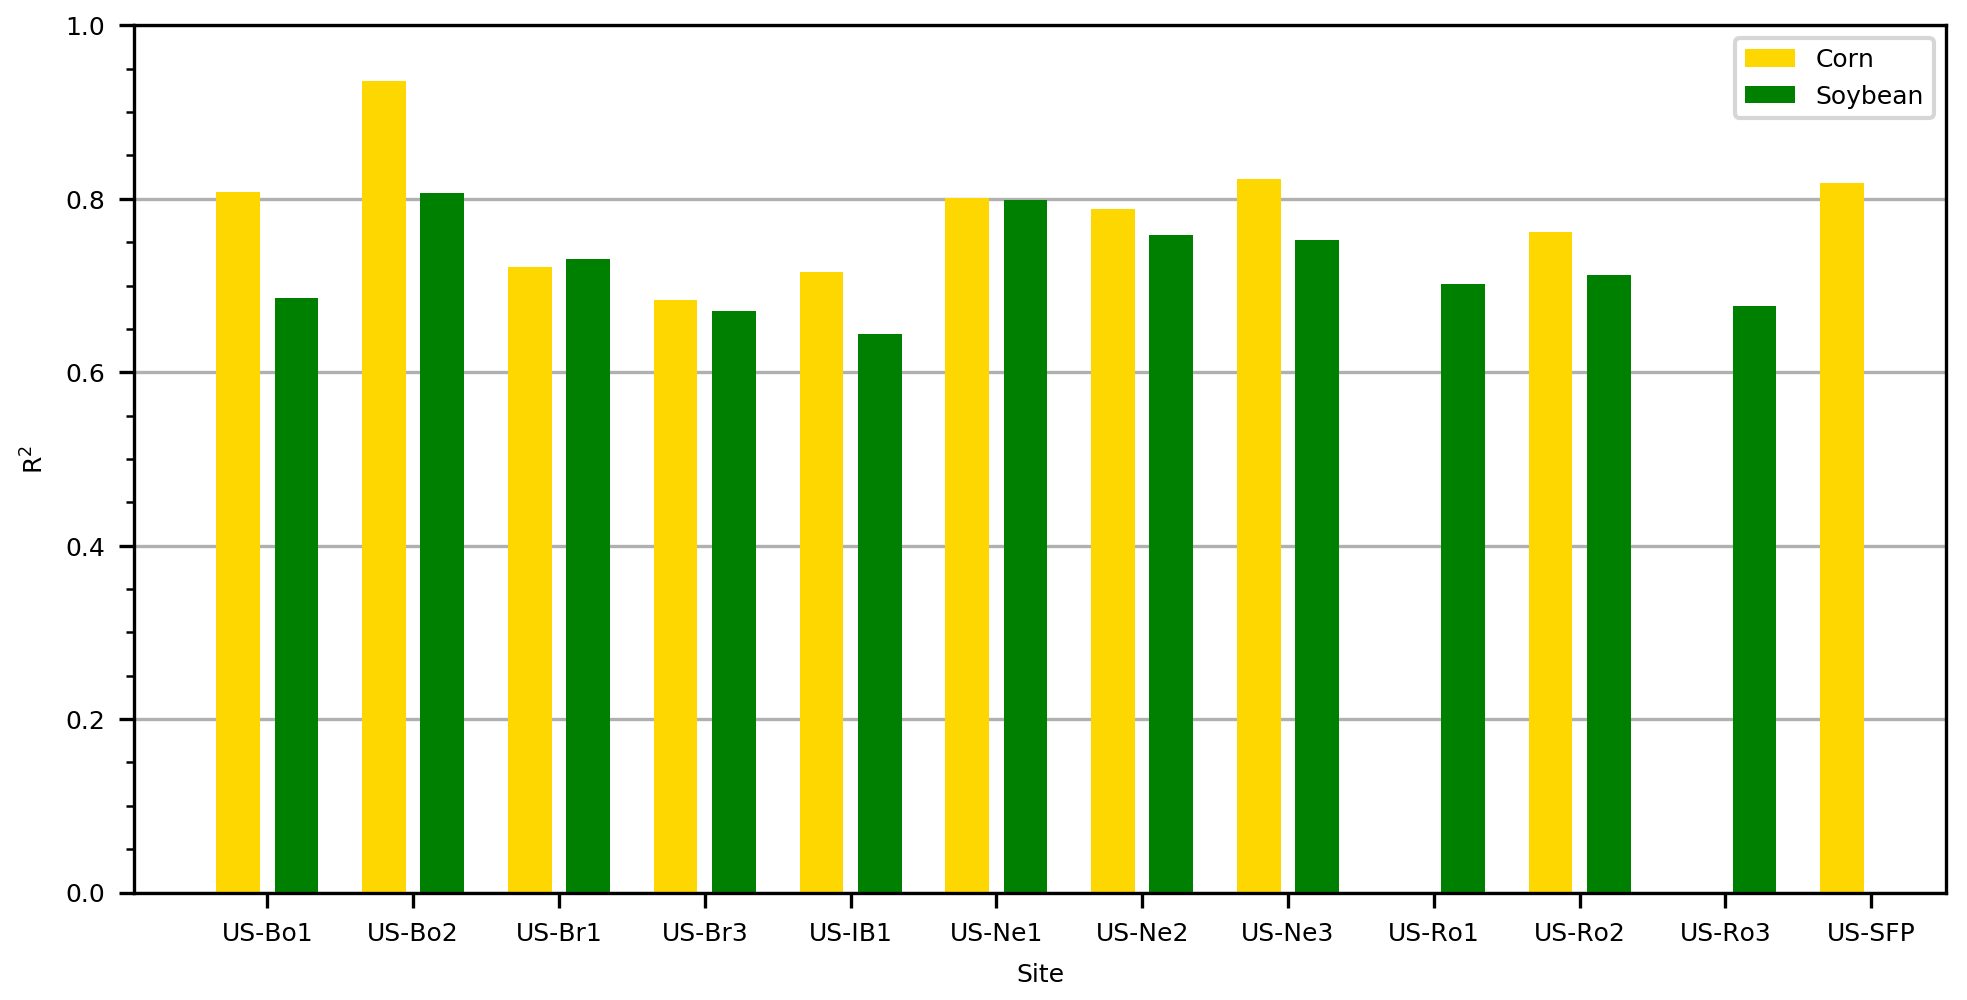
Figure 5Site-by-site R2 between flux tower measured and BESS-STAIR estimated daily ET for corn and soybean, respectively. Crop type is from CDL data.
Figure 6 shows the comparison between BESS-STAIR daily ET estimations and flux-tower measurements over site years with the fewest data gaps in measurements. Across all of the 12 sites, BESS-STAIR captures the seasonal characteristics of ET observation from flux towers well, as they exhibit generally consistent variations over the growing season. During the peak growing season (June, July, and August), the radiation displays a dominant impact on measured daily ET, and it is reasonably estimated by BESS-STAIR ET as well. In most cases, measured daily ET does not show a strong and fast response to precipitation and/or irrigation, possibly due to the plentiful water storage in soil. Two exceptions are US-IB1 (2006) and US-Ne3 (2012). In the case of US-IB1, no precipitation is available in August and little in July. As a result, daily ET measurements drop slightly more quickly in August than in the other cases. Such an anomaly is also depicted by BESS-STAIR ET. In the case of US-Ne3, the severe drought in the 2012 summer causes slightly lower ET values than the two adjacent irrigation sites (US-Ne1 and US-Ne2). BESS-STAIR ET also captures this considerable reduction, although a slight bias is observed in July.
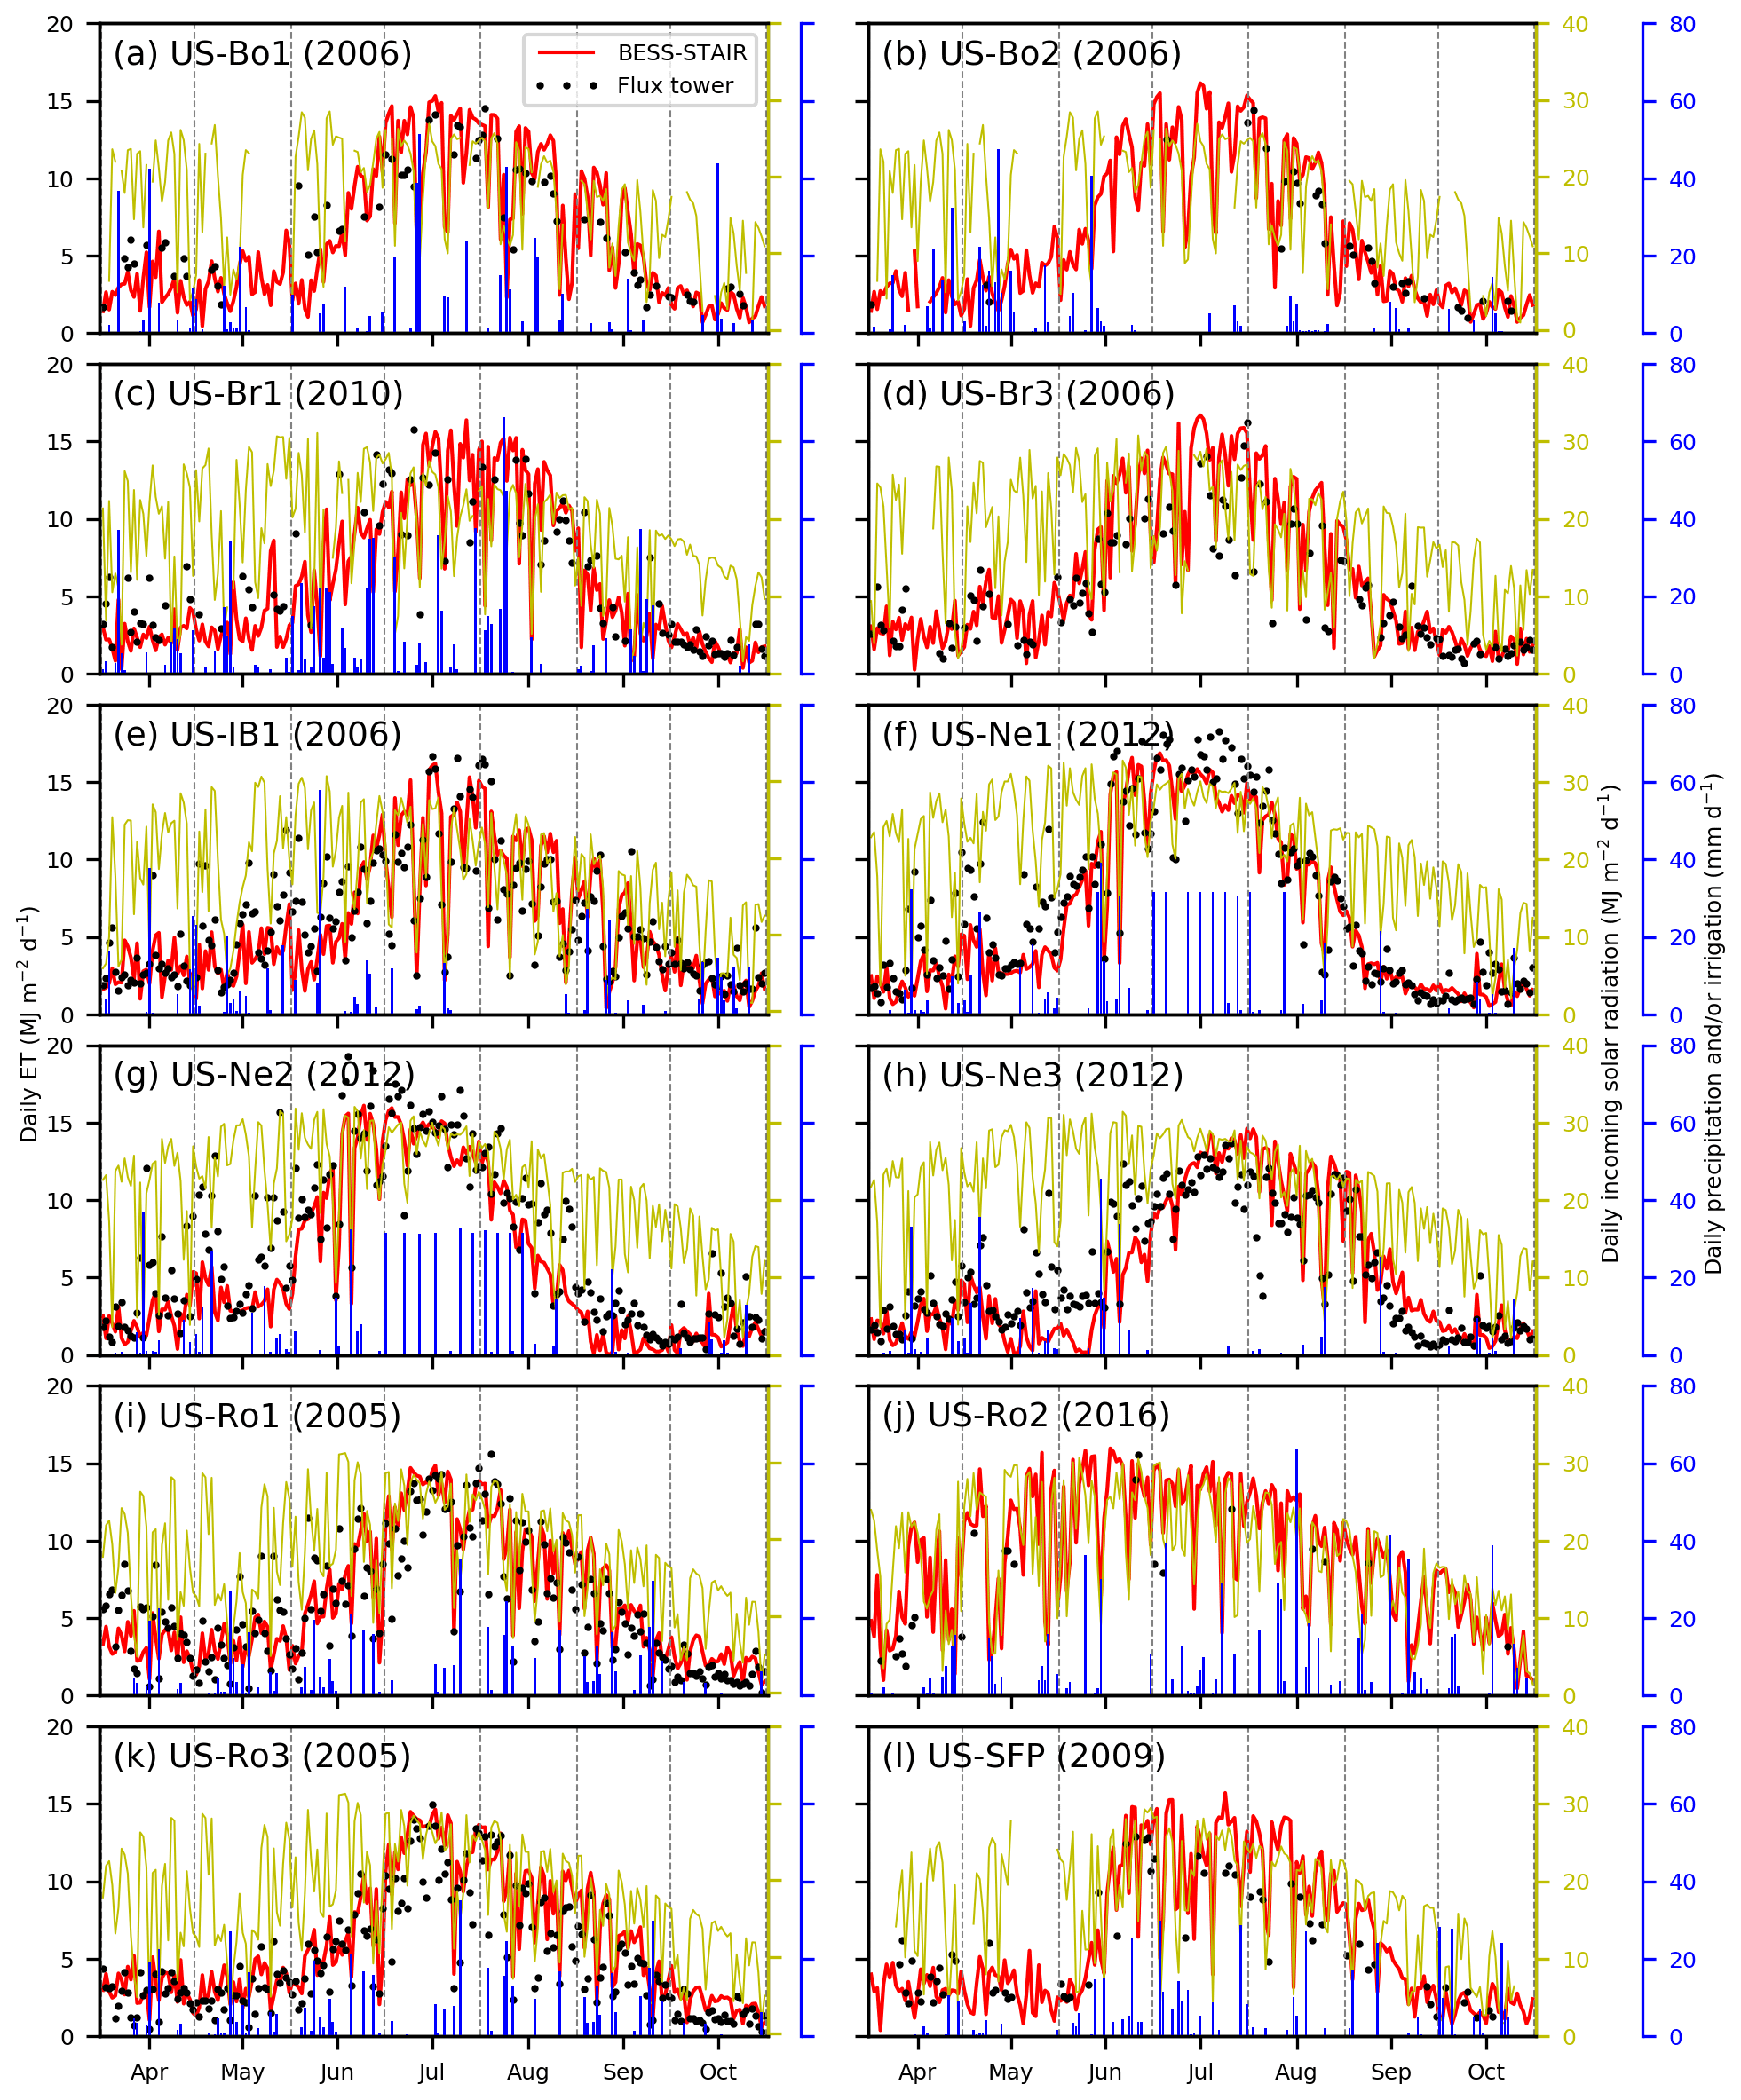
Figure 6Seasonal time series of flux tower measured and BESS-STAIR estimated daily ET for 12 selected site years. Daily radiation and precipitation/irrigation are overlaid except for US-Br3.
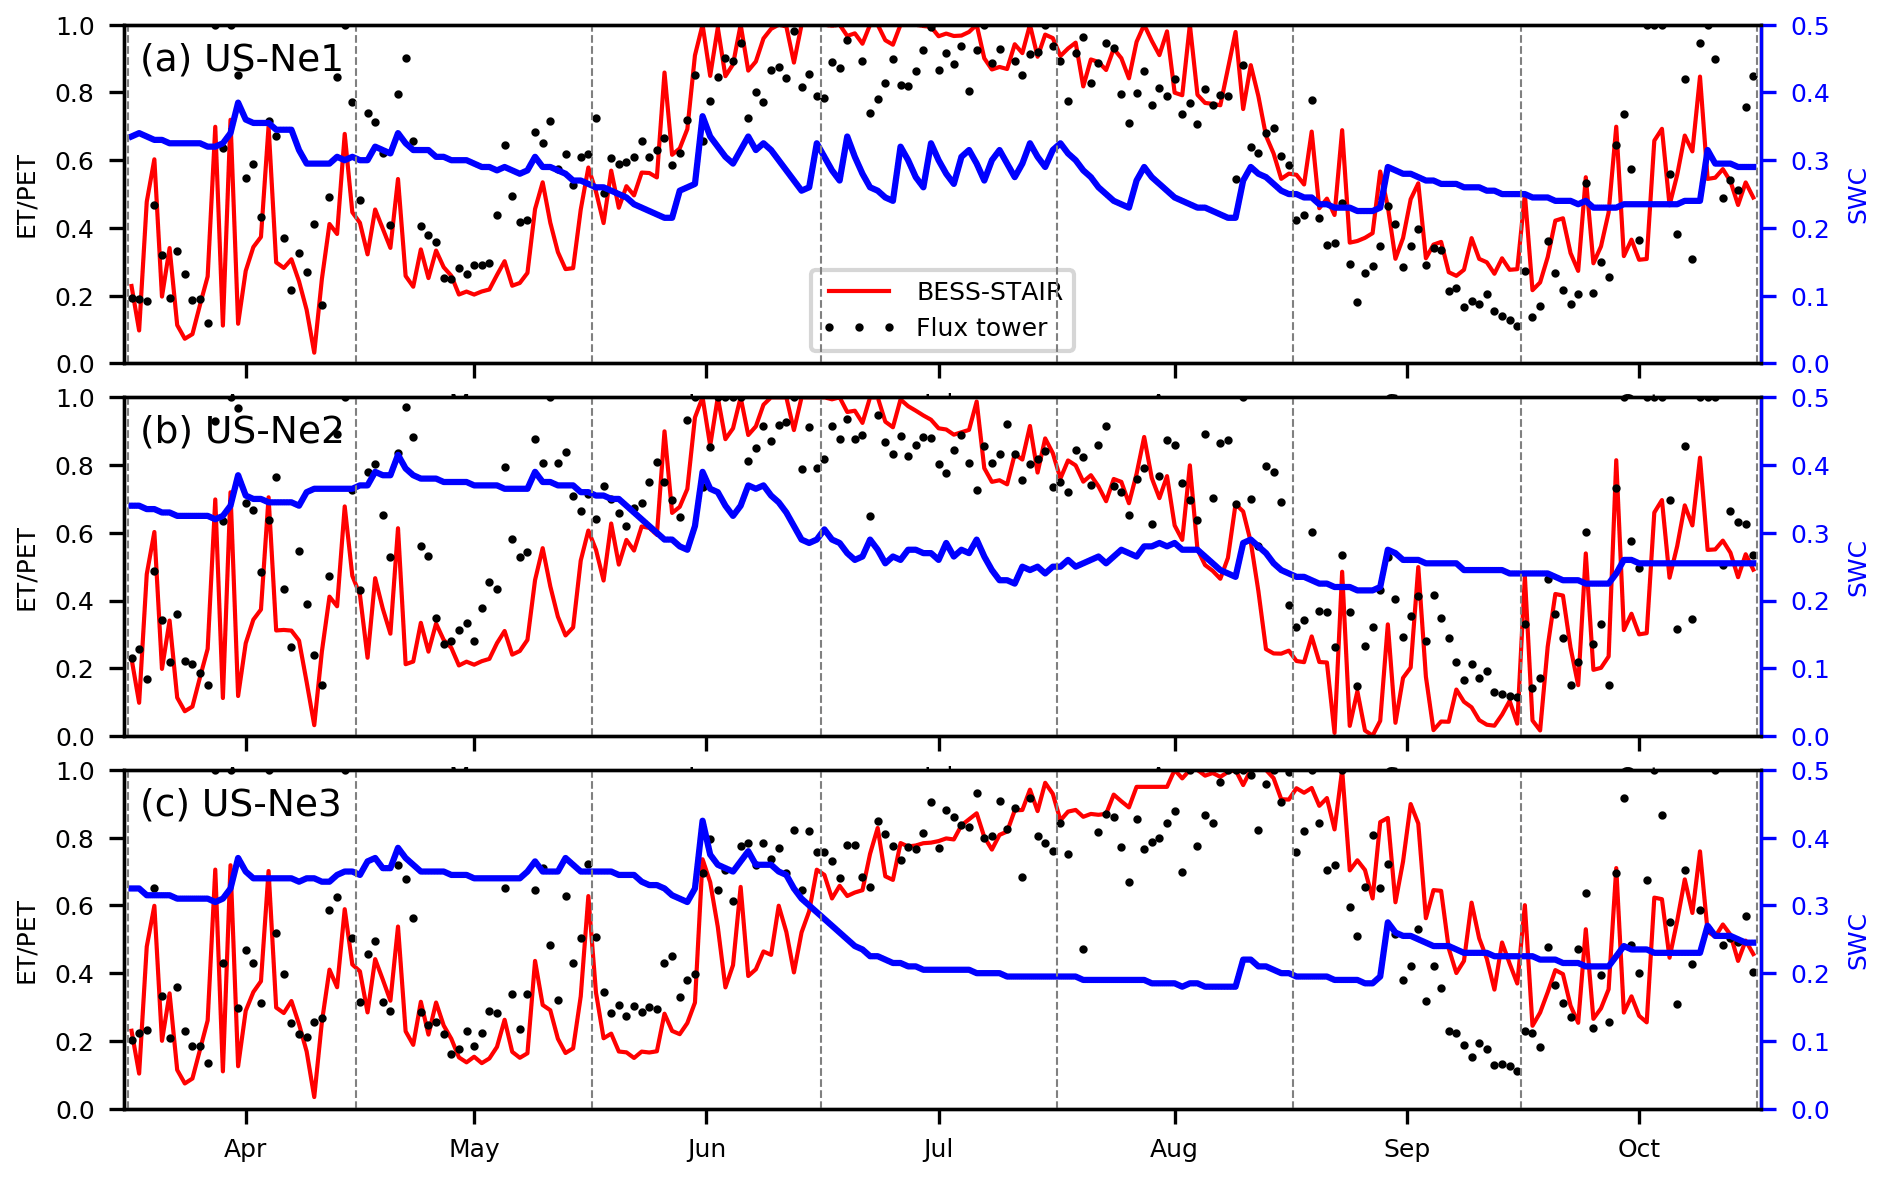
Figure 7Seasonal time series of daily ET/PET derived from BESS-STAIR and the flux tower for US-Ne1, US-Ne2, and NS-Ne3 in 2012, along with measured daily mean soil water content (SWC).
Figure 7 shows the comparison between BESS-STAIR ET/PET and flux-tower ET/PET at three sites (US-Ne1, US-Ne2, and NS-Ne3) at Mead, Nebraska. Overall, BESS-STAIR agrees well with the flux tower in both magnitude and seasonal cycle. Although 2012 is a severe drought year, soil water content (SWC) at the US-Ne3 rainfed site still shows a relatively high level (> 0.2). As a result, ET/PET from both BESS-STAIR and the flux tower is at the same level as the adjacent two irrigated sites (US-Ne2 and US-Ne3).
3.3 Spatiotemporal variations of BESS-STAIR ET
BESS-STAIR daily ET demonstrates prominent spatial variations within the area near the Mead site in Nebraska (Fig. 8). Because of the impact of drought, central pivot irrigated fields characterized by round-shaped plots generally display higher values than surrounding croplands, and croplands have much higher values than grasslands. Variabilities of ET between different crop fields and within individual crop fields are also observable. Such variabilities might be attributed to different irrigation strategies, varieties, and/or other management. By comparison, though 500 m resolution BESS-MODIS ET is able to capture the general spatial pattern, it has many mixed pixels and is unable to demonstrate gradients across field boundaries.
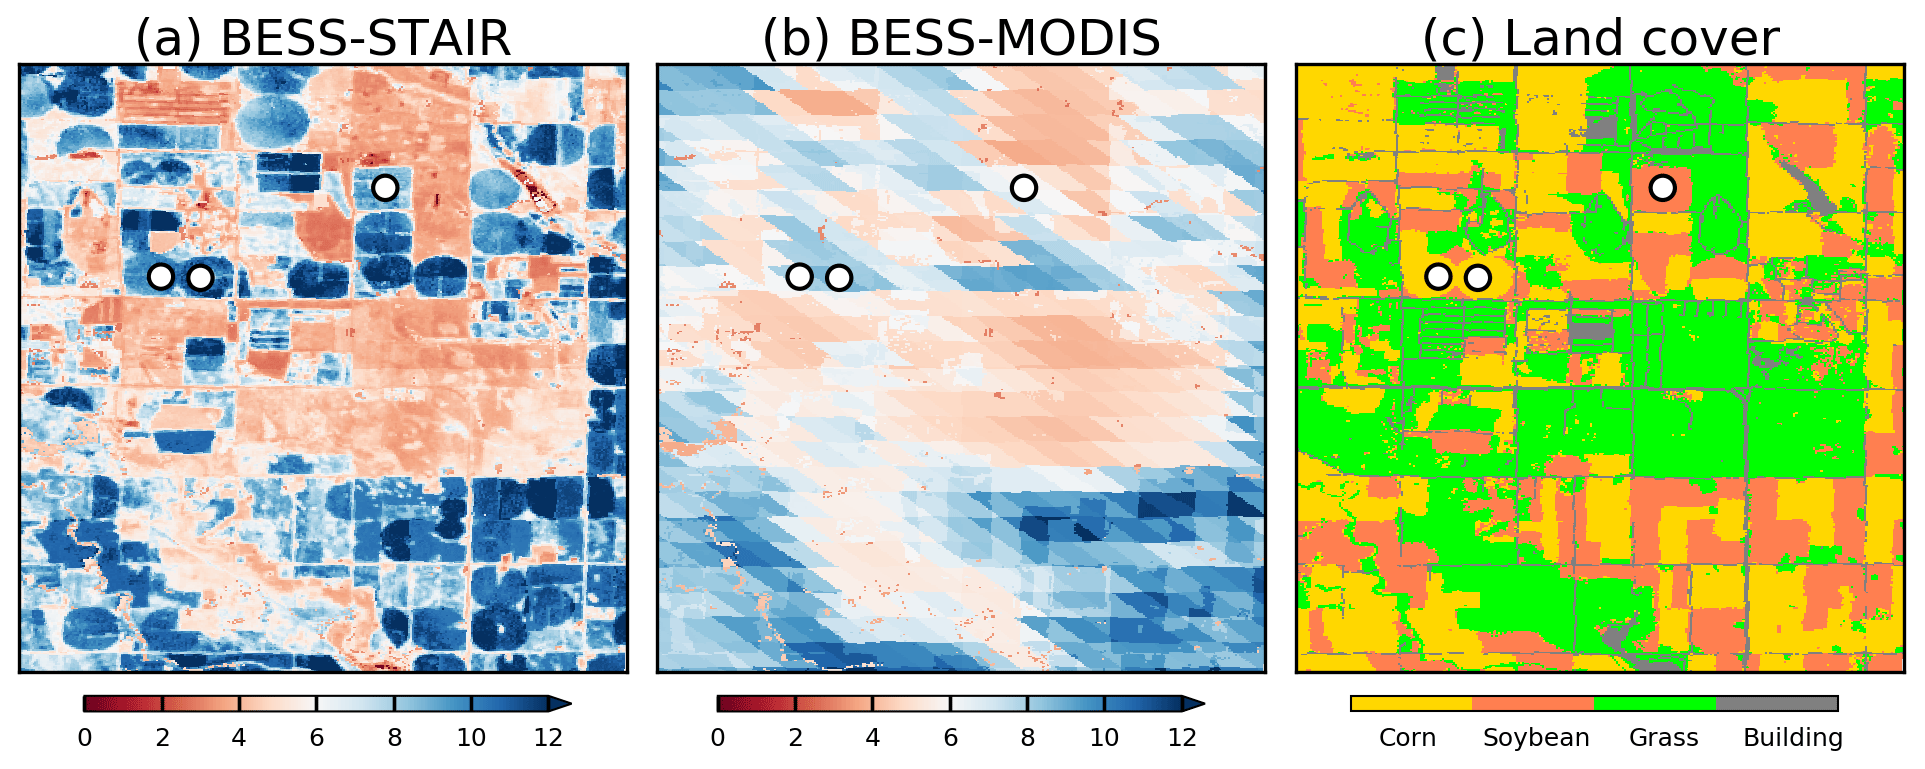
Figure 8Daily ET (MJ m−2 d−1) derived from (a) BESS-STAIR and (b) BESS-MODIS at Mead (41.1–41.2∘ N, 96.4–96.5∘ W) on 1 August 2012. Circles indicate flux towers in this region.
Reasonable seasonal cycles for different land-cover types are revealed by BESS-STAIR monthly ET averaged from gap-free daily estimations. An example time series of monthly ET maps at Brooks Field during the growing season of 2000 is shown in Fig. 9. BESS-STAIR ET clearly captures the temporal dynamics throughout the growing season. All vegetation shows low values (e.g., < 2 mm d−1) in April, May, September, and October but high values in June, July, and August (JJA), with their peaks in July. Different seasonal cycles for corn, soybean, and grass are also captured. Grass has the highest ET among the three vegetation types from April through June. Corn has a higher ET than soybean in June and July and decreases quickly from August. Soybean has the lowest ET from April through June, but has the highest ET in August.
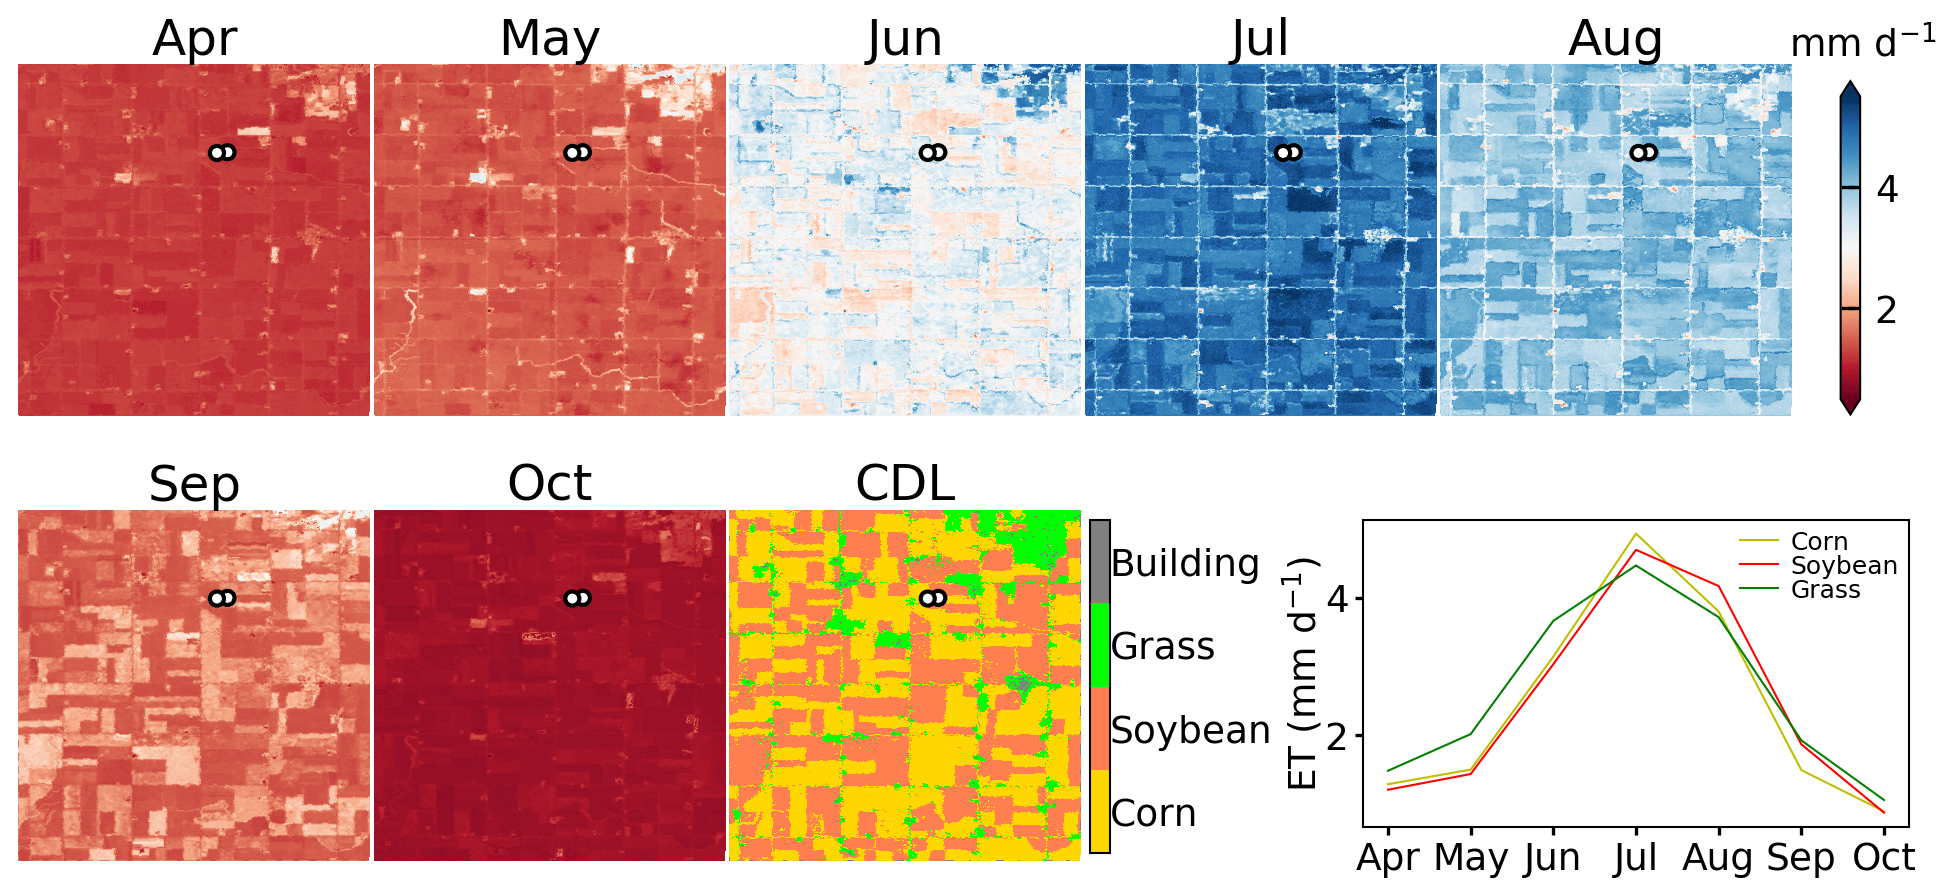
Figure 9Monthly mean BESS-STAIR ET at Brooks Field (41.9–42.0∘ N, 96.65–96.75∘ W) during the growing season of 2000, along with a CDL land-cover map. The last subplot shows the average time series of corn, soybean, and grass. Circles indicate flux towers in this region.
BESS-STAIR is also able to produce long-term ET/PET estimation as an indicator of drought. Figure 10 shows an example time series of peak growing season ET/PET at Bondville from 2001 through 2017. Overall substantial interannual variability is shown, with regional average ET/PET values ranging from 0.76 in an extremely dry year (2012) to 0.91 in an extremely wet year (2015). A positive linear relationship (r=0.42, p < 0.1) is observed between BESS-STAIR ET/PET and precipitation, and a negative linear relationship (, p < 0.05) is observed between BESS-STAIR ET/PET and VPD. The relatively stronger relationship between ET/PET and VPD than that between ET/PET and precipitation indicates atmospheric water demand is likely to contribute more to drought than soil water supply in this area.

Figure 10Peak growing season (June, July, and August) BESS-STAIR ET/PET at Bondville (39.95–40.05∘ N, 88.25–88.35∘ W) from 2001 through 2017 along with two scatter plots between peak growing season precipitation and ET/PET and peak growing season VPD and ET/PET over the 17 years. Precipitation and VPD data are from Daily Surface Weather Data (Daymet) at Bondville, Illinois (https://modis.ornl.gov/cgi-bin/sites/site/?id=us_illinois_bondville&product=Daymet, last access: 11 March 2020), where VPD is derived using maximum air temperature and water vapor pressure. Circles indicate flux towers in this region.
4.1 Performance of BESS-STAIR ET
In this study, we have presented BESS-STAIR, a new framework for estimating cropland ET at field and daily scale, and we have demonstrated its high performance in the US Corn Belt. The BESS process-based biophysical model, driven by 30 m resolution vegetation-related variables derived from STAIR fused surface spectral reflectance data (Fig. 3) and medium-resolution environmental inputs derived from MODIS and other satellite data (Fig. 1), is able to produce gap-free ET and PET estimations at field scale and at daily intervals across space and time (Figs. 4–7). Over the 12 sites across the US Corn Belt (Fig. 2), BESS-STAIR explains 75 % of variations in flux-tower measured daily ET (Fig. 4), with an overall RMSE of 2.29 MJ m−2 d−1 (equivalent to 0.93 mm d−1 or 26 W m−2), a 27.9 % relative error, and stable performance across sites (Fig. 5), as well as consistent seasonal dynamics with respect to flux-tower measurements (Figs. 6–7).
The error statistics of BESS-STAIR are commensurate with previous high-resolution cropland ET mapping studies. Typical RMSE values include 25 W m−2 by TSEB-DTD (Guzinski et al., 2014), 35 W m−2 by METRIC (Irmak et al., 2011), 62 W m−2 by SEBS (McCabe and Wood, 2006), 0.60 mm d−1 by SSEBop (Senay et al., 2016), and 1.04 mm d−1 by SEBAL (Singh et al., 2008). Nevertheless, it is worth mentioning that those studies used original Landsat data and therefore suffered from considerably large data gaps. In contrast, BESS-STAIR uses daily Landsat-MODIS fusion data free from any gaps, which leads to temporally continuous ET estimation at the field level and thus can meet the requirements of precision agriculture. In addition, it is worth mentioning that BESS-STAIR is calibration-free and therefore is scalable. It also indicates that the accuracy of BESS-STAIR ET is likely to further improve by using locally optimized driving force or parameter values.
BESS-STAIR is also comparable to other cropland ET mapping studies utilizing data fusion techniques. For example, DisALEXI-STARFM daily ET estimates were validated against the flux-tower measurements over the three Mead sites (Yang et al., 2018). They reported error statistics of around 1.2 mm d−1 RMSE and 29 % relative error. BESS-STAIR's performance at these three same sites shows an average of 0.89 mm d−1 RMSE and 25.3 % relative error (Fig. 11). At a monthly scale, the average RMSE and relative errors are only 0.48 mm d−1 and 14.3 % (Appendix Fig. A1). In addition, BESS-STAIR has the potential to apply to any croplands around the world back to 1984, when both high spatial resolution data (e.g., Landsat/TM) and high temporal resolution data (e.g., NOAA/AVHRR) were available.
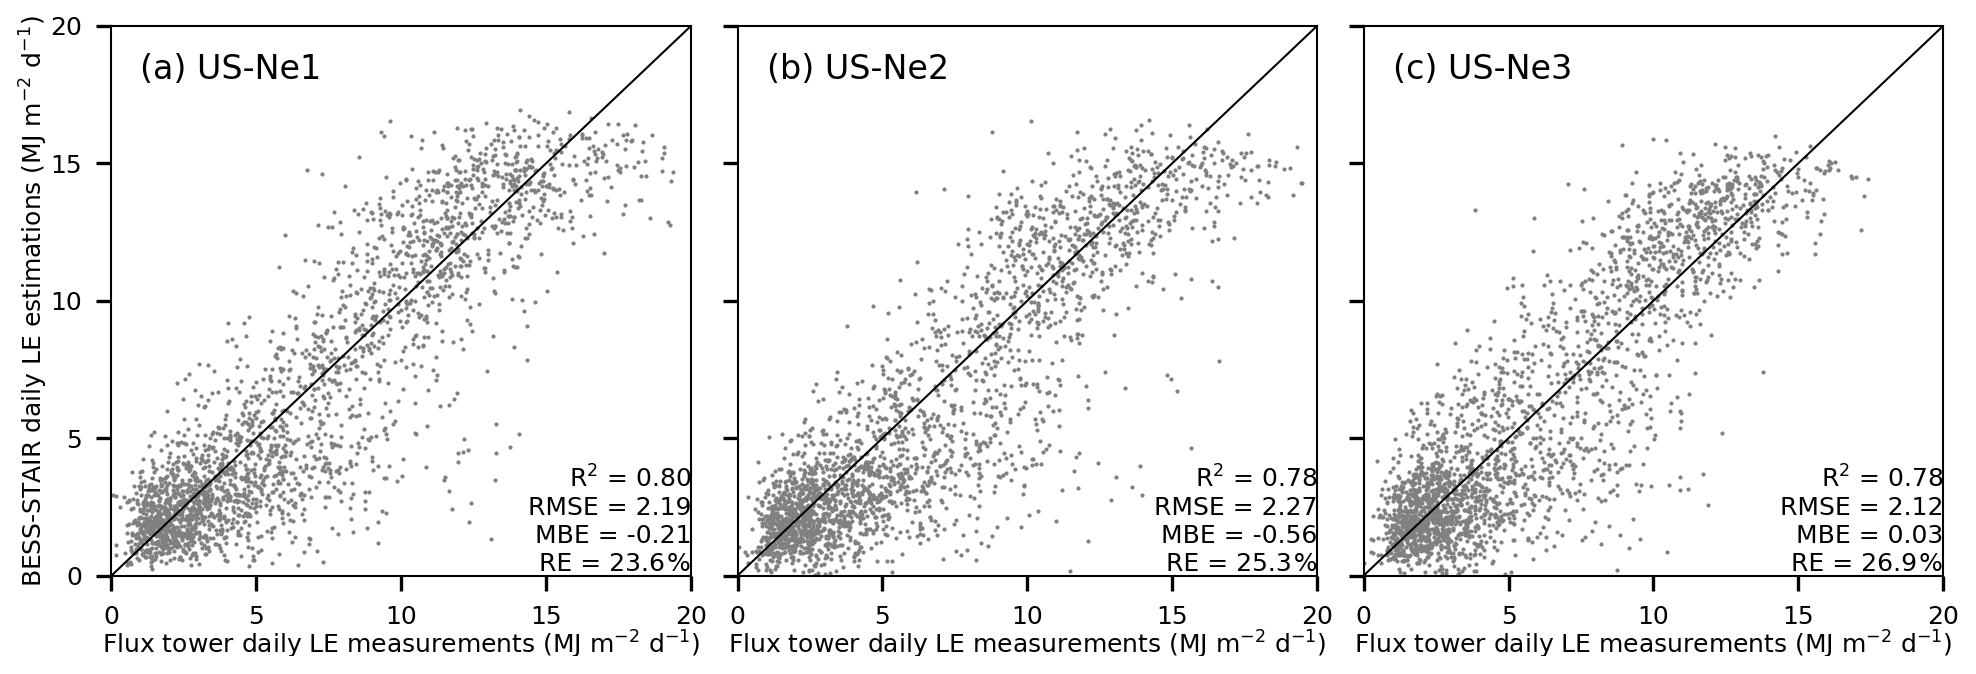
Figure 11Scatter plots between ET measurements and ET estimations at three sites: US-Ne1, US-Ne2, and US-Ne3.
4.2 Scientific advantages of BESS-STAIR ET
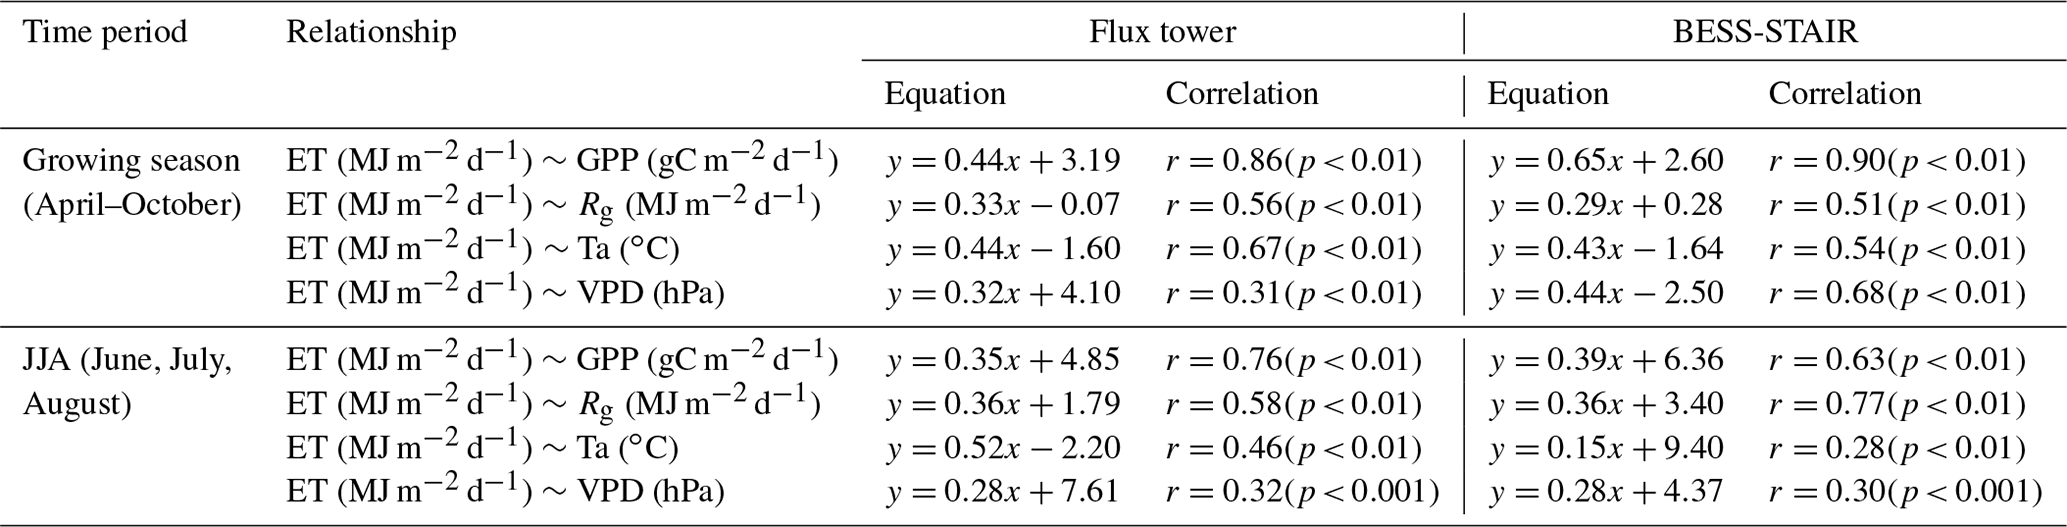
The efficacy of BESS-STAIR lies in several aspects. First, BESS is a water–carbon–energy coupled biophysical model. BESS employs atmospheric and canopy radiative transfer modules, a carbon assimilation module, a stomatal conductance module, and an energy balance module (Jiang and Ryu, 2016; Ryu et al., 2011). BESS integrates the simulation of the carbon cycle, water cycle, and energy cycle in the same framework. Such a carbon–water–energy coupling strategy realistically and coherently simulates plant physiology and its response to the environment; specifically, the carbon uptake and water loss by plants have been simulated synchronously through environmental constraints on stomatal conductance, with further constraints by available energy (Baldocchi and Meyers, 1998; Leuning et al., 1995). Many land-surface models have already adopted such a strategy and have successfully simulated the evolution of terrestrial ecosystems (Ju et al., 2006; Sellers, 1997; Tian et al., 2010). However, this is not the case in commonly used remote-sensing models. Empirical methods, water balance methods, and Priestley–Taylor methods only focus on the water cycle. Energy balance methods, triangular space methods, and Penman–Monteith methods couple the water cycle and energy cycle and consider ET in the context of energy partitioning. BESS, unlike these remote-sensing models, constrains ET with regards to both energy requirement and carbon requirement, thanks to explicit modeling of radiative transfer and stomatal behavior processes. For the above reasons, BESS-STAIR ET not only achieves high accuracy (Figs. A1–A3), but also accurately captures responses to GPP, radiation, temperature, and humidity at daily scale (Table 4). Thus, BESS-STAIR has the potential to advance the understanding of crop responses to climate change by bridging remote-sensing data and land-surface models, which was first suggested by Sellers et al. (1997) more than 20 years ago.
Table 4BESS-STAIR captures the correct response of daily ET to GPP, radiation (Rg), temperature (Ta), and humidity (VPD) as compared to flux-tower measurements over the three Mead sites from 2001 through 2012. The linear equation slopes and correlation coefficients between ET and other factors are similar in flux-tower measurements and BESS-STAIR estimations, for both the whole growing season (April–October) or only the peak growing season (June, July, and August). For “flux-tower” columns, Rg, Ta, and VPD are from site measurements, while for “BESS-STAIR” columns, they are from satellite-derived coarse-resolution inputs.
The second strength is that BESS-STAIR is designed to be most sensitive to the variables which can be well-quantified from remote-sensing data. BESS ET is most sensitive to solar radiation, followed by LAI (Ryu et al., 2011), as BESS ET is mainly constrained by net radiation and GPP. In most cases, solar radiation is the predominant component of net radiation, while LAI determines the capacity of radiation absorption and subsequently determines GPP. BESS explicitly computes radiation components at high accuracy by driving an atmosphere radiative transfer model, FLiES, using MODIS cloud, aerosol, and atmospheric profile products. Globally, BESS-estimated solar radiation has its R2 at about 0.85 and 0.95 for MODIS snapshots and 4 d averages, respectively (Ryu et al., 2018). On the other hand, BESS-STAIR calculates high spatiotemporal resolution LAI and albedo from fused surface reflectance data. Since Landsat and MODIS surface reflectance products are publicly available and highly reliable (Claverie et al., 2015; Masek et al., 2006), spatial heterogeneity and temporal dynamics of crop growing conditions are captured well (Fig. 8). This study only uses reflectance data fused from Landsat and MODIS, but STAIR can be easily extended to further incorporate other types of data, such as Sentinel-2 (10 m resolution) and Planet Lab CubeSats (3 m resolution) (McCabe et al., 2017). By incorporating more high-resolution observations, the relevance of reconstructed high-resolution image series can be further improved.
The third strength is that BESS-STAIR is able to perform under all-weather conditions. BESS-STAIR fills data gaps in surface reflectance, which has a smooth day-to-day variation even with changes in sky conditions (Liu et al., 2017). Based on filtered surface reflectance, LAI and albedo time series are well-reconstructed, and subsequently BESS-STAIR could directly work under all-weather conditions. In this manner, BESS-STAIR has no need to fill cloudy-sky ET using clear-sky ET estimations, which is error prone because the empirically filled ET estimations usually lack sophisticated process-level model constraints and thus can have large uncertainties. Figure 12 shows that the estimation errors of BESS-STAIR ET do not change significantly under different sky conditions, with a low to high “sky clearness index” ranging from more cloudy to more clear-sky conditions.
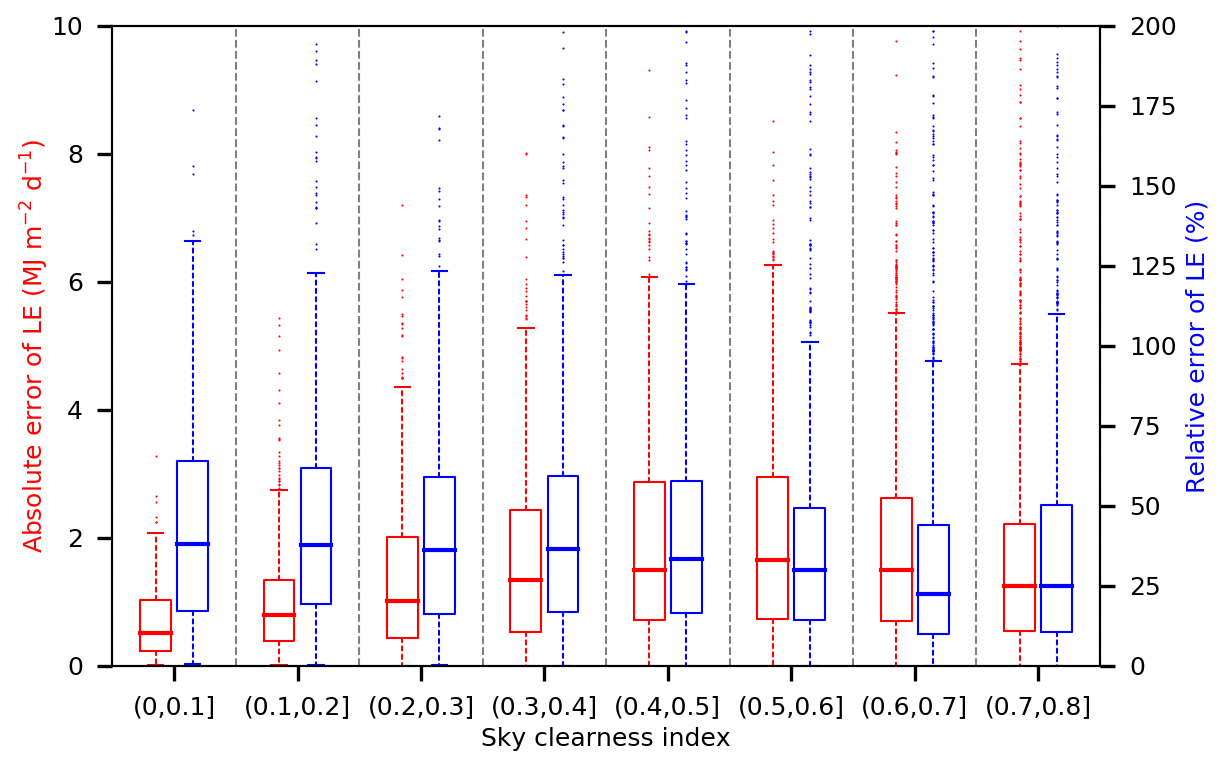
Figure 12BESS-STAIR estimated daily ET has a similar performance with a varying sky clearness index (the ratio of incoming radiation on the surface to that on the top-of-atmosphere). The lower and upper boundaries of boxes refer to the first and third quartiles of error statistics. The bars inside the boxes refer to median values. The whiskers indicate 1.5 times the distance between the first and third quartiles.
4.3 Limitations and future improvements of BESS-STAIR ET
In this study, several inputs used by BESS have some limitations in terms of generality and accessibility. First, three plant functional parameters, peak Vcmax25 and Ball–Barry slope and intercept, are obtained from the literature, assuming a constant given C3 or C4 plant type. Other land-surface models tend to use a similar strategy by assigning fixed values to a given plant functional type (PFT) (Bonan et al., 2011; Kattge et al., 2009; Miner et al., 2017). The drawback of this strategy is that it overlooks within-PFT variations and the feedback mechanisms between vegetation and its environment (Van Bodegom et al., 2014). These limitations might be mitigated by incorporating innovative leaf trait estimation techniques that have emerged in recent years, such as imaging spectroscopy (Serbin et al., 2015), sun-induced fluorescence (Zhang et al., 2018), and plant optimization theory (Walker et al., 2017; Wang et al., 2017). Second, BESS-STAIR in this study uses CDL data which are only available in the United States. Fortunately, BESS does not require specific crop types, but only C3/C4 distributions, and the separation of the major C4 crop maize from other crops is practical using time-series satellite data (Cai et al., 2018; Zhong et al., 2016). It is noted that misclassification of C3 and C4 crops is likely to cause a large bias in GPP but a relatively small bias in ET (Figs. A1–A3).
Though BESS-STAIR is able to capture water stress impact on ET in the US Corn Belt where atmospheric demands play a major role, its applicability to regions where soil supply dominates needs further investigation. Some studies suggest that an optical signal as an indicator of drought performs at a longer timescale than a thermal signal does (Otkin et al., 2017). Drought first decreases soil moisture content due to enhanced ET induced by high atmospheric demand, then decreases ET due to low soil moisture content, and finally causes damage to plants which changes surface reflectance. Accordingly, LAI may not serve as a relevant early warning of droughts. Furthermore, severe soil moisture stress may cause physiological deterioration in addition to structural damage that has been reflected in LAI. To address this issue for dry regions, we acknowledge that LST observations may provide essential adding values. At this point, the capacity of BESS-STAIR to estimate LST leads to the possibility of optimizing BESS-STAIR using satellite-derived LST. Recent advances in innovative thermal observation platforms such as ECOSTRESS (Hulley et al., 2017), GOES-R (Schmit et al., 2017), and Sentinel-3 (Zheng et al., 2019) have provided a great opportunity to integrate satellite-derived LST with BESS-STAIR.
The BESS model itself in essence estimates instantaneous ET. The ratio of snapshot potential solar radiation to daily potential solar radiation is adopted as a scaling factor for the temporal upscaling of ET (Ryu et al., 2012). In this study, BESS runs two times per day, utilizing radiation components derived from Terra/MODIS (around 11:00 solar time) and Aqua/MODIS (around 13:00 solar time) data, respectively. The two instantaneous ET estimates are separately upscaled to daily estimates and averaged. In spite of the robustness of the upscaling algorithm (Ryu et al., 2012), bias cannot be avoided if the sky conditions at two overpass times are not representative for that day, which is natural and common in the presence of moving cloud. Since BESS is a time-independent model and can perform at any time during daytime, adding more snapshots to account for the diurnal variations of radiation can solve this problem. Unfortunately, fine-resolution polar-orbiting satellites usually have similar overpass times (10:00–11:00 and 13:00–14:00), so adding even more satellites is likely to bring redundant information only. Reanalysis radiation data covering the diurnal cycle have limited accuracy and coarse resolution (Babst et al., 2008; X. Zhang et al., 2016), so they may be unable to provide much added value as well. Next-generation geostationary satellites acquiring data with both high spatial and temporal resolutions, such as GOES-R and GaoFen-4 (Goodman et al., 2012; Xu et al., 2017), are expected to enable BESS-STAIR ET in an hourly or sub-hourly interval and subsequently generate more realistic daily ET estimates.
In this study we presented BESS-STAIR, a new framework to estimate high spatiotemporal resolution ET that can be used for field-level precision water resource management. BESS-STAIR couples a satellite-driven water–energy–carbon coupled biophysical model, BESS, with a generic and fully automated fusion algorithm, STAIR, to generate gap-free 30 m resolution daily ET estimations. Comprehensive evaluation of BESS-STAIR ET estimations revealed (1) reliable performance over 12 flux-tower sites across the US Corn Belt and (2) reasonable spatial patterns, seasonal cycles, and interannual dynamics. The proposed BESS-STAIR framework has demonstrated its ability to provide significant advancements with regard to daily field-level estimations of ET at regional and decadal scales. We expect BESS-STAIR to become a solid tool for precision water resource management and other precision agriculture applications for the US Corn Belt as well as other agricultural areas around the world, thanks to the global coverage of input data.
Canopy conductance Gc,i for sunlit/shaded canopy is calculated as (Ball, 1988)
where m and b are Ball–Berry coefficients, RH is relative humidity, Ca is ambient CO2 concentration, and Ac,j is carbon assimilation by sunlit/shaded canopy.
Canopy net radiation Rn for sunlit/shaded canopy is calculated as (Kowalczyk et al., 2006)
where Qs,i and QL,i are net shortwave and longwave radiation for sunlit/shaded canopy, Tf,i is leaf temperature for sunlit/shaded canopy, Ta is air temperature, cp is specific heat, and Gr is canopy conductance for radiation:
At this point, Ac,j is calculated by the Farquhar photosynthesis model for C3 (Collatz et al., 1991) and C4 (Collatz et al., 1992) crops, and Qs,i and QL,i are calculated by radiative transfer models for shortwave (Ryu et al., 2011) and longwave (Kowalczyk et al., 2006), respectively. Tf,i is solved through an iterative procedure (Jiang and Ryu, 2016). Subsequently, latent heat flux λEi for sunlit/shaded canopy is calculated by the quadratic form of the Penman–Monteith equation:
where λ is latent heat of vaporization, and
where es(Ta) is saturated vapor pressure, ra is aerodynamic resistance, ρ is air density, γ is a psychrometric constant, D is vapor pressure deficit, and rc,i is canopy resistance, the reciprocal of Gc,i.
Soil evaporation is calculated as (Fisher et al., 2008)
where Rn,soil is net radiation for soil and G is ground heat storage calculated as .
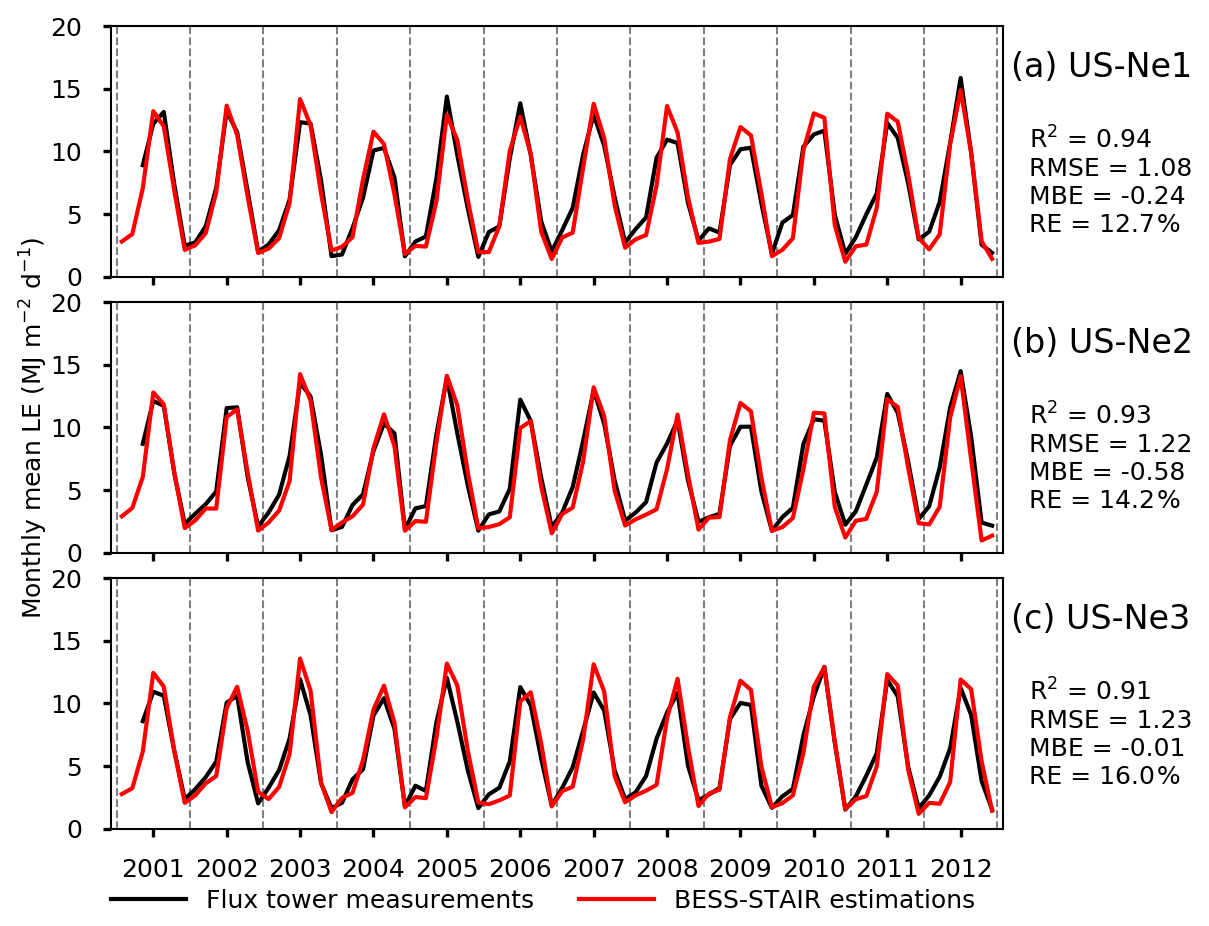
Figure A1Time series of monthly mean ET from flux-tower measurements and BESS-STAIR estimations.

Figure A2Time series of monthly mean GPP from flux-tower measurements and BESS-STAIR estimations. Significant underestimations in 2003 and 2011 for Ne1, in 2005 for Ne2, and in 2005 for Ne3 are due to misclassification of corn as soybean in CDL. Significant overestimations in 2006 for Ne2 are due to misclassification of soybean as corn in CDL.
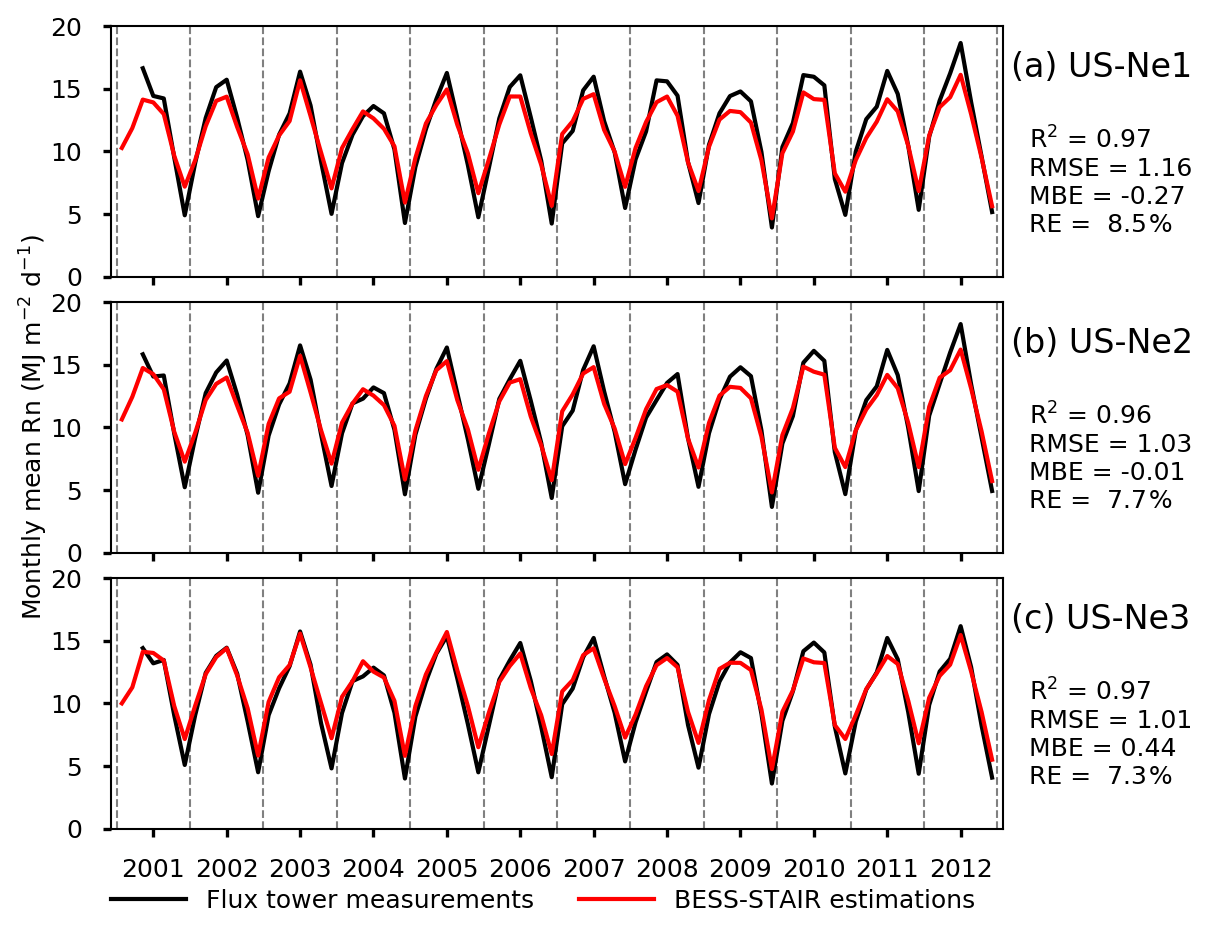
Figure A3Time series of monthly mean Rn from flux-tower measurements and BESS-STAIR estimations.
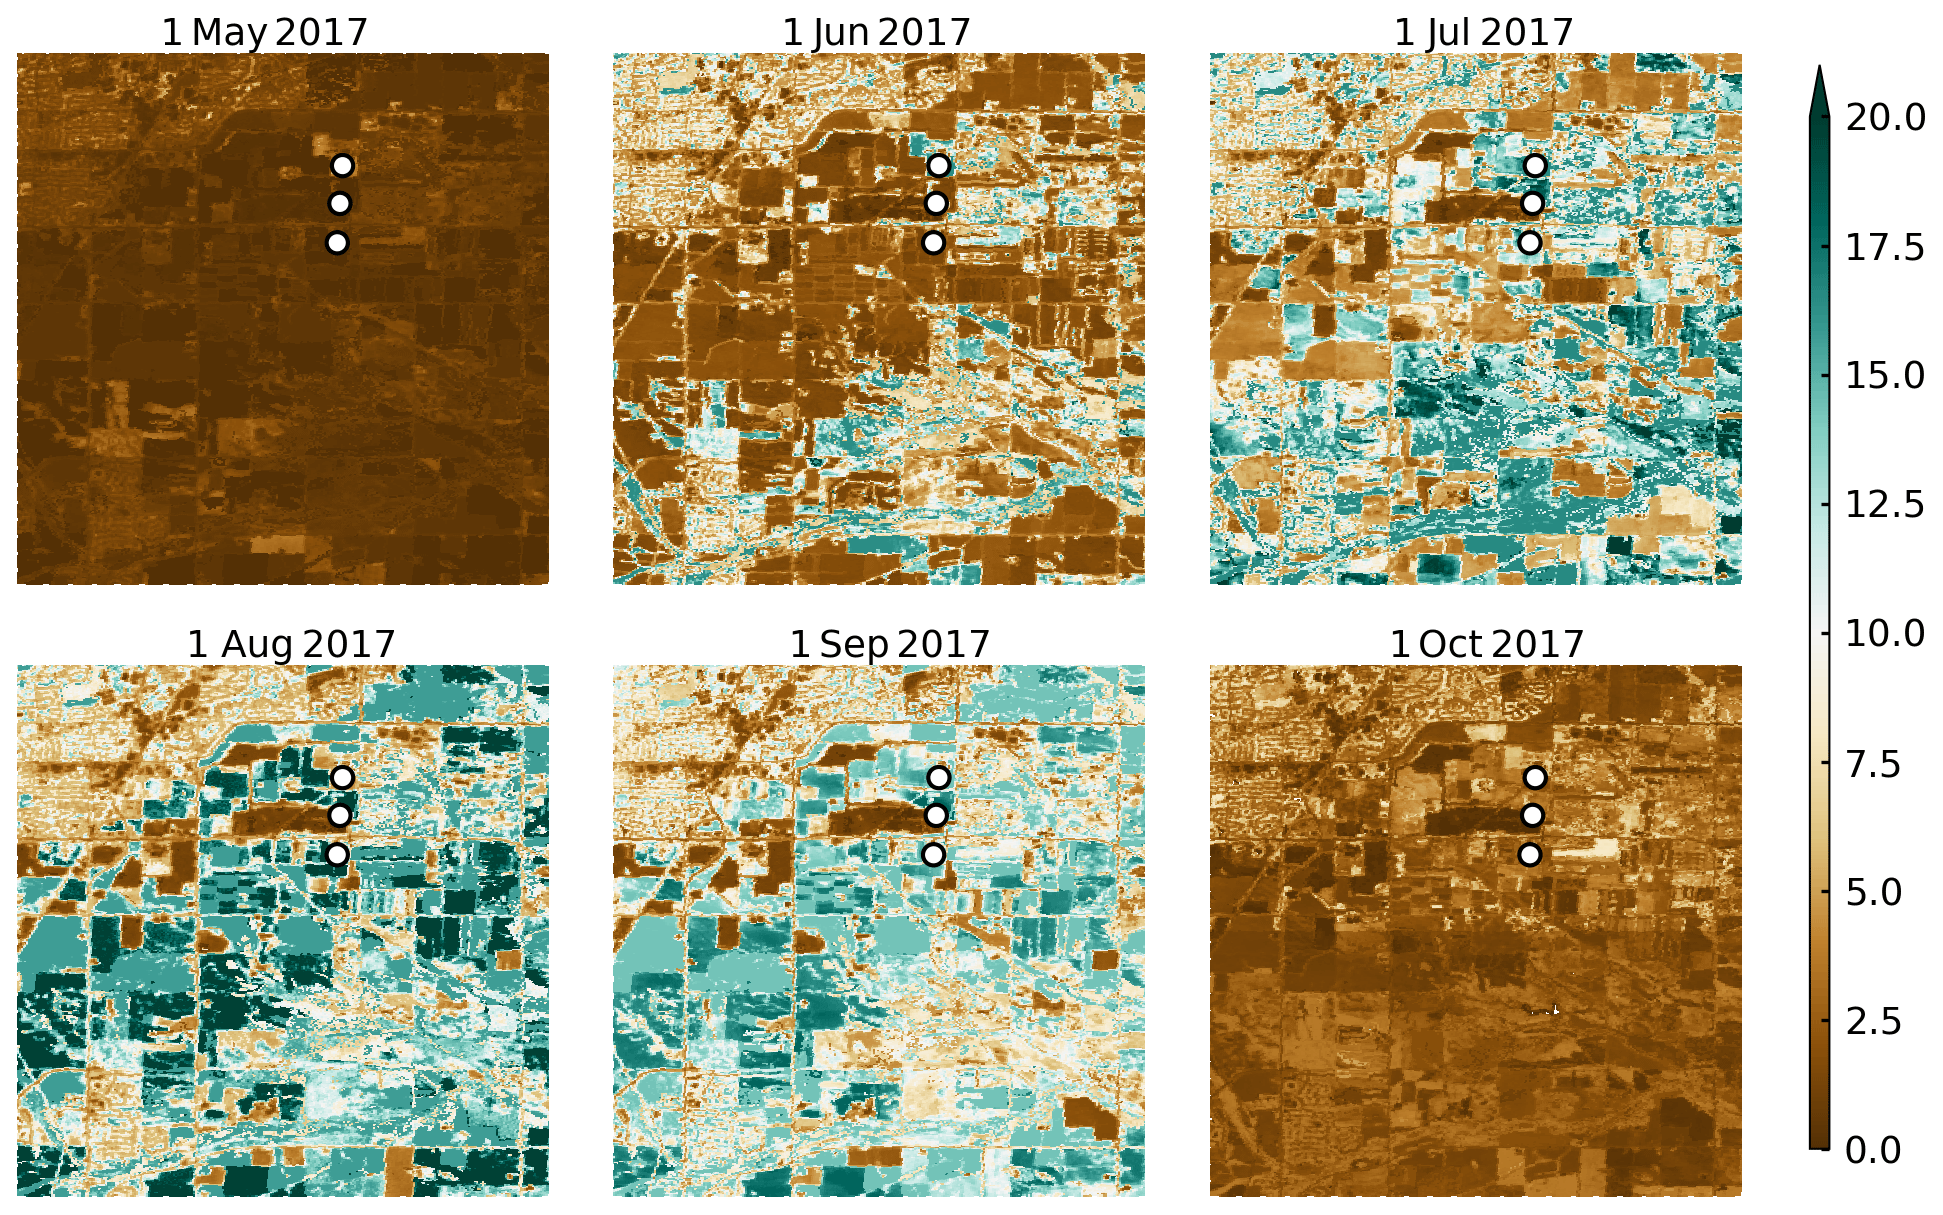
Figure A4Examples of daily GPP (gC m−2 d−1) derived from BESS-STAIR at Rosemount (44.65–44.75∘ N, 93.05–93.15∘ W) in 2017. Circles indicate flux towers in this region.
The data generated in this study are available upon request.
CJ and KG designed the study, CJ conducted the modeling and analysis, MP and BP provided research inputs during the analysis, and YR and SW provided guidance on the BESS model and the STAIR algorithm, respectively. All the authors contributed to the writing of the manuscript.
The authors declare that they have no conflict of interest.
Any opinions, findings, and conclusions or recommendations expressed in this publication are those of the author(s) and do not necessarily reflect the views of the U.S. Department of Energy.
Chongya Jiang and Kaiyu Guan were funded by the DOE Center for Advanced Bioenergy and Bioproducts Innovation (U.S. Department of Energy, Office of Science, Office of Biological and Environmental Research under award number DE-SC0018420). Kaiyu Guan, Bin Peng, and Sibo Wang are funded by NASA awards (NNX16AI56G and 80NSSC18K0170) and the USDA National Institute of Food and Agriculture (NIFA) Foundational Program award (2017-67013-26253, 2017-68002-26789, 2017-67003-28703, and 2019-67021-29312). The development of the BESS model was mainly supported by the National Research Foundation of Korea (NRF-2014R1A2A1A11051134). Kaiyu Guan and Chongya Jiang also acknowledge the support from the Blue Waters Professorship from the National Center for Supercomputing Applications of UIUC. This research is part of the Blue Waters sustained-petascale computing project, which is supported by the National Science Foundation (awards OCI-0725070 and ACI-1238993) and the state of Illinois. Blue Waters is a joint effort of the University of Illinois at Urbana-Champaign and its National Center for Supercomputing Applications. We thank the U.S. Landsat project management and staff at the USGS Earth Resources Observation and Science (EROS) Center South Dakota for providing the Landsat data free of charge. We also thank NASA for freely sharing the MODIS products.
This research has been supported by the Center for Advanced Bioenergy and Bioproducts Innovation (grant no. DESC0018420), NASA New Investigator Program (grant no. NNX16AI56G), NASA Carbon Monitoring System (grant no. 80NSSC18K0170), and USDA National Institute of Food and Agriculture Foundational Program (grant nos. 2017-67013-26253, 2017-68002-26789, 2017-67003-28703, 2019-67021-29312).
This paper was edited by Lixin Wang and reviewed by two anonymous referees.
Allen, R. G., Pereira, L. S., Raes, D., and Smith, M.: Crop evapotranspiration-Guidelines for computing crop water requirements-FAO Irrigation and drainage paper 56, Italy, Rome, available at: https://s3.amazonaws.com/academia.edu.documents/40878584/Allen_FAO1998.pdf?AWSAccessKeyId=AKIAIWOWYYGZ2Y53UL3A&Expires=1527634764&Signature=GkL44Ekv1zkaqSV04%2F4EwT99LEk%3D&response-content-disposition=inline%3Bfilename%3DAllen_FAO1998.pdf (last access: 11 March 2020), 1998.
Anderson, M., Gao, F., Knipper, K., Hain, C., Dulaney, W., Baldocchi, D., Eichelmann, E., Hemes, K., Yang, Y., Medellin-Azuara, J., and Kustas, W.: Field-Scale Assessment of Land and Water Use Change over the California Delta Using Remote Sensing, Remote Sens., 10, 889, https://doi.org/10.3390/rs10060889, 2018.
Anderson, M. C., Norman, J. M., Diak, G. R., and Mecikalski, J. R.: A Two-Source Time-Integrated Model for Estimating Surface Fluxes Using Thermal Infrared Remote Sensing, Remote Sens. Environ., 60, 195–216, 1997.
Babst, F., Mueller, R. W., and Hollmann, R.: Verification of NCEP reanalysis shortwave radiation with mesoscale remote sensing data, IEEE Geosci. Remote S., 5, 34–37, https://doi.org/10.1109/LGRS.2007.907537, 2008.
Bacour, C., Jacquemoud, S., Tourbier, Y., Dechambre, M., and Frangi, J.: Design and analysis of numerical experiments to compare four canopy reflectance models, Remote Sens. Environ., 79, 72–83, 2002.
Baldocchi, D. and Meyers, T.: On using eco-physiological, micrometeorological and biogeochemical theory to evaluate carbon dioxide, water vapor and trace gas fluxes over vegetation: A perspective, Agr. Forest Meteorol., 90, 1–25, https://doi.org/10.1016/S0168-1923(97)00072-5, 1998.
Baldocchi, D., Dralle, D., Jiang, C., and Ryu, Y.: How Much Water is Evaporated Across California?: A Multi-Year Assessment Using a Biophysical Model Forced with Satellite Remote Sensing Data, Water Resour. Res., 55, 2722–2741, https://doi.org/10.1029/2018WR023884, 2019.
Ball, J. T.: An analysis of stomata conductance, Stanford University, Stanford, 1988.
Ball, J. T., Woodrow, I. E., and Berry, J. A.: A Model Predicting Stomatal Conductance and its Contribution to the Control of Photosynthesis under Different Environmental Conditions, in Progress in Photosynthesis Research, Springer Netherlands, Dordrecht, 221–224, 1987.
Baret, F., Hagolle, O., Geiger, B., Bicheron, P., Miras, B., Huc, M., Berthelot, B., Niño, F., Weiss, M., Samain, O., Roujean, J. L., and Leroy, M.: LAI, fAPAR and fCover CYCLOPES global products derived from VEGETATION. Part 1: Principles of the algorithm, Remote Sens. Environ., 110, 275–286, https://doi.org/10.1016/j.rse.2007.02.018, 2007.
Baum, B. A., Menzel, W. P., Frey, R. A., Tobin, D. C., Holz, R. E., Ackerman, S. A., Heidinger, A. K., and Yang, P.: MODIS cloud-top property refinements for collection 6, J. Appl. Meteorol. Clim., 51, 1145–1163, https://doi.org/10.1175/JAMC-D-11-0203.1, 2012.
Bernacchi, C. J., Hollinger, S. E., and Meyers, T.: The conversion of the corn/soybean ecosystem to no-till agriculture may result in a carbon sink, Glob. Change Biol., 11, 1867–1872, https://doi.org/10.1111/j.1365-2486.2005.01050.x, 2005.
Bonan, G. B., Lawrence, P. J., Oleson, K. W., Levis, S., Jung, M., Reichstein, M., Lawrence, D. M., and Swenson, S. C.: Improving canopy processes in the Community Land Model version 4 (CLM4) using global flux fields empirically inferred from FLUXNET data, J. Geophys. Res., 116, G02014, https://doi.org/10.1029/2010JG001593, 2011.
Boryan, C., Yang, Z., Mueller, R., and Craig, M.: Monitoring US agriculture: The US department of agriculture, national agricultural statistics service, cropland data layer program, Geocarto Int., 26, 341–358, https://doi.org/10.1080/10106049.2011.562309, 2011.
Brown, J. F. and Pervez, M. S.: Merging remote sensing data and national agricultural statistics to model change in irrigated agriculture, Agr. Syst., 127, 28–40, https://doi.org/10.1016/j.agsy.2014.01.004, 2014.
Cai, Y., Guan, K., Peng, J., Wang, S., Seifert, C., Wardlow, B., and Li, Z.: A high-performance and in-season classification system of field-level crop types using time-series Landsat data and a machine learning approach, Remote Sens. Environ., 210, 35–47, https://doi.org/10.1016/j.rse.2018.02.045, 2018.
Cammalleri, C., Anderson, M. C., Gao, F., Hain, C. R., and Kustas, W. P.: A data fusion approach for mapping daily evapotranspiration at field scale, Water Resour. Res., 49, 4672–4686, https://doi.org/10.1002/wrcr.20349, 2013.
Claverie, M., Vermote, E. F., Franch, B., and Masek, J. G.: Evaluation of the Landsat-5 TM and Landsat-7 ETM+ surface reflectance products, Remote Sens. Environ., 169, 390–403, https://doi.org/10.1016/j.rse.2015.08.030, 2015.
Collatz, G., Ribas-Carbo, M., and Berry, J.: Coupled Photosynthesis-Stomatal Conductance Model for Leaves of C 4 Plants, Aust. J. Plant Physiol., 19, 519–538, https://doi.org/10.1071/PP9920519, 1992.
Collatz, G. J., Ball, J. T., Grivet, C., and Berry, J. A.: Physiological and environmental regulation of stomatal conductance, photosynthesis and transpiration: a model that includes a laminar boundary layer, Agr. Forest Meteorol., 54, 107–136, https://doi.org/10.1016/0168-1923(91)90002-8, 1991.
Darvishzadeh, R., Skidmore, A., Schlerf, M., and Atzberger, C.: Inversion of a radiative transfer model for estimating vegetation LAI and chlorophyll in a heterogeneous grassland, Remote Sens. Environ., 112, 2592–2604, https://doi.org/10.1016/j.rse.2007.12.003, 2008.
De Pury, D. G. G. and Farquhar, G. D.: Simple scaling of photosynthesis from leaves to canopies without the errors of big-leaf models, Plant, Cell Environ., 20, 537–557, https://doi.org/10.1111/j.1365-3040.1997.00094.x, 1997.
Dils, B., Buchwitz, M., Reuter, M., Schneising, O., Boesch, H., Parker, R., Guerlet, S., Aben, I., Blumenstock, T., Burrows, J. P., Butz, A., Deutscher, N. M., Frankenberg, C., Hase, F., Hasekamp, O. P., Heymann, J., De Mazière, M., Notholt, J., Sussmann, R., Warneke, T., Griffith, D., Sherlock, V., and Wunch, D.: The Greenhouse Gas Climate Change Initiative (GHG-CCI): comparative validation of GHG-CCI SCIAMACHY/ENVISAT and TANSO-FTS/GOSAT CO2 and CH4 retrieval algorithm products with measurements from the TCCON, Atmos. Meas. Tech., 7, 1723–1744, https://doi.org/10.5194/amt-7-1723-2014, 2014.
Duan, S. B., Li, Z. L., Wu, H., Tang, B. H., Ma, L., Zhao, E., and Li, C.: Inversion of the PROSAIL model to estimate leaf area index of maize, potato, and sunflower fields from unmanned aerial vehicle hyperspectral data, Int. J. Appl. Earth Obs., 26, 12–20, https://doi.org/10.1016/j.jag.2013.05.007, 2014.
Feret, J. B., François, C., Asner, G. P., Gitelson, A. A., Martin, R. E., Bidel, L. P. R., Ustin, S. L., le Maire, G., and Jacquemoud, S.: PROSPECT-4 and 5: Advances in the leaf optical properties model separating photosynthetic pigments, Remote Sens. Environ., 112, 3030–3043, https://doi.org/10.1016/j.rse.2008.02.012, 2008.
Fisher, J. B., Tu, K. P., and Baldocchi, D. D.: Global estimates of the land-atmosphere water flux based on monthly AVHRR and ISLSCP-II data, validated at 16 FLUXNET sites, Remote Sens. Environ., 112, 901–919, https://doi.org/10.1016/j.rse.2007.06.025, 2008.
Fu, D., Chen, B., Zhang, H., Wang, J., Black, T. A., Amiro, B. D., Bohrer, G., Bolstad, P., Coulter, R., Rahman, A. F., Dunn, A., McCaughey, J. H., Meyers, T., and Verma, S.: Estimating landscape net ecosystem exchange at high spatial–temporal resolution based on Landsat data, an improved upscaling model framework, and eddy covariance flux measurements, Remote Sens. Environ., 141, 90–104, https://doi.org/10.1016/j.rse.2013.10.029, 2014.
GAO: Irrigated Agriculture: Technologies, Practices, and Implications for Water Scarcity, available at: https://www.gao.gov/mobile/products/GAO-20-128SP (last access: 11 March 2020), 2019.
Gao, F., Masek, J., Schwaller, M., and Hall, F.: On the blending of the landsat and MODIS surface reflectance: Predicting daily landsat surface reflectance, IEEE Trans. Geosci. Remote, 44, 2207–2218, https://doi.org/10.1109/TGRS.2006.872081, 2006.
Gao, F., Anderson, M. C., Zhang, X., Yang, Z., Alfieri, J. G., Kustas, W. P., Mueller, R., Johnson, D. M., and Prueger, J. H.: Toward mapping crop progress at field scales through fusion of Landsat and MODIS imagery, Remote Sens. Environ., 188, 9–25, https://doi.org/10.1016/j.rse.2016.11.004, 2017.
Gelaro, R., McCarty, W., Suárez, M. J., Todling, R., Molod, A., Takacs, L., Randles, C. A., Darmenov, A., Bosilovich, M. G., Reichle, R., Wargan, K., Coy, L., Cullather, R., Draper, C., Akella, S., Buchard, V., Conaty, A., da Silva, A. M., Gu, W., Kim, G. K., Koster, R., Lucchesi, R., Merkova, D., Nielsen, J. E., Partyka, G., Pawson, S., Putman, W., Rienecker, M., Schubert, S. D., Sienkiewicz, M., and Zhao, B.: The modern-era retrospective analysis for research and applications, version 2 (MERRA-2), J. Climate, 30, 5419–5454, https://doi.org/10.1175/JCLI-D-16-0758.1, 2017.
Gitelson, A. A., Wardlow, B. D., Keydan, G. P., and Leavitt, B.: An evaluation of MODIS 250-m data for green LAI estimation in crops, Geophys. Res. Lett., 34, L20403, https://doi.org/10.1029/2007GL031620, 2007.
Gómez, C., White, J. C., and Wulder, M. A.: Optical remotely sensed time series data for land cover classification: A review, ISPRS J. Photogramm., 116, 55–72, https://doi.org/10.1016/j.isprsjprs.2016.03.008, 2016.
Goodman, S. J., Gurka, J., De Maria, M., Schmit, T. J., Mostek, A., Jedlovec, G., Siewert, C., Feltz, W., Gerth, J., Brummer, R., Miller, S., Reed, B., and Reynolds, R. R.: The goes-R proving ground: Accelerating user readiness for the next-generation geostationary environmental satellite system, B. Am. Meteorol. Soc., 93, 1029–1040, https://doi.org/10.1175/BAMS-D-11-00175.1, 2012.
Grassini, P., Specht, J. E., Tollenaar, M., Ciampitti, I., and Cassman, K. G.: High-yield maize-soybean cropping systems in the US Corn Belt, Second Edition, Elsevier Inc., 2015.
Green, T. R., Kipka, H., David, O., and McMaster, G. S.: Where is the USA Corn Belt, and how is it changing?, Sci. Total Environ., 618, 1613–1618, https://doi.org/10.1016/j.scitotenv.2017.09.325, 2018.
Griffis, T. J., Baker, J. M., Sargent, S. D., Erickson, M., Corcoran, J., Chen, M., and Billmark, K.: Influence of C4 vegetation on 13CO2 discrimination and isoforcing in the upper Midwest, United States, Global Biogeochem. Cy., 24, GB4006, https://doi.org/10.1029/2009GB003768, 2010.
Guzinski, R., Nieto, H., Jensen, R., and Mendiguren, G.: Remotely sensed land-surface energy fluxes at sub-field scale in heterogeneous agricultural landscape and coniferous plantation, Biogeosciences, 11, 5021–5046, https://doi.org/10.5194/bg-11-5021-2014, 2014.
Hammerling, D. M., Michalak, A. M., and Kawa, S. R.: Mapping of CO2 at high spatiotemporal resolution using satellite observations: Global distributions from OCO-2, J. Geophys. Res., 117, D06306, https://doi.org/10.1029/2011JD017015, 2012.
Hersbach, H.: The ERA5 Atmospheric Reanalysis., Am. Geophys. Union, Fall Gen. Assem. 2016, Abstr. id. NG33D-01, available at: http://adsabs.harvard.edu/abs/2016AGUFMNG33D..01H (last access: 18 July 2019), 2016.
Houborg, R. and Mccabe, M. F.: A Cubesat enabled Spatio-Temporal Enhancement Method (CESTEM) utilizing Planet, Landsat and MODIS data, Remote Sens. Environ., 209, 211–226, https://doi.org/10.1016/j.rse.2018.02.067, 2018.
Huang, Y., Ryu, Y., Jiang, C., Kimm, H., Kim, S., Kang, M., and Shim, K.: BESS-Rice: A remote sensing derived and biophysical process-based rice productivity simulation model, Agr. Forest Meteorol., 256–257, 253–269, https://doi.org/10.1016/j.agrformet.2018.03.014, 2018.
Hulley, G., Hook, S., Fisher, J., and Lee, C.: ECOSTRESS, A NASA Earth-Ventures Instrument for studying links between the water cycle and plant health over the diurnal cycle, in International Geoscience and Remote Sensing Symposium (IGARSS), 2017-July, 5494–5496, IEEE., 2017.
Irmak, A., Ratcliffe, I., Ranade, P., Hubbard, K. G., Singh, R. K., Kamble, B., and Kjaersgaard, J.: ESTIMATION OF LAND SURFACE EVAPOTRANSPIRATION WITH A SATELLITE REMOTE SENSING PRO, Gt. Plains Res. Spring, 21, 73–88, 2011.
Irmak, S., Kabenge, I., Skaggs, K. E., and Mutiibwa, D.: Trend and magnitude of changes in climate variables and reference evapotranspiration over 116-yr period in the Platte River Basin, central Nebraska-USA, J. Hydrol., 420–421, 228–244, https://doi.org/10.1016/j.jhydrol.2011.12.006, 2012.
Jacquemoud, S. and Baret, F.: PROSPECT: A model of leaf optical properties spectra, Remote Sens. Environ., 34, 75–91, https://doi.org/10.1016/0034-4257(90)90100-Z, 1990.
Jacquemoud, S., Ustin, S. L., Verdebout, J., Schmuck, G., Andreoli, G., and Hosgood, B.: Estimating leaf biochemistry using the PROSPECT leaf optical properties model, Remote Sens. Environ., 56, 194–202, https://doi.org/10.1016/0034-4257(95)00238-3, 1996.
Jacquemoud, S., Verhoef, W., Baret, F., Bacour, C., Zarco-Tejada, P. J., Asner, G. P., François, C., and Ustin, S. L.: PROSPECT + SAIL models: A review of use for vegetation characterization, Remote Sens. Environ., 113, S56–S66, https://doi.org/10.1016/j.rse.2008.01.026, 2009.
Jiang, C. and Ryu, Y.: Multi-scale evaluation of global gross primary productivity and evapotranspiration products derived from Breathing Earth System Simulator (BESS), Remote Sens. Environ., 186, 528–547, https://doi.org/10.1016/j.rse.2016.08.030, 2016.
Jiang, L. and Islam, S.: A methodology for estimation of surface evapotranspiration over large areas using remote sensing observations, Geophys. Res. Lett., 26, 2773–2776, https://doi.org/10.1029/1999GL006049, 1999.
Ju, W., Chen, J. M., Black, T. A., Barr, A. G., Liu, J., and Chen, B.: Modelling multi-year coupled carbon and water fluxes in a boreal aspen forest, Agr. Forest Meteorol., 140, 136–151, https://doi.org/10.1016/j.agrformet.2006.08.008, 2006.
Jung, M., Reichstein, M., Ciais, P., Seneviratne, S. I., Sheffield, J., Goulden, M. L., Bonan, G., Cescatti, A., Chen, J., de Jeu, R., Dolman, A. J., Eugster, W., Gerten, D., Gianelle, D., Gobron, N., Heinke, J., Kimball, J., Law, B. E., Montagnani, L., Mu, Q., Mueller, B., Oleson, K., Papale, D., Richardson, A. D., Roupsard, O., Running, S., Tomelleri, E., Viovy, N., Weber, U., Williams, C., Wood, E., Zaehle, S., and Zhang, K.: Recent decline in the global land evapotranspiration trend due to limited moisture supply, Nature, 467, 951–954, https://doi.org/10.1038/nature09396, 2010.
Kalma, J. D., McVicar, T. R., and McCabe, M. F.: Estimating land surface evaporation: A review of methods using remotely sensed surface temperature data, Surv. Geophys., 29, 421–469, https://doi.org/10.1007/s10712-008-9037-z, 2008.
Kattge, J., Knorr, W., Raddatz, T., and Wirth, C.: Quantifying photosynthetic capacity and its relationship to leaf nitrogen content for global-scale terrestrial biosphere models, Glob. Change Biol., 15, 976–991, https://doi.org/10.1111/j.1365-2486.2008.01744.x, 2009.
Katul, G. G., Oren, R., Manzoni, S., Higgins, C., and Parlange, M. B.: Evapotranspiration: a process driving mass transport and energy exchnge in the soil-plant-atmosphere-climate system, Rev. Geophys., 50, RG000366, https://doi.org/10.1029/2011RG000366, 2012.
Kobayashi, H. and Iwabuchi, H.: A coupled 1-D atmosphere and 3-D canopy radiative transfer model for canopy reflectance, light environment, and photosynthesis simulation in a heterogeneous landscape, Remote Sens. Environ., 112, 173–185, https://doi.org/10.1016/j.rse.2007.04.010, 2008.
Kowalczyk, E. A., Wang, Y. P., Law, R. M., Davies, H. L., McGregor, J. L., and Abramowitz, G.: The CSIRO Atmosphere Biosphere Land Exchange (CABLE) model for use in climate models and as an offline model, CSIRO Mar. Atmos. Res. Pap., 13, https://doi.org/10.4225/08/58615c6a9a51d, 2006.
Leuning, R., Kelliher, F. M., DePury, D. G. G., and Schulze, E.-D.: Leaf nitrogen, photosynthesis, conductance and transpiration: scaling from leaves to canopies, Plant. Cell Environ., 18, 1183–1200, https://doi.org/10.1111/j.1365-3040.1995.tb00628.x, 1995.
Li, Y., Huang, C., Hou, J., Gu, J., Zhu, G., and Li, X.: Mapping daily evapotranspiration based on spatiotemporal fusion of ASTER and MODIS images over irrigated agricultural areas in the Heihe River Basin, Northwest China, Agr. Forest Meteorol., 244–245, 82–97, https://doi.org/10.1016/j.agrformet.2017.05.023, 2017.
Li, Z. L., Tang, R., Wan, Z., Bi, Y., Zhou, C., Tang, B., Yan, G., and Zhang, X.: A review of current methodologies for regional Evapotranspiration estimation from remotely sensed data, Sensors, 9, 3801–3853, https://doi.org/10.3390/s90503801, 2009.
Liang, S.: Narrowband to broadband conversions of land surface albedo I Algorithms, Remote Sens. Environ., 76, 213–238, https://doi.org/10.1016/S0034-4257(00)00205-4, 2001.
Liu, Y., Wang, Z., Sun, Q., Erb, A. M., Li, Z., Schaaf, C. B., Zhang, X., Román, M. O., Scott, R. L., Zhang, Q., Novick, K. A., Syndonia Bret-Harte, M., Petroy, S., and SanClements, M.: Evaluation of the VIIRS BRDF, Albedo and NBAR products suite and an assessment of continuity with the long term MODIS record, Remote Sens. Environ., 201, 256–274, https://doi.org/10.1016/j.rse.2017.09.020, 2017.
Lobell, D. B., Roberts, M. J., Schlenker, W., Braun, N., Little, B. B., Rejesus, R. M., and Hammer, G. L.: Greater Sensitivity to Drought Accompanies Maize Yield Increase in the U.S. Midwest, Science, 344, 516–519, https://doi.org/10.1126/science.1251423, 2014.
Loew, A., Peng, J., and Borsche, M.: High-resolution land surface fluxes from satellite and reanalysis data (HOLAPS v1.0): evaluation and uncertainty assessment, Geosci. Model Dev., 9, 2499–2532, https://doi.org/10.5194/gmd-9-2499-2016, 2016.
Lu, X. and Zhuang, Q.: Evaluating evapotranspiration and water-use efficiency of terrestrial ecosystems in the conterminous United States using MODIS and AmeriFlux data, Remote Sens. Environ., 114, 1924–1939, https://doi.org/10.1016/j.rse.2010.04.001, 2010.
Luo, Y., Guan, K., and Peng, J.: STAIR: A generic and fully-automated method to fuse multiple sources of optical satellite data to generate a high-resolution, daily and cloud-/gap-free surface reflectance product, Remote Sens. Environ., 214, 87–99, https://doi.org/10.1016/j.rse.2018.04.042, 2018.
Ma, Y., Liu, S., Song, L., Xu, Z., Liu, Y., Xu, T., and Zhu, Z.: Estimation of daily evapotranspiration and irrigation water efficiency at a Landsat-like scale for an arid irrigation area using multi-source remote sensing data, Remote Sens. Environ., 216, 715–734, https://doi.org/10.1016/j.rse.2018.07.019, 2018.
Masek, J. G., Vermote, E. F., Saleous, N. E., Wolfe, R., Hall, F. G., Huemmrich, K. F., Gao, F., Kutler, J., and Lim, T.: A Landsat Surface Reflectance Dataset, IEEE Geosci. Remote S., 3, 68–72, https://doi.org/10.1109/LGRS.2005.857030, 2006.
Matamala, R., Jastrow, J. D., Miller, R. M. and Garten, C. T.: Temporal changes in C and N stocks of restored prairie: Implications for C sequestration strategies, Ecol. Appl., 18, 1470–1488, https://doi.org/10.1890/07-1609.1, 2008.
McCabe, M. F. and Wood, E. F.: Scale influences on the remote estimation of evapotranspiration using multiple satellite sensors, Remote Sens. Environ., 105, 271–285, https://doi.org/10.1016/j.rse.2006.07.006, 2006.
McCabe, M. F., Rodell, M., Alsdorf, D. E., Miralles, D. G., Uijlenhoet, R., Wagner, W., Lucieer, A., Houborg, R., Verhoest, N. E. C., Franz, T. E., Shi, J., Gao, H., and Wood, E. F.: The future of Earth observation in hydrology, Hydrol. Earth Syst. Sci., 21, 3879–3914, https://doi.org/10.5194/hess-21-3879-2017, 2017.
Meyers, T. P. and Hollinger, S. E.: An assessment of storage terms in the surface energy balance of maize and soybean, Agr. Forest Meteorol., 125, 105–115, https://doi.org/10.1016/j.agrformet.2004.03.001, 2004.
Miner, G. L., Bauerle, W. L., and Baldocchi, D. D.: Estimating the sensitivity of stomatal conductance to photosynthesis: a review, Plant Cell Environ., 40, 1214–1238, https://doi.org/10.1111/pce.12871, 2017.
Miralles, D. G., Holmes, T. R. H., De Jeu, R. A. M., Gash, J. H., Meesters, A. G. C. A., and Dolman, A. J.: Global land-surface evaporation estimated from satellite-based observations, Hydrol. Earth Syst. Sci., 15, 453–469, https://doi.org/10.5194/hess-15-453-2011, 2011.
Mousivand, A., Menenti, M., Gorte, B., and Verhoef, W.: Global sensitivity analysis of the spectral radiance of a soil-vegetation system, Remote Sens. Environ., 145, 131–144, https://doi.org/10.1016/j.rse.2014.01.023, 2014.
Mu, Q., Zhao, M., and Running, S. W.: Improvements to a MODIS global terrestrial evapotranspiration algorithm, Remote Sens. Environ., 115, 1781–1800, https://doi.org/10.1016/j.rse.2011.02.019, 2011.
Myneni, R. B., Hoffman, S., Knyazikhin, Y., Privette, J. L., Glassy, J., Tian, Y., Wang, Y., Song, X., Zhang, Y., Smith, G. R., Lotsch, A., Friedl, M., Morisette, J. T., Votava, P., Nemani, R. R., and Running, S. W.: Global products of vegetation leaf area and fraction absorbed PAR from year one of MODIS data, Remote Sens. Environ., 83, 214–231, https://doi.org/10.1016/S0034-4257(02)00074-3, 2002.
Nguy-Robertson, A., Gitelson, A., Peng, Y., Viña, A., Arkebauer, T., and Rundquist, D.: Green leaf area index estimation in maize and soybean: Combining vegetation indices to achieve maximal sensitivity, Agron. J., 104, 1336–1347, https://doi.org/10.2134/agronj2012.0065, 2012.
Ort, D. R. and Long, S. P.: Limits on Yields in the Corn Belt, Science, 344, 484–485, https://doi.org/10.1126/science.1253884, 2014.
Otkin, J. A., Svoboda, M., Hunt, E. D., Ford, T. W., Anderson, M. C., Hain, C., and Basara, J. B.: Flash Droughts: a Review and Assessment of the Challenges Imposed By Rapid Onset Droughts in the United States, B. Am. Meteorol. Soc., 99, , 911–919, https://doi.org/10.1175/BAMS-D-17-0149.1, 2017.
Pan, M., Sahoo, A. K., Troy, T. J., Vinukollu, R. K., Sheffield, J., and Wood, A. E. F.: Multisource estimation of long-term terrestrial water budget for major global river basins, J. Climate, 25, 3191–3206, https://doi.org/10.1175/JCLI-D-11-00300.1, 2012.
Paw U, K. T. and Gao, W.: Applications of solutions to non-linear energy budget equations, Agr. Forest Meteorol., 43, 121–145, https://doi.org/10.1016/0168-1923(88)90087-1, 1988.
Pisek, J., Sonnentag, O., Richardson, A. D., and Mõttus, M.: Is the spherical leaf inclination angle distribution a valid assumption for temperate and boreal broadleaf tree species?, Agr. Forest Meteorol., 169, 186–194, https://doi.org/10.1016/j.agrformet.2012.10.011, 2013.
Prueger, J., Kustas, W., Hipps, L., Hatfield, J., Cahill, A., Williams, C., Albertson, J., Eichinger, W., Cooper, D., and Brunsell, N.: Spatial variability of turbulent ffuxes across a corn/soybean production region in central Iowa', in: AMS 17th Conference on Hydrology, Long Beach, CA, USA, 2003.
Ryu, Y., Baldocchi, D., Kobayashi, H., Van Ingen, C., Li, J., Black, T. A., Beringer, J., Van Gorsel, E., Knohl, A., Law, B., and Roupsard, O.: Integration of MODIS land and atmosphere products with a coupled-process model to estimate gross primary productivity and evapotranspiration from 1 km to global scales, Global Biogeochem. Cy., 25, GB4017, https://doi.org/10.1029/2011GB004053, 2011.
Ryu, Y., Baldocchi, D. D., Black, T. A., Detto, M., Law, B. E., Leuning, R., Miyata, A., Reichstein, M., Vargas, R., Ammann, C., Beringer, J., Flanagan, L. B., Gu, L., Hutley, L. B., Kim, J., McCaughey, H., Moors, E. J., Rambal, S., and Vesala, T.: On the temporal upscaling of evapotranspiration from instantaneous remote sensing measurements to 8-day mean daily-sums, Agr. Forest Meteorol., 152, 212–222, https://doi.org/10.1016/j.agrformet.2011.09.010, 2012.
Ryu, Y., Jiang, C., Kobayashi, H., and Detto, M.: MODIS-derived global land products of shortwave radiation and diffuse and total photosynthetically active radiation at 5 km resolution from 2000, Remote Sens. Environ., 204, 812–825, https://doi.org/10.1016/j.rse.2017.09.021, 2018.
Sayer, A. M., Munchak, L. A., Hsu, N. C., Levy, R. C., Bettenhausen, C., and Jeong, M. J.: MODIS Collection 6 aerosol products: Comparison between Aqua's e-Deep Blue, Dark Target, and “merged” data sets, and usage recommendations, J. Geophys. Res.-Atmos., 119, 13965–13989, https://doi.org/10.1002/2014JD022453, 2014.
Schaaf, C. B., Gao, F., Strahler, A. H., Lucht, W., Li, X., Tsang, T., Strugnell, N. C., Zhang, X., Jin, Y., Muller, J.-P., Lewis, P., Barnsley, M., Hobson, P., Disney, M., Roberts, G., Dunderdale, M., Doll, C., D'Entremont, R. P., Hu, B., Liang, S., Privette, J. L., and Roy, D.: First operational BRDF, albedo nadir reflectance products from MODIS, Remote Sens. Environ., 83, 135–148, https://doi.org/10.1016/S0034-4257(02)00091-3, 2002.
Schmit, T. J., Griffith, P., Gunshor, M. M., Daniels, J. M., Goodman, S. J., and Lebair, W. J.: A closer look at the ABI on the goes-r series, B. Am. Meteorol. Soc., 98, 681–698, https://doi.org/10.1175/BAMS-D-15-00230.1, 2017.
Seemann, S. W., Li, J., Gumley, L. E., Strabala, K. I., and Menzel, W. P.: Operational retrieval of atmospheric temperature, moisture, and ozone from MODIS infrared radiances, in: Third International Asia-Pacific Environmental Remote Sensing Remote Sensing of the Atmosphere, Ocean, Environment, and Space, edited by: Menzel, W. P., Zhang, W.-J., Le Marshall, J., and Tokuno, M., 168–176, International Society for Optics and Photonics, 2003.
Sellers, P. J.: Modeling the Exchanges of Energy, Water, and Carbon Between Continents and the Atmosphere, Science, 275, 502–509, https://doi.org/10.1126/science.275.5299.502, 1997.
Sellers, P. J., Dickinson, R. E., Randall, D. A., Betts, A. K., Hall, F. G., Berry, J. A., Collatz, G. J., Denning, A. S., Mooney, H. A., Nobre, C. A., Sato, N., Field, C. B., and Henderson-Sellers, A.: Modeling the exchanges of energy, water, and carbon between continents and the atmosphere, Science, 275, 502–509, https://doi.org/10.1126/science.275.5299.502, 1997.
Senay, G. B., Friedrichs, M., Singh, R. K., and Velpuri, N. M.: Evaluating Landsat 8 evapotranspiration for water use mapping in the Colorado River Basin, Remote Sens. Environ., 185, 171–185, https://doi.org/10.1016/j.rse.2015.12.043, 2016.
Serbin, S. P., Singh, A., Desai, A. R., Dubois, S. G., Jablonski, A. D., Kingdon, C. C., Kruger, E. L., and Townsend, P. A.: Remotely estimating photosynthetic capacity, and its response to temperature, in vegetation canopies using imaging spectroscopy, Remote Sens. Environ., 167, 78–87, https://doi.org/10.1016/j.rse.2015.05.024, 2015.
Singh, R. K., Irmak, A., Irmak, S., and Martin, D. L.: Application of SEBAL Model for Mapping Evapotranspiration and Estimating Surface Energy Fluxes in South-Central Nebraska, J. Irrig. Drain. E., 134, 273–285, https://doi.org/10.1061/(ASCE)0733-9437(2008)134:3(273), 2008.
Su, Z.: The Surface Energy Balance System (SEBS) for estimation of turbulent heat fluxes, Hydrol. Earth Syst. Sci., 6, 85–100, https://doi.org/10.5194/hess-6-85-2002, 2002.
Suyker, A. E., Verma, S. B., Burba, G. G., Arkebauer, T. J., Walters, D. T., and Hubbard, K. G.: Growing season carbon dioxide exchange in irrigated and rainfed maize, Agr. Forest Meteorol., 124, 1–13, https://doi.org/10.1016/j.agrformet.2004.01.011, 2004.
Tian, H., Chen, G., Liu, M., Zhang, C., Sun, G., Lu, C., Xu, X., Ren, W., Pan, S., and Chappelka, A.: Model estimates of net primary productivity, evapotranspiration, and water use efficiency in the terrestrial ecosystems of the southern United States during 1895–2007, Forest Ecol. Manage., 259, 1311–1327, https://doi.org/10.1016/j.foreco.2009.10.009, 2010.
Turner, P. A., Baker, J. M., Griffis, T. J., and Venterea, R. T.: Impact of Kura Clover Living Mulch on Nitrous Oxide Emissions in a Corn–Soybean System, J. Environ. Qual., 45, 1782, https://doi.org/10.2134/jeq2016.01.0036, 2016.
USDA: 2012 census of agriculture, USDA National Agricultural Statistics Service Washington, DC, available at: https://www.agcensus.usda.gov/Publications/2012/ (last access: 11 March 2020), 2014.
USDA: Acreage, available at: http://usda.mannlib.cornell.edu/usda/current/Acre/Acre-06-29-2018.pdf (last access: 11 March 2020), 2018.
Van Bodegom, P. M., Douma, J. C., and Verheijen, L. M.: A fully traits-based approach to modeling global vegetation distribution., P. Natl. Acad. Sci. USA, 111, 13733–13738, https://doi.org/10.1073/pnas.1304551110, 2014.
Verhoef, W.: Light scattering by leaf layers with application to canopy reflectance modeling: The SAIL model, Remote Sens. Environ., 16, 125–141, https://doi.org/10.1016/0034-4257(84)90057-9, 1984.
Verhoef, W.: Earth observation modeling based on layer scattering matrices, Remote Sens. Environ., 17, 165–178, https://doi.org/10.1016/0034-4257(85)90072-0, 1985.
Verrelst, J., Malenovský, Z., van der Tol, C., Camps-Valls, G., Gastellu-Etchegorry, J. P., Lewis, P., North, P., and Moreno, J.: Quantifying Vegetation Biophysical Variables from Imaging Spectroscopy Data: A Review on Retrieval Methods, Surv. Geophys., 40, 589–629, https://doi.org/10.1007/s10712-018-9478-y, 2018.
Walker, A. P., Quaife, T., van Bodegom, P. M., De Kauwe, M. G., Keenan, T. F., Joiner, J., Lomas, M. R., MacBean, N., Xu, C., Yang, X., and Woodward, F. I.: The impact of alternative trait-scaling hypotheses for the maximum photosynthetic carboxylation rate (Vcmax) on global gross primary production, New Phytol., 215, 1370–1386, https://doi.org/10.1111/nph.14623, 2017.
Wan, Z., Zhang, K., Xue, X., Hong, Z., Hong, Y., and Gourley, J. J.: Water balance-based actual evapotranspiration reconstruction from ground and satellite observations over the conterminous United States, Water Resour. Res., 51, 6485–6499, https://doi.org/10.1002/2015WR017311, 2015.
Wang, H., Prentice, I. C., Davis, T. W., Keenan, T. F., Wright, I. J., and Peng, C.: Photosynthetic responses to altitude: an explanation based on optimality principles, New Phytol., 213, 976–982, https://doi.org/10.1111/nph.14332, 2017.
Wang, K. and Dickinson, R. E.: A review of global terrestrial evapotranspiration: observation, modelling, climatology, and climatic variability, Rev. Geophys., 50, RG2005, https://doi.org/10.1029/2011RG000373, 2012.
Wei, J., Chen, Y., Gu, Q., Jiang, C., Ma, M., Song, L., and Tang, X.: Potential of the remotely-derived products in monitoring ecosystem water use efficiency across grasslands in Northern China, Int. J. Remote Sens., 40, 6203–6223, https://doi.org/10.1080/01431161.2019.1587208, 2019.
Weiss, M., Baret, F., Myneni, R., Pragnère, A., and Knyazikhin, Y.: Investigation of a model inversion technique to estimate canopy biophysical variables from spectral and directional reflectance data, Agronomie, 20, 3–22, https://doi.org/10.1051/agro:2000105, 2000.
Whitley, R., Beringer, J., Hutley, L. B., Abramowitz, G., De Kauwe, M. G., Duursma, R., Evans, B., Haverd, V., Li, L., Ryu, Y., Smith, B., Wang, Y.-P., Williams, M., and Yu, Q.: A model inter-comparison study to examine limiting factors in modelling Australian tropical savannas, Biogeosciences, 13, 3245–3265, https://doi.org/10.5194/bg-13-3245-2016, 2016.
Whitley, R., Beringer, J., Hutley, L. B., Abramowitz, G., De Kauwe, M. G., Evans, B., Haverd, V., Li, L., Moore, C., Ryu, Y., Scheiter, S., Schymanski, S. J., Smith, B., Wang, Y.-P., Williams, M., and Yu, Q.: Challenges and opportunities in land surface modelling of savanna ecosystems, Biogeosciences, 14, 4711–4732, https://doi.org/10.5194/bg-14-4711-2017, 2017.
Wilson, T. B. and Meyers, T. P.: Determining vegetation indices from solar and photosynthetically active radiation fluxes, Agr. Forest Meteorol., 144, 160–179, https://doi.org/10.1016/j.agrformet.2007.04.001, 2007.
Wright, C. K. and Wimberly, M. C.: Recent land use change in the Western Corn Belt threatens grasslands and wetlands, P. Natl. Acad. Sci. USA, 110, 4134–4139, https://doi.org/10.1073/pnas.1215404110, 2013.
Wu, P., Shen, H., Zhang, L., and Göttsche, F. M.: Integrated fusion of multi-scale polar-orbiting and geostationary satellite observations for the mapping of high spatial and temporal resolution land surface temperature, Remote Sens. Environ., 156, 169–181, https://doi.org/10.1016/j.rse.2014.09.013, 2015.
Xu, J., Liang, Y., Liu, J., and Huang, Z.: Multi-frame super-resolution of gaofen-4 remote sensing images, Sensors, 17, 2142, https://doi.org/10.3390/s17092142, 2017.
Xu, M., Liu, R., Chen, J. M., Liu, Y., Shang, R., Ju, W., Wu, C., and Huang, W.: Retrieving leaf chlorophyll content using a matrix-based vegetation index combination approach, Remote Sens. Environ., 224, 60–73, https://doi.org/10.1016/j.rse.2019.01.039, 2019.
Yang, Y., Anderson, M. C., Gao, F., Wardlow, B., Hain, C. R., Otkin, J. A., Alfieri, J., Yang, Y., Sun, L., and Dulaney, W.: Field-scale mapping of evaporative stress indicators of crop yield: An application over Mead, NE, USA, Remote Sens. Environ., 210, 387–402, https://doi.org/10.1016/j.rse.2018.02.020, 2018.
Yebra, M., Van Dijk, A., Leuning, R., Huete, A., and Guerschman, J. P.: Evaluation of optical remote sensing to estimate actual evapotranspiration and canopy conductance, Remote Sens. Environ., 129, 250–261, https://doi.org/10.1016/j.rse.2012.11.004, 2013.
Zhang, K., Kimball, J. S., and Running, S. W.: A review of remote sensing based actual evapotranspiration estimation, Wiley Interdiscip. Rev. Water, 3, 834–853, https://doi.org/10.1002/wat2.1168, 2016.
Zhang, X., Liang, S., Wang, G., Yao, Y., Jiang, B., and Cheng, J.: Evaluation of the reanalysis surface incident shortwave radiation products from NCEP, ECMWF, GSFC, and JMA using satellite and surface observations, Remote Sens., 8, 225, https://doi.org/10.3390/rs8030225, 2016.
Zhang, Y., Guanter, L., Berry, J. a, Joiner, J., van der Tol, C., Huete, A., Gitelson, A., Voigt, M., and Köhler, P.: Estimation of vegetation photosynthetic capacity from space-based measurements of chlorophyll fluorescence for terrestrial biosphere models, Glob. Change Biol., 20, 3727–3742, https://doi.org/10.1111/gcb.12664, 2014.
Zhang, Y., Guanter, L., Joiner, J., Song, L., and Guan, K.: Spatially-explicit monitoring of crop photosynthetic capacity through the use of space-based chlorophyll fluorescence data, Remote Sens. Environ., 210, 362–374, https://doi.org/10.1016/j.rse.2018.03.031, 2018.
Zheng, Y., Ren, H., Guo, J., Ghent, D., Tansey, K., Hu, X., Nie, J., and Chen, S.: Land Surface Temperature Retrieval from Sentinel-3A Sea and Land Surface Temperature Radiometer, Using a Split-Window Algorithm, Remote Sens., 11, 650, https://doi.org/10.3390/rs11060650, 2019.
Zhong, L., Hu, L., Yu, L., Gong, P., and Biging, G. S.: Automated mapping of soybean and corn using phenology, ISPRS J. Photogramm., 119, 151–164, https://doi.org/10.1016/j.isprsjprs.2016.05.014, 2016.
Zhu, X., Chen, J., Gao, F., Chen, X., and Masek, J. G.: An enhanced spatial and temporal adaptive reflectance fusion model for complex heterogeneous regions, Remote Sens. Environ., 114, 2610–2623, https://doi.org/10.1016/j.rse.2010.05.032, 2010.
- Abstract
- Introduction
- Materials and methods
- Results
- Discussions
- Conclusions
- Appendix A: Key equations for energy balance in BESS. Subscript i represents sunlit or shaded canopy
- Data availability
- Author contributions
- Competing interests
- Disclaimer
- Acknowledgements
- Financial support
- Review statement
- References