the Creative Commons Attribution 4.0 License.
the Creative Commons Attribution 4.0 License.
 | 17 Apr 2020
Quantifying the impacts of human water use and climate variations on recent drying of Lake Urmia basin: the value of different sets of spaceborne and in situ data for calibrating a global hydrological model
Seyed-Mohammad Hosseini-Moghari
Shahab Araghinejad
Mohammad J. Tourian
Kumars Ebrahimi
Petra Döll
During the last decades, the endorheic Lake Urmia basin in northwestern Iran has suffered from declining groundwater tables and a very strong recent reduction in the volume of Lake Urmia. For the case of Lake Urmia basin, this study explores the value of different locally and globally available observation data for adjusting a global hydrological model such that it can be used for distinguishing the impacts of human water use and climate variations. The WaterGAP Global Hydrology Model (WGHM) was for the first time calibrated against multiple in situ and spaceborne data to analyze the decreasing lake water volume, lake river inflow, loss of groundwater, and total water storage in the entire basin during 2003–2013. The calibration process was done using an automated approach including a genetic algorithm (GA) and non-dominated sorting genetic algorithm II (NSGA-II). Then the best-performing calibrated models were run with and without considering water use to quantify the impact of human water use. Observations encompass remote-sensing-based time series of annual irrigated areas in the basin from MODIS, monthly total water storage anomaly (TWSA) from GRACE satellites, and monthly lake volume anomalies. In situ observations include time series of annual inflow into the lake and basin averages of groundwater level variations based on 284 wells. In addition, local estimates of sectoral water withdrawals in 2009 and return flow fractions were utilized. Calibration against MODIS and GRACE data alone improved simulated inflow into Lake Urmia but inflow and lake volume loss were still overestimated, while groundwater loss was underestimated and seasonality of groundwater storage was shifted as compared to observations. Lake and groundwater dynamics could only be simulated well if calibration against groundwater levels led to an adjustment of the fractions of human water use from groundwater and surface water. Thus, in some basins, globally available satellite-derived observations may not suffice for improving the simulation of human water use. According to WGHM simulations with 18 optimal parameter sets, human water use was the reason for 52 %–57 % of the total basin water loss of about 10 km3 during 2003–2013, for 39 %–43 % of the Lake Urmia water loss of about 8 km3, and for up to 87 %–90 % of the groundwater loss. Lake inflow was 39 %–45 % less than it would have been without human water use. The study shows that even without human water use Lake Urmia would not have recovered from the significant loss of lake water volume caused by the drought year 2008. These findings can support water management in the basin and more specifically Lake Urmia restoration plans.
- Article
(4864 KB) -
Supplement
(1117 KB) - BibTeX
- EndNote


Iran is a country with an arid and semi-arid climate where population growth and the government's aim of food self-sufficiency has led to increasing irrigated crop production and exploitation of surface water and groundwater resources. Climate change has resulted in increased temperatures and, in particular in the northwest of the country, in decreased precipitation (Tabari and Talaee, 2011a, b) and thus decreased renewable water resources. In the last decades, numerous wetlands and lakes in Iran have dried up, and groundwater levels have strongly declined in most areas (Madani et al., 2016). The most serious disaster has occurred in Lake Urmia basin, an interior basin in the northwest of Iran located in the three provinces, West Azarbaijan, East Azarbaijan, and Kurdistan, that covers an area of 52 000 km2 (Fig. 1). At the downstream of the basin, 17 permanent rivers and 12 seasonal rivers discharge into the largest natural water body in Iran, Lake Urmia. Over the past two decades, climate variations and human activities (Hassanzadeh et al., 2012) have decreased inflow into the lake. Precipitation in the basin shows a decreasing trend over the period 1951—2013, with particularly low values after 1995, and evaporation has increased (Alizadeh-Choobari et al., 2016). The lake water volume is now approximately 30×109 m3 below its historical maximum (ULRP, 2015a).
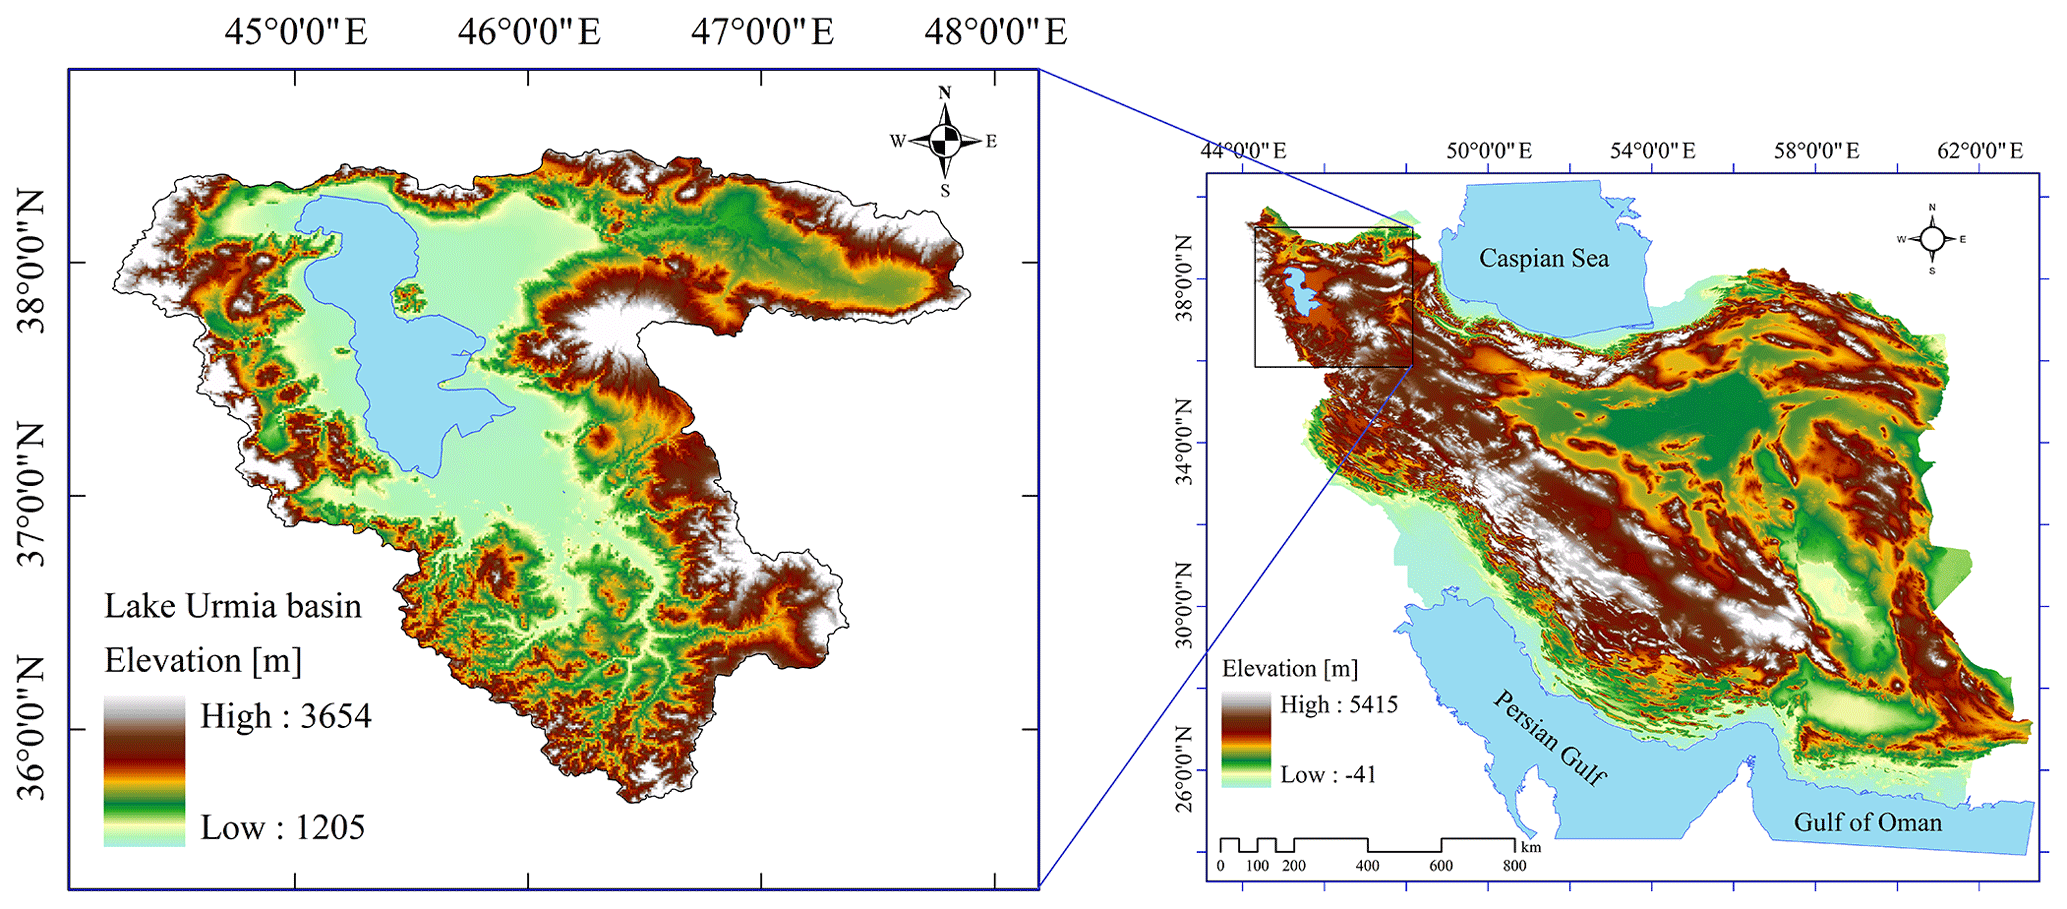
Figure 1Location of Lake Urmia basin.
Lake Urmia is one of the largest hypersaline lakes in the world, which due to its ecological and natural features is a national park, a Ramsar site, and a UNESCO Biosphere Reserve (Eimanifar and Mohebbi, 2007). It is a terminal lake that loses water only by evaporation (Hassanzadeh et al., 2012). Abbaspour and Nazaridoust (2007) estimated that inflows of at least 3×10⁹ m3 yr−1 are needed to compensate for lake evaporation, while Alborzi et al. (2018) estimated values between 2.9×10⁹ to 5.4×10⁹ m3 yr−1 depending on climatic conditions. According to Alborzi et al. (2018), recovery of the lake could range from 3 to 16 years depending on climatic conditions, water use reductions, and environmental releases. Inflow from groundwater to the lake was estimated to be less than 3 % of total inflow from precipitation, rivers, and groundwater (Hasemi, 2011). In the 1970s and 1980s, the water level of Lake Urmia was approximately at 1276 m a.s.l. (above sea level) and then increased to more than 1278 m in 1995 due to a few wet years (Shadkam et al., 2016). Khazaei et al. (2019) identified the year 2000 as the change point of lake dynamics. The water level dropped to 1274 m in 2003 because of the severe drought in 1999–2001, exacerbated by human water use (Shadkam et al., 2016). From 2003 to 2014, lake extent was approximately halved, and water level declined by another 3 m, while seasonal variability of lake water extent increased (Tourian et al., 2015) (Fig. 2).

Figure 2Time series of surface water extent and water level elevation of Lake Urmia (data from Tourian et al., 2015).
Studies on various aspects of the Lake Urmia disaster abound. With decreasing lake water volume, salt concentration has increased (Boroughani et al., 2019), endangering the aquatic biota feeding birds; exposed salt layers may lead to salt storms (Pengra, 2012). Precipitation reduction and temperature increases (Delju et al., 2012; Fathian et al., 2014; Shadkam et al., 2016; Farokhnia et al., 2018), agricultural development including construction of man-made dams (Farajzadeh et al., 2014; Banihabib et al., 2015; Azarnivand and Banihabib, 2017; AghaKouchak et al., 2015; Alizade Govarchin Ghale et al., 2018; Khazaei et al., 2019), and building a causeway across the lake (Zeinoddini et al., 2009) have been identified as the reasons for the degradation of Lake Urmia. By using Gravity Recovery And Climate Experiment (GRACE) satellite observations, altimetry data for Lake Urmia, and outputs of the Global Land Data Assimilation System (GLDAS), Forootan et al. (2014) estimated the trend of groundwater storage changes in Lake Urmia basin as −11.2 mm yr−1 between the years of 2005 to 2011, the largest decrease of the six investigated Iranian basins. Ahmadzadeh et al. (2016) investigated the effect of irrigation system changes in the basin from the surface to pressurized systems; they found that such changes would increase water productivity but would have no effect on lake inflow and would reduce groundwater levels by 20 %.
Four hydrological modeling studies for Lake Urmia basin focused on quantifying the contributions of various factors to lake water volume (Hassanzadeh et al., 2012), lake inflow (Shadkam et al., 2016), or both (Farokhnia et al., 2018; Chaudhari et al., 2018). Using a lumped system dynamics modeling approach and observed time series of lake water volume for model calibration, Hassanzadeh et al. (2012) determined that about 65 % of lake level decline between 1997 and 2006 was due to reduced river inflow, while four major man-made reservoirs contributed 25 % and diminished precipitation on the lake surface 10 %. Shadkam et al. (2016) evaluated the impact of climate, irrigation with surface water and reservoirs on inflow into the lake for the period 1960–2010 using a modified version of the macro-scale gridded hydrological model variable infiltration capacity (VIC) model, which was calibrated against time series of river discharge at six observation station at the downstream end of six sub-basins draining into Lake Urmia. While the model was driven by a global gridded WFDEI climate data set with a spatial resolution of 0.5∘, basin-specific information on 41 reservoirs and on the temporal development of irrigated areas were taken into account. The study found that reservoirs had a very small impact on annual inflows and that climate variations accounted for 60 % of a lake inflow decrease of 48 % over the 50-year period. In the model, all irrigation requirements need to be fulfilled by available surface water. Therefore, reduced availability of surface water during the 2000s due to low precipitation and high temperature resulted in unfulfilled irrigated water demand and a cap on the effect of human water use in the model while in reality, groundwater abstractions occurred and even increased (Delju et al., 2012; Hesami and Amini, 2016). In addition, the modeling study of Shadkam et al. (2016) did not consider the impact of domestic and industrial water use in the basin, which can be expected to have increased during the last decades, given a population increase from 4.8 to 5.9 million from 2002 to 2010 (http://ulrp.sharif.ir/en/page/about-urmia-lake-basin, last access: 28 April 2018). Chaudhari et al. (2018) used the output of the global HiGW-MAT model, with 1∘ × 1∘ grid cell size of approx. 10 000 km2, to distinguish climatic and anthropogenic contributions to the shrinkage of Urmia Lake. By running the model with and without human impacts (surface and groundwater use as well as reservoirs), they estimated that the human-induced river flow decline between 1995 and 2010 accounts for 86 % of the observed decrease in lake volume. However, a comparison with GRACE TWSA showed that the model overestimates the decrease in TWSA in the basin between 2003 and 2010. The HiGW-MAT model was not calibrated for Lake Urmia basin but net irrigation requirements were simulated specifically for this study based on Landsat satellite images for five years between 1987 and 2016. The lake water balance is not simulated by the model such that no comparison with observed lake water levels was possible. A comparison with river discharge or groundwater observations was not done either. Farokhnia et al. (2018) developed a Soil & Water Assessment Tool (SWAT) model for quantifying the role of anthropogenic and climatic factors on hydrological change of the basin and lake during the 22-year period ending in 2009. By running the SWAT model under anthropogenic and natural conditions, they estimated the role of anthropogenic and climatic factors in the shrinkage of Urmia Lake. They concluded that the contribution of human activities and climate variability is almost equal to decreasing inflow into the lake and lake volume loss. They illustrated that in the second half of their study period, the climatic factors are responsible for 58 % of the lake volume loss. However, they did not provide any results about the effects of human water use and climate change on groundwater across the basin. Besides, domestic and industrial water use was not considered in their study.
In previous hydrological modeling studies of Lake Urmia basin, either there was no model calibration or calibration was only done using a single observation type, in particular surface water inflow into the lake. Although streamflow observations are very informative for hydrological modeling as they integrate over processes in the whole upstream basin, a good fit of simulated and observed streamflow may not necessarily lead to an appropriate simulation of other flows and storages (Beven and Freer, 2001). Moreover, additional types of observations have to be added to reduce the possibility of equifinality (Döll et al., 2016; Kelleher et al., 2017; Khatami et al., 2019). In this study, a multi-observation calibration approach was used to calibrate a hydrological model which was then applied to quantify the contributions of climate variations and human activities to the decrease in Lake Urmia water volume and river inflows. In addition, using Lake Urmia basin as a test case, we wanted to explore the value of different types of observation data for adjusting a global hydrological model by multi-observation calibration. Currently, global hydrological models are mostly uncalibrated but globally available satellite-derived observations have increased the opportunity for model calibration at the global scale (Döll et al., 2016). For this purpose, the WaterGAP global hydrology model (WGHM) was calibrated by means of a genetic algorithm (GA) and non-dominated sorting genetic algorithm II (NSGA-II) for Lake Urmia basin. Descriptions of the used data and the simulation setup are presented in Sect. 2. The results of the different calibration variants and the impacts of human water use are shown in Sect. 3. Section 4 discusses multi-observation calibration and the analysis of human impact as well as the limitations of the study. Finally, conclusions are drawn.
We analyzed the 11-year period from the beginning of 2003 until the end of 2013, as both GRACE data and global climate data were available to drive WaterGAP for this period. In the following sections, WaterGAP, its input data and the observational data used for calibration as well as the calibration approach are described.
2.1 WaterGAP
WaterGAP is a global hydrological model for assessing water resources under the influence of humans (Döll et al., 2003; Müller Schmied et al., 2014). With a spatial resolution of 0.5∘ × 0.5∘, it simulates water abstractions and consumptive water use (so-called net abstractions, i.e., the amount of water that evapotranspirates during use and does not flow to surface water bodies and groundwater afterwards) in five sectors (irrigation, livestock, domestic, manufacturing, and cooling of thermal power plants); then net abstractions from either groundwater (NAg) or surface water bodies (NAs) are computed (Müller Schmied et al., 2014; Döll et al., 2012). Time series of NAg and NAs in each grid cell are then input to WGHM that simulates their effect on water flows and storages. In its standard version, WaterGAP is calibrated against observed mean annual river discharge at 1319 stations worldwide by adjusting 1–3 model parameters related to runoff generation and streamflow (Müller Schmied et al., 2014), but due to lack of data not for any station in Lake Urmia basin. A previous WaterGAP version was calibrated, for 22 large basins, against streamflow and total water storage anomalies by adjusting 6–8 parameters (Werth and Güntner, 2010). WGHM can be run globally or for a specific basin. In this study, it was run only for the 22 0.5∘ grid cells that represent Lake Urmia basin in WGHM (Fig. 3). A more detailed description of WGHM can be found in the Supplement.
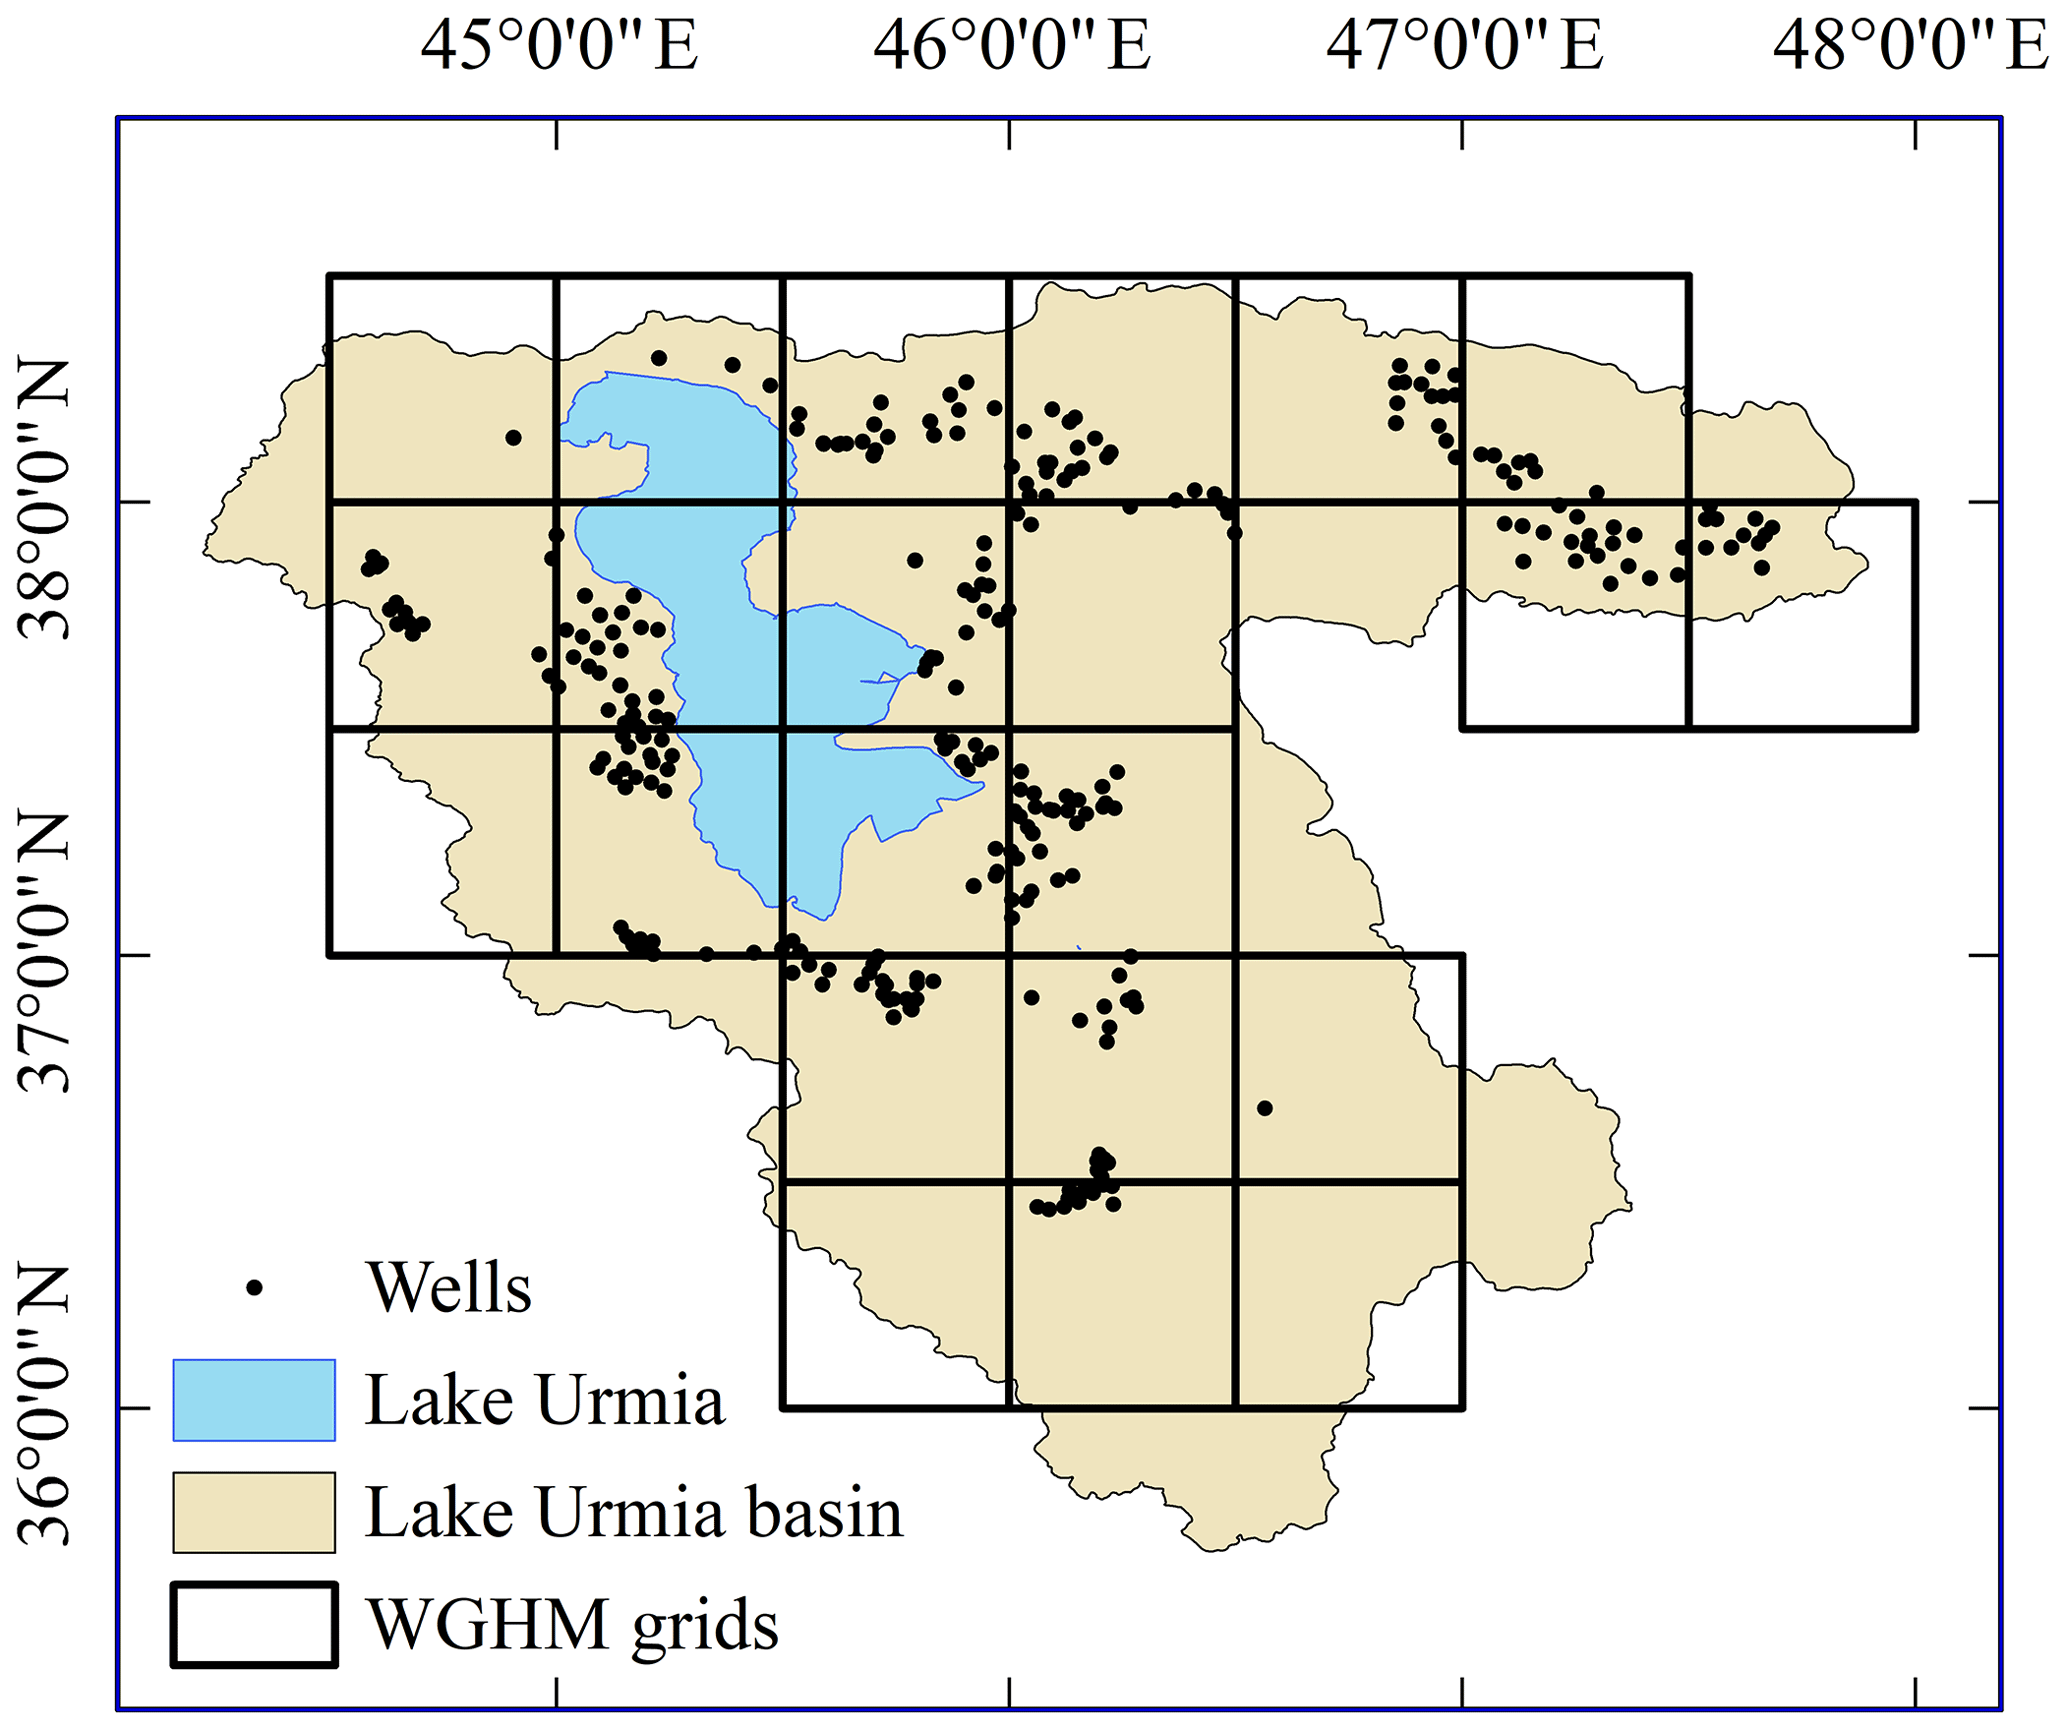
Figure 3Grid cells in WGHM corresponding to Lake Urmia basin along with the locations of groundwater wells across the basin.
2.2 Data
We used the following observations for calibrating WGHM: (1) remote sensing data including an irrigated area in Lake Urmia basin and GRACE TWSA; (2) inflow into Lake Urmia Q; (3) groundwater levels from well observations, which were converted into groundwater storage anomalies GWSA (see Sect. S2); and (4) statistical information on water withdrawals and consumptive uses in the basin. In addition, a time series of lake volume based on remote sensing was used for validation. The 0.5∘ gridded EWEMBI data set was used as climate forcing. Irrigated area and Q are at the annual timescale, TWSA, GWSA, and lake volume on the monthly scale and the climate forcing is on a daily scale. All data cover the period 2003–2013 (see Sect. S2 for details).
2.3 Calibration approach
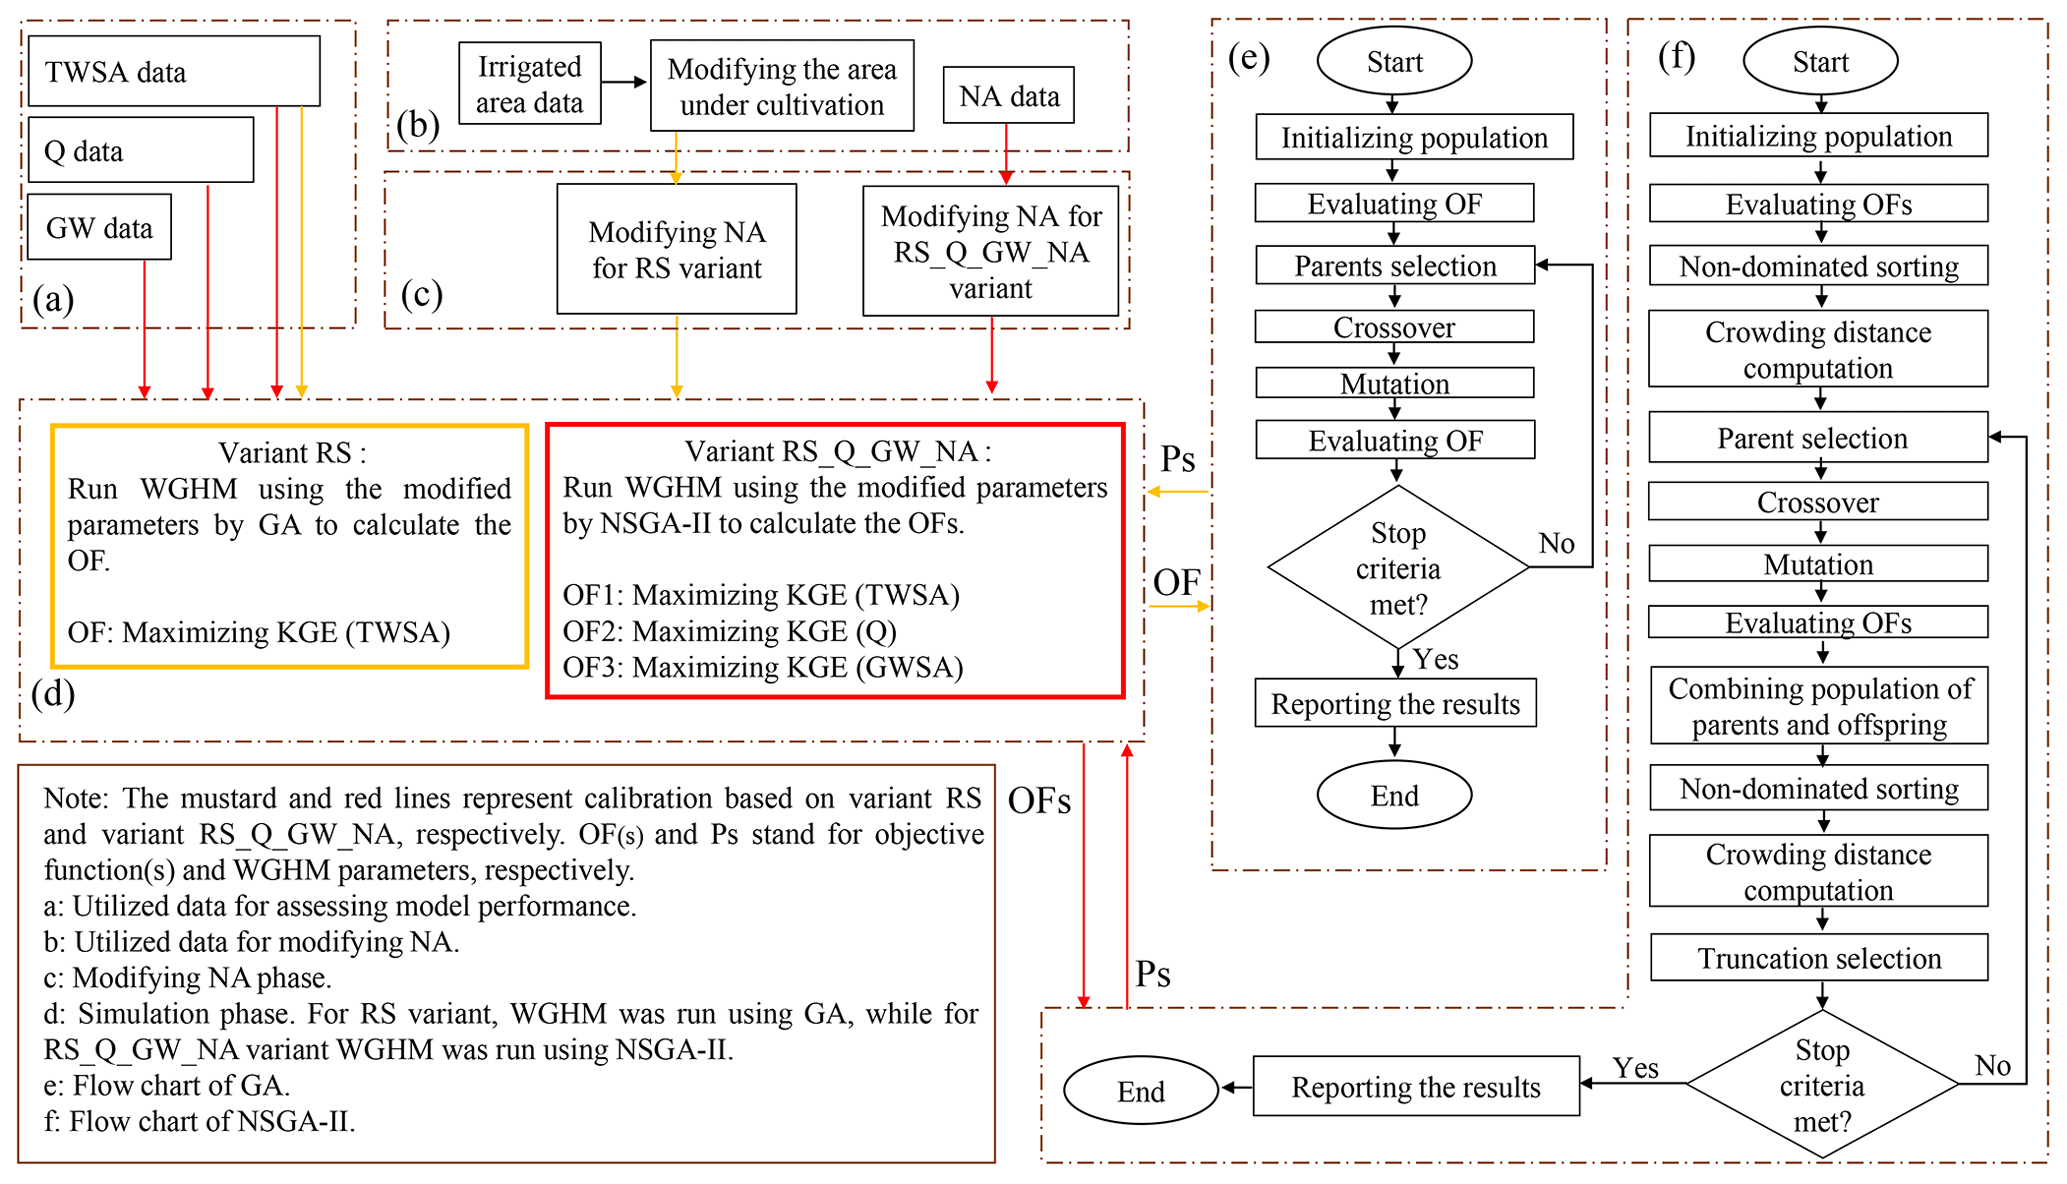
Two calibration variants were applied. In the RS variant, only the remote sensing information was used for calibration, including irrigated area from MODIS and GRACE TWSA. In the variant RS_Q_GW_NA, ground-based information was used in addition to the remote sensing observations. This included inflow into the lake, groundwater data, and statistical information regarding water use. Calibration was done using the GA for variant RS, with just one calibration objective, and the NSGA-II, a multi-objective version of GA, for the variant RS_Q_GW_NA. To integrate optimization algorithm with WGHM, we scripted the codes in shell and R environments by modifying “GA” (Scrucca, 2013), and “nsga2R” (Tsou, 2013) packages in R. GA and NSGA-II are the most common evolutionary optimization algorithms in hydrological model calibration (e.g., Azarnivand et al., 2020). Both algorithms start with a random population (here WGHM parameters) and after evaluating the objective function(s) (here the Kling–Gupta efficiency, KGE) the better parameter sets are selected based on the value of the objective function (in GA) and non-domination and crowding distance (in NSGA-II). Then, the crossover and mutation operators are applied and the process will be continued until one stopping criterion is met. The details of GA and NSGA-II can be found in Mirjalili (2019) and Deb et al. (2002), respectively. Because of the use of the random generators in GA and NSGA-II, we did five runs for each algorithm to achieve more reliable results. The selected parameters for each algorithm are presented in the Supplement (Table S3). Figure 4 shows the flowchart of these algorithms along with a schematic of the calibration process for the two calibration variants. In short, calibration included the modification time series of irrigated areas, of NAg and NAs, with different multipliers for individual years, as well as the modification of seven temporally constant model parameters or, in the case of spatially heterogeneous parameters, multipliers (see Table 1). Modifications were done homogeneously for the whole basin. Months with assumed irrigation in Lake Urmia basin according to WaterGAP correspond to the actual irrigation months (April and October) in the basin according to Saemian et al. (2015). Thus no correction of seasonality was needed in the calibration process. More details are provided in the Supplement. During calibration, seven model parameters (Table 1) were adjusted that are known to have an impact on TWSA, Q, and GWSA. We used a modified version of the KGE as the objective function, where the trend of the time series was added as a fourth component to the KGE (see Eq. 5 below).
Table 1WGHM parameters with the most effect on TWSA, inflow into the lake, and groundwater storage.
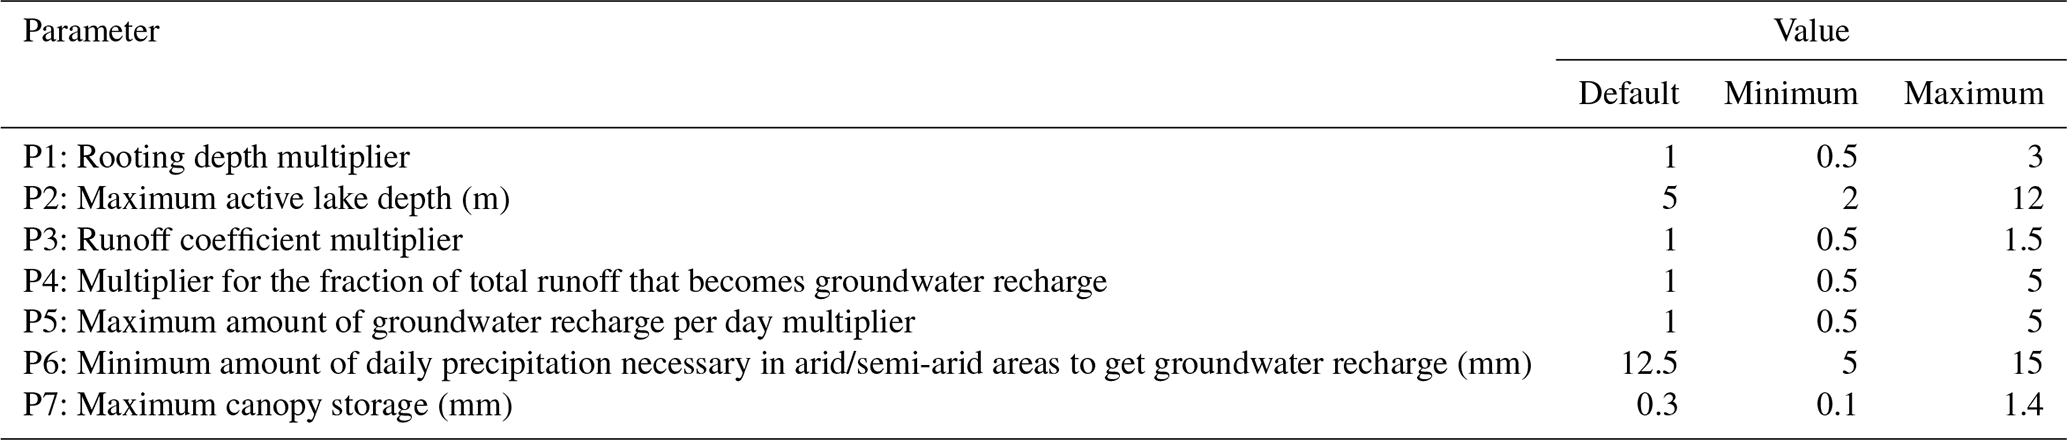
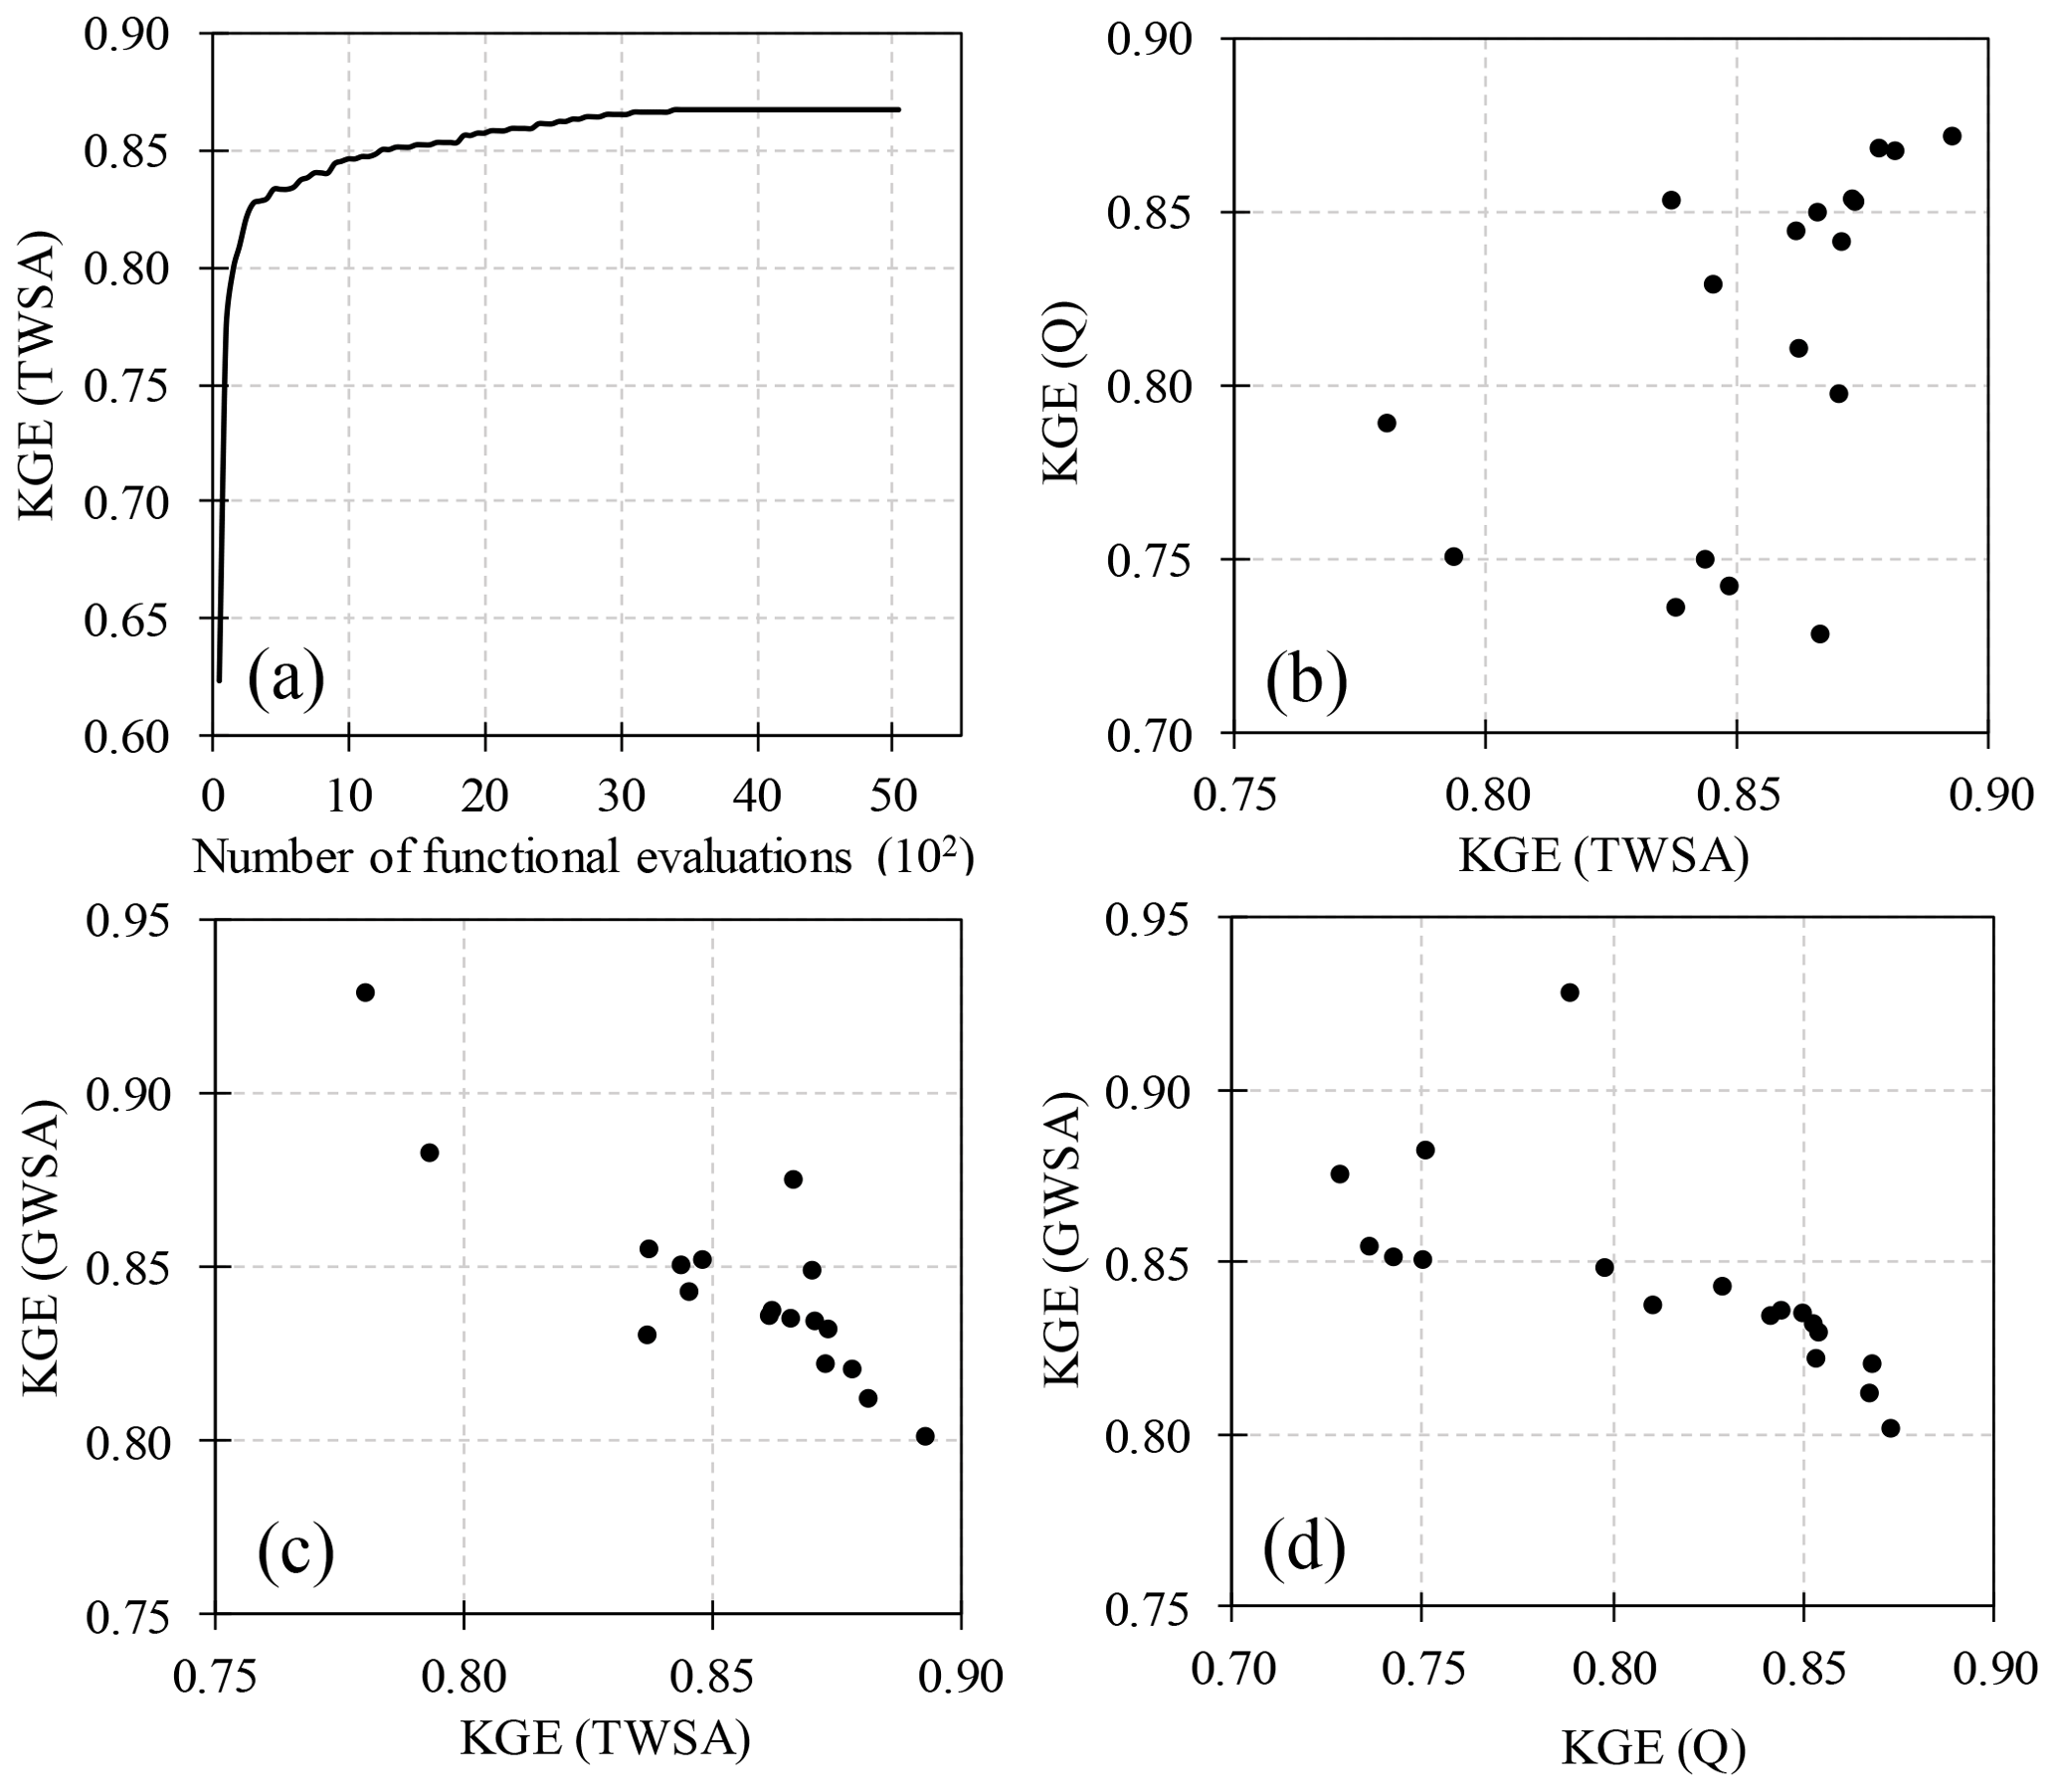
Figure 5Best convergence history of GA in calibrating WGHM for the variant RS (a) and Pareto fronts for the multi-objective calibrations generated by NSGA-II for the variant RS_Q_GW_NA (b–d).
2.4 Performance indicators
Performance of the WGHM was evaluated using the correlation coefficient (CC), Nash–Sutcliffe efficiency (NSE), root mean square error (RMSE), relative absolute error (RAE), and a modified version of the KGE with
where Cov is covariance function, σ refers to standard division, Trend indicates the linear trend of the time series, Obs is observed value, Sim is simulated value, t refers to time counter, and T is the period length. Optimum values of CC, NSE, and KGE are 1, and of RMSE and RE are 0. Trends and overall behavior of the time series were also analyzed.
3.1 Model calibration
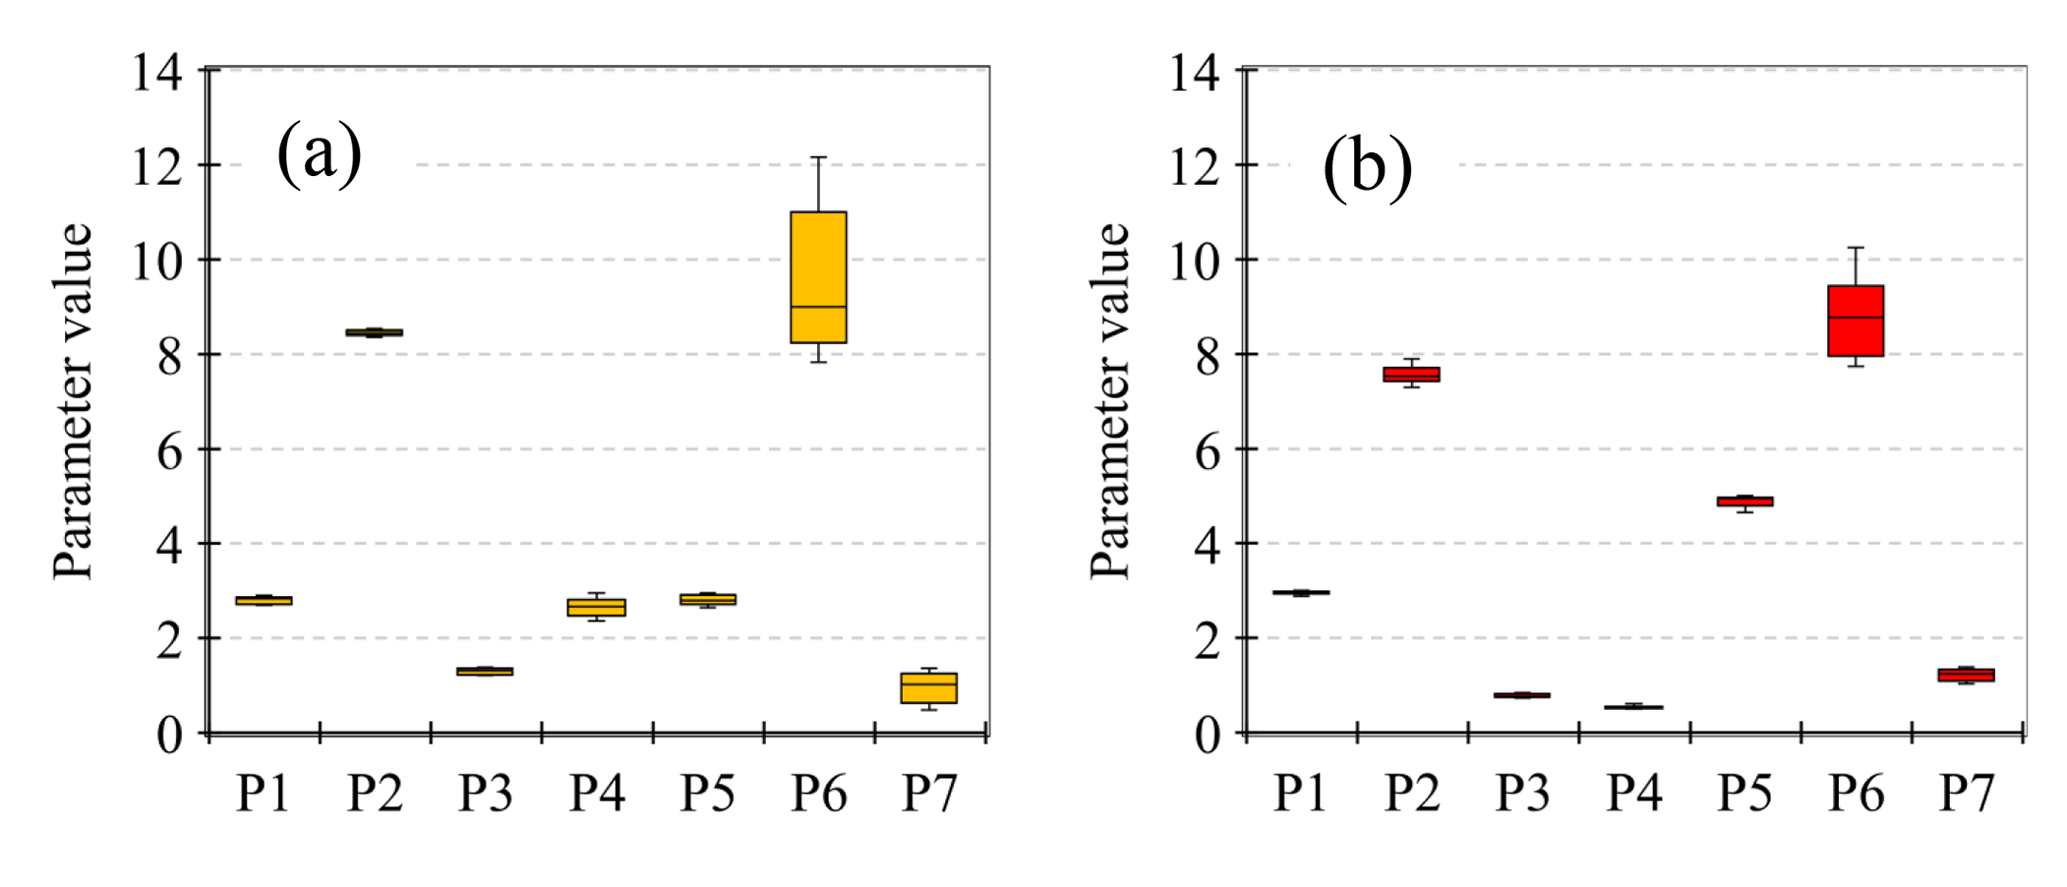
First, NA was adjusted based on either MODIS data only (variant RS) or MODIS data and information of basin water use (variant RS_Q_GW_NA) (Sect. S3). Then, optimal model parameters were identified using GA and NSGA-II for both variants. Figure 5a shows the calibration history of WGHM based on the best performance of GA among five runs for the variant RS. GA started from a KGE value with respect to TWSA near 0.60 and reached 0.87 after about 5000 functional evaluations (WGHM runs). Figure 5b–d illustrate the final Pareto front obtained by five runs of NSGA-II for the variant RS_Q_GW_NA. For the variant RS_Q_GW_NA after about 12 000 functional evaluations (for each NSGA-II run), NSGA-II found 18 optimal parameter sets. Figure 6 shows the parameter ranges (5 and 18 values for each parameter for variants RS and RS_Q_GW_NA, respectively) obtained by five different runs of GA and NSGA-II in RS and RS_Q_GW_NA variants. Then, an ensemble of WGHM simulations was generated for the variants RS and RS_Q_GW_NA which comprises the model runs with the optimal parameter sets.
Figure 7 compares the output of the calibrated model ensembles (variants RS and RS_Q_GW_NA) with observations and the output of the standard version of WGHM. The minimum and maximum value of each variable in each time period are shown as the uncertainty bound of the results in each variant. Standard WGHM underestimates total water storage decline in Lake Urmia basin between 2003 and 2013 as compared to GRACE observations. A good fit to GRACE results in calibration variant RS, due to (1) a stronger increase in human water abstractions over time as indicated by MODIS (Fig. S4), (2) an almost tripling of rooting depth and thus soil water capacity (P1), (3) an increased fraction of runoff that recharges the groundwater (P4–P6), (4) a higher maximum canopy storage everywhere in the basin (P7), and (5) an increase in maximum active lake depth of Lake Urmia from 5 m to more than 8 m in variant RS (P2) (Figs. 6a and 7a). With the larger soil and canopy water storage capacities, runoff and thus inflow into Lake Urmia decrease as compared to standard WGHM (Fig. 7b). Still, simulated inflows into Lake Urmia computed in variant RS are still much higher than the observed values (Fig. 7b) and seasonality of groundwater storage is totally misrepresented (Fig. 7c). The required reduction of computed lake inflow (Q) can be achieved in variant RS_Q_GW_NA by adjustment of the runoff coefficient and a slight further increase in maximum soil and canopy storage (Fig. 6), while the fit to GRACE TWSA remains good (Fig. 7a). However, the seasonality of groundwater storage could only be achieved by adjusting the sources of total net abstractions in variant RS_Q_GW_NA (Fig. 7c). NAg in the standard and RS variants is negative, which means that there is an artificial groundwater recharge due to irrigation by surface water during the summer irrigation months, leading to an increase in groundwater storage. Groundwater storage observations, however, show a decrease during this period, indicating that irrigation causes a net abstraction from groundwater. Therefore, annual values of NAg as computed by WGHM were multiplied, in variant RS_Q_GW_NA, by negative correction factors (Table S2).
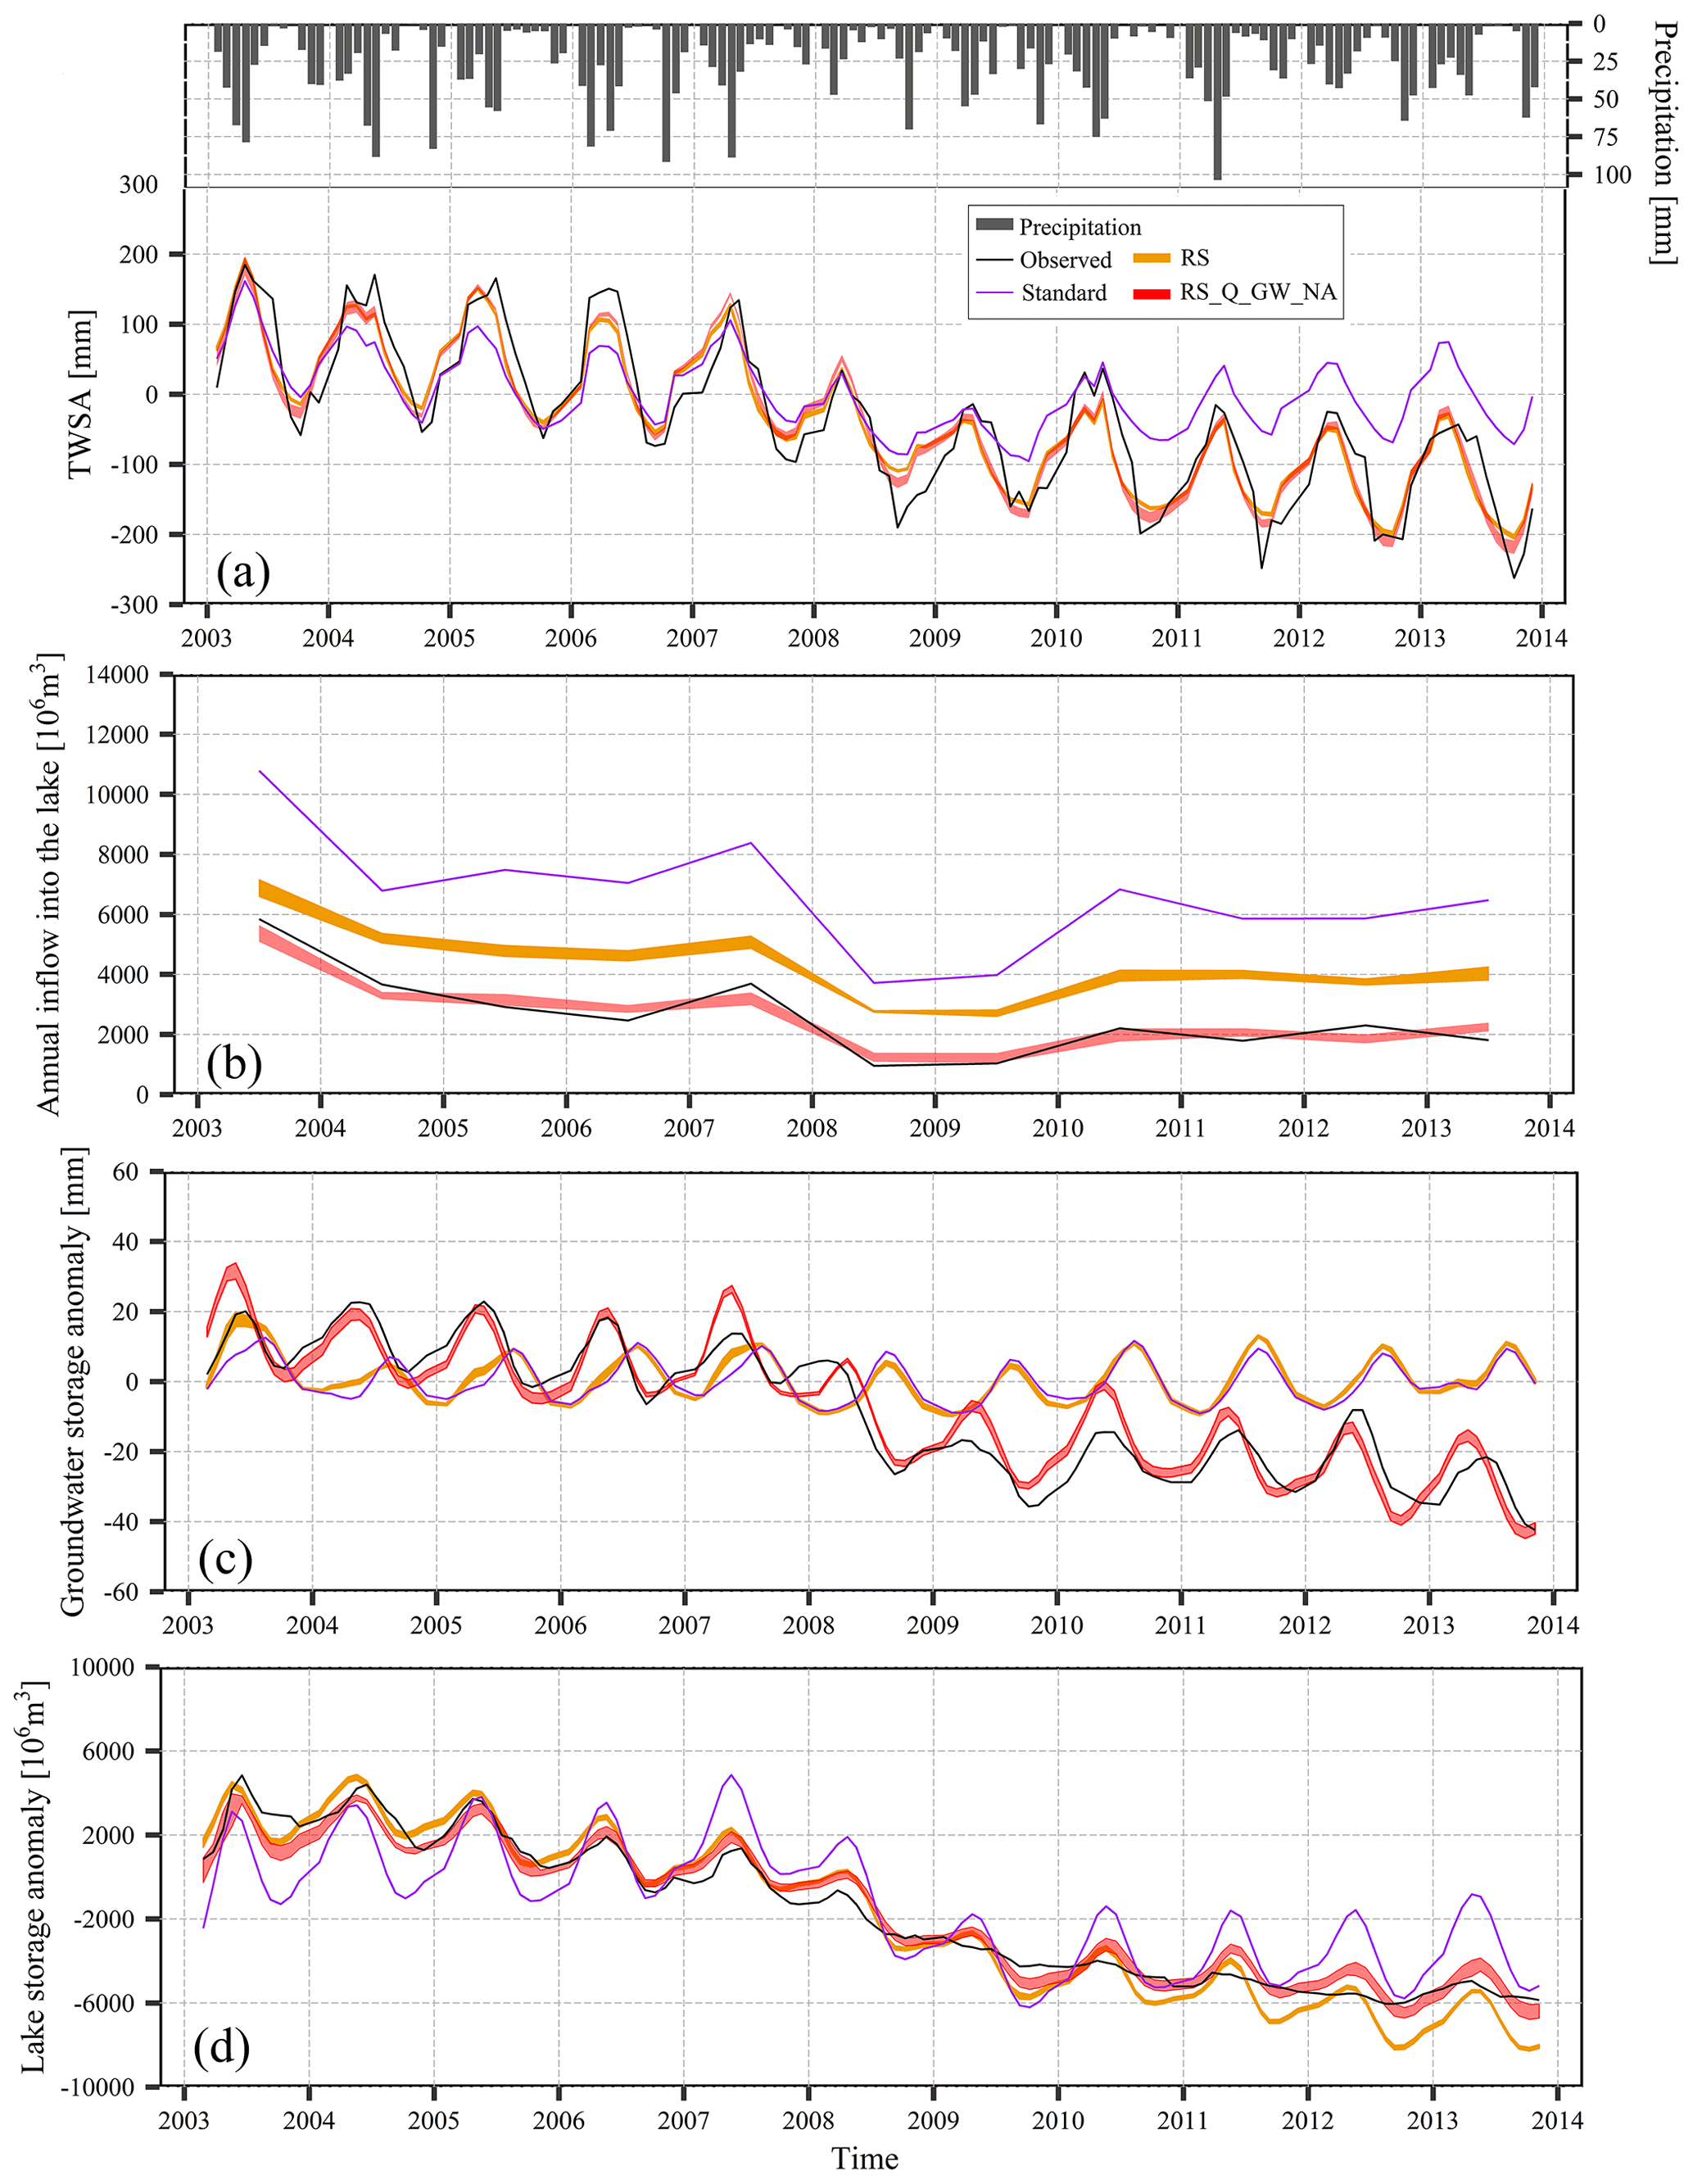
Figure 7Time series of monthly total water storage anomaly TWSA (a), annual lake inflow Q (b), monthly groundwater storage anomaly GWSA (c), and monthly lake volume anomaly (d), from observations, standard WGHM, and the two calibration variants RS and RS_Q_GW_NA.
Performance indicators CC, NSE, RMSE, RAE, and KGE with respect to monthly TWSA (Fig. 7a), annual Q (inflow to Lake Urmia, Fig. 7b) and monthly GWSA (Fig. 7c) are presented in Table 2 for the standard version and the ensemble means of the two calibration variants. Regarding the fit to TWSA observations, NSE increased from 0.48 in the standard version to 0.86 in the RS variant for which TWSA was the only observation considered and increased slightly to 0.88 when groundwater observations were taken into account in the RS_Q_GW_NA variant. This performance improvement is also reflected by CC, RMSE, RAE, and KGE. Although the performance of WGHM with respect to the observed lake inflow was improved in the RS variant, the variant does not yet provide reliable simulations of lake inflow. The calibration against inflow observations in variant RS_Q_GW_NA strongly improves inflow simulation, with NSE and KGE jumping from negative values for the standard variant to values of 0.93 and 0.82, respectively. The good performance shown by CC for all model variants indicates that all model variants correctly identify high- and low-flow years. In the case of GWSA, all performance indicators show that consideration of remote sensing data only does not lead to an acceptable simulation of groundwater storage. Only the variant for which groundwater observations were taken into account lead to satisfactory performance.
Table 2Performance of standard and calibrated WGHM variants with respect to observations of TWSA, inflow to lake, GWSA and lake volume anomaly.

For model performance evaluation, we compared the lake volume simulated by WGHM with the observed lake volume of Tourian et al. (2015) (Fig. 7d and Table 2). The standard model underestimates the decline in both lake water and TWSA, and both calibrated variants simulate the TWSA trend correctly, but variant RS overestimates the decline of lake water storage, thus compensating for not decreasing groundwater storage sufficiently (Fig. 7c) due to assuming a net groundwater recharge due to surface water irrigation. Only variant RS_Q_GW_NA simulates not only the groundwater dynamics but also the decline of lake water volume correctly. KGE for the monthly lake volume anomaly is 0.52 for the standard WGHM and improves to 0.75 for RS. Including groundwater level data further improved the fit to observed lake volume, leading to a very high KGE of 0.89 (Table 2). We conclude that the calibration of WGHM against diverse observations (that do not include lake volume observations) leads to improved simulation of lake volume dynamics.
3.2 Differential impacts of human water use and climate variation on Lake Urmia basin
The impact of human water use and man-made reservoirs on water flows and storages was quantified by comparing the output of WGHM in which human water use and man-made reservoirs are considered (this is normally done, now called WGHM-ANT) with the output of a model run for naturalized conditions, where it is assumed that there are no reservoirs and no human water use (WGHM-NAT). We determined that the results of the naturalized run for annual inflow into the lake differ by less than 2 % from a run with reservoirs but without human water use. Therefore, differences between WGHM-ANT and WGHM-NAT outputs can be considered to be caused by human water use. It should be mentioned that all simulated and observed storages (total, groundwater, lake) are not absolute values but anomalies with respect to the mean water storage during 2004–2009 (baseline period used for the provided GRACE data). Moreover, to quantify the uncertainty in the model calibrations, WGHM-ANT and WGHM-NAT were run based on all 18 optimal parameter sets that were obtained from Pareto front for variant RS_Q_GW_NA. All results were presented by min–max ranges.
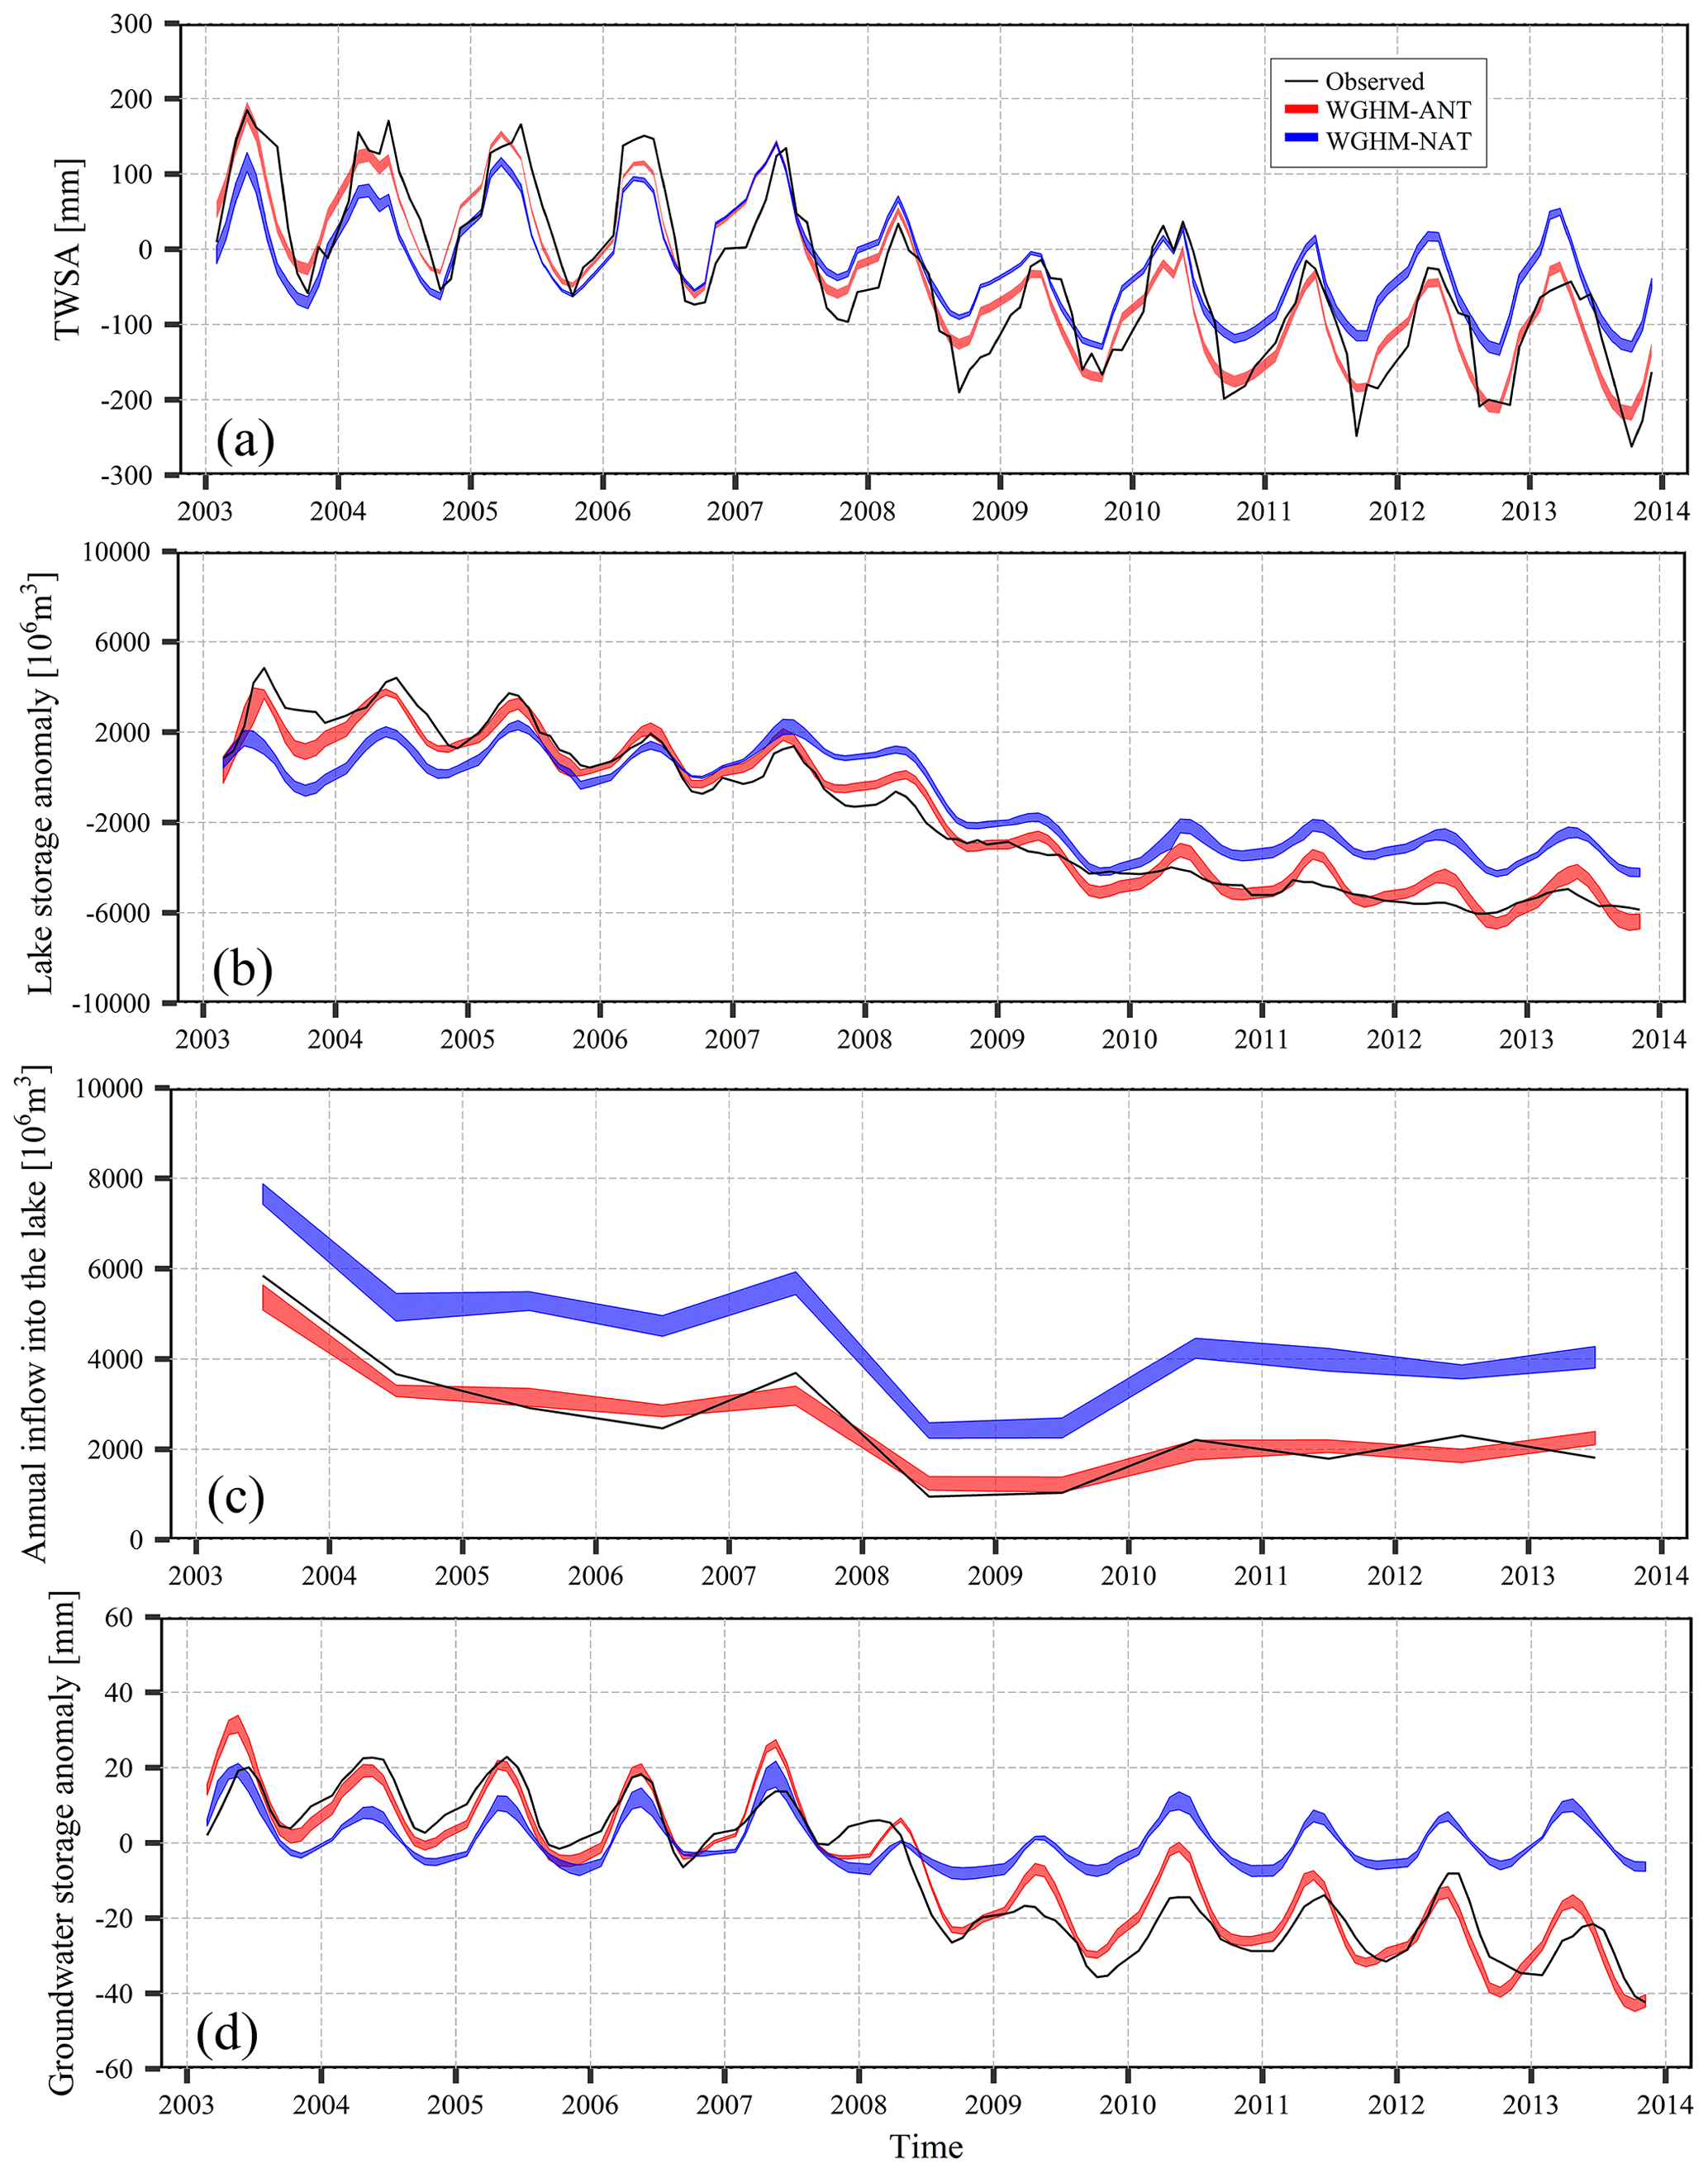
Figure 8Time series of simulated (variant RS_Q_GW_NA) and observed monthly TWSA (a), lake water storage anomaly (b), annual inflow into the lake Q (c), and monthly groundwater storage anomaly GWSA (d), under anthropogenic (WGHM-ANT) and naturalized (WGHM-NAT) conditions.
When comparing TWSA under anthropogenic and naturalized conditions in Fig. 8a, remember that TWSA in Lake Urmia basin is dominated by water storage in Lake Urmia. Seasonal TWSA variation of WGHM-ANT and WGHM-NAT do not differ much. Starting after the heavy rain in April 2007 and strongly caused by the lack of spring precipitation in 2008, both WGHM-ANT and WGHM-NAT (as well as GRACE TWSA) show a decreasing trend that is only somewhat more pronounced in WGHM-ANT (Fig. 8a). Thus, this decrease is mainly due to dry climate conditions during the well-known severe drought of 2008, with annual precipitation of only 241 mm, i.e., 74 % of the mean value for 2003–2013. Also in the absence of human water use, total water storage would not have recovered after 2009 but would have stayed 50–100 mm below the values occurring before 2008. However, while in WGHM-NAT the minimum storage in late summer, i.e., the period with high irrigation, remains almost at a constant level after 2009, and it decreases each year in WGHM-ANT due to consumptive increasing irrigation water use (see Fig. S4). The linear trends of WGHM-ANT and WGHM-NAT TWSA time series for the period 2003–2013 are between −23.6 and −25.1 mm yr−1 (GRACE: −24.4 mm yr−1) and between −10.1 and −11.9, respectively. The TWSA trend for two sub-periods before and after 2008, 2003–2007, and 2009–2013 was [−11.7, −18.5] and [−10.6, −16.3] mm yr−1, respectively, for WGHM-ANT and only [−1.8, 3.3] and [−2.9, −0.6] mm yr−1, respectively, for WGHM-NAT. The last-mentioned trends are not significant at the 95 % confidence level based on the Mann–Kendall test. According to WGHM, the basin lost, on average during 2003–2013, between 1226×106 and 1305×106 m3 water per year, while in the absence of human water use, it would have lost between 524×106 and 618×106 m3 water per year, i.e., 52 %–57 % less. Of this, total water volume between 914×106 and 975×106 m3 yr−1 of lake water was lost, while only 523×106 and 598×106 m3 yr−1 would have been lost without human water use (Fig. 8b).
The smaller decreasing trend for lake water volume under naturalized conditions is clearly caused by more inflow into the lake, even though lake evaporation is somewhat higher under naturalized inflow conditions due to the larger lake extent. While mean inflow during 2003–2013 is computed to be between 4323×106 and 4685×106 m3 yr−1 under naturalized conditions, it decreases by 39 %–45 % and reached between 2463×106 and 2742×106 m3 yr−1 under anthropogenically altered conditions (Fig. 8c). The difference is only 50 % of NA as only a fraction of (potential) net abstractions from surface water NAs (required to allow optimal irrigation) could be made (1) due to a lack of water availability in the surface water bodies and (2) because a fraction of NAg is provided a decrease in groundwater storage. Since 2008 the inflow into the lake has never reached 3085×106 m3 yr−1. This is the value estimated to be the minimum environmental water requirement that compensates the amount of annual evaporation from the lake surface (Abbaspour and Nazaridoust, 2007). Therefore, a decrease in lake water storage can be expected for the estimated inflow by WaterGAP between 2463×106 and 2742×106 m3 yr−1 during 2003–2013. In WGHM-NAT, the inflow was lower than 3085×106 m3 only in 2008 and 2009. Still, the average inflow into the lake from 2009 to 2013 of between 3528×106 and 3840×106 m3 yr−1 would have been only enough to keep the lake from further losing volume) needed to compensate for lake evaporation). Thus even in the WGHM-NAT, inflow into the lake would not have been enough for a recovery to conditions between 2003 and 2007 (Fig. 8b).
Groundwater storage is estimated to decline by between 239×106 and 267×106 m3 yr−1 during 2003–2013 in WGHM-ANT, and the decline is only between 24×106 and 35×106 m3 yr−1 in WGHM-NAT (Fig. 8d). Different from lake water storage, groundwater storage would have recovered after 2008–2009 if there had been no (increasing) net groundwater abstractions (Fig. 8d, compare Fig. S4b), even though mean groundwater recharge were between 2340×106 and 3103×106 m3 yr−1 during 2009–2013 as compared to between 3091×106 and 4179×106 m3 yr−1 during 2003–2007. To summarize, human water use was the reason for 52 %–57 % of the total water loss in the basin, for a maximum of 87 %–90 % of the groundwater loss and for 39 %–43 % of the Lake Urmia water loss during 2003–2013, and lake inflow was 39 %–45 % less than it would have been without human water use.
4.1 Model calibration
Global hydrological models suffer from high uncertainty, in particular as model inputs are uncertain. For example, climate input data are based on low-density climate observations and information on water use is often very scarce and outdated. For modeling at the global scale, it is generally not possible to obtain the same detailed data for a specific region compared to the case modeling this region only. Still, a global hydrological model includes all data for simulating water flows and storages in specific regions of interest everywhere on the globe, and model calibration against multiple (regional) observations is a means for improving the performance of the global model regionally. In this way, efficient simulation of regional water flows and storages can be achieved, possibly as an alternative to a costlier setup of a regional model. More importantly, the regional-scale multi-observation calibration done in this study can serve to inform efforts for global-scale but region-specific multi-observation calibration of global hydrological models that would allow the performance of global hydrological models to be strongly improved at the scale that they are made for (Döll et al., 2016).
Remote sensing data are the most accessible data for calibration of global hydrological models, including TWSA from GRACE. Therefore, the model variant RS only used globally available RS data, and MODIS and GRACE data products. However, MODIS data can only be used to determine the temporally variable extent of irrigated areas in dry regions of the globe such that the important adjustment of temporal dynamics of statistics-based irrigated areas is not possible everywhere. GRACE TWSA quantify the anomalies and changes of water storage aggregated over all land water storage compartments such as snow, soil, groundwater, lakes, wetlands, and rivers. Considering GRACE TWSA improved the simulation of the important water storage compartment of Lake Urmia. However, the unsatisfactory simulation of inflow into Lake Urmia and of groundwater dynamics clearly shows that a good fit to observed TWSA does not guarantee a good simulation of river flows or groundwater storage. Still, calibration against TWSA did, even if only very slightly, improve model performance, also with respect to lake inflow and groundwater dynamics.
To assess the value of using inflow into the lake (Q), groundwater (GW) observations and observed lake volume (LV) time series in model calibration, WGHM was calibrated manually based on some other variants, i.e., RS_Q, RS_LV, RS_Q_LV, and RS_Q_GW, in a step-wise fashion (not shown). Based on the results, by adding discharge data (RS_Q variant), the model was able to simulate TWSA and Q accurately without changing the inputs of the model and only based on modifying the parameters. Groundwater level data were found (variants RS_Q_GW and RS_Q_GW_NA) to be necessary to identify that, different from what is estimated by the standard version of WaterGAP, there is more irrigation with groundwater and less with surface water such that a net abstraction of groundwater and not artificial groundwater recharge occurs due to irrigation. Information on groundwater level dynamics with a suitable spatial density is not readily available for most regions of the globe. To simulate groundwater dynamics properly, it was not sufficient to adjust parameters of the hydrological model (in particular two groundwater recharge-related model parameters; Fig. 6b), but it was necessary to alter the fractions of net water abstractions that come from groundwater and surface water bodies. Only then was groundwater storage decline by net groundwater abstraction simulated, and lake water storage decline could be correctly simulated instead of being overestimated when only TWSA and lake inflow data are used for calibration. As in the case of adding lake inflow as calibration data type, no trade-off between the fits to the different data types occurred.
Table 3Water loss in the storage compartments of Lake Urmia basin between 2003 and 2013 as observed and simulated by the WGHM variants that were calibrated using different observation variables.
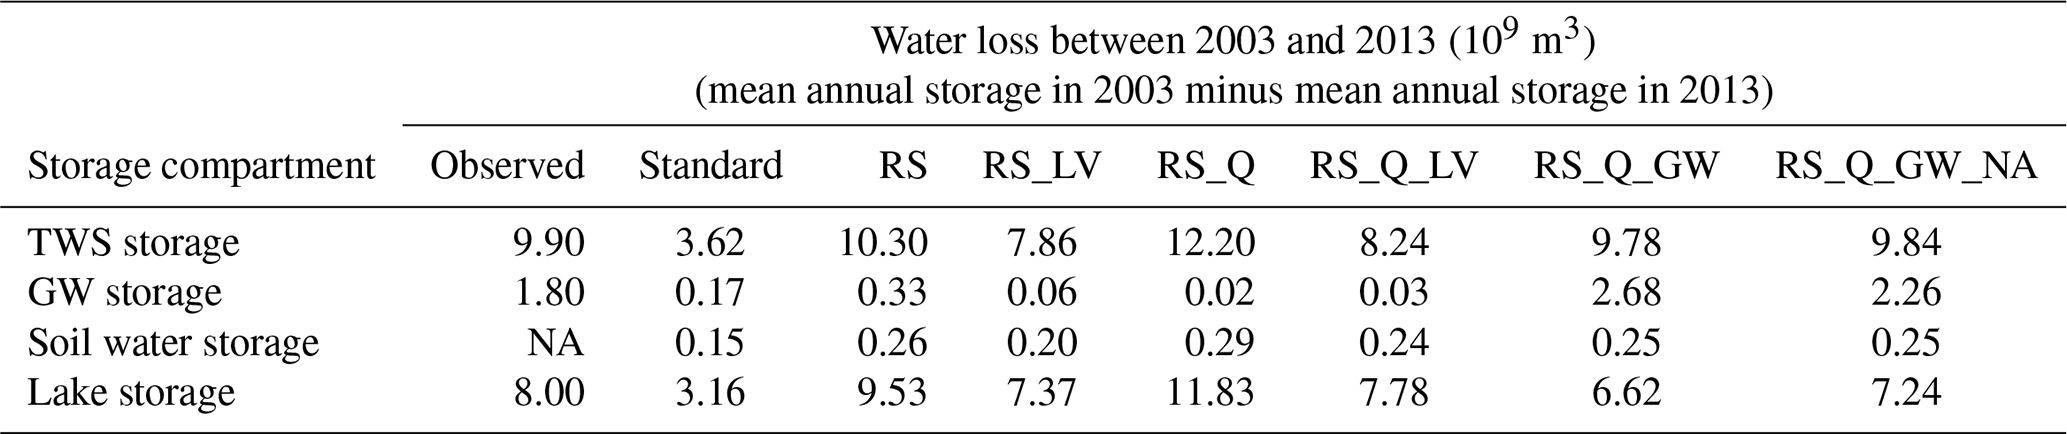
NA stands for not available.
Consideration of regional estimates of human water withdrawals in a specific year as well as regional estimates of return flow fractions in variant RS_Q_GW_NA does not improve the fit to observations compared to variant RS_W_GW significantly and only leads to slight parameter adjustments. This indicates a reasonable simulation of per hectare water consumption for irrigation by the WaterGAP model. To summarize, consideration of more and more observations and other independent data results in improved fits to three types of observations (TWSA, lake inflow, and groundwater dynamics), while at the same time more parameters need to be adjusted (Tables 1 and 2 and Fig. 6). No trade-offs between the fits to the three observational data types occurred in the case of Lake Urmia basin.
While the introduction of annually varying corrections for NAg and NAs (Table S2) for variant RS_Q_GW_NA leads to the best fit to multiple observation types, it may be preferable to have just 1 instead of 11 free parameters, i.e., a temporally constant β. With a temporally constant β of −0.5, the fit to TWSA and inflow to the lake does not change at all, and groundwater storage is only slightly increased in the dry years 2008 and 2009. Thus, given the uncertainty of observed groundwater storage variations, a temporally constant NAg correction factor is sufficient for achieving a good fit for all observations.
In the RS_LV variant, simulation of TWSA and GWSA did not change appreciably but both simulated lake volume anomaly and lake inflow greatly improved as compared to the RS variant. NSE for monthly lake volume anomaly and annual lake inflow reach 0.95 and 0.44, respectively. Inflow into the lake is much less overestimated than in variant RS. To achieve these fits, the variant RS parameters were adjusted: the rooting depth multiplier was set to 2.5 and the potential evaporation multiplier was set to 2. Adding lake volume observations on top of lake inflow observations in RS_Q_LV variant leads to an improved fit to lake volume observations, with NSE increasing from 0.81 to 0.95, but the fit of observed inflow into the lake slightly worsens from 0.88 in RS_Q to 0.85 in RS_Q_LV. In this variant, the RS_Q variant parameters were used, except the maximum active lake depth was set to 9 m and the potential evaporation multiplier to 2. We conclude that in the case of the end lake, Lake Urmia, calibration against time series of lake volume anomalies could, in the absence of inflow data, help to improve the simulation of inflow, while calibration against time series of inflow could, in the absence of lake volume observation, improve the simulation of lake volume anomalies. Still, calibration to both observational data types leads to the best simulation of both annual lake inflow and lake volume anomalies. However, the groundwater storage dynamics could not be improved without calibration against groundwater level dynamics.
In many hydrological model calibrations, trends are not used as performance criterion. We found that model variants obtained by calibration without a trend criterion, and which have a very similar performance criterion, do not necessarily lead to similar estimates of total and compartmental water losses over the whole time period 2003–2013. For example, using variants RS_LV and RS_Q with similar NSE with respect to monthly time series of TWS, TWS loss between 2003 and 2013 is simulated to be 7.86×10⁹ and 12.20×10⁹ m3, respectively (Table 3). TWS loss according to variant RS_Q_GW_NA (based on ensemble mean) is 9.84×10⁹ m3, even though NSE is only 0.04 higher, while modified KGE (Eq. 5) for RS_LV, RS_Q, and RS_Q_GW_NA is 0.68, 0.71, and 0.86, respectively. We conclude that in the case of relevant trends, the calibration criteria should include the minimization of the difference between observed and simulated trends.
Based on satellite-derived TWSA and lake level observations, total water storage in Lake Urmia basin declined by 9.9×10⁹ m3 from its annual average in 2003 to its annual average in 2013 and about 80 % was due to the loss of lake water (Tourian et al., 2015). The observed decline of groundwater storage was 1.8×10⁹ m3, i.e., 18 % of the observed total water storage loss in the basin. WGHM overestimates observed loss from groundwater in both calibrations variants that take into account groundwater observations. In WGHM simulations, groundwater decline and depletion below the level of surface water storages occur in only 7 out of the 22 0.5∘ grid cells within the basin (Fig. S5a). In 5 of these 7 grid cells, groundwater levels were stable during 2003–2007 and only declined from 2008 to 2013, caused by increased NAg and decreased groundwater recharge in the latter part of the study period. It is these 7 cells that cause the basin groundwater decline under the anthropogenic conditions shown in Fig. 8d. For naturalized conditions, peak seasonal water storages decrease somewhat but minimum water storages cannot drop appreciably given the already very low minimum seasonal storage values during the relatively wet five first years of the investigate period (Fig. S5b), because WaterGAP cannot simulate a possible drop of the groundwater table below the surface water level in the absence of groundwater abstractions. Thus, the contribution of human water use to groundwater storage decline might be overestimated because (1) groundwater storage decline under the impact of human water use is overestimated (Table 3, variant RS_Q_GW_NA) as compared to observations and (2) groundwater storage decline under naturalized conditions without human water use may be underestimated.
It is worth mentioning that WGHM as a hydrological model that does not include a gradient-based groundwater model has some limitations for studying groundwater-lake water flows. We attempted to calibrate WGHM under the assumption that there are direct water flows between lake and groundwater. Under this assumption, the seasonality of the groundwater storage was strongly misrepresented. Therefore, as accepted by ULRP (2015b), we assumed there is no direct flow between the lake and groundwater. This is consistent with Danesh-Yazdi and Ataie-Ashtiani (2019) who stated that a significant water exchange between the lake and groundwater is unlikely. Also, Amiri et al. (2016), based on isotope and chemical tracer analyses, rejected any significant relationship between the lake and groundwater. However, some studies, e.g., Ashraf et al. (2017) and Vaheddoost and Aksoy (2018), stated the opposite. In conclusion, the results of this study support the idea that there are no significant direct interactions between lake and groundwater in Lake Urmia basin.
4.2 Distinguishing the contributions of human water use and climate variability to lake shrinkage
In order to design the Lake Urmia restoration program, it is vital to know which factors contribute how much to the shrinkage of the lake. All previous studies (e.g., Hassanzadeh et al., 2012; AghaKouchak et al., 2015; Alizade Govarchin Ghale et al., 2018; Chaudhari et al., 2018; Farokhnia et al., 2018) agreed that shrinkage is caused by both climate variations and human activities, but there is no consensus about the relative contributions. For example, Chaudhari et al. (2018) concluded that human-induced changes accounted for 86 % of the lake volume decline during 1995–2010, while we determined values of 39 %–43 % for 2003–2013. In line with our results, Farokhnia et al. (2018) showed that due to high climate variability in Lake Urmia basin during 1999–2009, the climate was the dominant factor in lake volume loss, causing 58 % of observed loss. According to our study, human water use was the reason for 39 %–45 % of the inflow reduction into the lake during 2003–2013, which is very similar to the values of Shadkam et al. (2016) for the years 2003–2009 (see their Fig. 8). Discrepancies are likely due to different analysis methods, but different analysis periods and conceptualizations make a direct comparison of the estimated contributions difficult. Chaudhari et al. (2018) performed a comprehensive hydrological modeling of Lake Urmia basin. They also studied the land use changes in detail over 1987–2016 and determined a ∼98 % and ∼180 % increase in agricultural lands and urban areas, respectively. However, their uncalibrated global hydrological model that represented the basin by 5–6 cells only was not able to simulate the flows and storages in the basin well. For example, simulated annual inflow into the lake was estimated to be 3700×106 m3 in 2003 (their Fig. 8) while observed inflow was much higher, 5835×106 m3. In 2009, observed inflow, with 1036×106 m3, was only half of the simulated one. Therefore, the very high human contribution to the lake volume decline of 86 % determined by Chaudhari et al. (2018) may arise from the poor performance of the uncalibrated model. In addition, Chaudhari et al. (2018) studied a considerably longer period, i.e., 1995–2010, that includes the change point of lake dynamic (the year 2000 based on Khazaei et al., 2019 and 2001, based on Fazel et al., 2017). Although including years prior to 2000 might be lead to different results, some other studies like Shadkam et al. (2016) and Farokhnia et al. (2018), whose modeling included years 2000 and 2001, support the results of the current study. Shadkam et al. (2016) stated that climate change was responsible for three-fifths of the inflow reduction into the lake, and the rest was caused by water resources development between 1995 and 2010. Also, Farokhnia et al. (2018) showed that during a 22-year period ending in 2009, the effect of anthropogenic and climatic factors in reducing the inflow into Lake Urmia was almost equal.
While Alizade Govarchin Ghale et al. (2018) seem to support the results of Chaudhari et al. (2018), who state that 80 % of drying of Lake Urmia is due to anthropogenic impacts during 1998–2010, their statistical analysis assumes that lake inflow from rivers can be considered to reflect “anthropogenic impacts” while precipitation and evaporation reflect climatic variation. However, although inflow into the lake is surely affected by human water use upstream, it is also affected by climatic variations over the basin. Using a statistical change point analysis and without modeling, Khazaei et al. (2019) stated that given the stable conditions of precipitation and temperature, climatic variations could not explain the dramatic decline of the lake level. They also estimated the change of vegetation dynamics and its associated hydrological loss in terms of evapotranspiration. They used monthly GPCP precipitation data for assessing the trend of precipitation over the basin. However, the proportion of shared variance between GPCP and in situ data over the basin is about 0.75 on a monthly scale (see Table 2 in Jalili et al., 2012). Therefore, their analysis suffers from the poor quality of precipitation data. Moreover, their analysis was done on a monthly scale that cannot capture the sub-monthly variability of climatic variables. Also, they did not account for the role of groundwater dynamics in their analysis. Based on an analysis of the Standardized Precipitation Index (SPI), a drought index, AghaKouchak et al. (2015) reported there was no significant trend in droughts over the basin during the past three decades and concluded from this that human activities and not climatic variations were the main reason for lake shrinkage. Different from our study and the modeling studies of Shadkam et al. (2016), Farokhnia et al. (2018), and Chaudhari et al. (2018), the studies by Alizade Govarchin Ghale et al. (2018), Khazaei et al. (2019), and AghaKouchak et al. (2015) considered only the dynamics of monthly and annual precipitation and neglect changes in the variability of daily precipitation. During the last three decades, there was a significant increase in the frequency of daily precipitation of less than 5 mm and a significant decrease in the frequency of daily precipitation of 10–15 mm, suggesting a runoff reduction even in the case of constant annual precipitation (Fig. 2 in Bavil et al., 2018). Hosseini-Moghari et al. (2018) showed that an increasing frequency of days with less than 5 mm precipitation in combination with decreasing monthly precipitation has led to the observed reduced inflow into two dams in Lake Urmia basin that are located downstream of areas with insignificant human water use. We conclude that for assessing the effect of climatic variability on hydroclimatic variables, the analyses should be done on a daily timescale or shorter to consider the change in amount and patterns of variables. Moreover, we examined the ratio of annual inflow into the lake (based on the ensemble mean) over annual precipitation during the study period. This ratio reached maximum values in 2003 (0.29 and 0.41 for the anthropogenic and naturalized conditions, respectively) and minimum values in 2009 (0.07 and 0.15). Averaged over the period 2009–2013, these ratios are, with 0.11 (ANT) and 0.22 (NAT), much smaller than the values for 2003–2007, 0.20 and 0.32. Thus, the drought year 2008 as well as the relatively small ratio of inflow into the lake over precipitation in the last 5 years of the study period play a significant role in the decline of inflow and lake water storage.
For quantifying human and climatic contributions to observed hydrological changes, a comprehensive modeling approach that takes into account, for example, the impacts of changing temperatures and land use change (e.g., urbanization and cropland expansion) on runoff generation and thus river inflow and on evaporation of the lake itself is preferable to statistical analyses such as trend and correlation analysis. Such statistical analyses may be misleading about reasons for certain temporal changes. For example, when there is no trend in precipitation but a significant trend in streamflow, it may be concluded that human activities are the dominant cause of streamflow reduction; most of the trend studies for Lake Urmia suffer from such a hasty conclusion. In hydrological modeling, more detailed information such as the depth of precipitation in each event, the interval between rainfall events (represented in soil moisture) and other involved elements to generate runoff are considered. All modeling studies (except Chaudhari et al., 2018, who used an uncalibrated model), i.e., Shadkam et al. (2016), Farokhnia et al. (2018), and our study, found that the impact of climatic variations could not be ignored over the basin, while trend and correlation analysis studies such as Khazaei et al. (2019) and Alizade Govarchin Ghale et al. (2018) stated the climate contribution is negligible compared to anthropogenic impacts. We suggest to do trend analysis of daily precipitation distinguishing different intensity classes (e.g., Bavil et al., 2018).
As a final word, the irrigated area used in this study obtained from the official report of ULRP (Kamali and Youneszadeh Jalili, 2015). However, Chaudhari et al. (2018) estimated the irrigated area significantly less than the irrigated area used in the current study (Fig. S3 compared to Fig. 9 in their study). They used September for estimation of the irrigated area while the crops are completely matured in July and August in the basin. As a result, some crops are harvested in September. Therefore, it could be the main reason for such a significant underestimation of irrigated areas in the basin by Chaudhari et al. (2018). Also, Alizade Govarchin Ghale et al. (2019) estimated the irrigated area in the basin. Although their result is much closer to Kamali and Youneszadeh Jalili (2015) relative to Chaudhari et al. (2018), they used April and August for the estimated irrigated area, while Kamali and Youneszadeh Jalili (2015) used July and August that lead to some differences. Also, the month of April that was used by Alizade Govarchin Ghale et al. (2019) includes both irrigated and rainfed farms, and the distinction between irrigated and rainfed cultivation may also make some differences. However, due to the fact that Kamali and Youneszadeh Jalili (2015)'s report was approved by the ULRP, we believe that the use of the official report from ULRP would be more reliable than other sources. However, the data reported by Kamali and Youneszadeh Jalili (2015) surely suffer some uncertainties that are inevitable.
4.3 Limitations
Even after multi-objective calibration of a state-of-the-art comprehensive hydrological model, there remain many uncertainties that affect the accuracy of the model results. Like the results of all hydrological models, our results are affected by uncertainties in model input, model parameters, and model structure. Model parameter uncertainty was reduced by the comprehensive multi-observation calibration, albeit conditioned on just one climate input data set and using just one model (instead of the state-of-the-art multi-model ensemble approach; compare https://www.isimip.org/, last access: 11 May 2019). Given the low spatial model resolution (0.5∘ × 0.5∘), the model results are preferably aggregated to the basin as a whole, as results for individual grid cells are very uncertain. Also due to a lack of data at the basin scale, the hydrogeology of the basin was not taken into account in the model. Information on the irrigated area in each grid cell was taken from a global data set of areas equipped for irrigation from groundwater and surface water (Siebert et al., 2010), which was adopted in this study by scaling it by basin-wide correction factors to better capture the temporal development of irrigation. Calibrated modeling results are also affected by the uncertainties of the observation data. GRACE TWSA data are more reliable for larger (100 000 km2 according to Landerer and Swenson, 2012) areas than the basin area of 52 000 km2. Estimation of groundwater storage changes based on water level data for unevenly distributed wells is rather uncertain due to the unknown heterogeneities in the subsurface and uncertain specific yields. The “observed” lake water volume decline likely underestimates the actual decline, as a constant bathymetry was assumed when deriving lake water volume decline from remote sensing of lake water level elevation and lake water area (Tourian et al., 2015). However, there was an increase in the elevation of the lake bottom due to sedimentation and salt precipitation (Shadkam et al., 2016; Sima and Tajrishy, 2013; Karimi et al., 2016).
We determined that the results of the naturalized run with and without reservoirs for annual inflow into the lake differ by less than 2 %, whereas Fazel et al. (2017) and Alizade Govarchin Ghale et al. (2018) stated that dams have a significant impact on the lake shrinkage. However, Shadkam et al. (2016) showed the role of dams in the reduction of inflow into the lake did not exceed 5 % due to evaporation from reservoirs. Moreover, in this study, the inflow into the lake was assessed on an annual scale, and there is no correlation between the dams' operation and annual inflow in the basin (Fathian et al., 2014). Therefore, the error from this source to our result should be negligible. Also, in this study, it is assumed that there is no significant direct relationship between the lake and groundwater. However, the hydrologic connectivity between the lake and groundwater remains an under-studied aspect of the lake dynamics (Danesh-Yazdi and Ataie-Ashtiani, 2019). Finally, the study period 2003–2013 does not include some of the years with significant changes in the dynamics of the lake and the basin (i.e., years 2000 and 2001 that identified as the change point of the lake by Khazaei et al., 2019, and Fazel et al., 2017, respectively) due to data availability. Therefore, our results cannot be generalized to previous decades.
This study investigated the differential impact of human water use and climate variations on total, groundwater, and lake water storage in Lake Urmia basin as well as on inflow into the lake during 2003–2013. This was done by utilizing the information contained in multiple types of observation data to calibrate, specifically for Lake Urmia basin, the global hydrological model WGHM, which takes into account the impact of human water use and man-made reservoirs on flows and storages. Observations include remote sensing data (for irrigated area, TWSA, and lake volume), in situ streamflow observations (for of lake inflow), groundwater well data (for deriving groundwater storage anomalies), and statistical data on water use in the basin. A time series of observed lake volume was used for evaluation. Using the ensemble of best-performing models where all available observations were used for model calibration, the impact of human water use was determined by comparing the output of a naturalized run, with human water use assumed to be zero, with the runs with the historical water use. To understand the value of different observational data types for calibration, WGHM was calibrated in six variants (two auto-calibrated and four manually calibrated) to different combinations of observational data types.
We found that the time series for water demand by irrigation, as assumed in the standard WGHM version, had to be adjusted using MODIS data such that the modification of seven model parameters could result in a good fit to observed GRACE TWSA. Consideration of these remote sensing data somewhat improved the dynamics of both inflow into Lake Urmia and lake water storage, but lake inflow was still overestimated by 66 % and the seasonality of groundwater storage was strongly shifted. Additional calibration against observed inflow into the lake did not affect TWSA simulation and slightly improved the simulation of the lake water storage anomaly. Only by using monthly time series of mean groundwater level variations in the basins for calibration, we could adjust the fractions of human water use taken from groundwater and surface water such that seasonality of groundwater storage was simulated correctly. Only then was it possible to simulate the observed groundwater loss, and loss of lake volume was no longer overestimated. Statistical information on sectoral water withdrawals in the basin for 1 year as well as estimates for sectoral return flow fractions further improved the model, but only slightly. We recommend including, in the case of relevant trends in observations, the difference between observed and simulated trends as one of the calibration criteria, not only differences between time series of daily, monthly, or annual values.
The calibration exercise showed that the calibration variant for which the highest number of observational data types were used, WGHM variant RS_Q_GW_NA, showed the best fit to all observations. Certainly, no general conclusions on the worth of specific observation data types for model calibration, including trade-offs among fits to multiple data types, can be derived from this study. Lake Urmia basin is unusual due to (1) draining into a large end lake that dominates TWSA, (2) the strong impact of human water use and (3) the fact that the standard WGHM version estimates a net recharge to the groundwater due to surface water irrigation, which had to be corrected to a net abstraction. In basins with large lakes, and in particular with end lakes, remotely sensed time series on lake area and the elevation of the lake water level should be used to estimate time series of lake water storage as these observational data can be expected to be of high value for understanding the freshwater system using hydrological model calibration. Groundwater storage cannot be observed from space but relies on in situ observations on groundwater heads in wells but, as in the case of Lake Urmia basin, such data can be crucial for a correct understanding of the freshwater system.
Based on the good fit of WGHM variant RS_Q_GW_NA to four types of observational data, we found that human water use reduced lake inflow that would have occurred without human water use during 2003–2013 by about 39 %–45 %. About 52 %–57 % of the total water storage loss in Lake Urmia basin and only 39 %–43 % of lake water loss during this time period was due to human water use, and 43 %–48 % and 57 %–61 %, respectively, was due to climate variations. 87 %–90 % of groundwater storage loss is estimated to be caused by human water use but this value may be somewhat overestimated by WGHM because climate-driven loss under naturalized conditions may be underestimated due to the simplified representation of groundwater–surface-water exchanges in the model.
GRACE TWSA data indicate an increasing trend in water storage in the basin during 2014–2017 due to both less water use due to water management (ULRP, 2015c) and the wet years 2015–2016. This trend is about half as strong as the decreasing trend during 2003–2013. Further strengthening of efforts for decreasing human water use in the basin should be undertaken, while at the same time there should be global-scale mitigation of climate change by reducing greenhouse gas emissions to prevent strong decreases in precipitation and runoff. Our study has shown that the management of Lake Urmia basin should be based on a comprehensive assessment of all water storages and flows in the basin, including human water uses of groundwater and surface water. We recommend refining the estimated net abstractions from surface water and groundwater by a basin-wide spatially explicit quantification not only of water abstractions but also return flows to groundwater and surface water.
In situ data from “Iran Water Resources Management Company” including groundwater levels, precipitation, and temperature are available upon request from the corresponding author. All other data are available in the Supplement. Also, GRACE data are available through http://www2.csr.utexas.edu/grace/RL05_mascons.html (last access: 17 July 2018) (Save et al., 2016). Lake water surface extents and water levels are available at http://hydrosat.gis.uni-stuttgart.de/php/index.php (last access: 17 July 2018) (Tourian et al., 2015). All simulation results are available from the corresponding author.
The supplement related to this article is available online at: https://doi.org/10.5194/hess-24-1939-2020-supplement.
SMHM and PD designed the study. SMHM performed the modeling and writing. SA, MJT, and KE contributed to editing the paper. PD contributed to result analysis and editing the paper. SMHM and PD were mainly responsible for writing the paper.
The authors declare that they have no conflict of interest.
The authors are grateful to Urmia Lake Restoration Program and Iran Water Resources Management Company for providing in situ data. They also acknowledge the Center for Space Research (CSR) and Potsdam Institute for Climate Impact Research that provided GRACE data and global climate data, respectively. The authors graciously acknowledge Felix T. Portmann and Hannes Müller Schmied from Goethe University Frankfurt for their valuable contributions throughout the WaterGAP calibration and thank the editor and reviewers for their comments and suggestions that helped to improve the paper.
This paper was edited by Thom Bogaard and reviewed by three anonymous referees.
Abbaspour, M. and Nazaridoust, A.: Determination of environmental water requirements of Lake Urmia, Iran: an ecological approach, Int. J. Environ. Stud., 64, 161–169, https://doi.org/10.1080/00207230701238416, 2007.
AghaKouchak, A., Norouzi, H., Madani, K., Mirchi, A., Azarderakhsh, M., Nazemi, A., Nasrollahi, N., Farahmand, A., Mehran, A., and Hasanzadeh, E.: Aral Sea syndrome desiccates Lake Urmia: Call for action, J. Great Lakes Res., 41, 307–311, https://doi.org/10.1016/j.jglr.2014.12.007, 2015.
Ahmadzadeh, H., Morid, S., Delavar, M., and Srinivasan, R.: Using the SWAT model to assess the impacts of changing irrigation from surface to pressurized systems on water productivity and water saving in the Zarrineh Rud catchment, Agr. Water Manage., 175, 15–28, https://doi.org/10.1016/j.agwat.2015.10.026, 2016.
Alborzi, A., Mirchi, A., Moftakhari, H., Mallakpour, I., Alian, S., Nazemi, A., Hassanzadeh, E., Mazdiyasni, O., Ashraf, S., Madani, K., Norouzi, H., Azarderakhsh, M., Mehran, A., Sadegh, M., Castelletti, A., and AghaKouchak, A.: Climate-informed environmental inflows to revive a drying lake facing meteorological and anthropogenic droughts, Environ. Res. Lett., 13, 084010, https://doi.org/10.1088/1748-9326/aad246, 2018.
Alizade Govarchin Ghale, Y., Altunkaynak, A., and Unal, A.: Investigation Anthropogenic Impacts and Climate Factors on Drying up of Urmia Lake using Water Budget and Drought Analysis, Water Resour. Manage., 32, 325–337, https://doi.org/10.1007/s11269-017-1812-5, 2018.
Alizade Govarchin Ghale, Y., Baykara, M., and Unal, A.: Investigating the interaction between agricultural lands and Urmia Lake ecosystem using remote sensing techniques and hydro-climatic data analysis, Agr. Water Manage., 221, 566–579, https://doi.org/10.1016/j.agwat.2019.05.028, 2019.
Alizadeh-Choobari, O., Ahmadi-Givi, F., Mirzaei, N., and Owlad, E.: Climate change and anthropogenic impacts on the rapid shrinkage of Lake Urmia, Int. J. Climatol., 36, 4276–4286, https://doi.org/10.1002/joc.4630, 2016.
Amiri, V., Nakhaei, M., Lak, R., and Kholghi, M.: Geophysical, isotopic, and hydrogeochemical tools to identify potential impacts on coastal groundwater resources from Urmia hypersaline Lake, NW Iran, Environ. Sci. Poll. Res., 23, 16738–16760, https://doi.org/10.1007/s11356-016-6859-y, 2016.
Ashraf, B., AghaKouchak, A., Alizadeh, A., Baygi, M. M., Moftakhari, H. R., Mirchi, A., and Madani, K.: Quantifying anthropogenic stress on groundwater resources, Scient. Rep., 7, 12910, https://doi.org/10.1038/s41598-017-12877-4, 2017.
Azarnivand, A. and Banihabib, M. E.: A Multi-level Strategic Group Decision Making for Understanding and Analysis of Sustainable Watershed Planning in Response to Environmental Perplexities, Group Decis. Negotiat., 26, 629–648, https://doi.org/10.1007/s10726-016-9484-8, 2017.
Azarnivand, A., Camporese, M., Alaghmand, S., and Daly, E.: Simulated response of an intermittent stream to rainfall frequency patterns, Hydrol. Process., 34, 615–632, https://doi.org/10.1002/hyp.13610, 2020.
Banihabib, M. E., Azarnivand, A., and Peralta, R. C.: A new framework for strategic planning to stabilize a shrinking lake, Lake Reserv. Manage., 31, 31–43, https://doi.org/10.1080/10402381.2014.987409, 2015.
Bavil, S. S., Zeinalzadeh, K., and Hessari, B.: The changes in the frequency of daily precipitation in Urmia Lake basin, Iran, Theor. Appl. Climatol., 133, 205–214, https://doi.org/10.1007/s00704-017-2177-7, 2018.
Beven, K. and Freer, J.: Equifinality, data assimilation, and uncertainty estimation in mechanistic modelling of complex environmental systems using the GLUE methodology, J. Hydrol., 249, 11–29, https://doi.org/10.1016/S0022-1694(01)00421-8, 2001.
Boroughani, M., Hashemi, H., Hosseini, S. H., Pourhashemi, S., and Berndtsson, R.: Desiccating Lake Urmia: A New Dust Source of Regional Importance, IEEE Geosci. Remote Sens. Lett., https://doi.org/10.1109/LGRS.2019.2949132, in press, 2019.
Chaudhari, S., Felfelani, F., Shin, S., and Pokhrel, Y.: Climate and anthropogenic contributions to the desiccation of the second largest saline lake in the twentieth century, J. Hydrol., 560, 342–353, https://doi.org/10.1016/j.jhydrol.2018.03.034, 2018.
Danesh-Yazdi, M. and Ataie-Ashtiani, B.: Lake Urmia Crisis and Restoration Plan: Planning without Appropriate Data and Model Is Gambling, J. Hydrol., 576, 639–651, https://doi.org/10.1016/j.jhydrol.2019.06.068, 2019.
Deb, K., Pratap, A., Agarwal, S., and Meyarivan, T. A. M. T.: A fast and elitist multiobjective genetic algorithm: NSGA-II, IEEE T. Evol. Comput., 6, 182–197, https://doi.org/10.1109/4235.996017, 2002.
Delju, A. H., Ceylan, A., Piguet, E., and Rebetez, M.: Observed climate variability and change in Urmia Lake Basin, Iran, Theor. Appl. Climatol., 111, 285–296, https://doi.org/10.1007/s00704-012-0651-9, 2012.
Döll, P., Kaspar, F., and Lehner, B.: A global hydrological model for deriving water availability indicators: model tuning and validation, J. Hydrol., 270, 105–134, https://doi.org/10.1016/S0022-1694(02)00283-4, 2003.
Döll, P., Hoffmann-Dobrev, H., Portmann, F. T., Siebert, S., Eicker, A., Rodell, M., Strassberg, G., and Scanlon, B. R.: Impact of water withdrawals from groundwater and surface water on continental water storage variations, J. Geodynam., 59, 143–156, https://doi.org/10.1016/j.jog.2011.05.001, 2012.
Döll, P., Douville, H., Güntner, A., Müller Schmied, H., and Wada, Y.: Modelling freshwater resources at the global scale: Challenges and prospects, Surv. Geophys., 37, 195–221, https://doi.org/10.1007/s10712-015-9343-1, 2016.
Eimanifar, A. and Mohebbi, F.: Urmia Lake (northwest Iran): a brief review, Saline Syst., 3, 5, https://doi.org/10.1186/1746-1448-3-5, 2007.
Farajzadeh, J., Fakheri Fard, A., and Lotfi, S.: Modeling of monthly rainfall and runoff of Urmia lake basin using “feed-forward neural network” and “time series analysis” model, Water Resour. Indust., 7–8, 38–48, https://doi.org/10.1016/j.wri.2014.10.003, 2014.
Farokhnia, A., Morid, S., Abbaspour, K., and Delavar, M.: Development of SWAT-LU model for simulation of Urmia lake water level decrease and assessment of the proposed actions for its restoration; (role of anthropogenic and climatic factors on hydrological change of the basin and lake), Iran. J. Irrig. Drain., 12, 1041–1058, 2018.
Fathian, F., Morid, S., and Kahya, E.: Identification of trends in hydrological and climatic variables in Urmia Lake basin, Iran, Theor. Appl. Climatol., 119, 443–464, https://doi.org/10.1007/s00704-014-1120-4, 2014.
Fazel, N., Torabi Haghighi, A., and Kløve, B.: Analysis of land use and climate change impacts by comparing river flow records for headwaters and lowland reaches, Global Planet. Change, 158, 47–56, https://doi.org/10.1016/j.gloplacha.2017.09.014, 2017.
Forootan, E., Rietbroek, R., Kusche, J., Sharifi, M. A., Awange, J. L., Schmidt, M., Omondi, P., and Famiglietti, J.: Separation of large scale water storage patterns over Iran using GRACE, altimetry and hydrological data, Remote Sens. Environ., 140, 580–595, https://doi.org/10.1016/j.rse.2013.09.025, 2014.
Hasemi, M.: A socio-technical assessment framework for integrated water resources management (IWRM) in Lake Urmia Basin, Iran, PhD thesis, School of Civil Engineering and Geosciences, Newcastle University, Newcastle, UK, 342 pp., 2011.
Hassanzadeh, E., Zarghami, M., and Hassanzadeh, Y.: Determining the main factors in declining the urmia lake level by using system dynamics modeling, Water Resour. Manage., 26, 129–145, https://doi.org/10.1007/s11269-011-9909-8, 2012.
Hesami, A. and Amini, A.: Changes in irrigated land and agricultural water use in the Lake Urmia basin, Lake Reserv. Manage., 32, 288–296, https://doi.org/10.1080/10402381.2016.1211202, 2016.
Hosseini-Moghari, S. M., Araghinejad, S., and Ebrahimi, K.: Monthly Precipitation Assessment: a misleading tool for understanding the effects of climate change, in: 8th Global FRIEND-Water Conference, 6–9 November 2018, Beijing, China, available at: http://m.iahr.org.cn/Resource/abstractinfo/3955 (last access: 12 February 2020), 2018.
Jalili, S., Kirchner, I., Livingstone, D. M., and Morid, S.: The influence of large-scale atmospheric circulation weather types on variations in the water level of Lake Urmia, Iran, Int. J. Climatol., 32, 1990–1996, https://doi.org/10.1002/joc.2422, 2012.
Kamali, M. and Youneszadeh Jalili, S.: Investigation of landuse changes in Lake Urmia Basin using remotely sensed images, Report of Urmia Lake Restoration Program (ULRP), ULRP, Tehran, Iran, 2015.
Karimi, N., Bagheri, M. H., Hooshyaripor, F., Farokhnia, A., and Sheshangosht, S.: Deriving and evaluating bathymetry maps and stage curves for shallow lakes using remote sensing data, Water Resour. Manage., 30, 5003–5020, https://doi.org/10.1007/s11269-016-1465-9, 2016.
Kelleher, C., McGlynn, B., and Wagener, T.: Characterizing and reducing equifinality by constraining a distributed catchment model with regional signatures, local observations, and process understanding, Hydrol. Earth Syst. Sci., 21, 3325–3352, https://doi.org/10.5194/hess-21-3325-2017, 2017.
Khatami, S., Peel, M. C., Peterson, T. J., and Western, A. W.: Equifinality and Flux Mapping: A new approach to model evaluation and process representation under uncertainty, Water Resour. Res., 55, 8922–8941, https://doi.org/10.1029/2018WR023750, 2019.
Khazaei, B., Khatami, S., Alemohammad, S. H., Rashidi, L., Wu, C., Madani, K., and Aghakouchak, A.: Climatic or regionally induced by humans? Tracing hydro-climatic and land-use changes to better understand the Lake Urmia tragedy, J. Hydrol., 569, 203–217, https://doi.org/10.1016/j.jhydrol.2018.12.004, 2019.
Landerer, F. W. and Swenson, S. C.: Accuracy of scaled GRACE terrestrial water storage estimates, Water Resour. Res., 48, W04531, https://doi.org/10.1029/2011WR011453, 2012.
Madani, K., AghaKouchak, A., and Mirchi, A.: Iran's socio-economic drought: challenges of a water-bankrupt nation, Iran. Stud., 49, 997–1016, https://doi.org/10.1080/00210862.2016.1259286, 2016.
Mirjalili, S.: Genetic algorithm, in: Evolutionary Algorithms and Neural Networks, Springer, Berlin, Heidelberg, Germany, 43–55, https://doi.org/10.1007/978-3-319-93025-1, 2019.
Müller Schmied, H., Eisner, S., Franz, D., Wattenbach, M., Portmann, F. T., Flörke, M., and Döll, P.: Sensitivity of simulated global-scale freshwater fluxes and storages to input data, hydrological model structure, human water use and calibration, Hydrol. Earth Syst. Sci., 18, 3511–3538, https://doi.org/10.5194/hess-18-3511-2014, 2014.
Pengra, B.: The drying of Iran's Lake Urmia and its environmental consequences, UNEP-GRID, Sioux Falls, UNEP Global Environmental Alert Service (GEAS), available at: https://na.unep.net/geas/getUNEPPageWithArticleIDScript.php?article_id=79 (last access: 25 October 2017), 2012.
Saemian, P., Faridzad, M., Youneszadeh, S., Emadzadeh, M., Jalilvand, E., Farahmand, H., and Taheri, M.: Estimation of Evapotranspiration, water saving and agricultural water consumption at Urmia Lake Basin, 2010, Report of Urmia Lake Restoration Program (ULRP), ULRP, Tehran, Iran, 2015.
Save, H., Bettadpur, S., and Tapley, B. D.: High‐resolution CSR GRACE RL05 mascons, J. Geophys. Res.-Solid, 121, 7547–7569, https://doi.org/10.1002/2016JB013007, 2016.
Scrucca, L.: GA: a package for genetic algorithms in R, J. Stat. Softw., 53, 1–37, https://doi.org/10.18637/jss.v053.i04, 2013.
Shadkam, S., Ludwig, F., van Oel, P., Kirmit, Ç., and Kabat, P.: Impacts of climate change and water resources development on the declining inflow into Iran's Urmia Lake, J. Great Lakes Res., 42, 942–952, https://doi.org/10.1016/j.jglr.2016.07.033, 2016.
Siebert, S., Burke, J., Faures, J.-M., Frenken, K., Hoogeveen, J., Döll, P., and Portmann, F. T.: Groundwater use for irrigation – a global inventory, Hydrol. Earth Syst. Sci., 14, 1863–1880, https://doi.org/10.5194/hess-14-1863-2010, 2010.
Sima, S., and Tajrishy, M.: Using satellite data to extract volume–area–elevation relationships for Urmia Lake, Iran, J. Great Lakes Res., 39, 90–99, https://doi.org/10.1016/j.jglr.2012.12.013, 2013.
Tabari, H. and Talaee, P. H.: Analysis of trends in temperature data in arid and semi-arid regions of Iran, Global Planet. Change, 79, 1–10, https://doi.org/10.1016/j.gloplacha.2011.07.008, 2011a.
Tabari, H. and Talaee, P. H.: Temporal variability of precipitation over Iran: 1966–2005, J. Hydrol., 396, 313–320, https://doi.org/10.1016/j.jhydrol.2010.11.034, 2011b.
Tourian, M. J., Elmi, O., Chen, Q., Devaraju, B., Roohi, S., and Sneeuw, N.: A spaceborne multisensor approach to monitor the desiccation of Lake Urmia in Iran, Remote Sens. Environ., 156, 349–360, https://doi.org/10.1016/j.rse.2014.10.006, 2015.
Tsou, C. S.: nsga2R: Elitist Non-dominated Sorting Genetic Algorithm based on R, R package version 1.0, available at: https://CRAN.R-project.org/package=nsga2R (last access: 19 August 2019), 2013.
ULRP: The trend of Lake Urmia changes, available at: http://ulrp.sharif.ir/fa (last access: 17 July 2018), 2015a.
ULRP: Urmia Lake – Causes of shrinkage and potential threats, available at: http://ulrp.sharif.ir/fa (last access: 17 July 2018), 2015b.
ULRP: Evaluation and deduction of Urmia Lake Restoration Program need at least 3 years, available at: http://ulrp.sharif.ir/en/news/news-1435-evaluation-and-deduction-urmia-lake-restoration (last access: 25 October 2017), 2015c.
Vaheddoost, B. and Aksoy, H.: Interaction of groundwater with Lake Urmia in Iran, Hydrol. Process., 32, 3283–3295, https://doi.org/10.1002/hyp.13263, 2018.
Werth, S. and Güntner, A.: Calibration analysis for water storage variability of the global hydrological model WGHM, Hydrol. Earth Syst. Sci., 14, 59–78, https://doi.org/10.5194/hess-14-59-2010, 2010.
Zeinoddini, M., Tofighi, M. A., and Vafaee, F.: Evaluation of dike-type causeway impacts on the flow and salinity regimes in Urmia Lake, Iran, J. Great Lakes Res., 35, 13–22, https://doi.org/10.1016/j.jglr.2008.08.001, 2009.