the Creative Commons Attribution 4.0 License.
the Creative Commons Attribution 4.0 License.
 | 03 Jun 2020
Comparing Palmer Drought Severity Index drought assessments using the traditional offline approach with direct climate model outputs
Shulei Zhang
Michael L. Roderick
Tim R. McVicar
Dawen Yang
Wenbin Liu
Xiaoyan Li
Anthropogenic warming has been projected to increase global drought for the 21st century when calculated using traditional offline drought indices. However, this contradicts observations of the overall global greening and little systematic change in runoff over the past few decades and climate projections of future greening with slight increases in global runoff for the coming century. This calls into question the drought projections based on traditional offline drought indices. Here we calculate a widely used traditional drought index (i.e., the Palmer Drought Severity Index, PDSI) using direct outputs from 16 Coupled Model Intercomparison Project Phase 5 (CMIP5) models (PDSI_CMIP5) such that the hydrologic consistency between PDSI_CMIP5 and CMIP5 models is maintained. We find that the PDSI_CMIP5-depicted drought increases (in terms of drought severity, frequency, and extent) are much smaller than that reported when PDSI is calculated using the traditional offline approach that has been widely used in previous drought assessments under climate change. Further analyses indicate that the overestimation of PDSI drought increases reported previously using the PDSI is primarily due to ignoring the vegetation response to elevated atmospheric CO2 concentration ([CO2]) in the traditional offline calculations. Finally, we show that the overestimation of drought using the traditional PDSI approach can be minimized by accounting for the effect of CO2 on evapotranspiration.
- Article
(6076 KB) -
Supplement
(777 KB) - BibTeX
- EndNote


Drought is an intermittent disturbance of the water cycle that has profound impacts on regional water resources, agriculture, and other ecosystem services (Sherwood and Fu, 2014). By taking meteorological outputs from climate model projections as the inputs to offline drought indices/hydrological impact models, numerous studies have projected increases in future drought, in terms of severity, frequency, and extent, mainly as a consequence of warming associated with anthropogenic climate change (Cook et al., 2014, 2015; Dai, 2011, 2012; Dai et al., 2018; Huang et al., 2016, 2017; Lehner et al., 2017; Liu et al., 2018; Naumann et al., 2018; Park et al., 2018; Samaniego et al., 2018; Sternberg, 2011; Trenberth et al., 2014). However, this substantial increase in projected drought contradicts observations of global vegetation greening and little systematic change in runoff over the past few decades and climate projections of future greening with slight increases in global runoff for the coming century (Alkama et al., 2013; Greve et al., 2017; Labat et al., 2014; Roderick et al., 2015; Milly and Dunne, 2016; Scheff et al., 2017; Yang et al., 2018, 2019; Zhu et al., 2016). The scientific basis underpinning the projected drying trend using traditional offline drought indices/hydrological impact models is that the calculated increases in evapotranspiration (E) are larger than the projected increase in precipitation (P) in many places (Sternberg, 2011), which results in an increasing water deficit and thus increasing simulated future drought. However, direct climate model outputs of E exhibit a much smaller increasing trend (Fig. S1 in the Supplement), and the global land mean P is actually projected to increase more quickly than its E counterpart (Greve et al., 2017; Milly and Dunne, 2016, 2017; Roderick et al., 2015; Yang et al., 2018), leading to a very different conclusion.
Several recent studies have demonstrated that the drying bias in the offline calculated E trend is primarily due to neglecting the impact of increasing atmospheric CO2 concentration ([CO2]) (and its resultant vapor pressure deficit increase) on the water use efficiency of vegetation (Lemordant et al., 2018; Milly and Dunne, 2016, 2017; Roderick et al., 2015; Swann et al., 2016; Yang et al., 2019). This vegetation-[CO2] response only impacts transpiration, not soil evaporation, interception from vegetation surfaces or sublimation in snow environments; however, it should be noted that transpiration dominates (∼65 %; note that a transpiration over an evapotranspiration ratio of 0.41±0.11 is estimated by the Coupled Model Intercomparison Project Phase 5 – CMIP5 – models) global terrestrial evapotranspiration (Lian et al., 2018; Zhang et al., 2016). In existing hydrologic impact models/drought indices, P and potential evapotranspiration (EP; the rate of evapotranspiration that would occur with an unlimited supply of water) are the two key input variables, which, respectively, represent water supply to, and water demand from, the land surface. While P is a direct climate model output, EP is not produced by climate models. The traditional approach is to calculate EP offline using the meteorological variables in the climate model output. The calculated EP together with the climate model projected P are used to force an offline hydrologic impact model (or hydrologic calculations embedded in drought indices) that independently calculates E, runoff (Q), and storage change (ΔS), to assess hydrologic changes under future climate scenarios (the right-hand column shown in Fig. 1). Among various EP models, the open-water Penman model (Shuttleworth, 1993) and the reference crop Penman–Monteith model (Allen et al., 1998) have been most widely used in existing drought assessment studies, given their sound physical basis and relatively simple formulations. Nevertheless, both Penman-based models do not faithfully capture the biological processes embedded in the climate models. The open-water Penman model was designed for water surfaces, where surface resistance (rs) is, by definition, equal to zero. Allen et al. (1998)'s reference crop Penman–Monteith model prescribed a constant rs at 70 s m−1, which is appropriate for an idealized reference crop in the current climate but does not account for the fact that rs increases with elevated [CO2] over vegetated surfaces in climate model projections (Yang et al., 2019). As a result, existing traditional offline hydrologic impact models/drought indices calculate estimates of E, Q, and ΔS that are different from those same variables in the original fully coupled climate model output. For that reason, the consequent assessments of drought changes in existing traditional offline hydrologic impact models/drought indices do not correctly represent the projections in the underlying fully coupled climate models. Figure 1 illustrates the inconsistency in the hydrologic predictions (also see Milly and Dunne, 2017) that have resulted in different trends in projected future drought between climate models and traditional offline hydrologic impact models/drought indices.
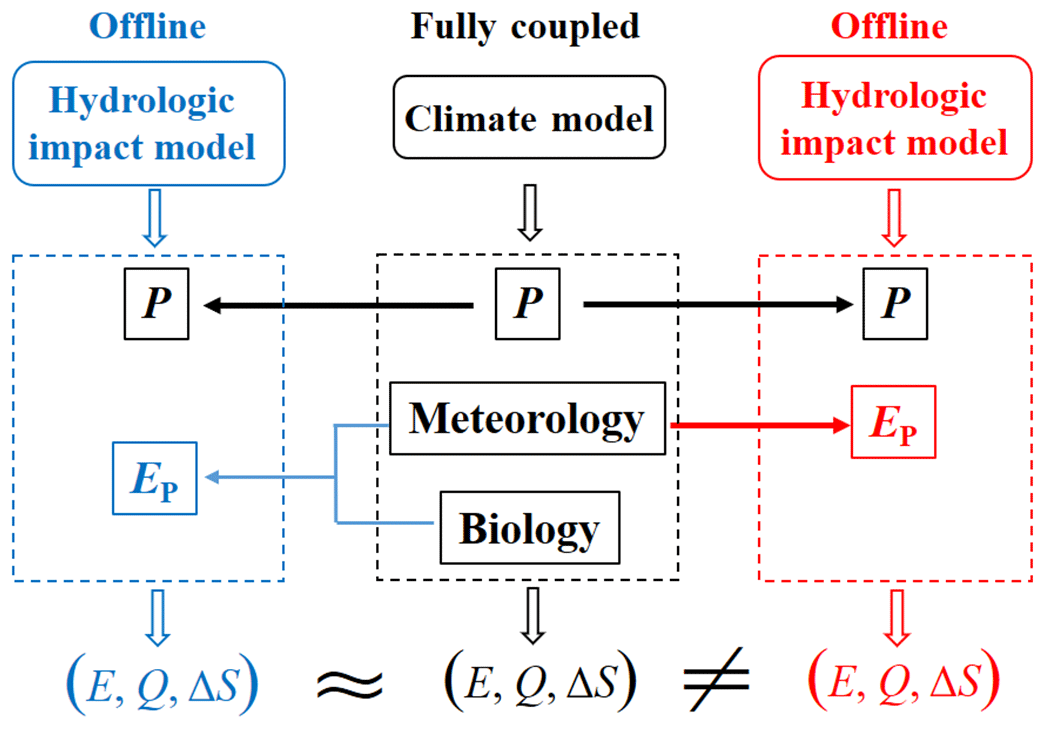
Figure 1Conceptual plot illustrating the inconsistency in the hydrologic predictions between climate models and offline hydrologic impact models. The symbols P, EP, E, Q, and ΔS represent precipitation, potential evapotranspiration, actual evapotranspiration, runoff, and storage change, respectively. The meteorological variables used to calculate EP depend on the adopted EP model, but mainly include net radiation, near-surface air temperature, vapor pressure, and wind speed. The biological factor here is the response of surface resistance to elevated [CO2] over vegetated lands.
Here, we re-assess changes in future global drought using climate model projections from 16 CMIP5 models under historical (1861–2005) and Representative Concentration Pathway 8.5 (RCP8.5; 2006–2100) experiments (Taylor et al., 2012). These 16 CMIP5 models were selected as they output all variables, including runoff, that are needed for the analysis performed herein. The Palmer Drought Severity Index (PDSI; Palmer, 1965) is adopted here to quantify drought as it has been widely used for operational drought monitoring and is increasingly used in studies assessing drought under climate change (Cook et al., 2014, 2015; Dai, 2011, 2012; Dai et al., 2018; Lehner et al., 2017; Liu et al., 2018; Sheffield et al., 2012; Swann et al., 2016; Trenberth et al., 2014). To maintain consistency between the calculated PDSI and the CMIP5 models, we first calculate PDSI using direct hydrologic outputs (i.e., P, E, Q, ΔS) from the CMIP5 models (PDSI_CMIP5; corresponds to the center column in Fig. 1; also see the Data and methods section). This procedure provides a reference for the PDSI projections. We then replicate the traditional PDSI calculation by using only meteorological data as inputs to calculate the reference crop Penman–Monteith EP (PDSI_PM-RC) (the right-hand column shown in Fig. 1). The inference is that this traditional offline approach that only responds to meteorological forcing will overestimate drought relative to the direct climate model output because it does not consider the biological effect of elevated [CO2]. To evaluate that inference, we again re-calculate the PDSI using an offline formulation that considers both the same meteorological forcing along with the biological effects of elevated CO2 (Yang et al., 2019) (the left-hand column in Fig. 1).
2.1 Climate model projections
We used outputs from 16 climate models participating in Phase 5 of the Coupled Model Intercomparison Project (CMIP5; Table S1 in the Supplement) under historical (1861–2005) and RCP8.5 (2006–2100) experiments (Taylor et al., 2012). We used monthly series of runoff, precipitation, soil moisture, and sensible and latent heat flux at the land surface along with near-surface air temperature, air pressure, wind speed, and specific humidity. All outputs from the 16 CMIP5 models were resampled to a common 1∘ spatial resolution by using the first-order conservative remapping scheme (Jones, 1999).
2.2 Calculation of PDSI
The PDSI was used to quantify drought (Palmer, 1965). To minimize the impact of initial conditions on PDSI estimates, the first 40 years (1861–1900) are used for model spin-up with the analyses focused on the 1901–2100 period. Briefly, the PDSI model consists of two parts: (i) a two-stage bucket model that calculates the monthly water balance components (i.e., E, Q, and ΔS) using P and EP as inputs and (ii) a dimensionless index that describes the moisture departure between the actual precipitation and the precipitation needed to maintain a normal soil moisture level for a given time (i.e., the climatically appropriate one for existing condition values; these values were calculated for the entire period of 1901–2100). The soil available water capacity (AWC) needed for PDSI calculation was derived from the Global Gridded Surfaces of Selected Soil Characteristics (https://webmap.ornl.gov/ogcdown/dataset.jsp?ds_id=569, last access: 1 June 2020). While this parameter is inevitably subject to uncertainties, Sheffield et al. (2012) demonstrated that the PDSI calculation is insensitive to AWC inputs. Detailed descriptions of PDSI can be found in Palmer (1965). A drought event is identified with negative PDSI values, with a more negative PDSI indicating a more severe drought, whereas moist events are associated with positive PDSI values.
We calculated PDSI following Palmer (1965), yet calculated EP using the reference crop Penman–Monteith model (PDSI_PM-RC; the right-hand column in Fig. 1). The Penman–Monteith model explicitly considers influences from both radiative and aerodynamic components and has been widely used in previous PDSI calculations (e.g., Dai, 2012; Sheffield et al., 2012). In addition, we also used a modified Penman–Monteith model (PM[CO2]; detailed later in the Methods section and also see Yang et al., 2019) that accounts for the impact of elevated [CO2] on rs to calculate EP and then PDSI (PDSI_PM[CO2]; the left-hand column in Fig. 1).
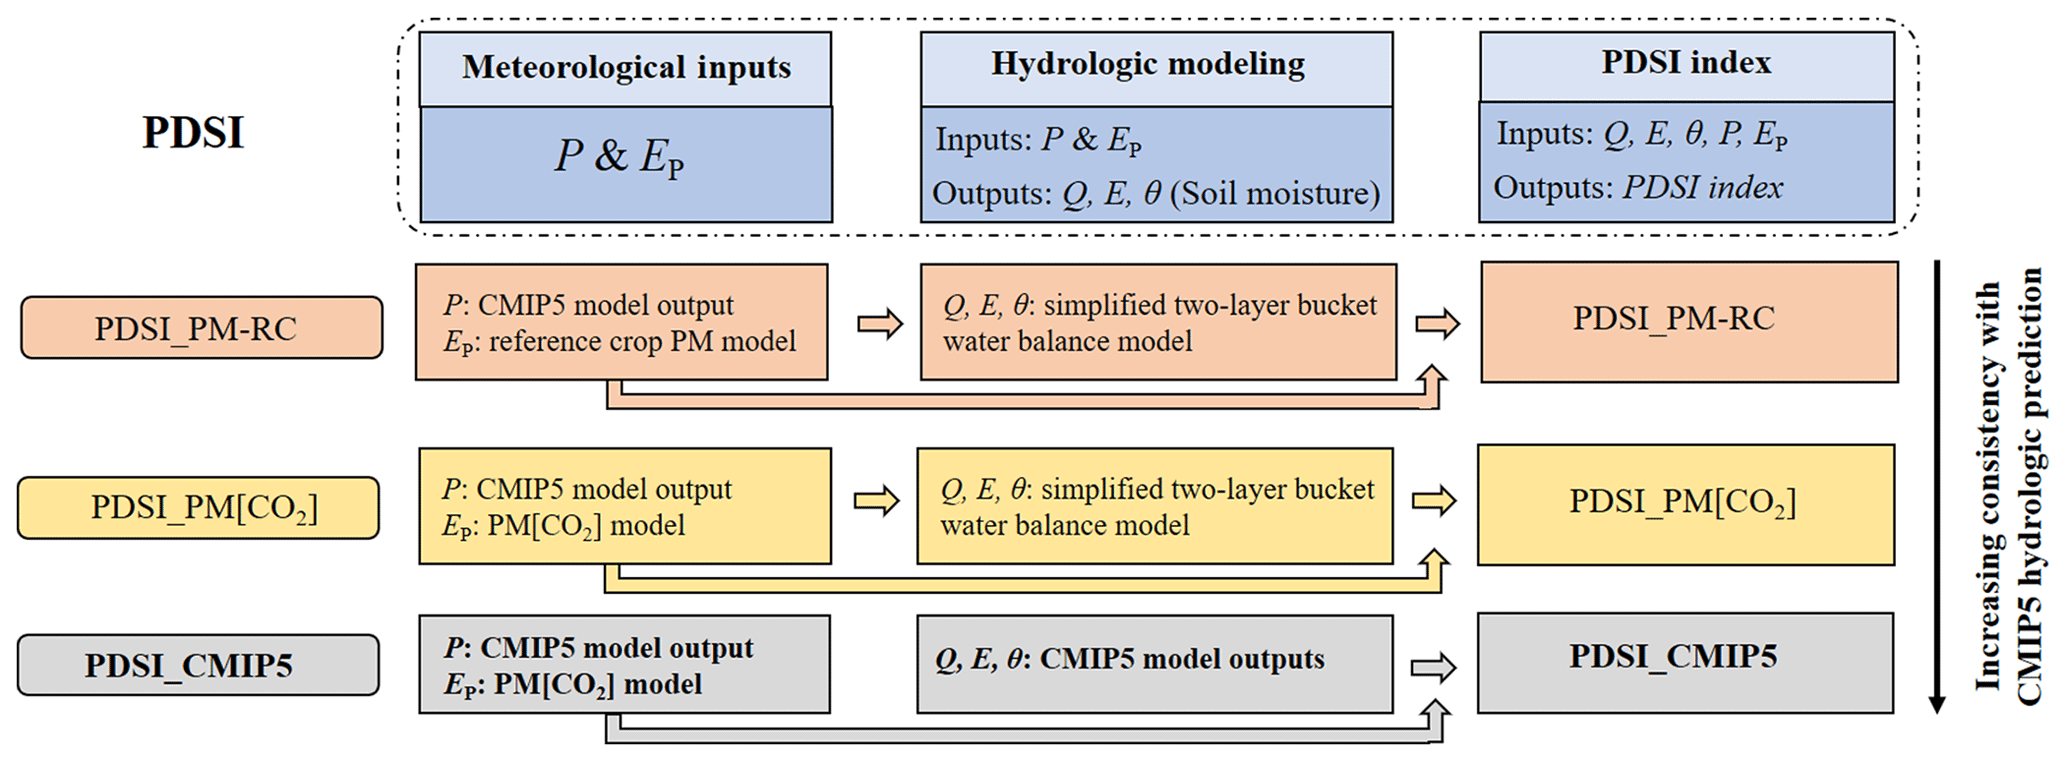
Figure 2Flowchart of PDSI calculations. Note that PDSI_PM-RC, PDSI_PM[CO2], and PDSI_CMIP5, respectively, follow the right-hand, left-hand, and center columns in Fig. 1.
Additionally, instead of using hydrological simulations from the simplified water balance model embedded in the original PDSI model, we also calculated PDSI by using direct hydrologic outputs E, Q, and ΔS from the 16 CMIP5 models (PDSI_CMIP5; the center column in Fig. 1). This approach ensures that PDSI_CMIP5 faithfully represented the CMIP5 output. As the original PDSI model depends on a two-stage “bucket” model of the soil, we correspondingly regarded the moisture in the upper portion of the soil column (integrated over the uppermost 10 cm) from CMIP5 models as the moisture in the first layer and the total soil moisture content as the available moisture in both layers (so differences between total soil-depth representation in CMIP5 models may lead to differences in PDSI estimates from individual models but are unlikely to impact the PDSI changes). Moreover, since the estimation of the weighting factor that converts moisture anomalies into the PDSI index also requires knowledge of EP, we used the EP computed from a modified Penman–Monteith equation that explicitly considers the biological effect of elevated [CO2] (i.e., PM[CO2]) (Yang et al., 2019). To comprehensively document how the different PDSIs were calculated, we illustrate the calculation procedures of the different PDSIs in Fig. 2. Additionally, Matlab codes with worked examples of the different PDSIs can be accessed through https://github.com/zslthu/Calculate-PDSI-in-Matlab (last access: 1 June 2020). The PDSIs were calculated using outputs of each CMIP5 model in turn, and the ensemble PDSIs (averaging PDSIs over the 16 CMIP5 models) were used in the following analyses.
2.3 Calculation of potential evapotranspiration
Two potential evapotranspiration formulations were used to calculate EP. The first is the reference crop Penman–Monteith EP model, which computes EP (mm d−1) as (Allen et al., 1998)
where Δ (Pa K−1) is the gradient of the saturation vapor pressure with respect to temperature, γ (Pa K−1) is the psychrometric constant, (MJ m−2 d−1) is the surface available radiation (i.e., net radiation minus ground heat flux), D (Pa) is the vapor pressure deficit of the air at 2 m height, and u (m s−1) is the wind speed at 2 m height. In the reference crop Penman–Monteith model, rs is prescribed as 70 s m−1, and this parameter value is embedded in the equation.
In addition, we used a modified reference crop Penman–Monteith EP model (i.e., PM[CO2]) that accounts for the impact of rising [CO2] (expressed in ppm units) on rs, as derived in Yang et al. (2019). The PM[CO2] model calculatesEP as
2.4 Determining the timing of global warming target
To demonstrate the impact of warming on drought changes, we assessed changes in PDSI_CMIP5 under two future warming targets: 1.5 and 2 ∘C warming above the pre-industrial level. The 1.5 and 2 ∘C warming levels have been extensively discussed (Huang et al., 2017; Lehner et al., 2017; Liu et al., 2018; Park et al., 2018; Samaniego et al., 2018), as they are the two key warming targets set in the Paris Agreement on climate change (UNFCCC, 2015). The timing when the global warming targets (i.e., t1.5 and t2) are reached in each of the 16 CMIP5 models was computed based on the model output of the near-surface air temperature (Ta). We first selected 1986–2005 as the baseline period, which is a widely used reference period for climate impact assessment (Lehner et al., 2017; Liu et al., 2018; Park et al., 2018). Then, we applied a 20-year moving average filter to the global mean annual Ta time series to remove the interannual fluctuations in annual Ta (Liu et al., 2018; Park et al., 2018). Each 20-year moving average is indexed to its final year (for example, the 20-year running mean Ta for 2080 is an average of Ta for 2061–2080). Finally, t1.5 and t2 are, respectively, determined at the times when global mean Ta reached 0.9 and 1.4 ∘C above the 1986–2005 baseline, as this period was at least 0.6 ∘C warmer than the pre-industrial level (Hawkins et al., 2017; Schleussner et al., 2016).
3.1 Predicted drought changes
Figure 3 shows the global patterns of PDSI trends for the three PDSIs. Evident drought increases are depicted by PDSI_PM-RC across much of the North America, South America, central to southern Europe, Congo basin, southern Africa, southeastern China, and southern coastal areas of Australia (Fig. 3a), as widely reported previously (Dai, 2011, 2012; Dai et al., 2018; Cook et al., 2014; Lehner et al., 2018; Liu et al., 2018). However, those broad-scale trends are not identified by either PDSI_CMIP5 (Fig. 3b) or PDSI_PM[CO2] (Fig. 3c). Compared with PDSI-PM-RC, both PDSI_CMIP5 and PDSI_PM[CO2] show much smaller changes. This result clearly indicates an inconsistency between the PDSI_PM-RC that has been widely used in traditional offline calculations for drought assessment studies and the underlying CMIP5 models, as the PDSI_CMIP5 as used here is based on the direct hydrologic outputs (E, Q, and ΔS) from CMIP5 models.
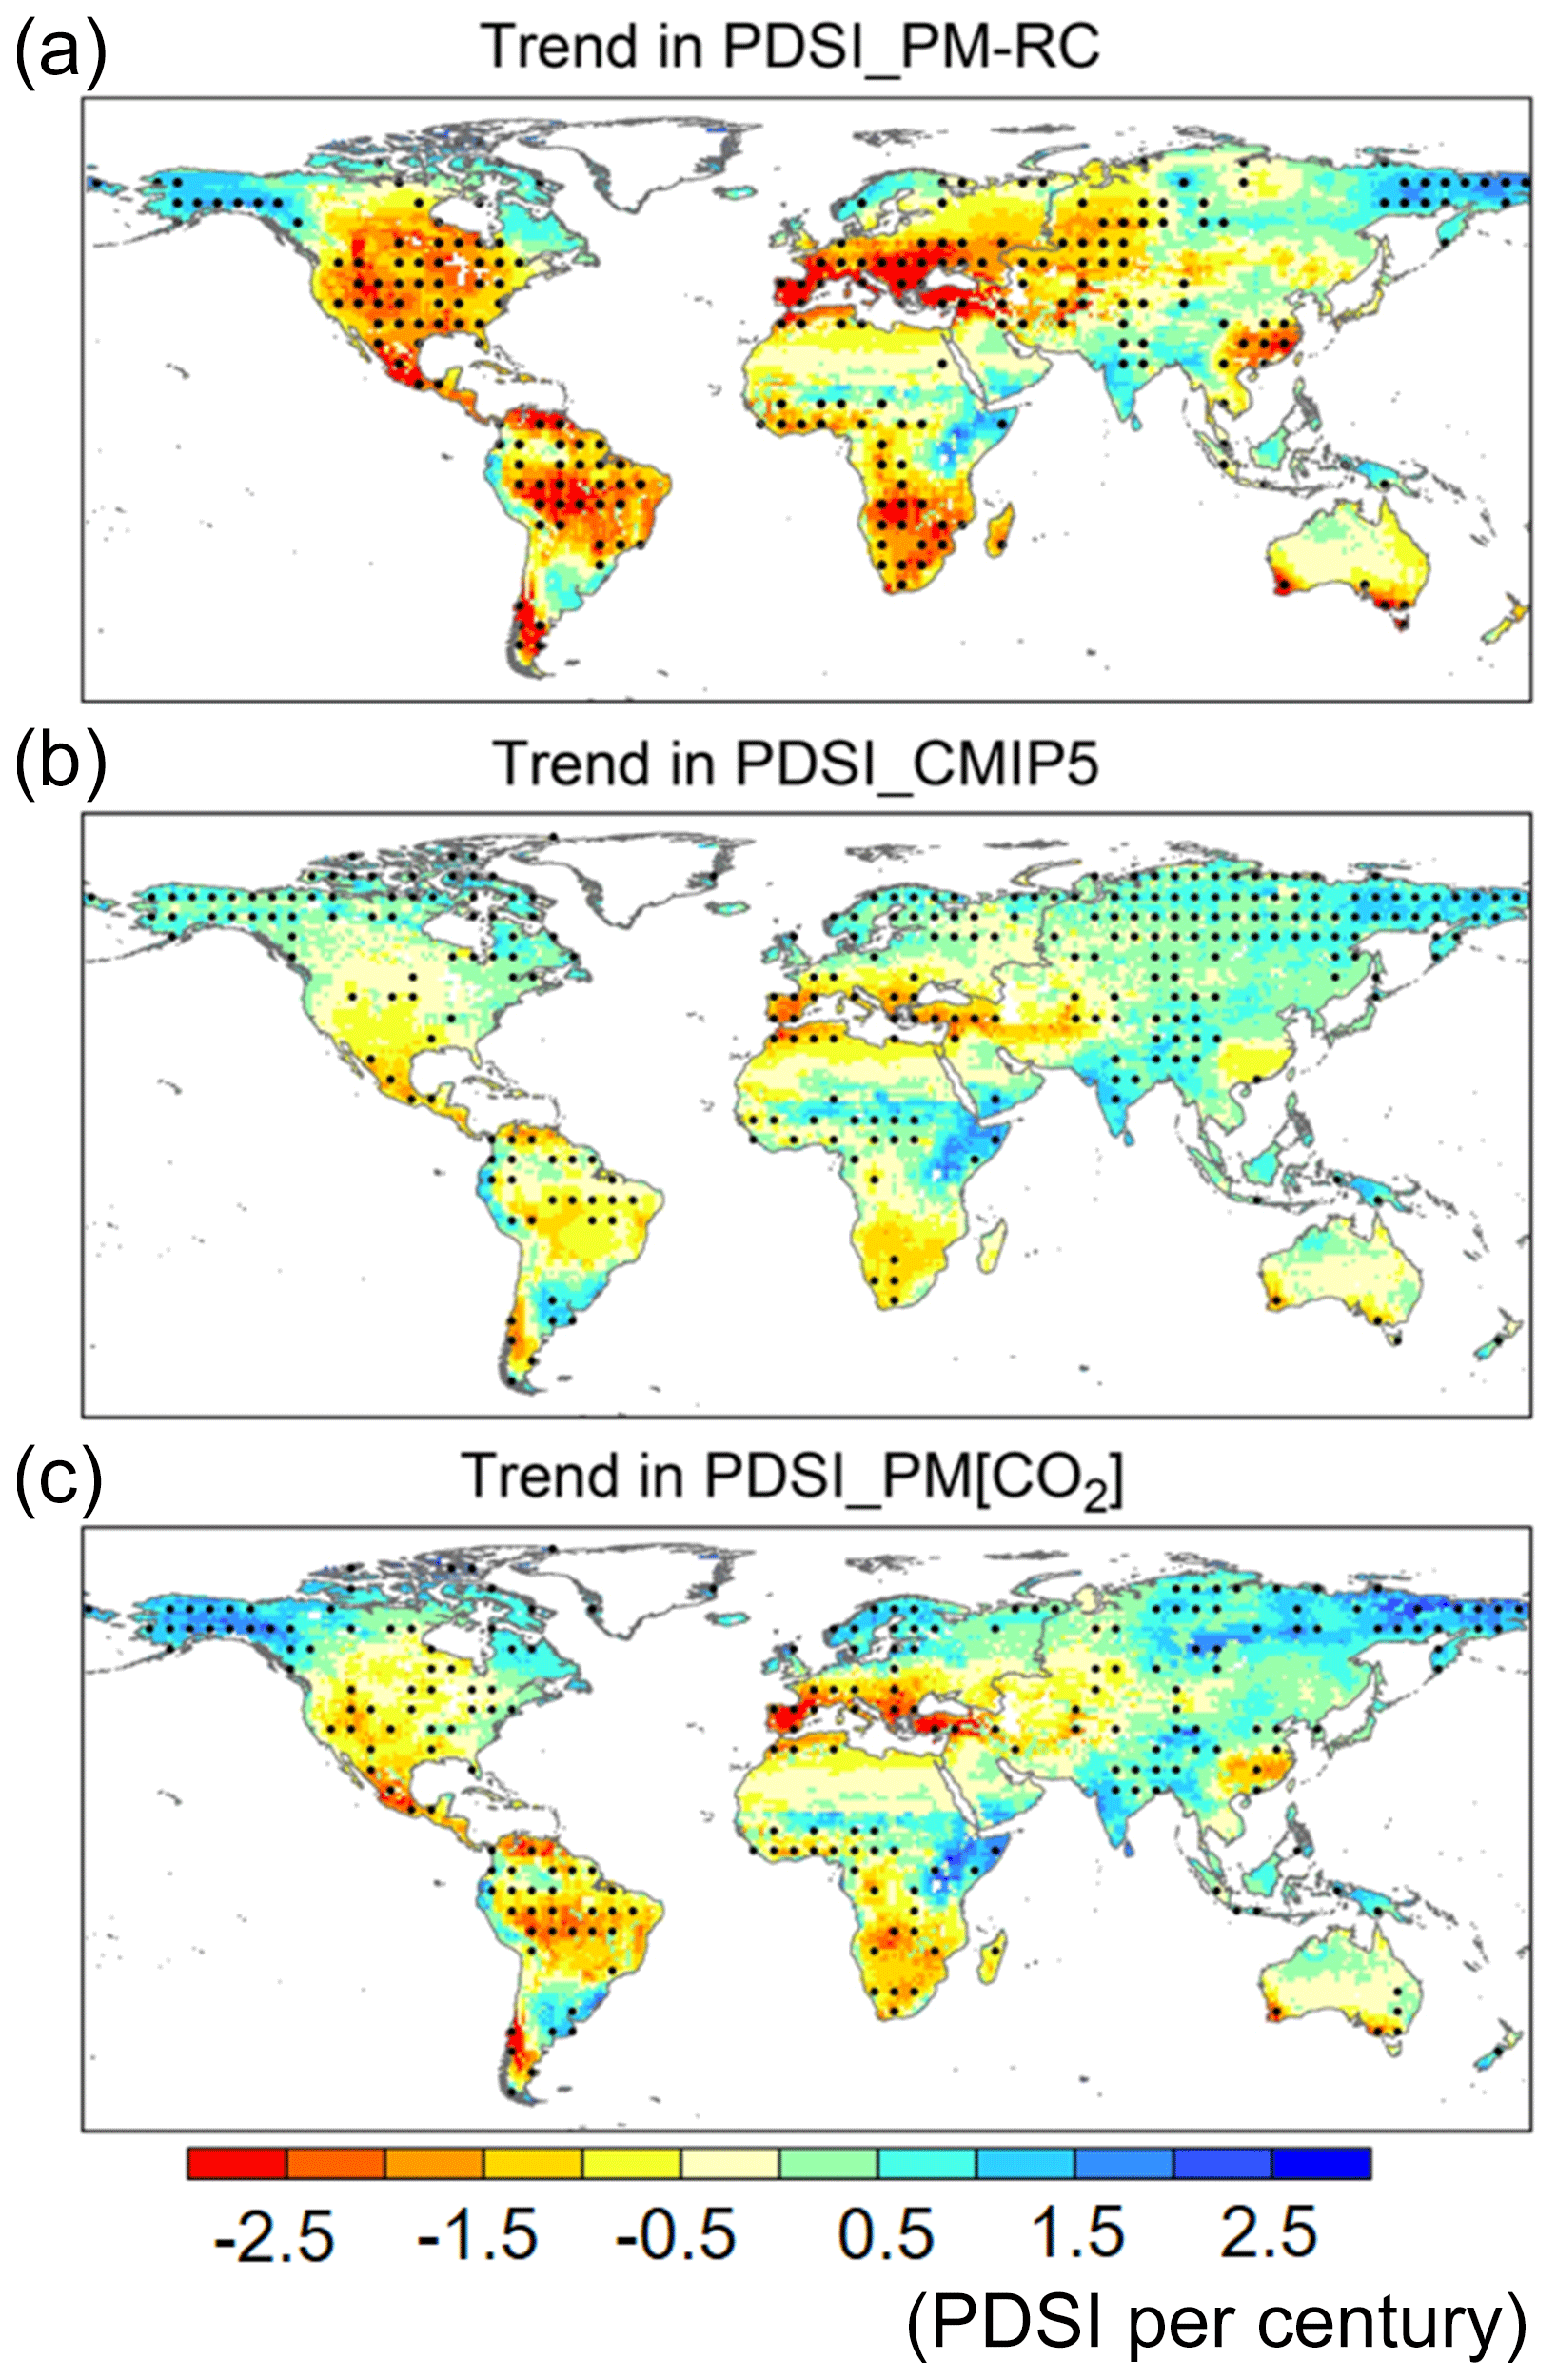
Figure 3Global spatial pattern of PDSI trends. Spatial distribution of PDSI trends during 1901–2100 for (a) PDSI_PM-RC, (b) PDSI_CMIP5, and (c) PDSI_PM[CO2], respectively. Black dots represent locations where the same sign of the PDSI trend is identified in at least 13 out of the 16 CMIP5 models (i.e., >80 % of models).
To examine changes in drought frequency and extent, changes in months under drought within each year and changes in land area subject to dry and moist extremes are, respectively, shown in Figs. 4 and 5. In applications, a PDSI is considered to be severe drought conditions, while a PDSI >3.0 is considered exceptionally moist (e.g., Palmer, 1965; Liu et al., 2018). We find that months with PDSI_PM-RC increase substantially over areas where PDSI_PM-RC evidently decreases, suggesting an increased drought frequency in these regions (Fig. 4a). However, when assessed with PDSI_CMIP5 and PDSI_PM[CO2], these drought frequency increases largely diminish (Fig. 4b and c). Yet, moving to PDSI_CMIP5 and PDSI_PM[CO2] apparently does not reduce the widespread distribution of drought frequency increase compared to drought frequency decrease (Fig. 4b and c; i.e., there are more land areas with increasing drought frequency than with decreasing drought frequency). Similar results are found for drought extent changes as severe drought during the 21st century increases by 0.2393±0.0942 % yr−1 (p<0.01) for PDSI_PM-RC but only increases by 0.1099±0.0228 % yr−1 (p<0.01) for PDSI_CMIP5 and 0.1178±0.0308 % yr−1 (p<0.01) for PDSI_PM[CO2], respectively (Fig. 5a–c). By contrast, moist areas (i.e., PDSI >3.0) are less divergent among the three different PDSIs, although the PDSI_PM-RC still shows the least wetting lands compared to the other two PDSIs (Fig. 5a–c). Interestingly, both PDSI_CMIP5 and PDSI_PM[CO2] depict the increase in drought area as essentially equivalent to the increase in moist area (Fig. 5a–c), which may suggest an overall unchanged PDSI_CMIP5 (PDSI_PM[CO2]) series at the global scale (Fig. S2). The above results are largely retained when assessing changes at different thresholds (i.e., mild drought/moist events with PDSI and PDSI >1.0 and moderate drought/moist events with PDSI and PDSI >2.0; Figs. 4d–i and 5d–i). The fact that the results based on PDSI_PM[CO2] closely follow that of PDSI_CMIP5 highlights the importance of vegetation response to elevated [CO2] in the control of future surface hydrological changes. This demonstrates that the inconsistency between the PDSI_PM-RC and CMIP5 models is largely caused by ignoring the vegetation response to elevated [CO2] in the PDSI_PM-RC calculations.
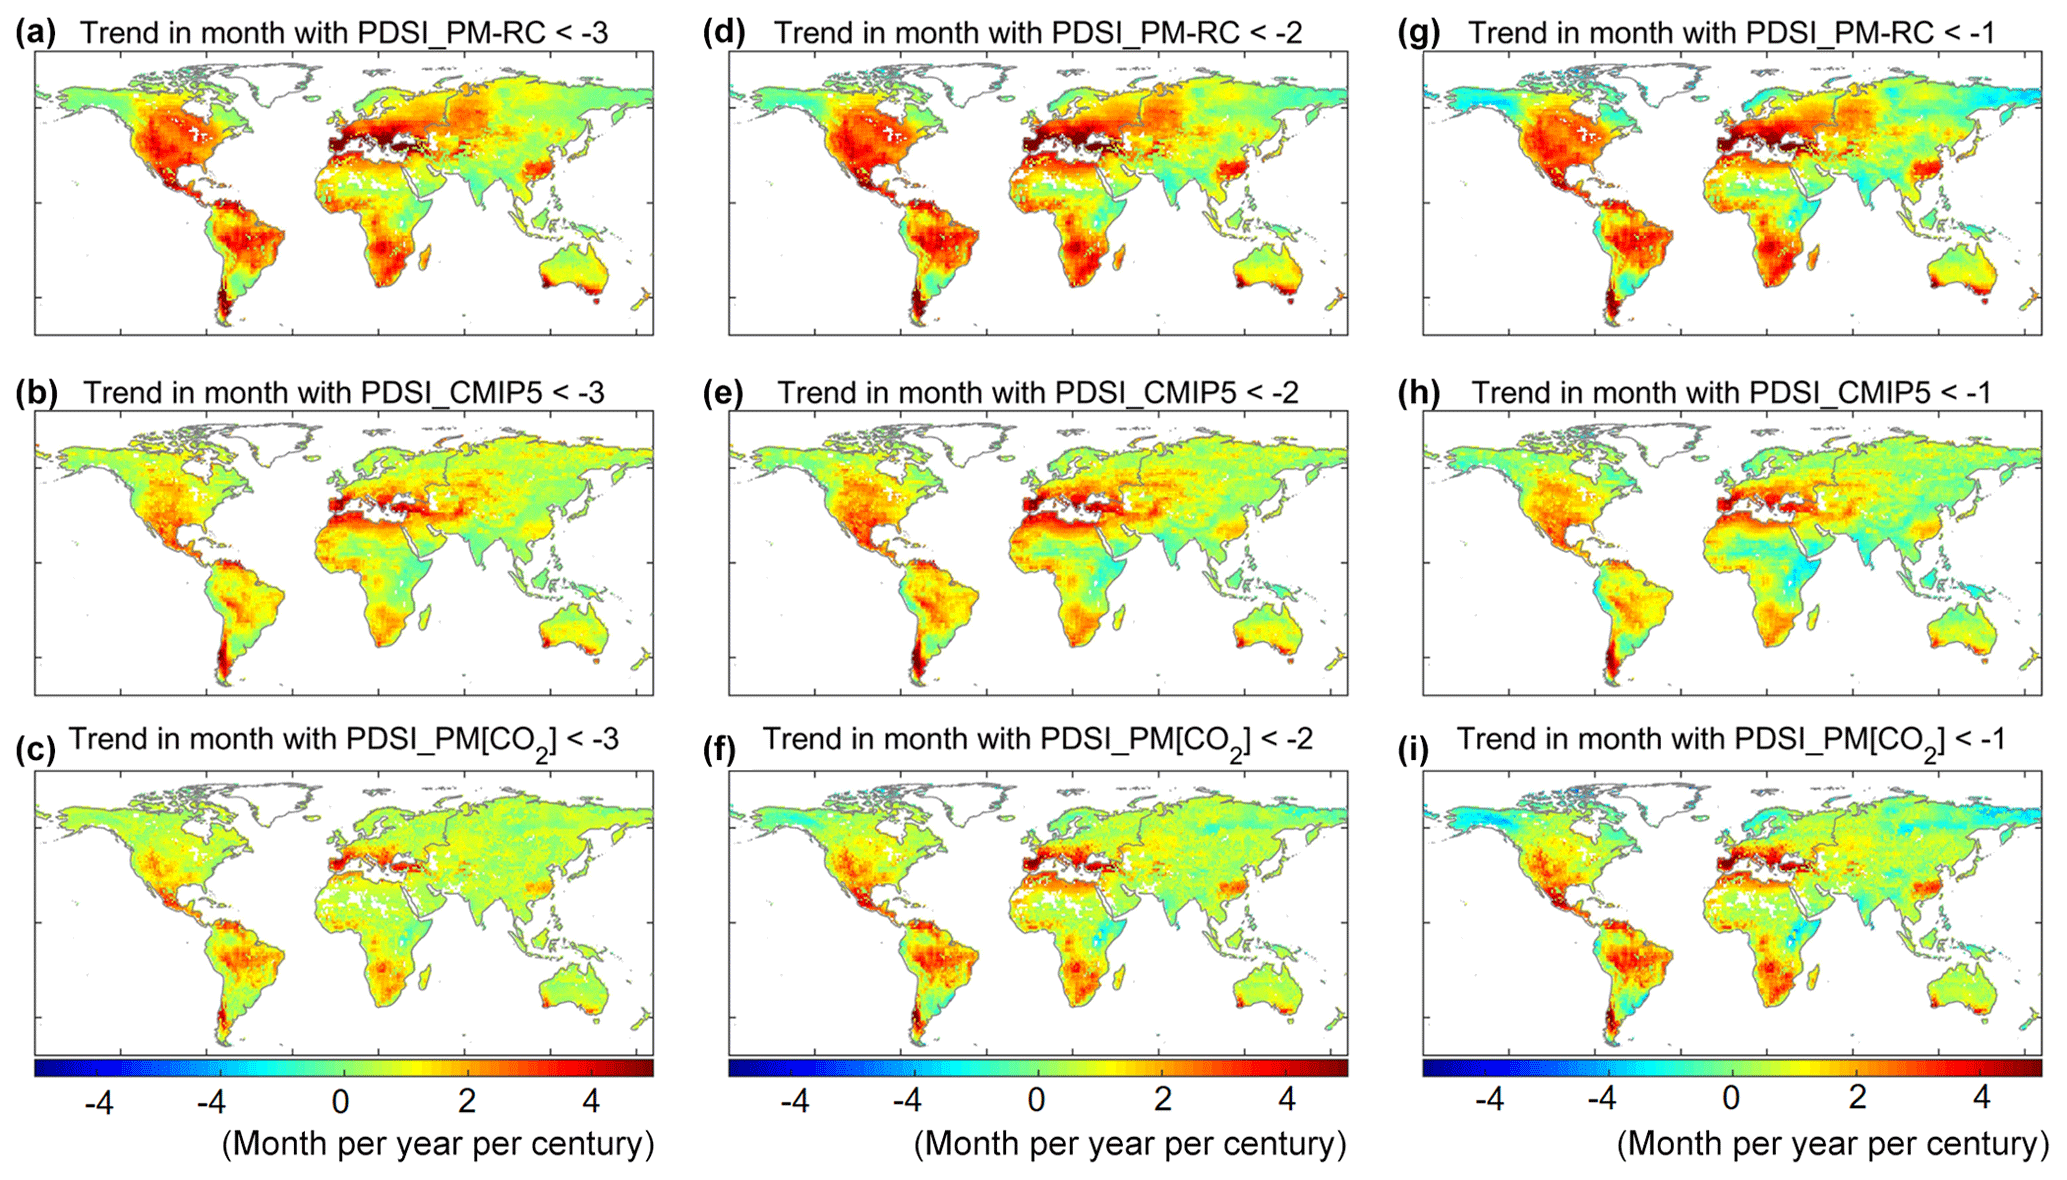
Figure 4Global spatial pattern of drought trends. (a–c) Spatial distribution of trends in the number of months under severe drought (PDSI ) during 1901–2100 for (a) PDSI_PM-RC, (b) PDSI_CMIP5, and (c) PDSI_PM[CO2], respectively. (d–f) Spatial distribution of trends in the number of months under moderate drought (PDSI ) during 1901–2100 for (d) PDSI_PM-RC, (e) PDSI_CMIP5, and (f) PDSI_PM[CO2], respectively. (g–i) Spatial distribution of trends in the number of months under mild drought (PDSI ) during 1901–2100 for (g) PDSI_PM-RC, (h) PDSI_CMIP5, and (i) PDSI_PM[CO2], respectively.
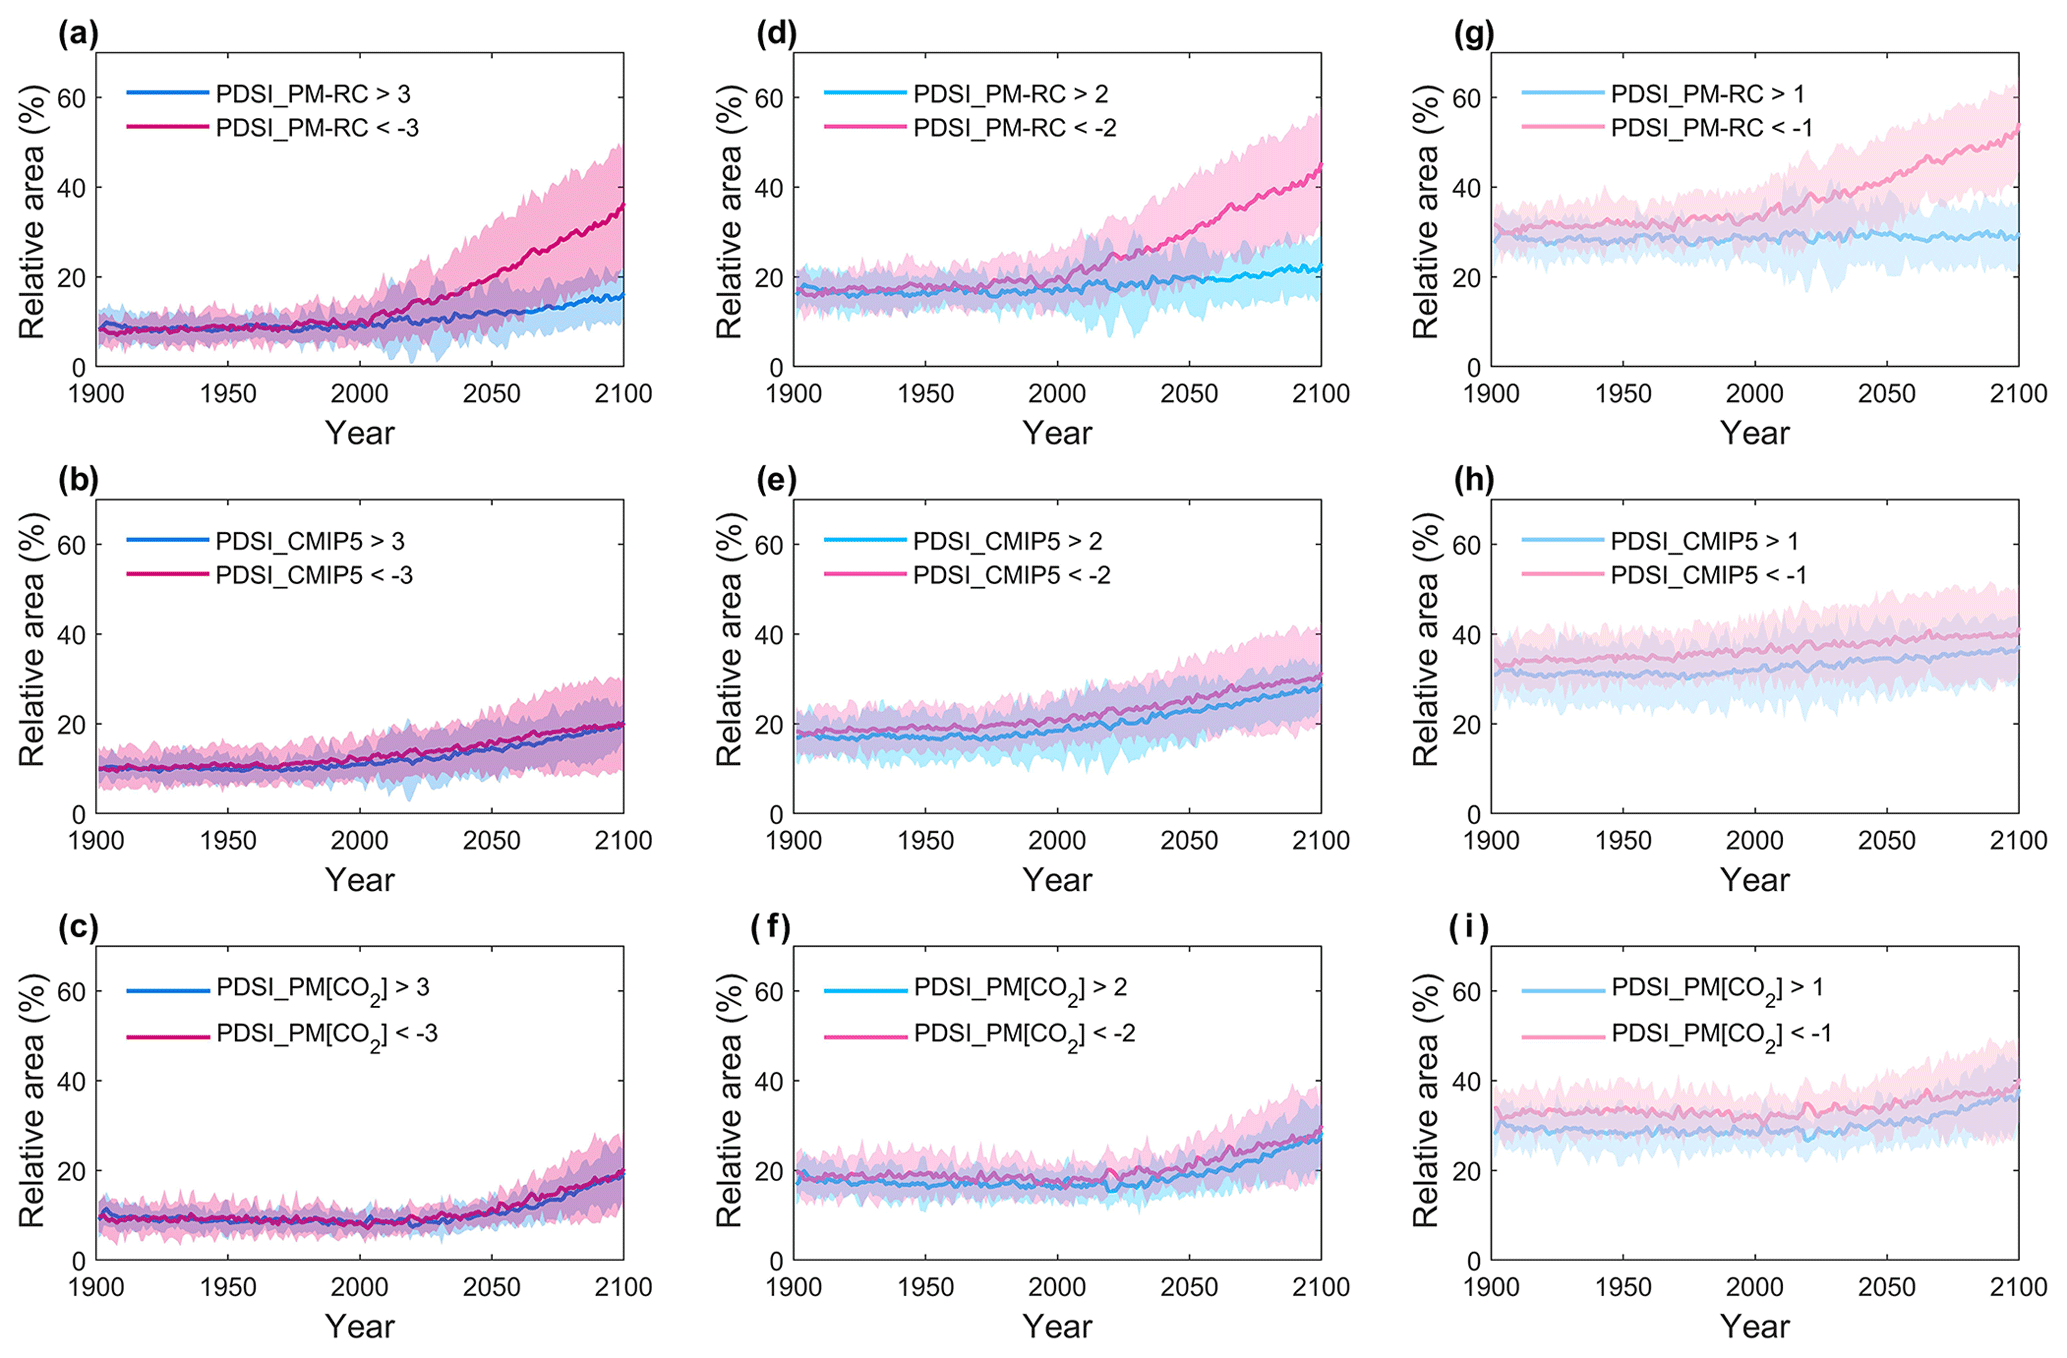
Figure 5Time series of the global average fractional land area experiencing drought/moist conditions. (a–c) Global average time series of land area experiencing severe drought (PDSI , red) and exceptionally moist (PDSI >3.0, blue) conditions for (a) PDSI_PM-RC, (b) PDSI_CMIP5, and (c) PDSI_PM[CO2], respectively. (d–f) Global average time series of land area experiencing moderate drought (PDSI , red) and moist (PDSI >2.0, blue) conditions for (d) PDSI_PM-RC, (e) PDSI_CMIP5, and (f) PDSI_PM[CO2], respectively. (g–i) Global average time series of land area experiencing mild drought (PDSI , red) and moist (PDSI >1.0, blue) conditions for (g) PDSI_PM-RC, (h) PDSI_CMIP5, and (i) PDSI_PM[CO2], respectively. The solid curves represent the ensemble mean of 16 CMIP5 models and the shading represents the range by individual models. The time series are averaged over global land areas excluding Greenland and Antarctica.
3.2 The effect of warming on drought changes
Warming has been identified as the key driver of the overall future drought increase in numerous previous studies (Cook et al., 2014, 2015; Dai, 2011, 2012; Dai et al., 2018; Huang et al., 2016, 2017; Lehner et al., 2017; Liu et al., 2018). To further understand the impact of warming on drought changes, we assessed changes in PDSI_CMIP5 at 1.5 ∘C and 2 ∘C warming above the pre-industrial level. The PDSI_PM-RC is also presented for comparison. Any substantial increase in drought is identified when PDSI for a future warming target decreased by 1.0 compared to PDSI during the 1986–2005 baseline (i.e., ΔPDSI ). Additionally, only places where the ΔPDSI threshold is reached in at least 8 CMIP5 models (out of the 16 CMIP5 models, so 50 % and more) are considered to be robust projections and thus used herein. Based on the PDSI_CMIP5, our results show that almost nowhere on earth (only 0.06 % of the global land area) is projected to have a substantial drought increase at the 1.5 ∘C warming target, and this number only slightly increases to 0.77 % at the 2 ∘C warming target (Fig. 6a and b). In comparison, substantial increase in drought is identified at 5.10 % and 13.41 % of the global land area at the two warming targets, respectively, when PDSI_PM-RC is used (Fig. 6a and c). More places are projected to have a substantial drought increase under future warming if we relaxed the threshold of PDSI change to −0.5 (i.e., ΔPDSI ) (Fig. 6d–f). Nevertheless, the PDSI_CMIP5 still shows a considerable smaller percentage of drying lands (6.2 % and 10.0 %) than the PDSI_PM-RC (26.32 % and 34.77 %) under the two warming targets, respectively, particularly over North America, much of Amazonia, Europe, the Congo basin, and southeastern China.
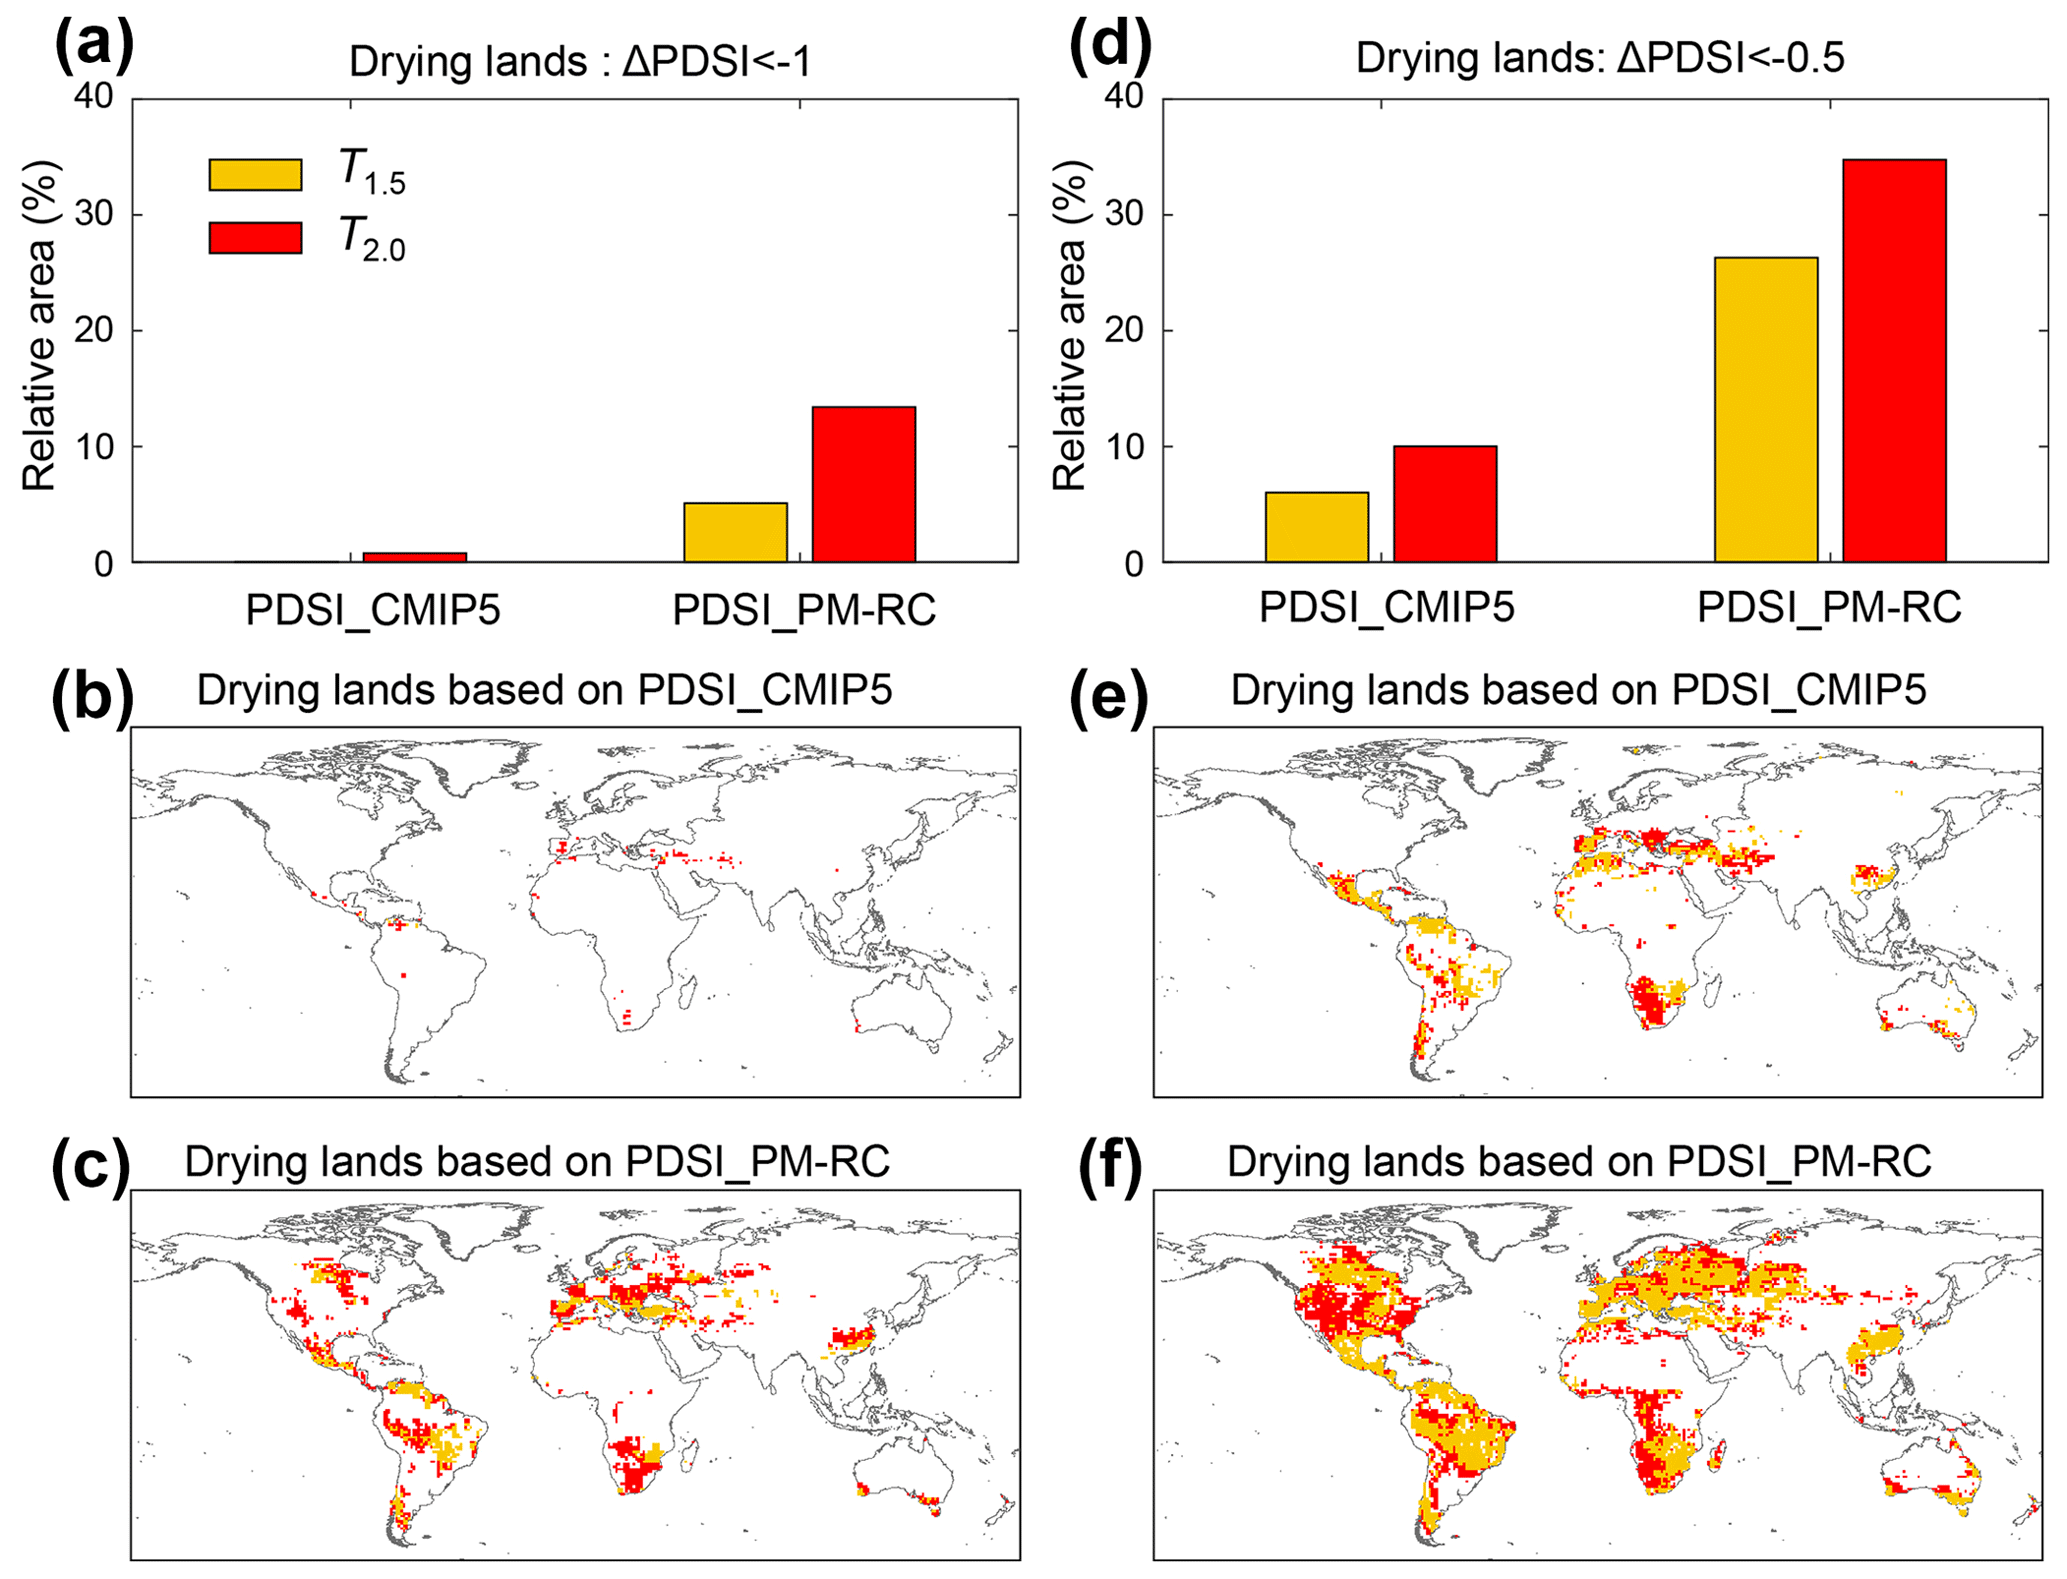
Figure 6Areas with substantial drought increase under future warming. (a) Relative land area with substantial drought increase (ΔPDSI < −1.0) under 1.5 and 2 ∘C warming based on PDSI_CMIP5 and PDSI_PM-RC. (b, c) Spatial pattern of substantial drought increase (ΔPDSI ) under 1.5 and 2 ∘C warming based on (b) PDSI_CMIP5 and (c) PDSI_PM-RC. (d–f) Similar to panels (a)–(c) but for ΔPDSI .
The above results clearly demonstrate an overestimation of drought severity, frequency, and extent using PDSI in many previous assessments of future drought (e.g., Cook et al., 2014, 2015; Dai, 2011, 2012; Dai et al., 2018; Lehner et al., 2017; Liu et al., 2018). The overestimation is primarily caused by neglecting the impact of elevated [CO2] on rs and consequently on EP in the traditional offline calculation. As EP is neither used nor produced by climate models, an offline intermediate EP model is required to estimate EP based on climate model outputs. However, conventional EP models, such as the open-water Penman model and the reference crop Penman–Monteith model, involve an important assumption that rs remains constant over time (Allen et al., 1998; Shuttleworth, 1993). This assumption is in general valid for water surfaces and/or wet bare soils but is not valid over vegetated surfaces. Over vegetated surfaces, on the one hand, elevated [CO2] leads to a partial stomatal closure that increases rs (e.g., Ainsworth and Rogers, 2007), yet on the other hand, elevated [CO2] has “fertilized” vegetation resulting in an increased foliage cover (e.g., Donohue et al., 2013; Zhu et al., 2016), which effectively suggests a reduction in rs. In addition, elevated [CO2] serves as the ultimate driver of climate warming in the CMIP5 models and consequently leads to an increase in atmospheric vapor pressure deficit, which also tends to increase rs (Lin et al., 2018; Novick et al., 2016).
While the net effect of elevated [CO2] on rs is still uncertain in the real world, a recent study clearly showed that in CMIP5 models, elevated [CO2] increases rs, which, with all else equal, results in a decrease in EP and thus E (Yang et al., 2019). Yang et al. (2019) also showed that over vegetated surfaces, an increase in EP caused by warming-induced vapor pressure deficit increase is almost entirely offset by a decrease in EP caused by the increase in rs driven by elevated [CO2] in CMIP5 models. This suggests that climate change does not necessarily lead to a higher EP over vegetated surfaces and hence increased drought under [CO2] enrichment, which is consistent with CMIP5 model projections yet contradicts the perception that “warming leads to drying” presented in many previous studies (Cook et al., 2014, 2015; Dai, 2011, 2012; Dai et al., 2018; Huang et al., 2016, 2017; Lehner et al., 2017; Liu et al., 2018; Park et al., 2018; Samaniego et al., 2018; Sternberg, 2011; Trenberth et al., 2014). Additionally, it is worthwhile mentioning that the CMIP5 models do project topsoil moisture (within the top 10 cm) declines with a very similar spatial pattern to changes in PDSI_PM-RC (Dai, 2012; Dai et al., 2018), which might be important for wildfire risk and various biological processes that take place close to the surface. However, since no systematic decline in runoff or in relevant vegetation parameters (e.g., leaf area index and gross/net primary production) seems to result from it (Greve et al., 2017; Milly and Dunne, 2016, 2017; Roderick et al., 2015; Swann et al., 2016; Yang et al., 2019), this decline in topsoil moisture in the CMIP projections seems to have little influence from the vegetation and hydrological perspectives. This is likely as root-zone or deeper soil moisture that is of more agricultural/ecological and/or hydrological significance is projected to remain more or less unchanged (Berg et al., 2017; Greve et al., 2017), consistent with PDSI_CMIP5 and PDSI_PM[CO2] (Fig. 3).
Here, we use PDSI as an illustrating case, but note that similar results were also found in another commonly used drought index (i.e., the Standardized Precipitation-Evapotranspiration Index, or SPEI; Vicente-Serrano et al., 2010) (Fig. S3). Nevertheless, both PDSI and SPEI, as well as other drought/aridity metrics, are secondary offline impact models. Since climate models are fully coupled land (and ocean)–atmosphere models that are an internally consistent representation of the climate system (Milly and Dunne, 2016), a scientific prior of applying any offline hydrological impact models is that the adopted offline model must be able to recover the hydrological simulations generated by the climate models (Roderick et al., 2015; Milly and Dunne, 2017; Yang et al., 2019). Otherwise, any inconsistency in hydrological predictions between offline impact models and climate models themselves would lead to inconsistent predictions in other components of the climate system. Unfortunately, this important scientific prior has been largely ignored in many previous drought assessment studies, leading to biased drought predictions that are actually inconsistent with the climate model outputs.
In summary, we have shown that climate model projections of the global drought area under future climate change have been largely overestimated. Our results suggest that the “warming leads to drying” perception may be fundamentally flawed, primarily due to ignoring the vegetation response to elevated [CO2] (also see Yang et al., 2019). However, despite a small overall trend globally, we find that both drying and wetting areas are simulated to increase towards the end of this century (Figs. 5 and S4), suggesting an increased variability in surface hydrological conditions that will likely be associated with increased droughts and/or floods and reduced reliability of available water at local/regional scales (e.g., Kumar et al., 2014). In this light, attention should be paid to regions where droughts and/or floods are projected to most likely increase (e.g., Mediterranean Europe and central America), and more efforts may be needed to mitigate the consequent impact there under climate change.
Matlab codes with worked examples of the different PDSIs can be accessed through https://doi.org/10.5281/zenodo.3871420 (zslthu, 2020).
The data that support the findings of this study are openly available at https://esgf-node.llnl.gov/search/cmip5/ (Lawrence Livermore National Laboratory, 2020).
The supplement related to this article is available online at: https://doi.org/10.5194/hess-24-2921-2020-supplement.
YY and MLR designed the study. SZ and YY performed the calculation. YY drafted the manuscript. TRM, DY, WL, and XL contributed to results discussion and modified the text.
The authors declare that they have no conflict of interest.
We thank the HESS editor and three reviewers for constructive comments that improved the study.
This research has been supported by the National Natural Science Foundation of China (grant no. 41890821), the Qinghai Department of Science and Technology (grant no. 2019-SF-A4), the Ministry of Science and Technology of China (grant no. 2019YFC1510604), the Australian Research Council (grant no. CE170100023), and CSIRO Land and Water.
This paper was edited by Ryan Teuling and reviewed by three anonymous referees.
Ainsworth, A. E. and Rogers, A.: The response of photosynthesis and stomatal conductance to rising [CO2]: mechanisms and environmental interactions, Plant Cell Environ., 30, 258–270, https://doi.org/10.1111/j.1365-3040.2007.01641.x, 2007.
Alkama, R., Marchand, L., Ribes, A., and Decharme, B.: Detection of global runoff changes: results from observations and CMIP5 experiments, Hydrol. Earth Syst. Sci., 17, 2967–2979, https://doi.org/10.5194/hess-17-2967-2013, 2013.
Allen, R. G., Pereira, L. S., Raes, D., and Smith, M.: Crop Evapotranspiration-guidelines for Computing Crop Water Requirements, FAQ Irrigation and Drainage Paper 56, FAO, Rome, Italy, 300 pp., 1998.
Berg, A., Sheffield, J., and Milly, P. C. D.: Divergent surface and total soil moisture projections under global warming, Geophys. Res. Lett., 44, 236–244, https://doi.org/10.1002/2016GL071921, 2017.
Cook, B. I., Smerdon, J. E., Seager, R., and Coats, S.: Global warming and 21st century drying, Clim. Dynam., 43, 2607–2627, https://doi.org/10.1007/s00382-014-2075-y, 2014.
Cook, B. I., Ault, T. R., and Smerdon, J. E.: Unprecedented 21st century drought risk in the American Southwest and Central Plains Science, Advances, 1, e1400082, https://doi.org/10.1126/sciadv.1400082, 2015.
Dai, A.: Drought under global warming: a review, WIRES Clim. Change, 2, 45–65, https://doi.org/10.1002/wcc.81, 2011.
Dai, A.: Increasing drought under global warming in observations and models, Nat. Clim. Change, 3, 52–58, https://doi.org/10.1038/nclimate1633, 2012.
Dai, A., Zhao, T., and Chen, J.: Climate Change and Drought: a Precipitation and Evaporation Perspective, Current Clim. Change Reports, 4, 301–312, https://doi.org/10.1007/s40641-018-0101-6, 2018.
Donohue, R. J., Roderick, M. L., McVicar, T. R., and Farquhar, G. D.: Impact of CO2 fertilization on maximum foliage cover across the globe's warm, arid environments, Geophys. Res. Lett., 40, 3031–3035, https://doi.org/10.1002/grl.50563, 2013.
Greve, P., Roderick, L. R., and Seneviratne, S. I.: Simulated changes in aridity from the last glacial maximum to 4×CO2, Environ. Res. Lett., 12, 114021, https://doi.org/10.1088/1748-9326/aa89a3, 2017.
Hawkins, E., Ortega, P., Suckling, E., Schurer, A., Hegerl, G., Jones, P., Joshi, M., Osborn, T. J., Masson-Delmotte, V., Mignot, J., Thorne, P., and van Oldenborgh, G. J.: Estimating Changes in Global Temperature since the Preindustrial Period, B. Am. Meteorol. Soc., 98, 1841–1856, https://doi.org/10.1175/BAMS-D-16-0007.1, 2017.
Huang, J., Yu, H., Guan, X., Wang, G., and Guo, R.: Accelerated dryland expansion under climate change, Nat. Clim. Change, 6, 166–171, https://doi.org/10.1038/nclimate2837, 2016.
Huang, J., Yu, H., Dai, A., Wei, Y., and Kang, L.: Drylands face potential threat under 2 ∘C global warming target, Nat. Clim. Change, 7, 417–422, https://doi.org/10.1038/nclimate3275, 2017.
Jones, P. W.: First- and Second-Order Conservative Remapping Schemes for Grids in Spherical Coordinates, Mon. Weather Rev., 127, 2204–2210, https://doi.org/10.1175/1520-0493(1999)127<2204:FASOCR>2.0.CO;2, 1999.
Kumar, S., Lawrence, D. M., Dirmeyer, P. A., and Sheffield, J.: Less reliable water availability in the 21st century climate projections, Earth's Future, 2, 152–160, https://doi.org/10.1002/2013EF000159, 2014.
Labat, D., Goddéris, Y., Probst, J. L., and Guyot, J. L.: Evidence for global runoff increase related to climate warming, Adv. Water Resour., 27, 631–642, https://doi.org/10.1016/j.advwatres.2004.02.020, 2014
Lawrence Livermore National Laboratory: CMIP5 project data, Department of Energy, available at: https://esgf-node.llnl.gov/search/cmip5/, last access: 2 June 2020.
Lian, X., Piao, S., Huntingford, C., Li, Y., Zeng, Z., Wang, X., Ciais, P., McVicar, T., Peng, S., Ottle, C., Yang, H., Yang, Y., Zhang, Y., and Wang, T.: Partitioning global land evapotranspiration using CMIP5 models constrained by observations, Nat. Clim. Change, 8, 640–646, https://doi.org/10.1038/s41558-018-0207-9, 2018.
Lehner, F., Coats, S., Stocker, T. F., Pendergrass, A. G., Sanderson, B. M., Raible, C. C., and Smerdon, J. E.: Projected drought risk in 1.5 ∘C and 2 ∘C warmer climates, Geophys. Res. Lett., 44, 7419–7428, https://doi.org/10.1002/2017GL074117, 2017.
Lemordant, L., Gentine, P., Swann, A. S., Cook, B. I., and Scheff, J.: Critical impact of vegetation physiology on the continental hydrologic cycle in response to increasing CO2, P. Natl. Acad. Sci. USA, 115, 4093–4098, https://doi.org/10.1073/pnas.1720712115, 2018.
Lin, C., Gentine, P., Huang, Y., Guan, K., Kimm, H., and Zhou, S.: Diel ecosystem conductance response to vapor pressure deficit is suboptimal and independent of soil moisture, Agr. Forest Meteorol., 15, 24–34, https://doi.org/10.1016/j.agrformet.2017.12.078, 2018.
Liu, W., Sun, F., Lim, W. H., Zhang, J., Wang, H., Shiogama, H., and Zhang, Y.: Global drought and severe drought-affected populations in 1.5 and 2 °C warmer worlds, Earth Syst. Dynam., 9, 267–283, https://doi.org/10.5194/esd-9-267-2018, 2018.
Milly, P. C. D. and Dunne, K. A.: Potential evapotranspiration and continental drying, Nat. Clim. Change, 6, 946–949, https://doi.org/10.1038/nclimate3046, 2016.
Milly, P. C. D. and Dunne, K. A.: Hydrologic Drying Bias in Water-Resource Impact Analyses of Anthropogenic Climate Change, J. Am. Water Resour. Assoc., 53, 822–838, https://doi.org/10.1111/1752-1688.12538, 2017.
Naumann, G., Alfieri, L., Wyser, L., Mentaschi, L., Betts, R. A., Carrao, H., Spinoni, J., Vogt, J., and Feyen, L.: Global Changes in Drought Conditions under Different Levels of Warming, Geophys. Res. Lett., 45, 3285–3296, https://doi.org/10.1002/2017GL076521, 2018.
Novick, K. A., Ficklin, D. L., Stoy, P., Williams, C. A., Bohrer, G., Oishi, A. C., Papuga, S. A., Blanken, P. D., Noormets, A., Sulman, B. N., Scott, R. L. Wang, L., and Phillips, R. P.: The increasing importance of atmospheric demand for ecosystem water and carbon fluxes, Nat. Clim. Change, 6, 1023–1027, https://doi.org/10.1038/nclimate3114, 2016.
Palmer, W. C.: Meteorological drought Research Paper No. 45, US Department of Commerce Weather Bureau, Washington, D.C., USA, 58 pp., 1965.
Park, C.-E., Jeong, S., Joshi, M., Osborn, T. J., Ho, C. H., Piao, S., Chen, D., Liu, J., Yang, H., Park, H., Kim, B. M., and Feng, S.: Keeping global warming within 1.5 ∘C constrains emergence of aridification, Nat. Clim. Change, 8, 70–74, https://doi.org/10.1038/s41558-017-0034-4, 2018.
Roderick, M. L., Greve, P., and Farquhar, G. D.: On the assessment of aridity with changes in atmospheric CO2, Water Resour Res., 51, 5450–5463, https://doi.org/10.1002/2015WR017031, 2015.
Samaniego, L., Thober, S., Kumar, R., Wanders, N., Rakovec, O., Pan, M., Zink, M., Sheffield, J., and Wood, E. F.: Anthropogenic warming exacerbates European soil moisture droughts, Nat. Clim. Change, 8, 421–426, https://doi.org/10.1038/s41558-018-0138-5, 2018.
Scheff, J., Seager, R., Liu, H. B., and Coats, S.: Are glacials dry? Consequences for paleoclimatology and for greenhouse warming, J. Climate, 30, 6593–6609, https://doi.org/10.1175/JCLI-D-16-0854.1, 2017.
Schleussner, C. F., Rogelj, J., Schaeffer, M., Lissner, T., Licker, R., Fischer, E. M., Knutti, R., Levermann, A., Frieler, K., and Hare, M.: Science and policy characteristics of the Paris Agreement temperature goal, Nat. Clim. Change, 6, 827–835, https://doi.org/10.1038/nclimate3096, 2016.
Sheffield, J., Wood, E. F., and Roderick, M. L.: Little change in global drought over the past 60 years, Nature, 491, 435–438, https://doi.org/10.1038/nature11575, 2012.
Sherwood, S. and Fu, Q.: A drier future?, Science, 343, 737–739, https://doi.org/10.1126/science.1247620, 2014.
Shuttleworth, W. J.: Evaporation, in Handbook of Hydrology, edited by: Maidment, D. R., McGraw-Hill Education, New York, USA, 98–144, 1993.
Sternberg, T.: Regional drought has a global impact, Nature, 472, p. 169, https://doi.org/10.1038/472169d, 2011.
Swann, A. L. S., Hoffman, F. M., Koven, C. D., and Randerson, J. T.: Plant responses to increasing CO2 reduce estimates of climate impacts on drought severity, P. Natl. Acad. Sci. USA, 113, 10019–10024, https://doi.org/10.1073/pnas.1604581113, 2016.
Taylor, K. E., Stouffer, R. J., and Meehl, G. A.: An Overview of CMIP5 and the Experiment Design, B. Am. Meteorol. Soc., 93, 485–498, https://doi.org/10.1175/BAMS-D-11-00094.1, 2012.
Trenberth, K. E., Dai, A., van der Schrier, G., Jones, P. D., Barichivich, J., Briffa, K. R., and Sheffield, J.: Global warming and changes in drought, Nat. Clim. Change, 4, 17–22, https://doi.org/10.1038/nclimate2067, 2014.
UNFCCC: Adoption of the Paris Agreement, Proposal by the President Report No. FCCC/CP/2015/L.9, United Nations, Geneva, Switzerland, 2015.
Vicente-Serrano, S. M., Begueria, S., and Lopez-Moreno, J. I. A.: A Multiscalar Drought Index Sensitive to Global Warming: The Standardized Precipitation Evapotranspiration Index, J. Climate, 23, 1696–1718, https://doi.org/10.1175/2009JCLI2909.1, 2010.
Yang, Y. T., Zhang, S., McVicar, T. R., Beck, H. E., Zhang, Y. Q., and Liu, B.: Disconnection between trends of atmospheric drying and continental runoff, Water Resour. Res., 54, 4700–4713, https://doi.org/10.1029/2018WR022593, 2018.
Yang, Y. T., Roderick, M. L., Zhang, S., McVicar, T. R., and Donohue, R. J.: Hydrologic implications of vegetation response to elevated CO2 in climate projections, Nat. Clim. Change, 9, 44–48, https://doi.org/10.1038/s41558-018-0361-0, 2019.
Zhang, Y. Q., Peña-Arancibia, J., McVicar, T., Chiew, F., Vaze, J., Liu, C., Lu, X., Zheng, H., Wang, Y., Liu, Y., Miralles, M., and Pan, M.: Multi-decadal trends in global terrestrial evapotranspiration and its components, Sci. Rep., 6, 19124, https://doi.org/10.1038/srep19124, 2016.
Zhu, Z., Piao, S., Myneni, R. B., Huang, M., Zeng, Z., Canadell, J. G., Ciais, P., Sitch, S., Friedlingstein, P., Arneth, A., Cao, C., Cheng, L., Kato, E., Koven, C., Li, Y., Lian, X., Liu, Y., Liu, R., Mao, J., Pan, Y., Peng, S., Peñuelas, J., Poulter, B., Pugh, T., Stocker, B. D., Viovy, N., Wang, X., Wang, Y., Xiao, Z., Yang, H., Zaehle, S., and Zeng N.: Greening of the earth and its drivers, Nat. Clim. Change, 6, 791–795, https://doi.org/10.1038/nclimate3004, 2016.
zslthu: zslthu/Calculate-PDSI-in-Matlab: Calculate-PDSI-in-Matlab (Version v1.0.0), Zenodo, https://doi.org/10.5281/zenodo.3871420, 2020.