the Creative Commons Attribution 4.0 License.
the Creative Commons Attribution 4.0 License.
 | 28 Jan 2020
On the role of operational dynamics in biogeochemical efficiency of a soil aquifer treatment system
Shany Ben Moshe
Noam Weisbrod
Felix Barquero
Jana Sallwey
Ofri Orgad
Alex Furman
Sustainable irrigation with treated wastewater (TWW) is a promising solution for water scarcity in arid and semi-arid regions. Soil aquifer treatment (SAT) provides a solution for both the need for tertiary treatment and seasonal storage of wastewater. Stresses over land use and the need to control the obtained water quality makes the optimization of SAT of great importance. This study looks into the influence of SAT systems' operational dynamics (i.e., flooding and drying periods) as well as some aspects of the inflow biochemical composition on their biogeochemical state and the ultimate outflow quality. A series of four long-column experiments was conducted, aiming to examine the effect of different flooding/drying period ratios on dissolved oxygen (DO) concentrations, oxidation–reduction potential (ORP) and outflow composition. Flooding periods were kept constant at 60 min for all experiments while drying periods (DPs) were 2.5 and 4 times the duration of the flooding periods. Our results show that the longer DPs had a significant advantage over the shorter periods in terms of DO concentrations and ORP in the upper parts of the column as well as in the deeper parts, which indicates that larger volumes of the profile were able to maintain aerobic conditions. DO concentrations in the deeper parts of the column stabilized at ∼3–4 mg L−1 for the longer DPs compared to ∼1–2 mg L−1 for the shorter DPs. This advantage was also evident in outflow composition that showed significantly lower concentrations of -N, dissolved organic carbon (DOC) and total Kjeldahl nitrogen (TKN) for the longer DPs (∼0.03, ∼1.65 and ∼0.62 mg L−1 respectively) compared to the shorter DPs (∼0.5, ∼4.4 and ∼3.8 mg L−1, respectively). Comparing experimental ORP values in response to different DPs to field measurements obtained in one of the SAT ponds of the SHAFDAN, Israel, we found that despite the large-scale differences between the experimental 1-D system and the field 3-D conditions, ORP trends in response to changes in DP, qualitatively match. We conclude that longer DP not only ensure oxidizing conditions close to the surface, but also enlarge the active (oxidizing) region of the SAT. While those results still need to be verified at full scale, they suggest that SAT can be treated as a pseudo-reactor that to a great extent could be manipulated hydraulically to achieve the desired water quality while increasing the recharge volumes.
- Article
(1768 KB) -
Supplement
(858 KB) - BibTeX
- EndNote


Water shortages in arid and semi-arid regions lead to great difficulties sustaining local agriculture which have many economic, social and environmental implications (García-Tejero et al., 2014). The use of treated wastewater (TWW) for irrigation is widely accepted as a mean to reduce agricultural water scarcity (Negewo et al., 2011). While biological treatments like activated sludge are highly efficient in terms of pollutant removal, the TWW they generate usually does not meet regulatory standards for unrestricted crop irrigation (Tanji, 1997) or poses a sustainability question regarding their practice (Assouline et al., 2016). For example, in the Israeli Dan region wastewater treatment plant (the SHAFDAN site), following the activated sludge secondary treatment, TWW have low to moderate organic loads. Dissolved organic carbon (DOC) is ∼10.8 mg L−1, -N is ∼4.2 mg L−1 and organic nitrogen is ∼1.25 mg L−1 (Icekson et al., 2011). However, for the TWW to meet regulatory standards for unlimited irrigation, further water quality enhancement is required (Shuval et al., 1986). Soil aquifer treatment (SAT) may be the supplementary treatment component for conventional (secondary) WW treatment, needed to meet regulations and sustainability. These systems involve clusters of infiltration ponds through which TWW is infiltrated through the vadose zone, into the aquifer in cycles of flooding and drying. This form of operation (i.e., flooding and drying cycles) is important for both sustaining infiltration rates (Ganot et al., 2017) and rates of microbially driven oxidation and reduction processes. In the ponds and subsequently in the unsaturated zone, residual dissolved organic carbon (DOC) and other nutrients (like organic and inorganic nitrogen species) are involved in biogeochemical processes (such as adsorption to the soil minerals, consumption by bacteria, etc.) which result in a further decrease in the TWW's organic load and overall improved chemical composition (Bouwer, 1991; Amy and Drewes, 2007).
In Israel, ∼150 million m3 of wastewater (WW) are treated each year in the SHAFDAN facility (Icekson et al., 2011). After the SAT process, the TWW is transported to the south of Israel and is used by farmers for crop irrigation (Idelovitch et al., 2003). With the constant rise in population, the site is often not able to treat all the WW it receives, which results in conventionally treated WW being discarded into local streams and the Mediterranean Sea. Clearly, the SAT component is a bottleneck for full utilization of TWW. The SAT mechanism relies on the various biogeochemical processes that take place during TWW infiltration. These processes begin even before the TWW reach the unsaturated zone. Goren et al. (2014) described the variability in carbon and nitrogen species through the hours of the day and in different seasons in a field study conducted at the SHAFDAN site. They found that the chemical composition of the TWW in the infiltration ponds responded to the day and night cycles. For example, during daytime, dissolved oxygen (DO) concentrations increase due to photosynthesis, reaching a maximum in the late afternoon. As a result, TWW that are infiltrated during the day are significantly more oxidized compared to TWW that is infiltrated during the night, affecting the redox state of the soil profile and thus this impact rates of oxidation reactions. Once the TWW reaches the unsaturated zone, oxygen concentrations become a limiting factor that affects the efficiency of some key biogeochemical processes that are crucial for the enhancement of TWW quality. The role of oxygen as a limiting factor in SAT systems is especially prominent in the deeper areas of the vadose zone where natural aeration during the drying periods (DPs) is limited. DOC and nitrogen species' degradation during infiltration depend heavily on processes like aerobic bacteria respiration and nitrification for which DO concentrations are of great importance (Goren et al., 2014). Mienis and Arye (2018) studied nitrogen behavior under the SHAFDAN's infiltration ponds through 40 years of operation. In their study, concentrations of , total Kjeldahl nitrogen (TKN; The total concentration of organic nitrogen and ) and oxidized nitrogen species (, , NO) were monitored, using data from two observation wells, screening different depths of the vadose zone. They found that removal of up to ∼75 % of the total nitrogen occurred in the upper parts of the soil profile (up to ∼70 cm below the ground surface) while the deeper parts had a smaller contribution. This observation led them to the conclusion that inflow concentrations of more than 8.3 mg L−1 of -N will result in a decrease in reclaimed water quality due to and organic nitrogen leakage into the aquifer.
Previous research regarding oxygen behavior in the vadose zone during wetting and drying cycles (Kim et al., 2004; Dutta et al., 2015) emphasize the role of the site's operational dynamics in the reclaimed water quality. During flooding periods (FPs), water content (WC) in the soil profile below the infiltration pond gradually increases (Arye et al., 2011), limiting the scope of diffusive and advective aeration, which is crucial for the replacement of the DO used by bacteria. Hence, DPs play a major role in the overall biogeochemical dynamics of SAT systems (Miller et al., 2006). Looking at oxygen dynamics during wetting and drying cycles in a 1 m sand column, Dutta et al. (2015) found that DO concentrations dropped exponentially in response to each flooding event. They also showed that oxygen partial pressure recovered to its initial value upon the start of the DP. This observation, however, may not hold true for greater depths. In a field-scale study, Miller et al. (2006) described oxygen and nitrogen species concentrations in a ∼2.7 m sandy loam soil profile during cycles of 4 d of wetting and 4 d of drying. They found that deeper than 0.6 m below the ground surface, aeration was limited compared to the upper parts of the profile and that deeper than 1.5 m, the vadose zone was mostly anoxic throughout the wetting and drying cycles (Miller et al., 2006).
In this study we examine the effect of hydraulic operation (i.e., wetting–drying periods) on a 6 m soil profile's biogeochemical dynamics through a series of long-column experiments. We hypothesize that in vadose zones deeper than ∼1–1.5 m, oxidation–reduction potential (ORP) and DO dynamics differ greatly compared to the shallow parts of a soil profile and are affected to a different extent by changes in hydraulic management and inflow composition. We further hypothesize that insufficient DP will have a detrimental effect on the deeper parts of the soil profile and they will eventually result in DO depletion, negative ORP and impaired outflow quality. Correspondingly, increased DP will be especially significant for the deeper parts of the profile which may lead to extension of the aerobic zone to greater depths. Four main long-column experiments were designed to examine the effect of shorter and longer DP as well as inflow composition on the biogeochemical state and dynamics of the soil–water system at different depths and the ultimate outflow chemical composition (especially DOC and nitrogen species).
A 6 m long, 15 cm diameter, stainless steel column was designed. The column consisted of six 1 m modules, each equipped with ports for sensors and sampling equipment. Sensors were located at ports 1, 3, 5, 7, 9 and 13 (Fig. 1). Data acquisition frequency from all sensors was 1 min. The column was packed with soil from the SHAFDAN site according to the soil horizons at the site. The different layers' texture and initial total organic carbon (TOC) content were determined and are described in the Supplement (Fahl and Fischer, 2014).
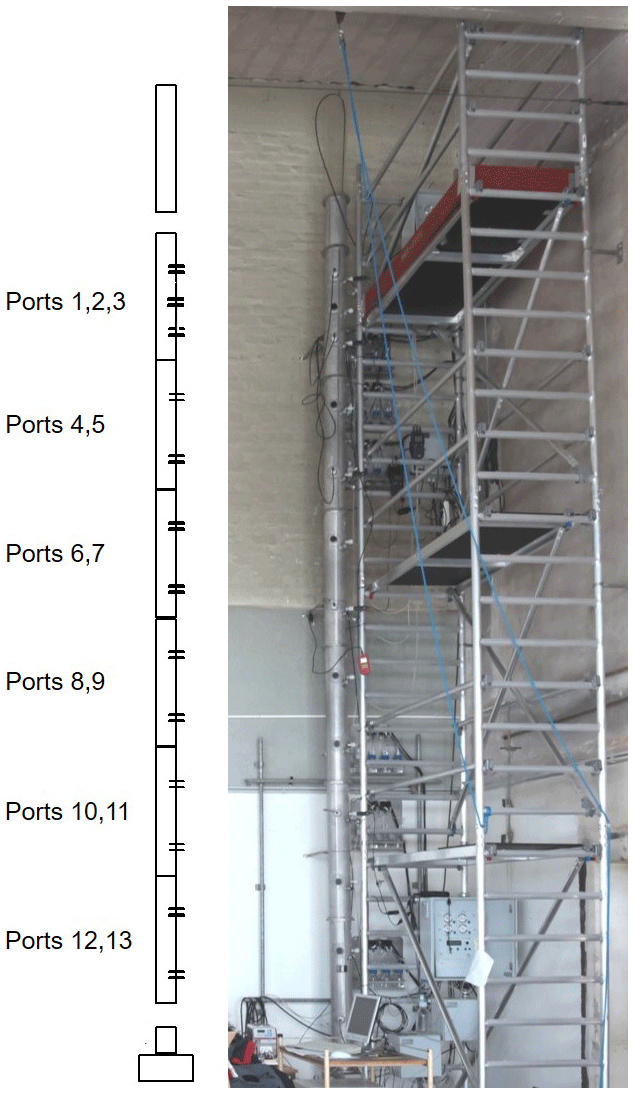
Figure 1The 6 m high column, Dresden, Germany. Sensors were located at ports 1, 3, 5, 7, 9 and 13.
Table 1Inflow composition and flooding/drying periods in the four discussed experiments.
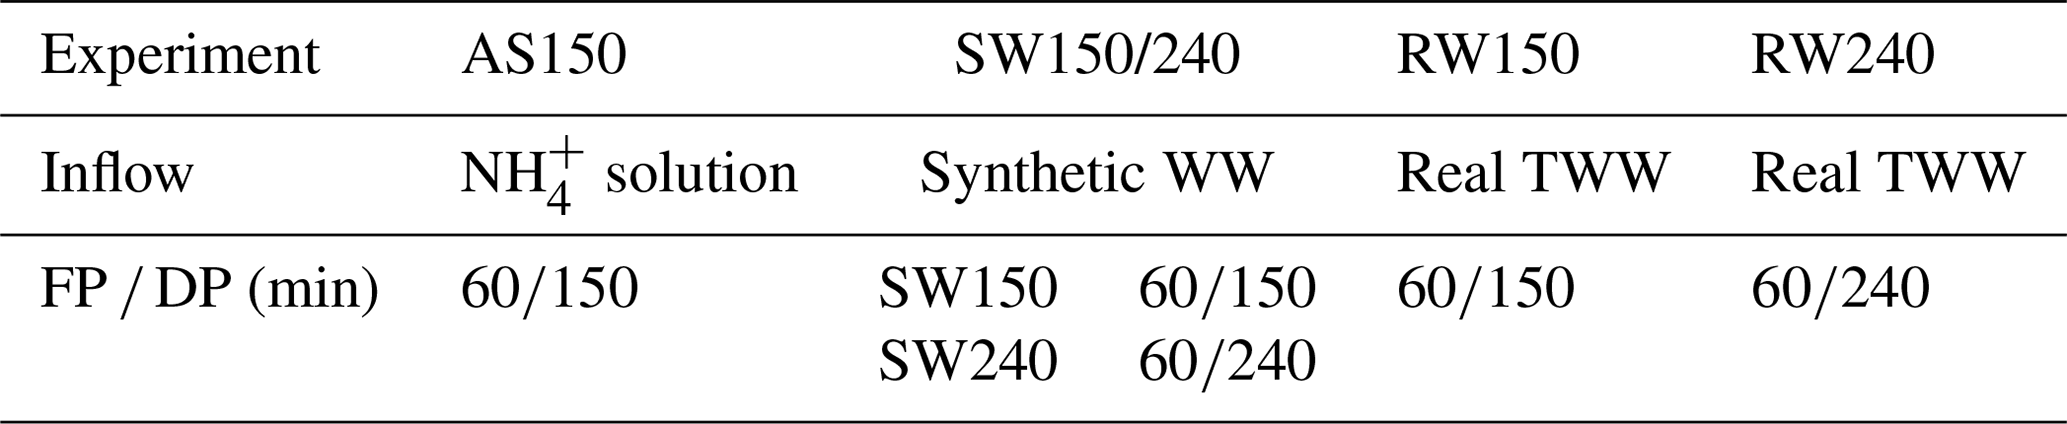
Prior to the four main column experiments (Table 1), a preliminary flow experiment was conducted in order to estimate the average flow rate through the column and the ponding rate. Average flux during infiltration was estimated to be ∼0.4 cm min−1. The first experiment involved a simple inflow solution of only (added to tap water, final concentration of ∼4.5 mg L−1 of -N), where the hydraulic operation consisted of cycles of 60 min of flooding followed by 150 min of drying. The term “flooding period” (FP) refers to the duration of time during which water is pumped to the top of the column. A “drying period” (DP) starts as the pump is turned off and ends at the beginning of a new flooding event. These specific flooding and drying periods were chosen in light of the preliminary experiment's results, in which it was shown that a DP of 150 min is sufficient for the ponding water to infiltrate and allows around 60–70 min of free aeration (i.e., no ponding). One of the goals of the preliminary and the first experiment was to “awaken” the microbial community of the soil system. The second experiment involved the preparation of a synthetic TWW inflow solution which included , glucose and asparagine dissolved in tap water. The synthetic TWW composition was designed to include a moderate-to-heavy load of DOC as well as organic and inorganic nitrogen species around the concentrations found in the SHAFDAN ponds. Glucose was chosen as the main carbon source for two reasons: in addition to the fact that it is often used in synthetic WW for laboratory SAT systems (Essandoh et al., 2011; Ak and Gunduz, 2013), its high consumption rate by bacteria (compared to more complex carbohydrates or humic material) allowed the investigation of the system's behavior around the ranges of ORP values that are found in field SAT systems (Orgad, 2017).
Hydraulic operation for the second experiment included two stages (stages 1 and 2) – we first applied cycles of 60 min of flooding and 150 min of drying, and after nine cycles the DP were increased to 240 min. During the third and fourth experiments, real TWW water from the Dresden wastewater treatment plant (WWTP) were used. Hydraulic operation included 60 min flooding periods for both experiments and DP were 150 min in the third experiment and 240 min in the fourth. Experiments 1, 2 (stages 1 and 2), 3 and 4 are noted here as AS150, SW150, SW240, RW150 and RW240 respectively, where the abbreviations AS, SW and RW denote the TWW source (ammonium solution, synthetic TWW and real TWW respectively) and 150∕240 denote the length of the drying periods in minutes.
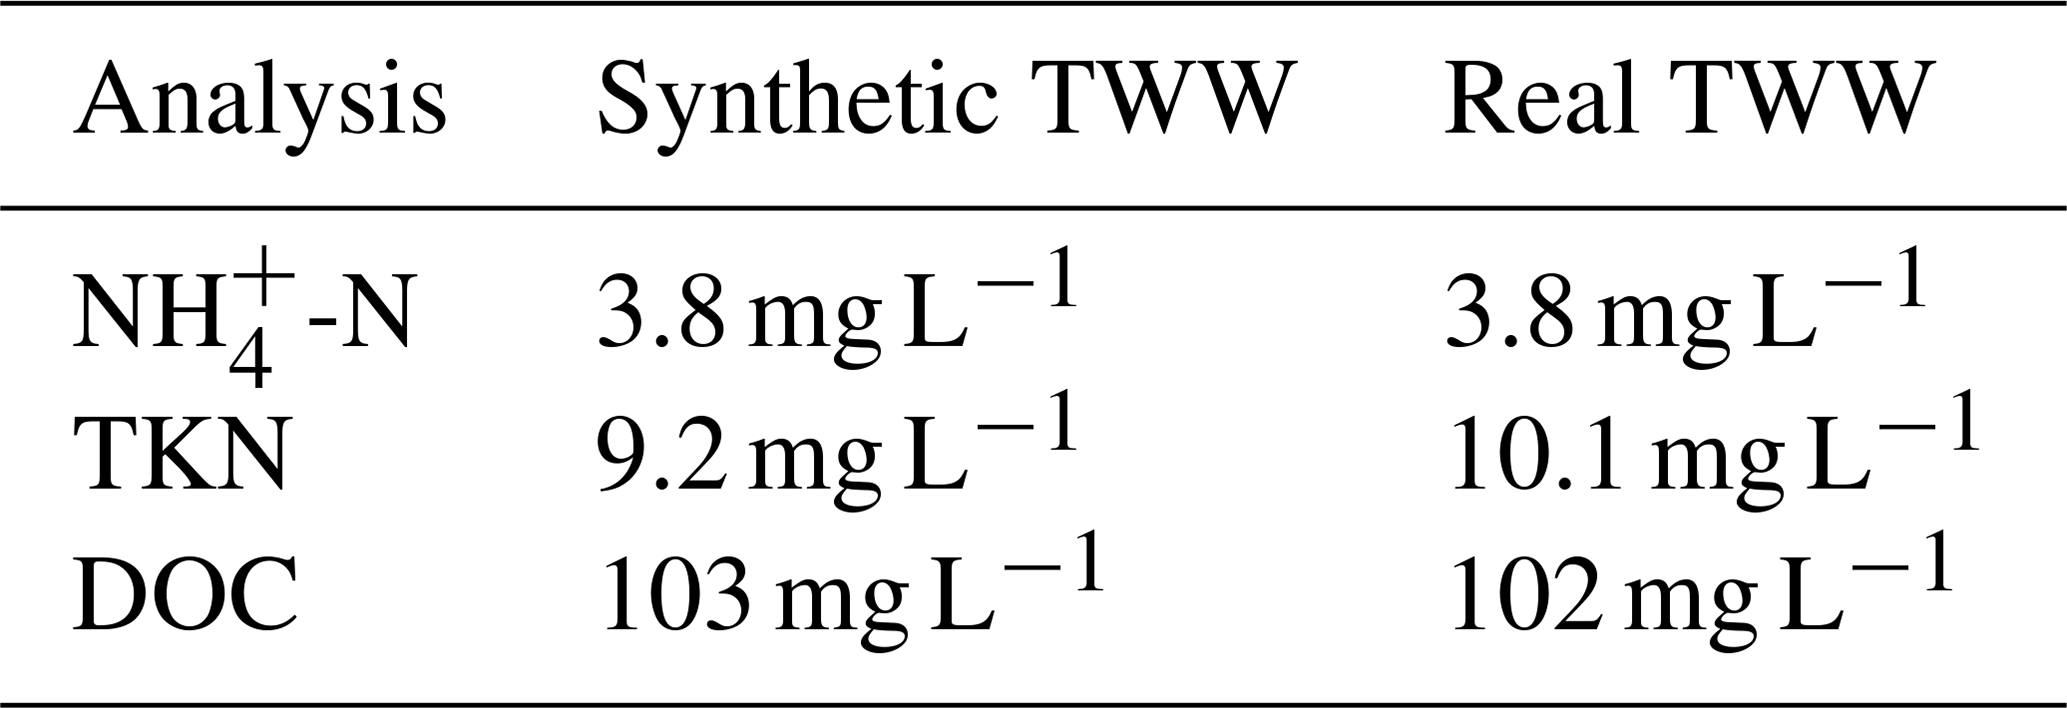
For the synthetic TWW solution the following chemicals were used: L-asparagine, anhydrous (C4H8N2O3, >99.5 %, Sigma Aldrich), ammonium chloride NH4Cl (Jenapharm-Laborchemie APOLDA, >99.8 % pure), D(+)-glucose monohydrate C6H12O6⋅H2O (VWR chemicals PROLABO). The real TWW used for experiments RW150 and RW240 were enriched with glucose and after initial chemical analysis (presented in the Supplement) to match the , TKN and DOC concentrations to those of the synthetic TWW. Final -N, TKN and DOC concentrations for the synthetic and real WW are presented in Table 2.
Table 2Chemical composition of the synthetic WW and the real WW after fortification.
During all experiments, the sensors' information was recorded and pore solution samples were taken from the outflow. Inflow solution was also sampled and tested to confirm that no major changes in its composition occurred during the experiments. Sensors along the column included frequency domain reflectometers (FDRs) for soil moisture measurement (SM300, Delta-T Devices Ltd), and a Submersible Level Sensor (Sensortechnics) was used for the surface head. A number of LDO10101 (Hach-Lange, Germany) were used for luminescence dissolved oxygen (LDO), and Harburg (ELANA Boden Wasser Monitoring) sensors were used to monitor ORP. Tensio 150 (UGT GmbH) tensiometers for the pressure head and ECO Tech Bonn (1.5 cm diameter) ceramics were installed along the column as well. While their data are not shown here, they fully support our presented findings. FDRs and DO sensors were located at depths of 25, 75, 175, 275, 375 and 575 cm. ORP sensors were located in the two upper ports (25 and 75 cm depth).
To assess the chemical composition of the inflow solution as well as the collected samples, four types of chemical analysis were performed: was measured using ammonium test kit and a Nova 30 Spectroquant (Indophenol blue method); and concentrations were measured using an ion chromatograph (IC) after samples were passed through a 0.2 µm filter; TKN was determined using the standard selenium method (ISO 5663:1984); dissolved organic carbon (DOC) was determined using the standard method (ISO 8245:1999) after samples were passed through a 0.45 µm filter and HCl was added to prevent any further organic matter consumption by bacteria.
Figure 2 presents the WC and DO concentrations at four different depths along the profile (25, 75, 175, 275 cm below soil surface), during eight flooding and drying cycles of 60 min of flooding and 150 min of drying (experiment SW150; WC data in a similar manner to Fig. 2 for SW240 is presented in the Supplement). The end of each 60 min long flooding period is indicated by the eight peaks of the surface head in each cycle (Fig. 2a). It is important to note that the soil surface is covered by water for longer than the 60 min of flooding – roughly 140 min in each cycle, which means the time where the soil surface is exposed to the atmosphere is roughly 70 min. In the second stage of this experiment (i.e SW240), where DP were 240 min, the soil surface was actually exposed to the atmosphere for ∼160 min during each cycle (see Supplement). Water front progression through the profile can be retraced by timing the first WC increase following the first FP and as reflected by Fig. 2; it indicates that flow rate decreased during the first few minutes of the experiment (as should be expected following classic infiltration theory; e.g., Green and Ampt model) but stayed relatively constant as the experiment progressed. WC patterns were significantly different between the various depths – while at a depth of 25 cm WC values ranged between 20.5 % and 31.2 %, at a depth of 275 cm below the surface, the maximal WC was 18.4 % and it dropped below 12 % following each DP. Haaken et al. (2016) followed WC patterns in one of the SHAFDAN’s infiltration ponds using electrical imaging. While their work is at the field scale, differences in WC between different depths of the profile agree with our findings (Haaken et al., 2016).
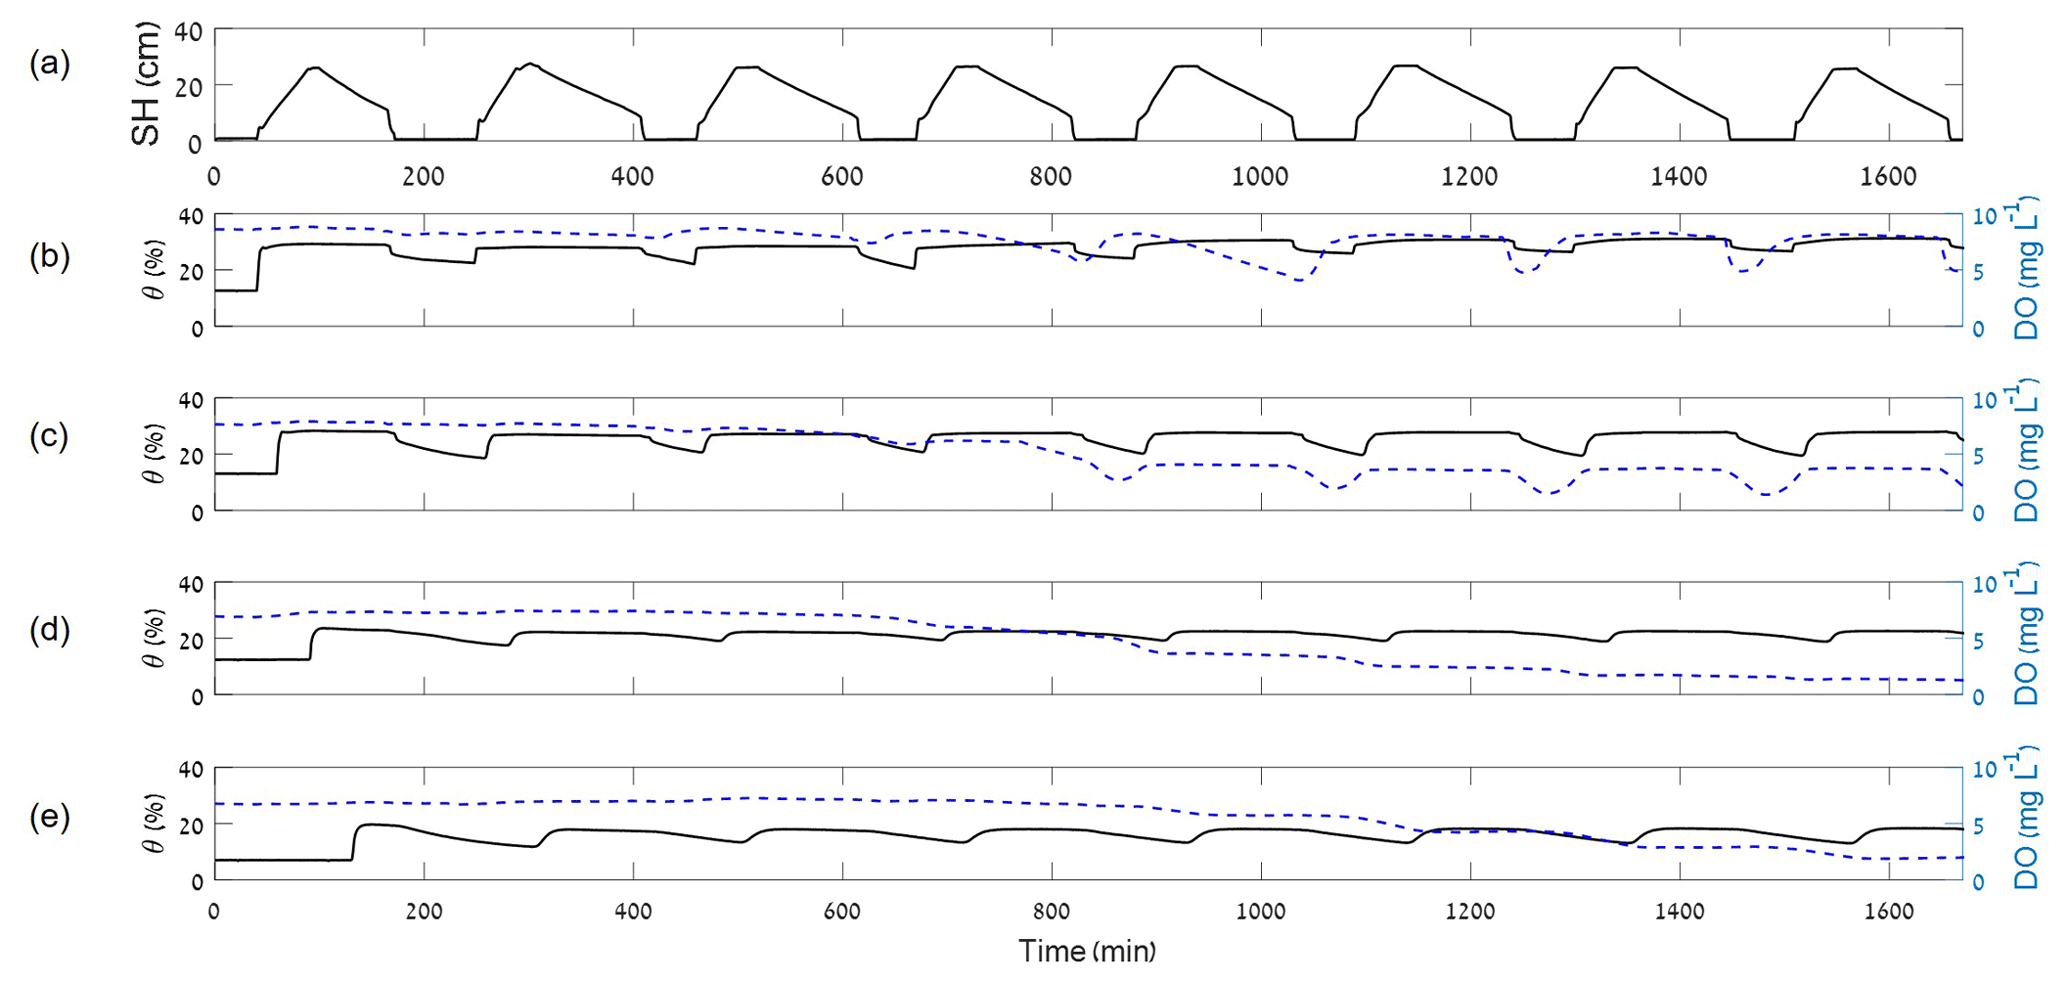
Figure 2Surface head (SH; panel a), water content (θ) and DO over time at depths of 25, 75, 175 and 275 cm below soil surface (panels b, c, d and e, respectively) during SW150.
DO concentrations also displayed different patterns at different depths of the profile (Fig. 2). In the upper parts of the profile (25 cm depth), DO concentration increased in response to each of the DP. In each cycle, the drop in WC caused by the beginning of the DP led to recovery of the DO concentrations and ultimately to complete DO saturation (Fig. 2b). As observed in multiple studies in laboratory and field work, close to the surface, DO concentrations are expected to increase in response to the soil aeration during the DP (Mienis and Arye, 2018; Miller et al., 2006) since regardless of the oxygen movement mechanism (diffusion, advection or convection), the short distance ensures a fast response of the system.
At 75 cm depth (Fig. 2c), while DO recovery is still observed in response to the beginning of DP, aeration is much less effective and DO concentration averages (through the eight cycles) dropped by ∼2.68 mg L−1. During the two first cycles, DO concentrations remained almost constant and close to saturation, but upon the beginning of the third FP, a significant decrease was observed. This decrease resulted in a 25 % drop in DO concentration following all the next DPs. After this initial drop, however, DO patterns and amplitude (following each DP) were sustained through the remaining cycles.
In the deeper parts of the column (Fig. 2d and e), DP induced DO recovery to a much smaller extent. DO concentrations were able to remain relatively high and constant through the first three cycles, likely due to lower nutrient consumption rates by bacteria at these depths, compared to the upper parts of the profile (Quanrud et al., 1996). Note that DO drop at those depths is a bit hindered, compared to the upper layers. However, as the experiment progressed, DO concentrations decreased steadily to almost complete depletion. These results are to be expected in light of previous laboratory and field observations that demonstrated a decline in DO concentrations with depth (Miller et al., 2006; Orgad, 2017). Moreover, DO concentrations along an SAT system's profile are affected by both air movement patterns through the profile during the DP and the consumption of oxygen by bacteria. Since bacterial activity was previously shown to remain relatively unchanged during desiccation(Roberson and Firestone, 1992; Zhang and Yan, 2012), DO recovery is highly dependent on oxygen transport mechanisms during the DP. These advective and diffusive processes depend on exposure of the surface to the atmosphere, but they also depend on the path that air has to pass through, which is farther for greater depths.
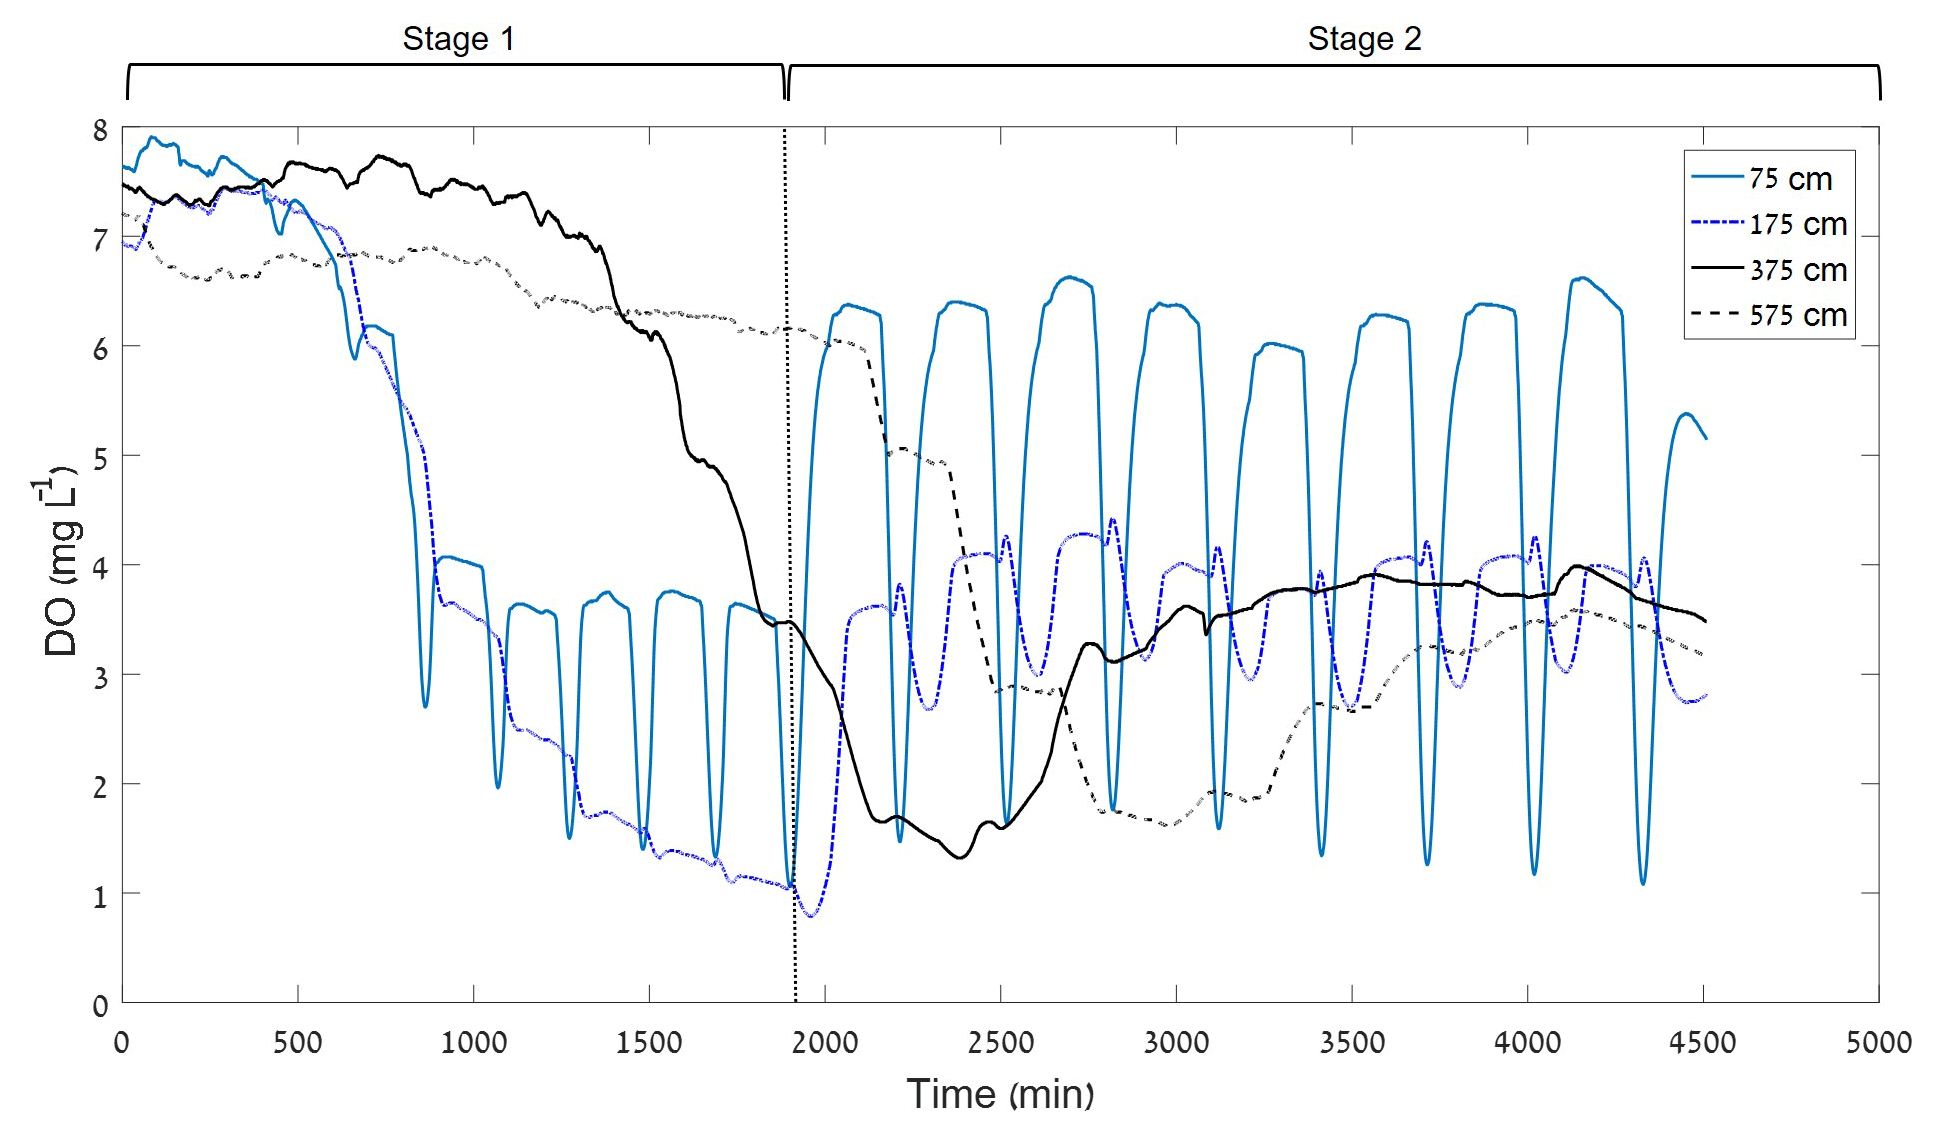
Figure 3DO concentrations at depths of 75, 175, 275 and 575 cm in response to the increase in DP (between SW150 and SW240). Note the convergence of the deep sensors to <2 mg L−1 during the short DP versus convergence to >3 mg L−1 in response to the longer DP.
As reflected by the results of SW150 (Fig. 2), the 150 min DP resulted in significant DO depletion in depths greater than 75 cm. To examine the effect of a change in hydraulic operation (longer DP), we increased the length of the DP to 240 min (60 % increase) after the 10th cycle. Figure 3 presents the DO concentrations at four different depths in the soil profile through the two-stage flooding–drying campaign (experiments SW150 and SW240). By increasing the DP, we increased the time of soil surface's exposure to the atmosphere to ∼160 min on average (compared to ∼70 min on average for SW150) and thus expected to observe increased aeration and some recovery of DO concentrations deeper than 75 cm (where the shorter DPs led to almost full DO depletion). During SW240, WC values at a depth of 75 cm below the surface ranged between ∼18 % and ∼12 % (compared to ∼27 % and ∼17 % for SW150). At depths of 175 and 275 cm below the ground surface, maximal WC were ∼22 % and 18 %, respectively, and minimal WC were ∼16 % and 11 % respectively. At 75 cm depth, shortly following the first longer DP (∼100 min), DO concentrations increased by ∼60 % and reached an average of ∼6.4 mg L−1 following each of the next DPs (compared to an average of ∼3.7 mg L−1 during the shorter DPs, after the initial drop around the third cycle). In the deeper parts of the profile, a delayed, moderate yet significant response to the increase in DP was observed. The delay in response time compared to the DO recovery in the upper most part of the profile increased with depth, corresponding to the expected dynamics of air and oxygen movement through the soil profile (DO recovery was observed after around 2700 min for 375 cm and 3700 min for 575 cm). The minimum DO concentrations recorded through the two-stage experiment averaged 0.79, 1.32 and 1.62 mg L−1 for depths of 175, 375 and 575 cm, respectively. These ranges of DO concentrations below 1.5 m underground are found in many SAT sites around the world (Amy and Drewes, 2007) and explain the negligible aerobic bacteria activity found under these conditions.
Following each of the longer DP, DO concentrations in the 175 cm sensor fluctuated periodically in response to the wetting and drying periods and reached 4.1 mg L−1 following the drying events. In the two deepest sensors, DO concentrations stabilized at ∼3.9 mg L−1 in the 375 cm sensor and ∼3.25 mg L−1 in the 575 cm sensor. Considering the fact that sustaining the shorter DP of SW150 would result in total DO depletion ∼175 cm depth (Supplement), these are very important observations. Clearly, too-short DPs will lead to reducing conditions, at some depth, which as a consequence may lead to insufficient degradation of residual DOC, nitrogen species and possible leaching of undesired minerals and compounds, such as manganese to the deep vadose zone and the aquifer (Goren et al., 2012). In addition, the prominent increase in DO in the deeper parts of the profile indicate that a longer DP means not only enhanced oxidizing conditions at a given depth, but also an increase of the profile volume that did not develop anoxic or anaerobic conditions over the flooding and drying cycles.
Experiments RW150 and RW240 were designed to further examine the effect of the difference in DP duration on the biogeochemical state of the profile and its effect on water quality parameters. In these experiments we used real TWW, collected from the Dresden wastewater treatment plant (WWTP) after the activated sludge process. Similarly to what we observed in SW150 and SW240, longer drying periods had an advantage in terms of DO concentrations along the profile (not shown). ORP measurements in the upper parts of the column (75 cm) revealed that ORP was significantly higher during RW240, ranging between and mV compared to RW150, during which ORP was mostly negative and reached values as low as mV (Supplement).
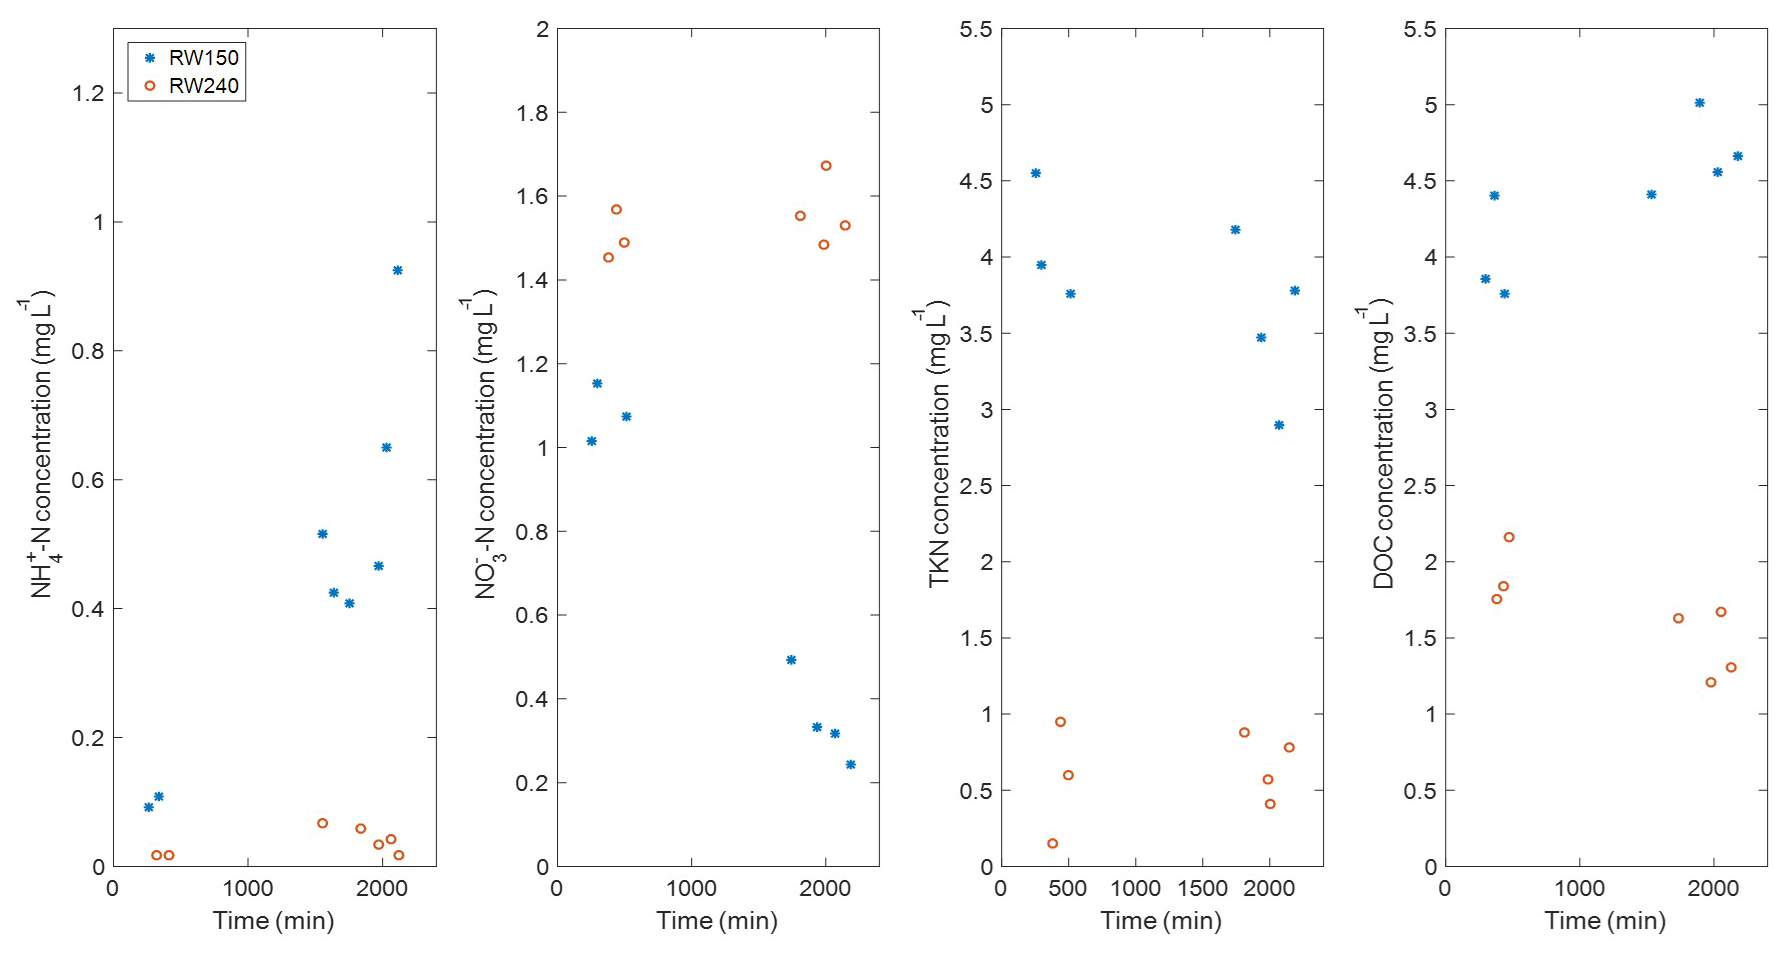
Figure 4Outflow concentrations of -N, -N, TKN and DOC (mg L−1), during shorter (blue) and longer (red) DP (experiments RW150 and RW240 respectively).
Figure 4 presents -N, -N, DOC and TKN and concentrations at the outflow (i.e., 6 m below soil surface), comparing the results for RW150 and RW240. Outflow -N, TKN and DOC concentrations during RW240 (∼ 0.033, ∼0.62 and ∼1.65 mg L−1 respectively) were significantly lower compared to their inflow concentrations. During RW150, -N, TKN and DOC, outflow concentrations (∼0.5, ∼3.8 and ∼4.4 mg L−1, respectively) were also lower compared to the inflow, but averaged significantly higher compared to RW240 (t test, α=0.05), suggesting that the longer DP had a significant positive effect on the outflow quality.
During RW150, -N concentrations were ∼0.1 mg L−1 after ∼400 min from the beginning of the experiment but increased noticeably in the following samples (taken after ∼1500 min), while -N concentrations decreased correspondingly. Considering the DO concentrations recorded during the experiment, this observation is to be expected. Progressively decreasing DO levels were observed at all depths greater than 75 cm starting after ∼850 min from the beginning of the experiment (see DO data for depths of 175 and 275 cm in the Supplement). This suggests that the DO depletion caused by restricted aeration for this duration of time led to decreased rates of nitrogen species' oxidation, which may explain the increase in -N concentrations at the outflow after ∼1500 min. However, looking at the TKN analysis for this experiment, we found that TKN did not significantly increase, suggesting that the increase in -N concentrations occurred simultaneously to a decrease in organic nitrogen concentrations. This behavior may theoretically be attributed to increased rates of ammonification. However, ammonifying bacteria populations have been shown to thrive under DO saturation (Ruan et al., 2009), which makes this possibility unlikely. Since this study did not include microbial identification, further investigation is needed in order to reveal the exact nature of this observation.
Comparison with field observations
In a field study conducted in the Israeli SHAFDAN site in 2015–2016, Orgad (2017) recorded ORP values along the wetting and drying cycles in a series of flooding and drying campaigns over a year. A description of the site operation and characteristics can be found in Orgad (2017), Idelovitch et al. (2003), Icekson et al. (2011) and others. Figure 5a presents the maximal ORP values in these campaigns at a depth of 95 cm below the pond's surface, around 20 m southeast of the inlet. The ensemble of wetting–drying cycles over an entire year assures a wide variety of wetting and drying proportions. The recorded data showed that when DPs were ∼15 h or longer, the maximal ORP values consistently indicated aerobic conditions (and reached mV).
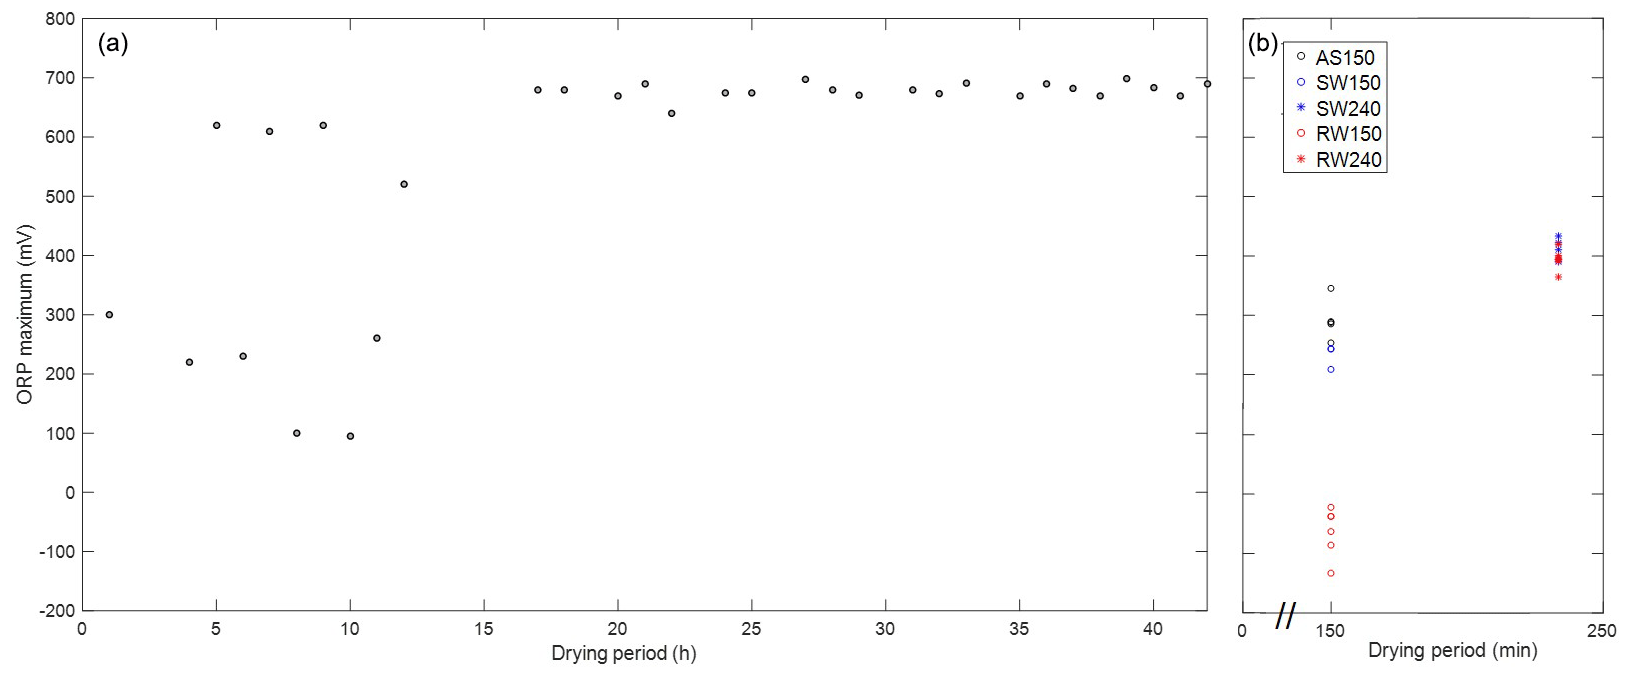
Figure 5Maximal OPR values versus DP length (a) during field infiltration campaigns at the SHAFDAN site (at 95 cm depth) and (b) during the column experiments AS, SW150/240, RW150 and RW240.
Figure 5b presents the same relationship for the column experiments presented above. Despite the major differences in timescales (an order of 2–4 h for column experiments vs. 15 h for field conditions), TWW composition and the system structure and characteristics between our 1-D system and a 3-D full-scale SAT site, our measurements (WC, DO, ORP) qualitatively agree with the field observations. That is, longer DP led to higher (oxidizing) ORP values, while shorter DP led to lower ORP values (reducing conditions). Comparing the ORP values between the field and the column results (Fig. 5a and b), it is clear that there is a non-negligible difference – while ORP values never exceeded +440 mV in the column experiment, values of mV were observed in the field. Moreover, minimal ORP values did not drop below mV in the field, while in the column, negative values of mV were observed. These differences probably stem from the fact that in the column, a 1-D system, air (and water) flow only along the vertical direction while in the field, air flows through the soil profile in all directions and thus allows overall enhanced aeration. Further, in the field the infiltration pond is filled from a single inlet, which means it takes about 10 h for full surface coverage of the pond. This suggests that further from the inlet, lateral air flow is possible even hours after the initial flooding.
The difference in timescales between the column and the field experiments may also suggest a difference in the proportions of the air supply mechanisms to different layers of the subsurface. Mizrahi et al. (2016) have suggested that air (in the gas phase) may be “pushed” downwards once the soil surface is fully flooded by water. While this phenomenon is likely maximized in a column experiment (as the soil-air has no time and no horizontal pathway to be released), this mechanism and its impact were not investigated here. However, it is likely that in field conditions, where lateral air movement is allowed, this mechanism of air supply is of lesser significance, and air movement due to diffusion or air-pressure gradients becomes more dominant.
Interestingly, it is evident from the field data (Fig. 5a) that very long DPs (>20 h) did not present an advantage over DPs of moderate duration (between 15 and 20 h), at least at a depth of 95 cm. Considering the common understanding that most of the biochemical degradation of organic matter at the SHAFDAN SAT site happens at the upper meter or so (Quanrud et al., 1996), DPs of more than 15–20 h seem to have no influence on the oxidation state of the profile. In light of the understanding that longer DP lead not only to increased aeration but also to an increase of the aerobic volume of the soil profile, a combination of longer FP and sufficiently long DP (such that allow this profile aerobic volume increase) may be beneficial for both amounts of TWW that the site is able to treat per unit time as well as reclaimed water quality.
As described in Table 1, two of the four experiments presented in this work (RW150 and RW240) included real TWW, while in the two earlier experiments synthetic TWW were used. To allow comparison between the experiments, their inflow DOC, TKN and -N concentrations were matched (see Supplement) so that the main difference between the two WW sources stems almost entirely from their microbial content (there are likely some differences in micro-nutrients as well). Compared to tap water-based inflow that contained very low concentrations of bacteria, the real TWW collected from the Dresden WWTP had gone through an activated sludge reactor but had not been disinfected. Hence, it contained much larger quantities of microorganisms. During RW150, we observed lower ORP values compared to SW150, identical in terms of FP ∕ DP. The average peak ORP throughout the SW150 was mV while in RW150, the average peak ORP was mV (Fig. 5b), despite the fact that the inflow in both experiments contained similar organic loads. Since both RW150 and SW150 had similar DPs, the lower overall ORP values recorded in RW150 suggest that the difference in ORP stems from oxygen consumption rates. Theoretically, a difference in oxygen consumption rates may stem from either higher concentrations of bacteria or the presence of less easily degradable organic carbon sources in the WW (compared to glucose). Ak and Gunduz (2013) compared organic carbon degradation and DO concentrations between synthetic and real wastewater infiltration in a series of 120 cm soil column experiments. They found that degradation of organic carbon was more efficient for the synthetic WW, which they attributed to the presence of glucose as the main carbon source in the synthetic WW (compared to the less easily biodegradable carbon sources in the real WW). In our experiments, however, the real TWW collected from the Dresden treatment plant had only ∼10 mg L−1 of organic carbon prior to the addition of glucose (i.e., glucose accounted for >90 % of the DOC in the experiments with real TWW). This may suggest that the lower ORP values recorded in RW150 are related to additional oxygen consumption by the microbial community in the influent itself, which therefore may be more dominant in the degradation process than commonly perceived.
In field-scale SAT systems, clogging is an important issue to consider. Throughout the long-column experiments described here, we did not observe significant indications of physical or biological clogging. This is evident by the consistent patterns of surface head along the flooding and drying cycles. Possibly, this is due to the fact that the experimental setup was not exposed to sunlight and therefore algae development is not expected. However, the development of biofilm has an effect on the hydraulic properties of the unsaturated zone (Volk et al., 2016), and since it has been shown that the organic load of the influent is positively correlated to the phenomenon of bioclogging (Rosenzweig and Furman, 2014), this will be an important topic to address when dealing with full-scale sites.
In a series of long column experiments we examined an SAT system response to different hydraulic operation regimes, namely wetting and drying periods. Experiments were conducted using real and synthetic treated wastewater. WC, DO and ORP were monitored along the column, water samples were collected at the outlet and analyzed for nitrogen species and DOC. Hydraulic regimes considered were of 60 min of wetting, and 150 or 240 min of drying (corresponding to and min of the soil surface being ponded/exposed to the atmosphere, respectively).
As could be expected, shorter drainage periods led to higher WC regimes in the subsurface, and lower DO values. Interestingly, the shorter DPs also led to almost complete depletion of the DO throughout the column (below ∼50 cm), and creation of prevailing low ORP values, indicating anoxic to reducing conditions throughout most of the column. Longer DPs, on the other hand, led to oxidizing conditions throughout the column for most of the time. These conditions are also expressed as column outlet water qualities, where longer DP led to better oxidation of , and reduction of total nitrogen as well as DOC. The almost immediate response of the DO concentrations at depth to the surface exposure time to the atmosphere suggests domination of advective oxygen movement in the gaseous phase (over diffusion in the gaseous phase or advection in the liquid phase). These results suggest that longer DPs not only shift the active (oxidizing) part of the system towards oxidizing conditions, but they also make this region larger. To the best of our knowledge, this is the first work to suggest dependence of the aerated part of the vadose zone under SAT upon the DP, rather than a simple consideration of higher aeration of a fixed volume close to the surface.
Longer DPs have their effects – on the one hand, they led to more oxidizing conditions, and to the extension of the oxidizing parts of the variably saturated zone. On the other hand, they led to reduction in the volumes that can be infiltrated and recharged to the aquifer. Clearly these are contrasting objectives that need to be further explored and optimized for a given site. The qualitative similarity between ORP values in these column experiments and those measured at the SHAFDAN site suggest that these findings are also relevant for real conditions, and that such optimization can be conducted also in reality.
To conclude, our results suggest that the variably saturated zone in an SAT system can and should be seen as a pseudo-reactor, in which DO and ORP values can, to a certain extent, be controlled. Longer DP allowed better degradation of , organic nitrogen and organic carbon, but led to reduced infiltration. The immediacy of the DO recovery at depth following sufficient DPs suggests that the ratio between drying and wetting periods is not the parameter that dictates the SAT biogeochemical dynamics, and long-enough DPs (primarily a function of hydraulic properties and desired oxidizing depth) can be followed by much longer wetting periods. However, this has not bet been examined.
The data that support the findings of this study are available from the corresponding author, Shany Ben Moshe, upon reasonable request.
The supplement related to this article is available online at: https://doi.org/10.5194/hess-24-417-2020-supplement.
FB and JS prepared the experimental set up, SBM, AF and NW designed the experiments, OO provided and analyzed the field data, SBM preformed the column experiments, analyzed the data and prepared the paper with contribution of all authors.
The authors declare that they have no conflict of interest.
We wish to thank the German–Israeli Cooperation in Water Technology Research for funding the productive stay in Germany through the Young Scientists Exchange Program (YSEP).
This research has been supported by the German Federal Ministry of Education and Research (BMBF; grant no. 02WIL1451A) and the Israeli Ministry of Science, Technology and Space (MOST; grant no. 2689).
This paper was edited by Marnik Vanclooster and reviewed by three anonymous referees.
Amy, G. and Drewes, J.: Soil aquifer treatment (SAT) as a natural and sustainable wastewater reclamation/reuse technology: Fate of wastewater effluent organic Matter (EfoM) and trace organic compounds, Environ. Monit. Assess., 129, 19–26, https://doi.org/10.1007/s10661-006-9421-4, 2007. a, b
Ak, M. and Gunduz, O.: Comparison of organic matter removal from synthetic and real wastewater in a laboratory-scale soil aquifer treatment system, Water Air Soil Poll., 224, 1467, https://doi.org/10.1007/s11270-013-1467-7, 2013. a, b
Arye, G., Tarchitzky, J., and Chen, Y.: Treated wastewater effects on water repellency and soil hydraulic properties of soil aquifer treatment infiltration basins, J. Hydrol., 397, 136–145, https://doi.org/10.1016/j.jhydrol.2010.11.046, 2011. a
Assouline, S., Narkis, K., Gherabli, R., and Sposito, G.: Combined Effect of Sodicity and Organic Matter on Soil Properties under Long-Term Irrigation with Treated Wastewater, Vadose Zone J., 15, 2–10, https://doi.org/10.2136/vzj2015.12.0158, 2016. a
Bouwer, H.: Ground water recharge with sewage effluent, Water Sci. Technol., 23, 2099–2108, 1991. a
Dutta, T., Carles-Brangarí, A., Fernàndez-Garcia, D., Rubol, S., Tirado-Conde, J., and Sanchez-Vila, X.: Vadose zone oxygen dynamics during drying and wetting cycles: An artificial recharge laboratory experiment, J. Hydrol., 527, 151–159, https://doi.org/10.1016/j.jhydrol.2015.04.048, 2015. a, b
Essandoh, H. M., Tizaoui, C., Mohamed, M. H., Amy, G., and Brdjanovic, D.: Soil aquifer treatment of artificial wastewater under saturated conditions, Water Res., 45, 4211–4226, 2011. a
Fahl, J. and Fischer, A. R.: Untersuchung und simulierung von transport und abbauprozessen in der ungesattigten zone wahrend der periodischen infiltration gereinigter abwasser. Abschlussbericht des Israelisch-Deutschen kooperationsprojektes SHAFDAN-SAT, Technische Universitat Dresden, Dresden, Germany, 2014. a
Ganot, Y., Holtzman, R., Weisbrod, N., Nitzan, I., Katz, Y., and Kurtzman, D.: Monitoring and modeling infiltration–recharge dynamics of managed aquifer recharge with desalinated seawater, Hydrol. Earth Syst. Sci., 21, 4479–4493, https://doi.org/10.5194/hess-21-4479-2017, 2017. a
García-Tejero, I., Francisco, V., Hugo, D. Z., and José, L. M. F.: Towards sustainable irrigated Mediterranean agriculture: implications for water conservation in semi-arid environments, Water Int., 39.5, 635–648, 2014. a
Goren, O., Lazar, B., Burg, A., and Gavrieli, I.: Mobilization and retardation of reduced manganese in sandy aquifers: Column experiments, modeling and implications, Geochim. Cosmochim. Ac., 96, 259–271, https://doi.org/10.1016/j.gca.2012.06.032, 2012. a
Goren, O., Burg, A., Gavrieli, I., Negev, I., Guttman, J., Kraitzer, T., Kloppmann, W., and Lazar, B.: Biogeochemical processes in infiltration basins and their impact on the recharging effluent, the soil aquifer treatment (SAT) system of the Shafdan plant, Israel, Appl. Geochem., 48, 58–69, https://doi.org/10.1016/j.apgeochem.2014.06.017, 2014. a, b
Haaken, K., Furman, A., Weisbrod, N., and Kemna, A.: Time-Lapse Electrical Imaging of Water Infiltration in the Context of Soil Aquifer Treatment, Vadose Zone J., 15, 2–12, https://doi.org/10.2136/vzj2016.04.0028, 2016. a, b
Icekson-Tal, N., Michail, M., Avraham, O., Sherer, D., and Shoham, G.: Dan region reclamation project: Groundwater recharge with municipal effluent, Recharge basins Soreq, Yavne 1, Yavne 2 and Yavne 3. Annual report. Mekorot Water Co. Ltd., Central District, Dan Region Unit, Ramla, Israel, 2011. a, b, c
Idelovitch, E., Icekson-Tal, N., Avraham, O., and Michail, M.: The long-term performance of soil aquifer treatment (SAT) for effluent reuse, Water Sci. Tech.-W. Sup., 3, 239–246, 2003. a, b
Kim, J. W., Kim, J., Choi, H., and Schwartz, F. W.: Modeling the fate and transport of organic and nitrogen species in soil aquifer treatment process, Water Sci. Technol., 50, 255–261, 2004. a
Mienis, O. and Arye, G.: Long-term nitrogen behavior under treated wastewater infiltration basins in a soil-aquifer treatment (SAT) system, Water Res., 134, 192–199, https://doi.org/10.1016/j.watres.2018.01.069, 2018. a, b
Miller, J. H., Ela, W. P., Lansey, K. E., Chipello, P. L., and Arnold, R. G.: Nitrogen Transformations during Soil–Aquifer Treatment of Wastewater Effluent—Oxygen Effects in Field Studies, J. Environ. Eng., 132, 1298–1306, https://doi.org/10.1061/(asce)0733-9372(2006)132:10(1298), 2006. a, b, c, d, e
Mizrahi, G., Furman, A., and Weisbrod, N.: Infiltration under Confined Air Conditions: Impact of Inclined Soil Surface, Vadose Zone J., 15, 2–8, https://doi.org/10.2136/vzj2016.04.0034, 2016. a
Negewo, B. D., Immerzeel, W., Droogers, P., Terink, W., Hoogeveen, J., Hellegers, P., and van Beek, R.: Middle-East and Northern Africa Water Outlook, FutureWater Report, Wageningen, the Netherlands, p. 136, 2011. a
Orgad, O.: Seasonal operation mode for a SAT system, MSc. Thesis, Ben-Gurion University of the Negev, Midreshet Ben-Gurion, Israel, 2017. a, b, c, d
Quanrud, B. D. M., Member, G. A., Wilson, L. G., Gordon, H. J., Graham, D. W., and Amy, G. L.: Fate of Organics during Column studies of Soil Aquifer Treatment, J. Environ. Eng., 122, 314–321, 1996. a, b
Roberson, E. B. and Firestone, M. K.: Relationship between Desiccation and Exopolysaccharide Production in a Soil Pseudomonas sp., Appl. Environ. Microbiol., 58, 1284–1291, available at: http://www.pubmedcentral.nih.gov/articlerender.fcgi?artid=PMC195588 (last access: 22 January 2020), 1992. a
Rosenzweig, R., Furman, A., Dosoretz, K., and Shavit, U.: Modeling biofilm dynamics and hydraulic properties in variably saturated soils using a channel network model, Water Resour. Res., 50, 5678–5697, 2014. a
Ruan, A., He, R., Xu, S., and Lin, T.: Effect of dissolved oxygen on nitrogen purification of microbial ecosystem in sediments, J. Environ. Sci. Heal. A, 44, 397–405, https://doi.org/10.1080/10934520802659778, 2009. a
Shuval, H. I., Adin, A., Fal, B., Rawitz, E., and Yekutiel, P.: Wastewater Irrigation in Developing Countries – Health Effects and Technical Solutions, Technical paper no. 51, World Bank, Washington, D.C., USA, 1986. a
Tanji, K. K.: Irrigation with Marginal Quality Waters: Issues, J. Irrig. Drain. Eng., 123, 165–169, https://doi.org/10.1061/(asce)0733-9437(1997)123:3(165), 1997. a
Volk, E., Iden, S. C., Furman, A., Durner, W., and Rosenzweig, R.: Biofilm effect on soil hydraulic properties: Experimental investigation using soil-grown real biofilm, Water Resour. Res., 52, 5813–5828, 2016. a
Zhang, Q. and Yan, T.: Correlation of Intracellular Trehalose Concentration with Desiccation Resistance of Soil Escherichia coli Populations, Appl. Environ. Microbiol., 78, 7407–7413, https://doi.org/10.1128/aem.01904-12, 2012. a