the Creative Commons Attribution 4.0 License.
the Creative Commons Attribution 4.0 License.
 | 04 Feb 2020
Impact of revegetation of the Loess Plateau of China on the regional growing season water balance
Andrew J. Pitman
Weidong Guo
Beilei Zan
Congbin Fu
To resolve a series of ecological and environmental problems over the Loess Plateau, the “Grain for Green Program” (GFGP) was initiated at the end of 1990s. Following the conversion of croplands and bare land on hillslopes to forests, the Loess Plateau has displayed a significant greening trend, which has resulted in soil erosion being reduced. However, the GFGP has also affected the hydrology of the Loess Plateau, which has raised questions regarding whether the GFGP should be continued in the future. We investigated the impact of revegetation on the hydrology of the Loess Plateau using relatively high-resolution simulations and multiple realizations with the Weather Research and Forecasting (WRF) model. Results suggest that revegetation since the launch of the GFGP has reduced runoff and soil moisture due to enhanced evapotranspiration. Further revegetation associated with the GFGP policy is likely to further increase evapotranspiration, and thereby reduce runoff and soil moisture. The increase in evapotranspiration is associated with biophysical changes, including deeper roots that deplete deep soil moisture stores. However, despite the increase in evapotranspiration, our results show no impact on rainfall. Our study cautions against further revegetation over the Loess Plateau given the reduction in water available for agriculture and human settlements and the lack of any significant compensation from rainfall.


The Loess Plateau is a highland region of north central China, covering about 640 000 km2. The loess soils are well suited for agriculture, so natural forests have been progressively converted to farmland to support the growing population over the last 7000 years (Fu et al., 2017). However, the loess is also prone to wind and water erosion; thus, the area's long history of deforestation is associated with soil erosion, resulting in land degradation, low agricultural productivity, and significant local poverty in some farming communities (Bryan et al., 2018; Chen et al., 2015; Fu et al., 2017). The soil erosion aggravates the flux of sediment into the Yellow River (Fu et al., 2017; Miao et al., 2010; Peng et al., 2010), increasing the risk of catastrophic flooding in some densely populated regions downstream (Bryan et al., 2018; Chen et al., 2015; Fu et al., 2017).
To minimize soil erosion, mitigate flood risk, store carbon, and improve livelihoods over the Loess Plateau, the “Grain for Green Program” (GFGP) was initiated by reforesting hillslopes in the late 1990s (Bryan et al., 2018; Fu et al., 2017; Liu et al., 2008). Consequently, the Loess Plateau has displayed a significant “greening” trend (Chen et al., 2015; Fu et al., 2017; Li et al., 2017). The large-scale vegetation restoration program has also reduced soil erosion over the Loess Plateau and alleviated sediment transport into the Yellow River (Fu et al., 2017; Liang et al., 2015; Miao et al., 2010; Peng et al., 2010; Wang et al., 2016).
As a consequence of the beneficial outcomes of the GFGP, further investment is planned with a commitment of around USD 33.9 billion from China through to 2050 (Feng et al., 2016). However, further revegetation over the Loess Plateau is controversial (Cao et al., 2011; Chen et al., 2015; Fu et al., 2017) with evidence from field (Jia et al., 2017; Jin et al., 2011; Wang et al., 2012) and satellite (Feng et al., 2017; Lv et al., 2019a; Xiao, 2014) observations that revegetation has affected the hydrological balance of the region. Compared with croplands or barren surfaces, the planted forests enable higher evapotranspiration associated with a larger leaf area, higher aerodynamic roughness, and deeper roots (Anderson et al., 2011; Bonan, 2008; Bright et al., 2015). Consequently, revegetation tends to decrease soil moisture and runoff with the associated risk of limiting water availability for agriculture, human consumption, and industry (Cao et al., 2011; Chen et al., 2015; Fu et al., 2017). Indeed, the present vegetation over the Loess Plateau, which to some extent reflects decades of reafforestation, may already exceed the limit that the local water supply can support; hence, further revegetation may not be sustainable (Feng et al., 2016; S. L. Zhang et al., 2018).
Despite the increasing observational evidence demonstrating that revegetation tends to impair the hydrological balance of the Loess Plateau, the response of rainfall to revegetation over this region has commonly been overlooked. This is mainly due to the difficulty in detecting the impact of revegetation on rainfall from observations. As an important component of hydrological cycle of the Loess Plateau, rainfall not only controls the terrestrial water budget but also influences soil erosion and the discharge of sediment into the Yellow River (Liang et al., 2015; Miao et al., 2010; Peng et al., 2010; Wang et al., 2016). Therefore, information on how rainfall responds to revegetation is critical for a comprehensive assessment of the impact of revegetation on the hydrology of the region. Indeed, if rainfall responds to revegetation, this may influence national policies on whether to continue large-scale vegetation restoration programs. Afforestation or deforestation does have the potential to affect rainfall via changes in biogeophysical processes, but any impact of afforestation or deforestation on rainfall tends to be highly region specific (Findell et al., 2006; Lorenz et al., 2016; Winckler et al., 2017).
In contrast with observations, modeling can help disentangle the impact of revegetation on rainfall from the impact of other drivers. Cao et al. (2017) and Li et al. (2018) performed numerical experiments over the whole of China and demonstrated that the revegetation over the Loess Plateau can enhance rainfall locally. Very recently, Lv et al. (2019b) and Cao et al. (2019) performed simulations focused on the Loess Plateau in order to examine the impact of revegetation or afforestation on rainfall. Lv et al. (2019b) reported a significant increase in rainfall, while Cao et al. (2019) found spatially divergent changes in rainfall. We also note some earlier studies investigating the response of rainfall to land cover change across China (e.g., Chen et al., 2017; Ma et al., 2013; Wang et al., 2014). Unfortunately, these studies either focused less on the Loess Plateau (Ma et al., 2013) or applied land cover changes unable to reflect the revegetation of the Loess Plateau (Chen et al., 2017; Wang et al., 2014). Therefore, large uncertainties remain in the response of rainfall to the revegetation of the Loess Plateau owing to inconsistent conclusions derived from limited studies. We note that Li et al. (2018) reported that the increased rainfall due to revegetation over North China (covering but not limited to the Loess Plateau) was large enough to compensate for the increase in evapotranspiration and resulted in little impact on soil moisture. This simulated negligible soil moisture change associated with revegetation is contradicted by extensive studies based on observations (e.g., Feng et al., 2017; Jia et al., 2017; Wang et al., 2012). Here, we note that it might be unfair to directly compare the observational and modeling results because observational results commonly incorporate multiple factors and modeling results are subject to uncertainties in both land cover change and biophysical parametrization schemes implemented in models (de Noblet-Ducoudre et al., 2012; Pitman et al., 2009). These intrinsic differences between observational and modeling results cannot fully account for the disagreement on the runoff and soil moisture change due to revegetation over the Loess Plateau. Thus, the impact of revegetation on the hydrology of the Loess Plateau remains unclear and needs careful reevaluation.
In this study, we examine the impact of revegetation following the launch of the GFGP on the hydrology of the Loess Plateau using relatively high-resolution simulations with the Weather Research and Forecasting model. We also examine the impact of further revegetation on the hydrology of the Loess Plateau with the goal of providing helpful information to policymakers. As far as we know, there has been no study investigating how the regional hydrology would be affected by further revegetation over the Loess Plateau, which is an important factor for informing policymakers on the mitigation and adaptation of climate change for this region. Additionally, the vegetation over the Loess Plateau is fragile and highly dependent on water availability (Fu et al., 2017). How the hydrology would be impacted by further revegetation determines the water availability and, in turn, how much more revegetation can be sustained over the Loess Plateau. Neglecting this process risks errors in assessing the upper threshold for vegetation in the Loess Plateau (Feng et al., 2016; S. L. Zhang et al., 2018). Given the importance of revegetation over the Loess Plateau now and in the future, we examine the impact of further revegetation on the hydrology of the Loess Plateau and pay particular attention to the response of rainfall to revegetation.
2.1 Model configuration
The Weather Research and Forecasting (WRF, version 3.9.1.1, Skamarock et al., 2008) model, a fully coupled land–atmosphere regional weather and climate model, was used in our study. WRF has been shown to perform well in the dynamic downscaling of regional climate over China (e.g., He et al., 2017; Sato and Xue, 2013; Yu et al., 2015). Additionally, WRF has been used to study the impact of land use and land cover change on the hydrological balance at regional scales (Deng et al., 2015; L. J. Zhang et al., 2018). Thus, while WRF is potentially suitable for evaluating the impact of revegetation on the hydrology of the Loess Plateau, we undertake an evaluation of WRF in simulating surface air temperature and rainfall for this region (see Sect. 3.1). To perform simulations at a high spatial resolution over the Loess Plateau region, we applied two-way nested runs with two domains at different grid resolutions running simultaneously. The ERA-Interim reanalysis data (Dee et al., 2011; Table 1) provided the boundary conditions for the larger and coarser-resolution (30 km) domain, and the larger domain provided boundary conditions for the smaller and higher-resolution (10 km) domain. The ERA-Interim reanalysis data also provided the initial conditions for both domains. Using a Lambert projection, the larger domain was centered at 100∘ E, 37∘ N, with 180 grid points in the west–east direction and 155 grid points in the south–north direction, covering most of China and some of the surrounding regions (Fig. 1a). The inner domain covers the entire Loess Plateau with 166 grid points in the west–east direction and 151 grid points in the south–north direction (Fig. 1a, b). Both domains had 28 sigma levels in the vertical direction with the top level set at 70 hPa. Figure 1b shows the region analyzed in this paper.
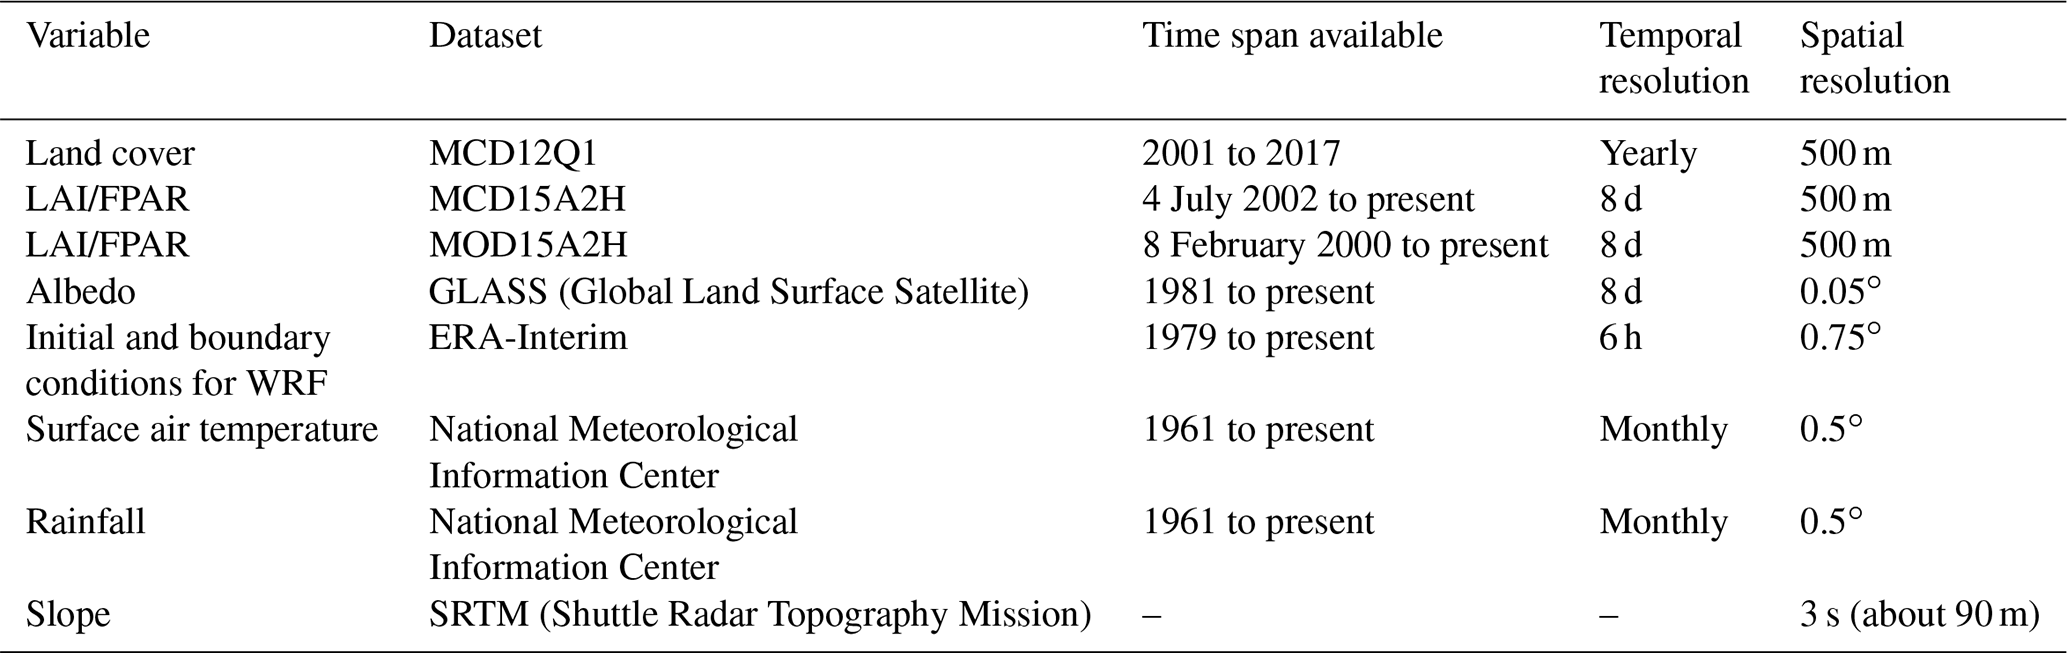
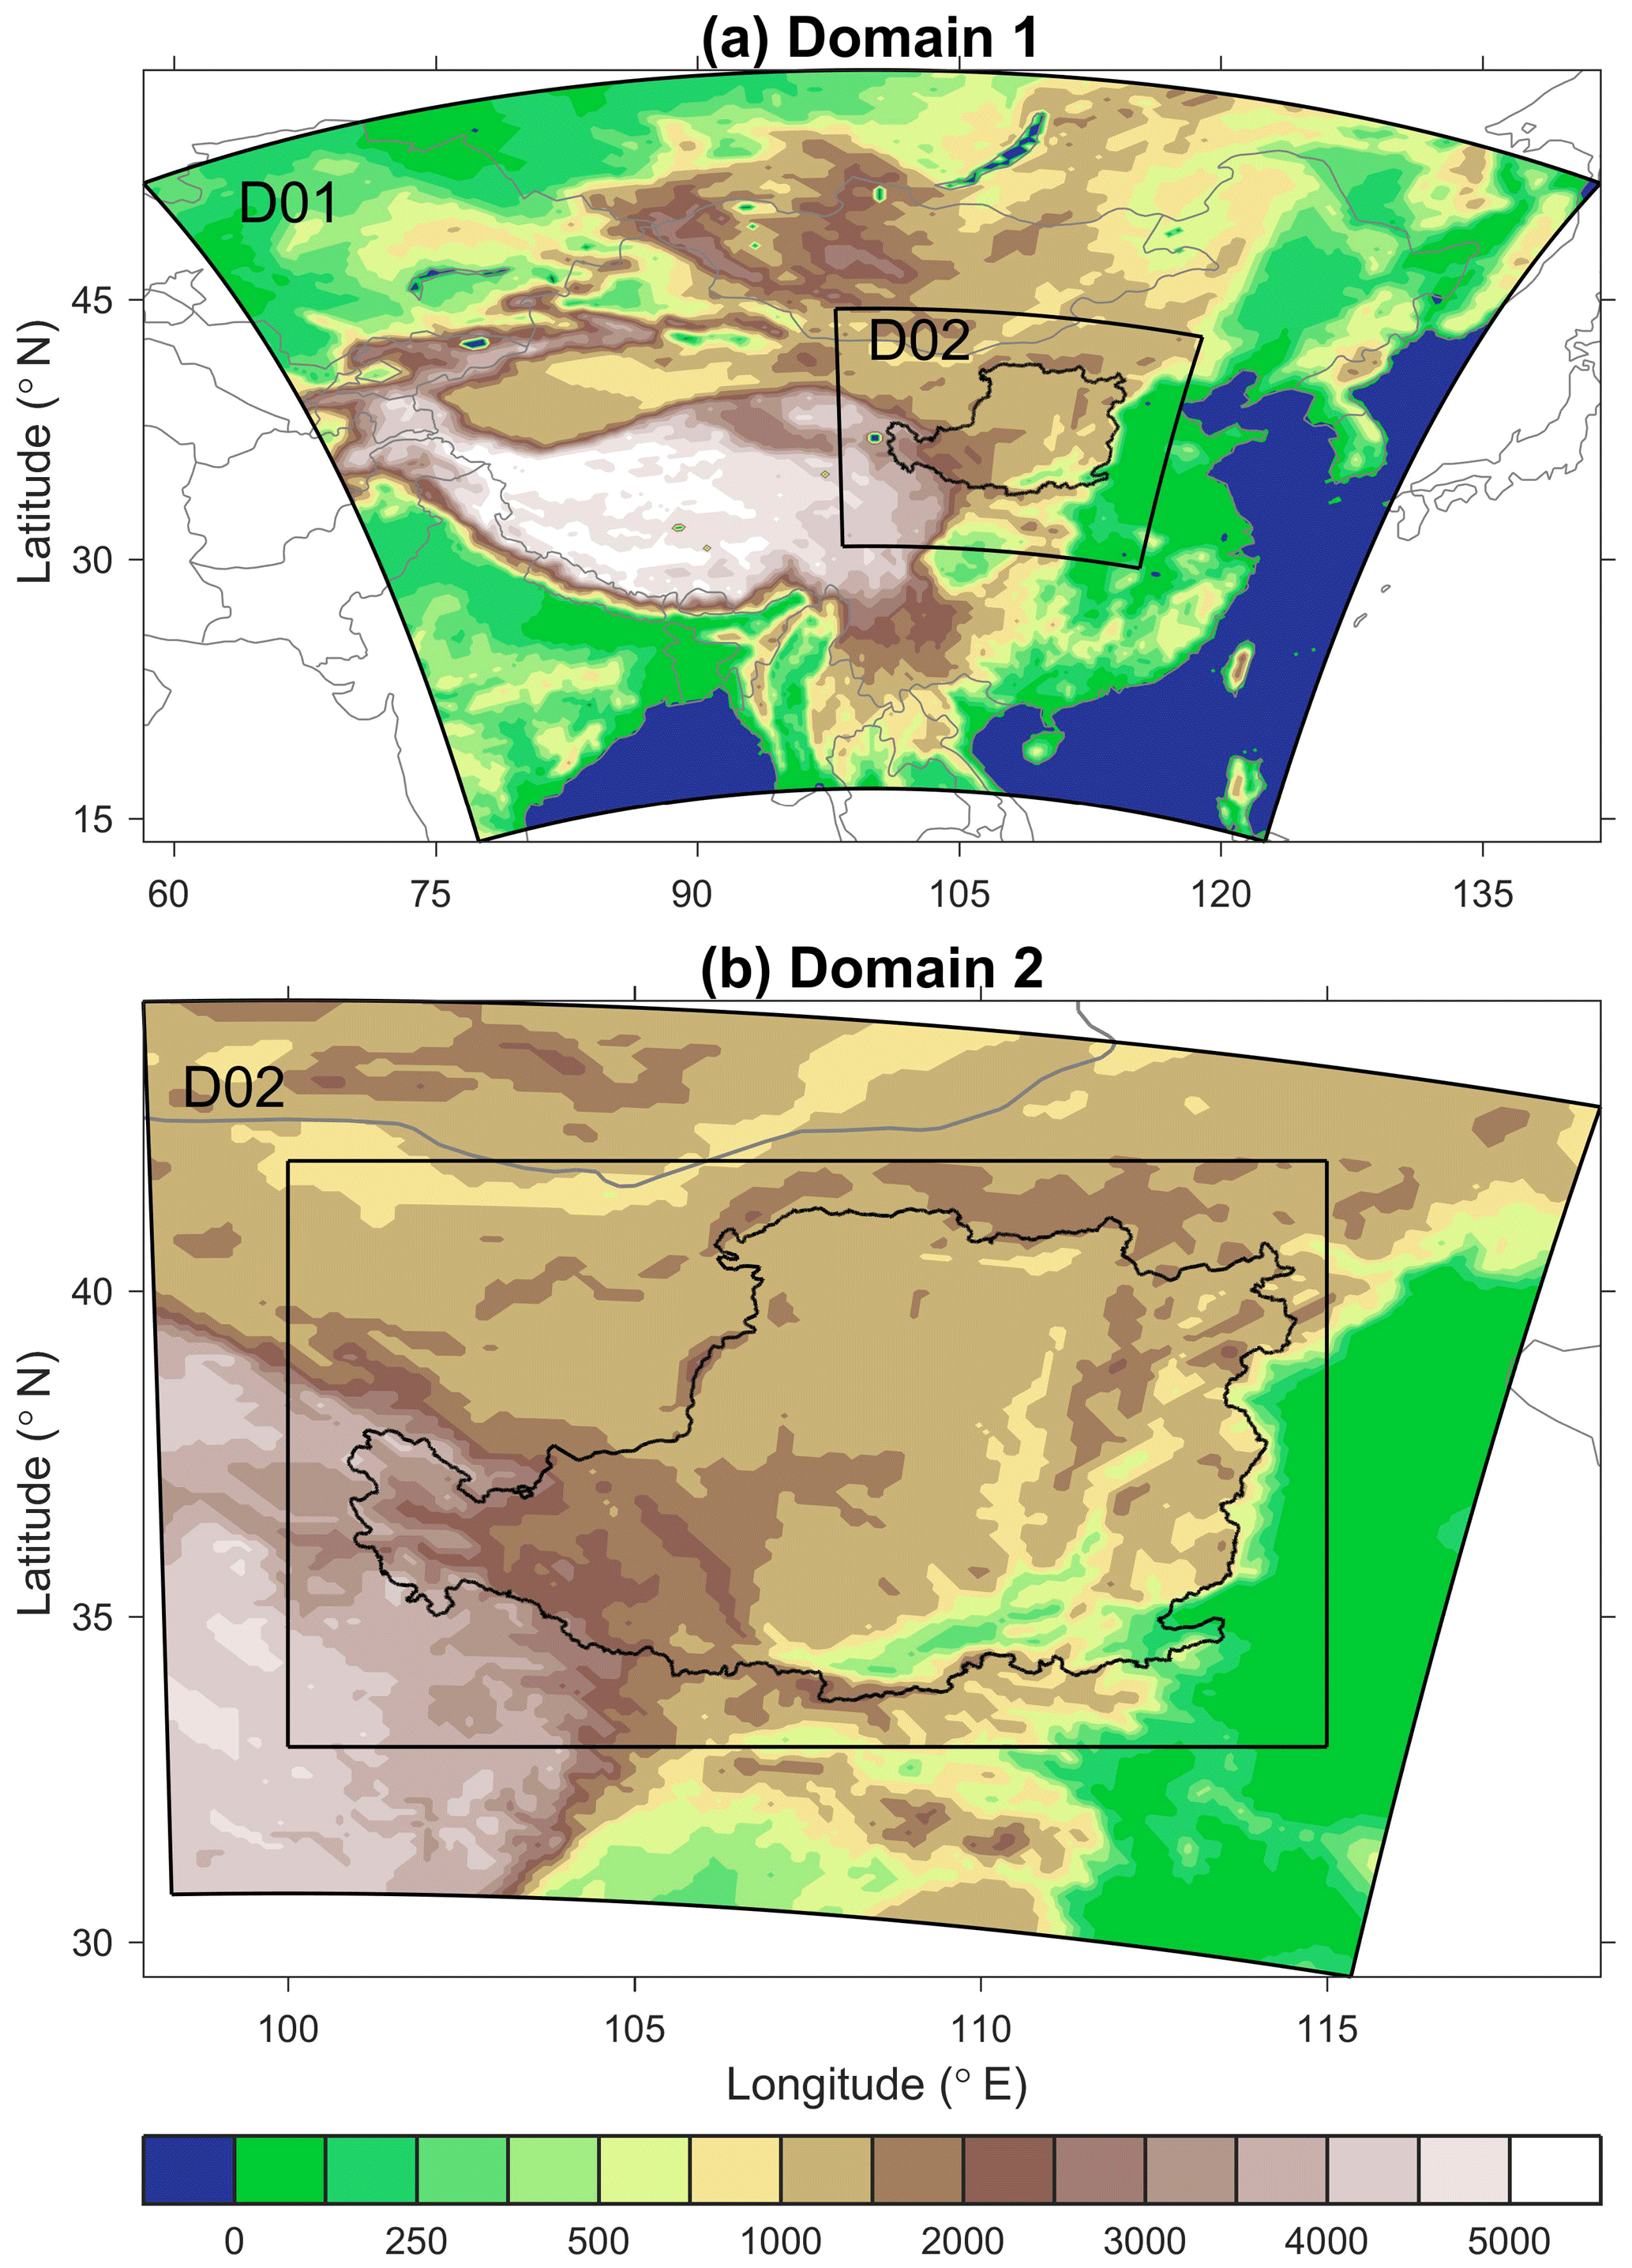
Figure 1(a) The larger domain (D01) and (b) the inner nested domain (D02) configured for the WRF model. The topography (meters above sea level) is shown using colored shading. The Loess Plateau is enclosed by the black border. The black rectangle covers the region analyzed in this study.
The main physical parameterization schemes used in our study included the WRF single-moment 6-class microphysics scheme (Hong and Lim, 2006), the Dudhia shortwave radiation scheme (Dudhia, 1989), the Rapid Radiative Transfer Model (RRTM, Mlawer et al., 1997) for longwave radiation, a revised MM5 scheme (Jimenez et al., 2012) for the surface layer, the Noah land surface model (Ek, 2003), the Yonsei University scheme (Hong et al., 2006) for the planetary boundary layer, and the Kain–Fritsch scheme (Kain, 2004) for cumulus convection. The Noah land surface model used the Unified NCEP/NCAR/AFWA scheme with soil temperature and moisture in four layers (the first layer from 0 to 10 cm, the second layer from 10 to 40 cm, the third layer from 40 to 100 cm, and the fourth layer from 100 to 200 cm), fractional snow cover, and frozen soil physics. A sub-tiling option considering three land cover types within each grid cell was applied to help improve the simulations of the land surface fluxes and temperature (Li et al., 2013).
2.2 Data
2.2.1 Satellite data
We used satellite-observed land cover type obtained from the Moderate Resolution Imaging Spectroradiometer (MODIS) Land Cover Type product (MCD12Q1, Version 6; Friedl and Sulla-Menashe, 2019; Table 1). This provides land cover types based on the “International Geosphere-Biosphere Programme” (IGBP) classification scheme (Table 2) globally at a spatial resolution of 500 m, and at yearly intervals from 2001 to 2017. The MCD12Q1 Version 6 is improved over previous versions via substantial improvements to algorithms, classification schemes, and spatial resolution (Sulla-Menashe et al., 2019). We changed the land cover type within the Loess Plateau while retaining the default land cover type for other regions in our experiments (see details in Sect. 2.3). Therefore, the MCD12Q1 data were reprojected to geographic grid data with a resolution of 30 s (approximately 0.9 km) by the MODIS Reprojection Tool to make them consistent with the default land cover map in WRF.
Table 2The International Geosphere-Biosphere Programme (IGBP) classification and class descriptions.
Key land surface biogeophysical parameters include the green vegetation fraction (VEGFRA), snow free albedo (α), leaf area index (LAI), and the background roughness length (Z0). The fraction of photosynthetically active radiation (FPAR) can be used as a proxy for VEGFRA (Kumar et al., 2014; Liu et al., 2006), enabling both VEGFRA and LAI data to be obtained from the MODIS Terra+Aqua LAI/FPAR product (MCD15A2H, Version 6; Myneni et al., 2015a; Table 1). This provides 8 d composite LAI and FPAR globally at a spatial resolution of 500 m from 4 July 2002. The MODIS Terra LAI/FPAR product (MOD15A2H, Version 6; Myneni et al., 2015b; Table 1) was also used to provide observations prior to 2002, as it started on 8 February 2000. Although MOD15A2H covers a longer time span, MCD15A2H is generally preferred. This is because only observations from the MODIS sensor on NASA's Terra satellite are used to generate MOD15A2H, but observations from sensors on both Terra and Aqua satellites are used for MCD15A2H. The MCD15A2H and MOD15A2H sinusoidal tile grid data were reprojected before use. The 8 d LAI and FPAR data were composited to monthly data to make them suitable for WRF.
As we only focus on the growing season (see Sect. 2.3.1), α can be assumed to be equivalent to satellite-observed snow-free albedo. The α data were derived from the blue sky albedo for shortwave provided by the Global Land Surface Satellite (GLASS) product (Liang and Liu, 2012; Table 1). This provides an 8 d composite albedo globally at a spatial resolution of 0.05∘ from 1981 to present. Compared with the MODIS albedo product, the GLASS albedo product has a higher temporal resolution and more successfully captures the surface albedo variations (Liu et al., 2013). The 8 d α data were composited to monthly data.
The background roughness length (Z0) was calculated following Eq. (1):
where Zmax and Zmin are the land-cover-dependent maximum and minimum background roughness lengths, respectively, provided by lookup tables. VEGFRA, VEGFRAmax, and VEGFRAmin are the instantaneous, maximum, and minimum green vegetation fractions, respectively, which were calculated from satellite-observed VEGFRA (equal to FPAR) that would be implemented in WRF (see Sect. 2.3).
2.2.2 Observation data
To evaluate the WRF model performance with respect to simulating the surface air temperature and rainfall over the Loess Plateau, we used a gridded observation dataset developed by the National Meteorological Information Center of the China Meteorological Administration (Zhao et al., 2014; Table 1). The dataset provides monthly surface air temperature and rainfall at a spatial resolution of 0.5∘ from 1961 to present and was produced by merging more than 2400 station observations across China using thin plate spline interpolation. The dataset has been widely used to analyze the surface air temperature and rainfall over the Loess Plateau (Sun et al., 2015; Tang et al., 2018). To facilitate the comparison between simulations and observations, the observation data were bilinearly interpolated to the WRF inner domain grid.
2.3 Experiment design
2.3.1 The impact of revegetation since the launch of the GFGP
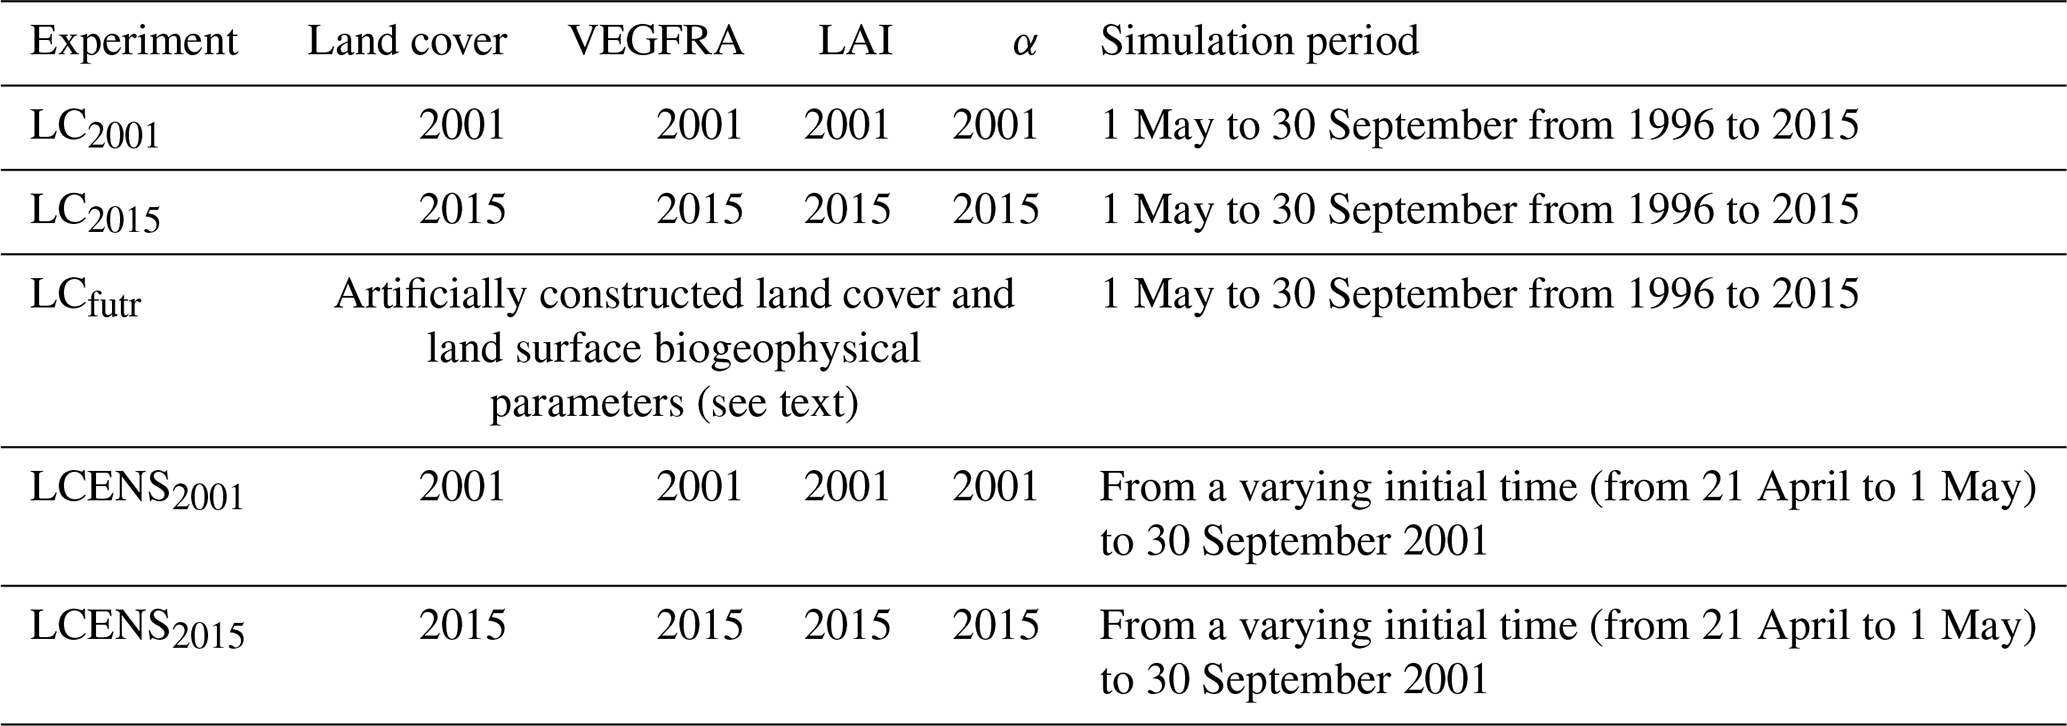
To examine the impact of revegetation on the hydrology of the Loess Plateau since the launch of the GFGP, we conducted a control experiment (LC2001) and a sensitivity experiment (LC2015; Table 3). For LC2001, satellite-observed land cover type, VEGFRA, LAI, and α in 2001 were used to approximate the land cover type and land surface biogeophysical parameters before the launch of the GFGP. There is a 1-year gap between the launch of the GFGP (end of 1999) and 2001, but any bias introduced by this gap is small compared with the changes in land cover type and land surface biogeophysical parameters between 1999 and present. Satellite-observed land cover type, VEGFRA, LAI, and α in 2015, representing the current land cover type and land surface biogeophysical status, were used for the LC2015. Model configurations were identical for the LC2001 and LC2015 except for land cover type and land surface biogeophysical parameters. Thus, comparing the LC2001 and LC2015 isolates the impact of revegetation since the launch of the GFGP.
We note that the difference between LC2001 and LC2015 should not be regarded as equivalent to the impact of GFGP for two reasons. First, actual changes in land cover type since the launch of the GFGP are highly spatially heterogeneous due to various anthropogenic activities, including GFGP, irrigation, and urbanization. MCD12Q1 suggests that most changes in land cover type have occurred in the south Loess Plateau (SLP; 35–37∘ N, 105–111∘ E) and east Loess Plateau (ELP; 35–39∘ N, 111–114∘ E) (Fig. 2a, c, e, g). In addition to the gain of forests (including evergreen needleleaf, evergreen broadleaf, deciduous needleleaf, deciduous broadleaf, and mixed forests) and savannas (including woody savannas and savannas), other changes in land cover type include the expansion of croplands (including croplands and cropland/natural vegetation mosaics) at the expense of grasslands and savannas (Fig. 2g). These increased croplands revealed by the MODIS land cover product, which seem unlikely, have been reported previously (Fan et al., 2015; Lv et al., 2019b), and are likely associated with expanded irrigation activities along the Yellow River (Fan et al., 2015; Zhai et al., 2015). Second, the observed VEGFRA, LAI, and α changes also incorporate other factors including improved agricultural management, climate variability, rising atmospheric CO2 concentration, and nitrogen deposition (Li et al., 2017; Fan et al., 2015; Piao et al., 2015). As shown in Fig. 3a, c, e, and g, the biogeophysical changes are not strictly limited to the regions undergoing changes in land cover type. For example, the α decrease mostly occurs over grasslands in the northwest (Fig. 3e), where the land cover type rarely changes (Fig. 2c). This decreased α is attributed to increased precipitation as well as the restoration of grasslands benefiting from the Returning Rangeland to Grassland Program launched in 2003 over this region (Zhai et al., 2015). In contrast, the α change is negligible in the SLP and ELP owing to the combined effects of increased forests (Fig. 2a) and croplands (Fig. 2d). However, overall, the MCD12Q1 demonstrates a significant greening trend (increased VEGFRA, LAI, and Z0 and decreased α) over the Loess Plateau since the launch of the GFGP (Fig. 3), which is spatially consistent with previous studies (e.g., Cao et al., 2019; Xiao, 2014; Zhai et al., 2015).
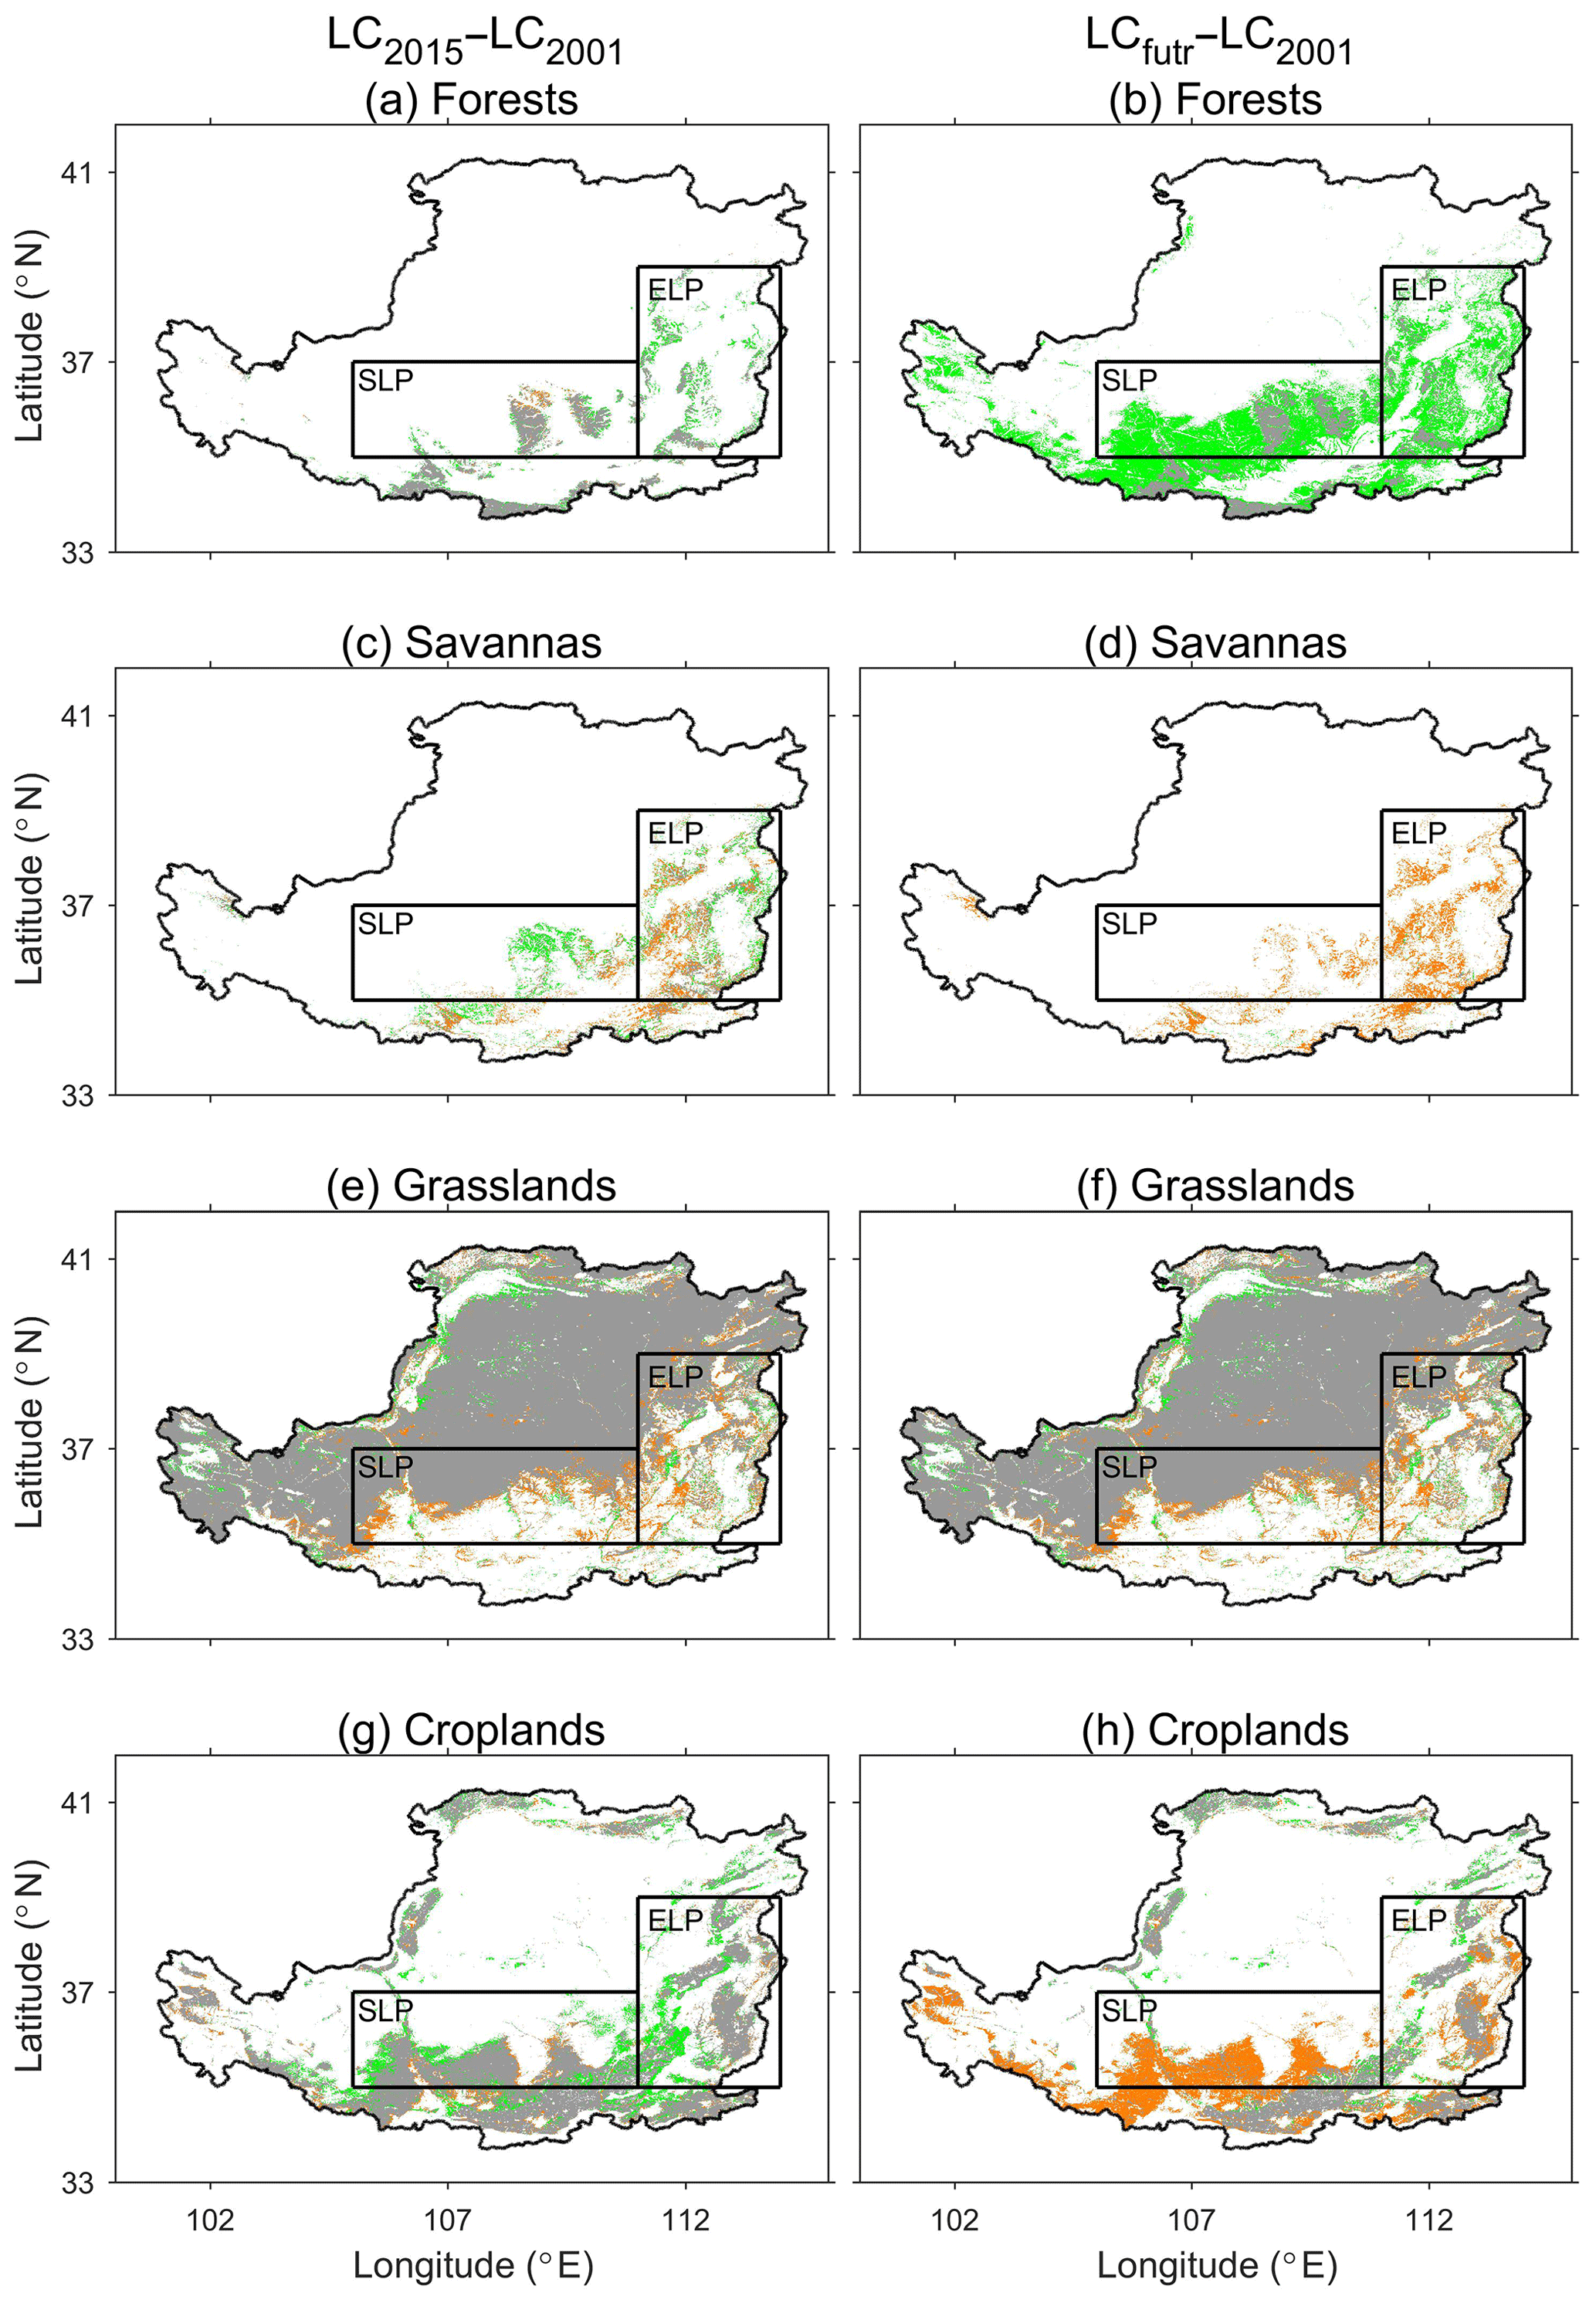
Figure 2Land cover type changes (a, c, e, g) between LC2001 and LC2015 (LC2015–LC2001) and (b, d, f, h) between LC2001 and LCfutr (LCfutr–LC2001). Green, brown, and gray denote the gained, lost, and unchanged land cover types, respectively, in the LC2015 (a, c, e, g) and LCfutr (b, d, f, h) compared with the LC2001. Forests include evergreen needleleaf, evergreen broadleaf, deciduous needleleaf, deciduous broadleaf, and mixed forests (see Table 2). Savannas include woody savannas and savannas. Croplands include croplands and cropland/natural vegetation mosaics. The south (35–37∘ N, 105–111∘ E) and east (35–39∘ N, 111–114∘ E) Loess Plateau are enclosed by black rectangles and are labeled SLP and ELP, respectively.
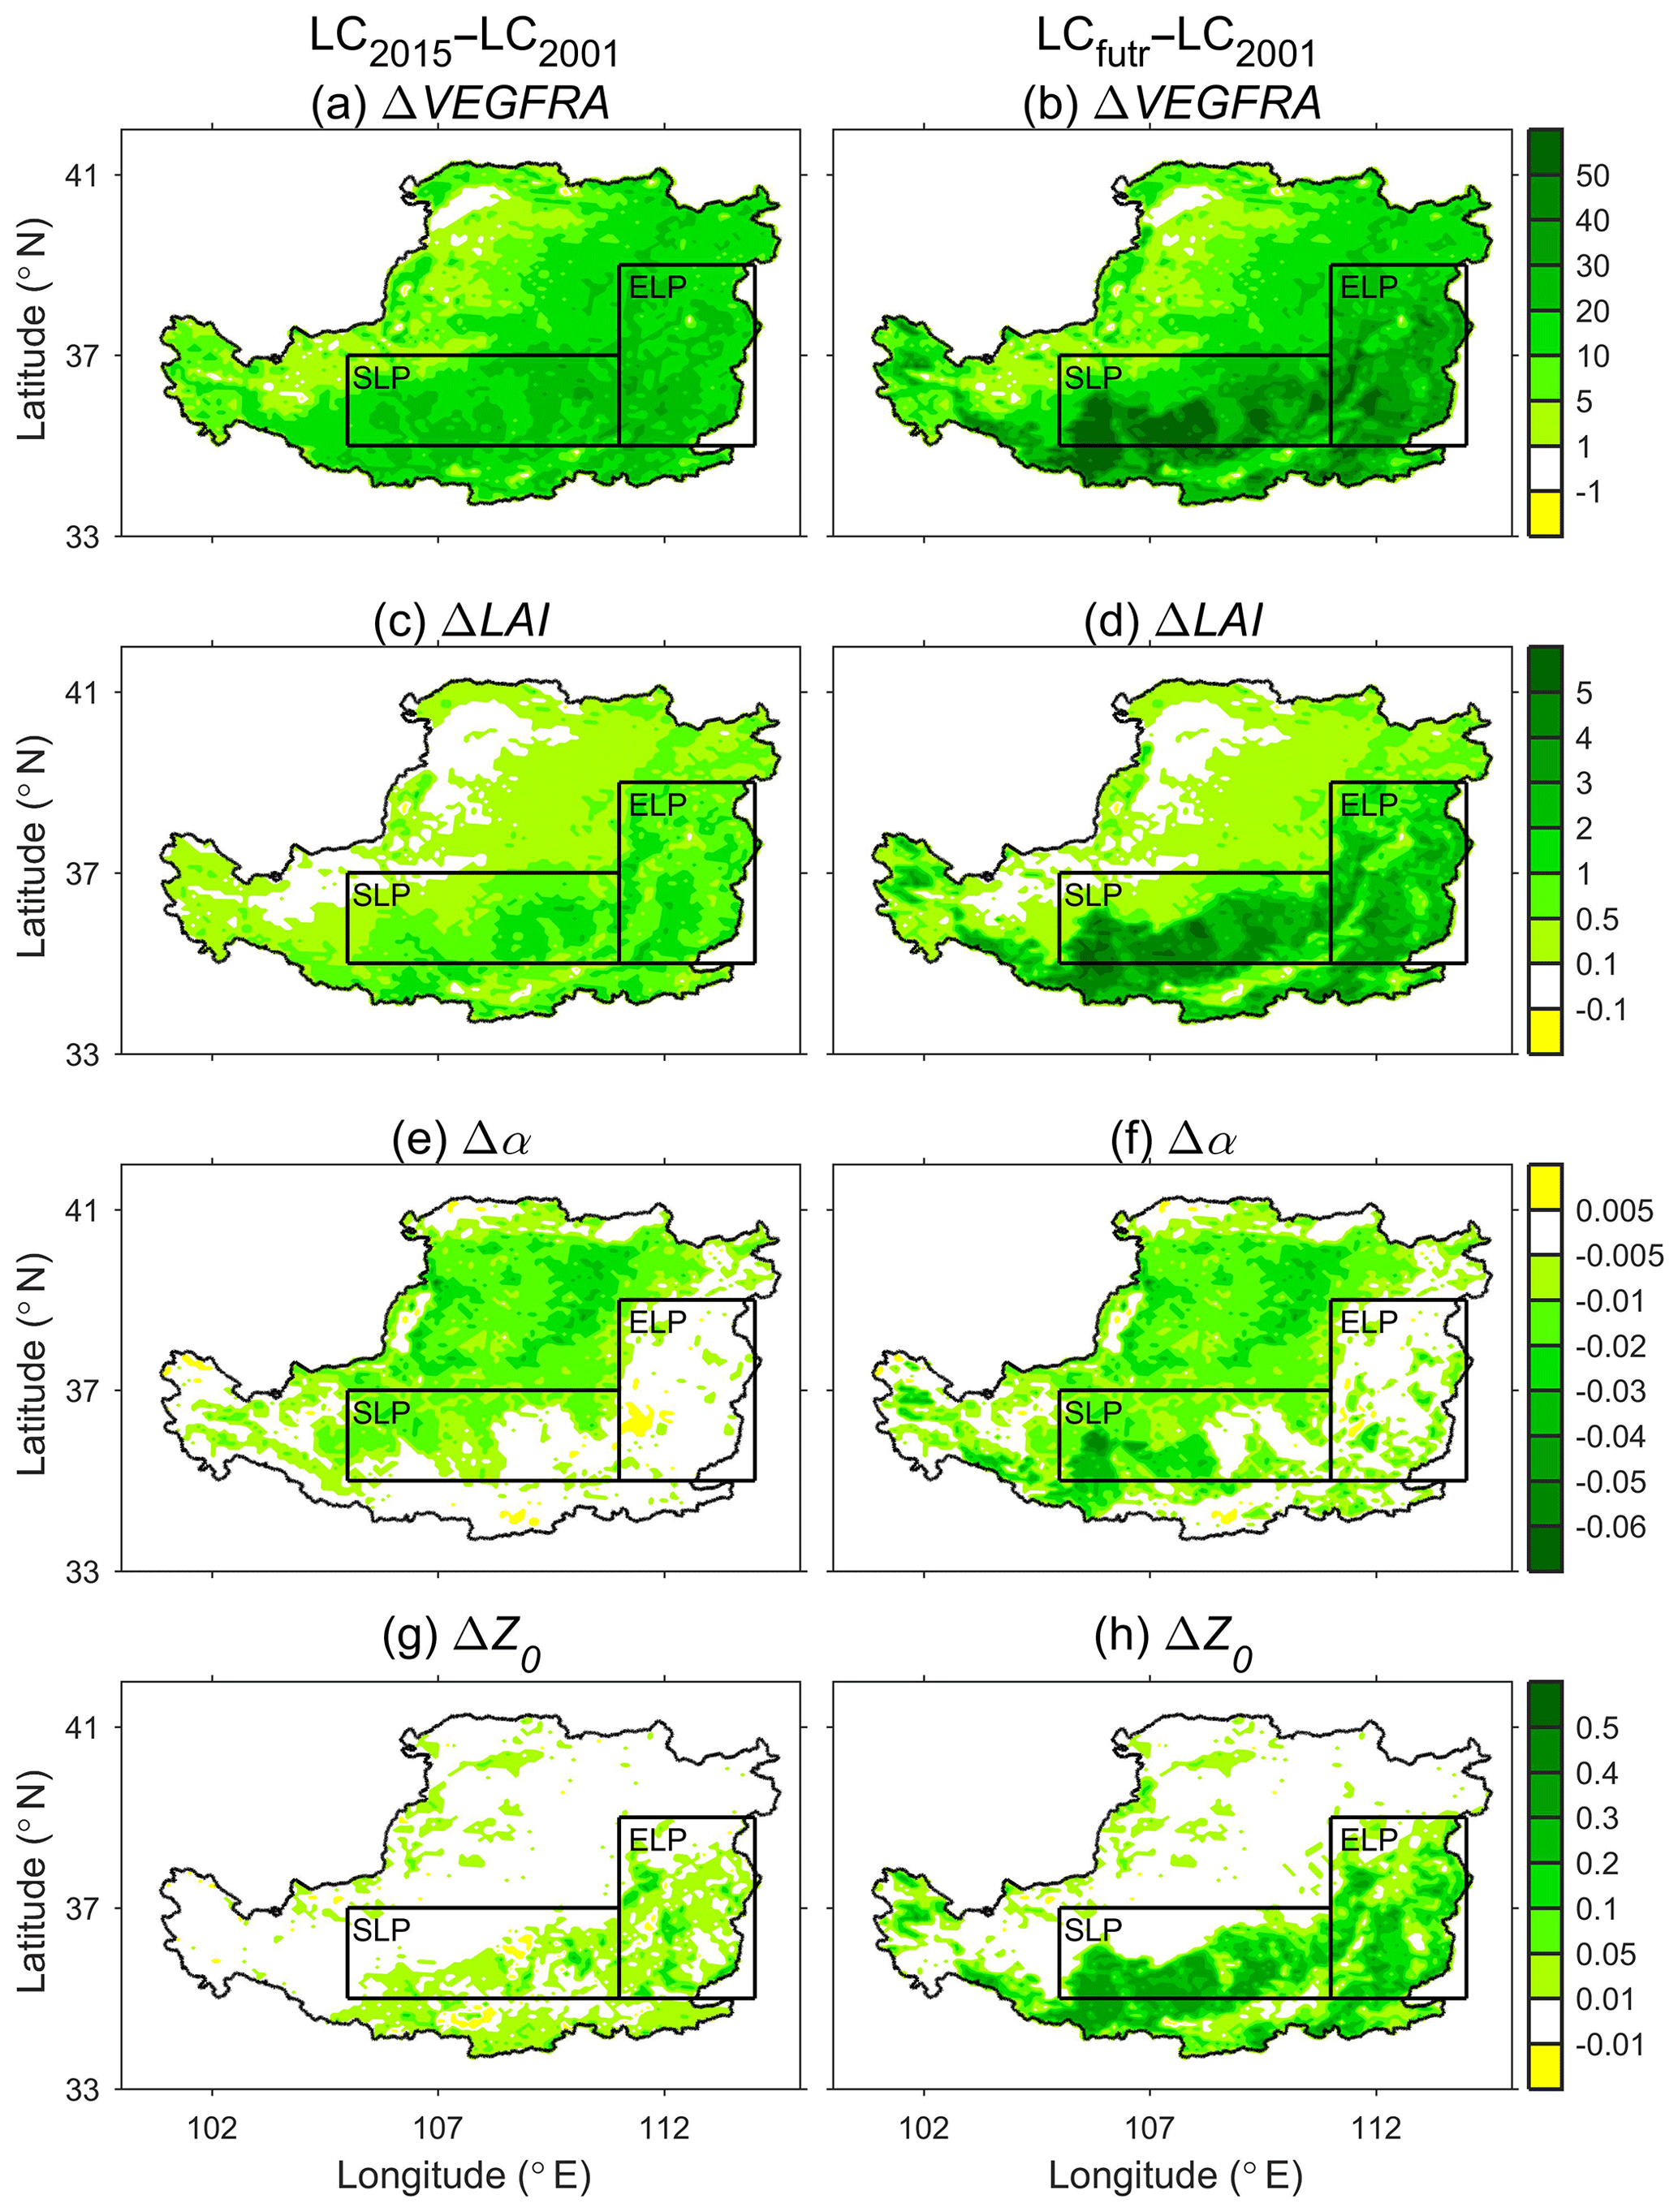
Figure 3Changes in the June–July–August–September mean (a, b) green vegetation fraction (%), (c, d) leaf area index (m3 m−3), (e, f) albedo, and (g, h) roughness length (m) between LC2001 and LC2015 (LC2015–LC2001; a, c, e, and g) and between the LC2001 and LCfutr (LCfutr–LC2001; b, d, f, and h). The south (SLP) and east Loess Plateau (ELP) regions are defined in Fig. 2.
Both LC2001 and LC2015 were run from 1 May to 30 September from 1996 to 2015 resulting in 20 realization members for LC2001 and LC2015, respectively. We only run simulations for the growing season; any impact of revegetation should be most apparent during the growing season given that over 70 % of the annual rainfall occurs over the Loess Plateau in this season (Sun et al., 2015; Tang et al., 2018).
2.3.2 The impact of further revegetation on the Loess Plateau
If the GFGP is continued in the future, further revegetation could impact the hydrology of the Loess Plateau. Therefore, we conducted a third experiment (LCfutr) in which the coverage of forests was assumed to be at a maximum over the Loess Plateau following the policy of the GFGP (Table 3). To maximize forests, we first assumed that all croplands and barren land on hillslopes were converted to forests. We then assumed that savannas or forests with low coverage (e.g., low VEGFRA) became dense forests. The land cover and land surface biogeophysical parameters for the LCfutr were then constructed following two steps:
-
All cropland, barren, and savanna pixels on hillslopes (>15∘) were replaced by forest pixels over the Loess Plateau based on the land cover map from 2015. The slope was derived from the Shuttle Radar Topography Mission (SRTM version 2.0; Table 1) digital elevation model at a spatial resolution of 3 s (about 90 m). The pixel resolution of the land cover type was 30 s; thus, every land cover type pixel covered 100 (10×10) slope values. To maximize the revegetation, land cover type pixels with maximum slope values over 15∘ were regarded as hillslopes. For a pixel to be changed, the forest class was determined by the class of neighboring forest pixels, considering the adaptation of planted trees to local climate. Using this strategy, forest pixels increased by 164 % and croplands pixels decreased by nearly half in the constructed land cover map compared with the land cover type in 2001, with most conversions occurring in SLP (Fig. 2b, h).
-
We constructed the VEGFRA, LAI, and α map in line with the land cover type constructed in step 1. For each forest class, we screened out the “dense forests” pixels with VEGFRA over the 95th percentile among the pixels labeled as the same forest class over the Loess Plateau. The monthly values of VEGFRA, LAI, and α of the “dense forest” pixels were calculated for each forest class. We then adjusted the monthly VEGFRA, LAI, and α of other “non-dense forests” pixels to the values of the “dense forests” pixels. Using this strategy, all forest pixels over the Loess Plateau were changed to more dense forest. Consequently, the Loess Plateau shows an amplified greening trend in LCfutr, especially in SLP (Fig. 3b, d, f, h).
The LCfutr was run from 1 May to 30 September from 1996 to 2015. Therefore, comparing LC2001 and LCfutr isolates the impact of further revegetation on the hydrology of the Loess Plateau.
2.3.3 Identification of the impact of revegetation
Model internal variability is defined as the difference between realization members where the only differences are the initial conditions. These differences result from nonlinearities in the model physics and dynamics (Giorgi and Bi, 2000; Christensen et al., 2001). This means that some differences between LC2001 and LC2015 (or LCfutr) will be caused by internal variability in addition to revegetation (Lorenz et al., 2016; Ge et al., 2019). To minimize the impact of internal model variability, we performed multiple simulations for the year 2001 by changing initial conditions. Specifically, we carried out a pair of experiments named LCENS2001 and LCENS2015 (Table 3), which were the same as LC2001 and LC2015 except that LCENS2001 and LCENS2015 were only run for the year 2001 but initialized for each day between 21 and 30 April and ended on 30 September. This led to a total of 11 members (including the members with initial dates of 1 May in LC2001 and LC2015) for LCENS2001 and LCENS2015, respectively. Comparing LCENS2001 and LCENS2015, simulated changes were likely robust if the impact from revegetation was large and consistent relative to the differences caused by the change in the initial condition.
Results before 1 June was discarded as spin-up time in each simulation. Our analysis focuses on June, July, August, and September (JJAS) averages.
2.4 Local significance test
To test the statistical significance of the local impact of revegetation on the hydrology we calculate a grid point by grid point Student's t test. This tests the null hypothesis that the two groups of data are from independent random samples from normal distributions with equal means and equal but unknown variances. The local difference is regarded as statistically significant when the p value of the two-tailed t test passes the significance level of 95 %.
3.1 Evaluation of WRF's skill in simulating temperature and rainfall
We first evaluate WRF's simulation of surface 2 m air temperature (T2) and rainfall (RAIN), the quantities with the most credible observations available over the Loess Plateau, by comparing the averaged value of the 11 members in LCENS2001 with the observed values in 2001. After topographic correction (Zhao et al., 2008), WRF simulates T2 over the Loess Plateau mostly within 2 ∘C of the observations (Fig. 4a, c, e), although there are small areas where WRF simulates warmer temperatures (by 4 ∘C) than the observations. The model also performs well with respect to simulating RAIN (Fig. 4b, d, f), including a region of higher observed rainfall from the southwest to the central Loess Plateau. The RAIN bias between the WRF simulations and the observations is below 0.5 mm d−1 for almost the entire Loess Plateau (Fig. 4f). Larger RAIN biases mostly occur around the eastern and southern borders of the Loess Plateau, most likely due to extremely complex topography in these locations. As we focus on the impact of land cover change on the hydrology of the region, the reasonable simulation of RAIN gives us confidence in the results from WRF, particularly in SLP.
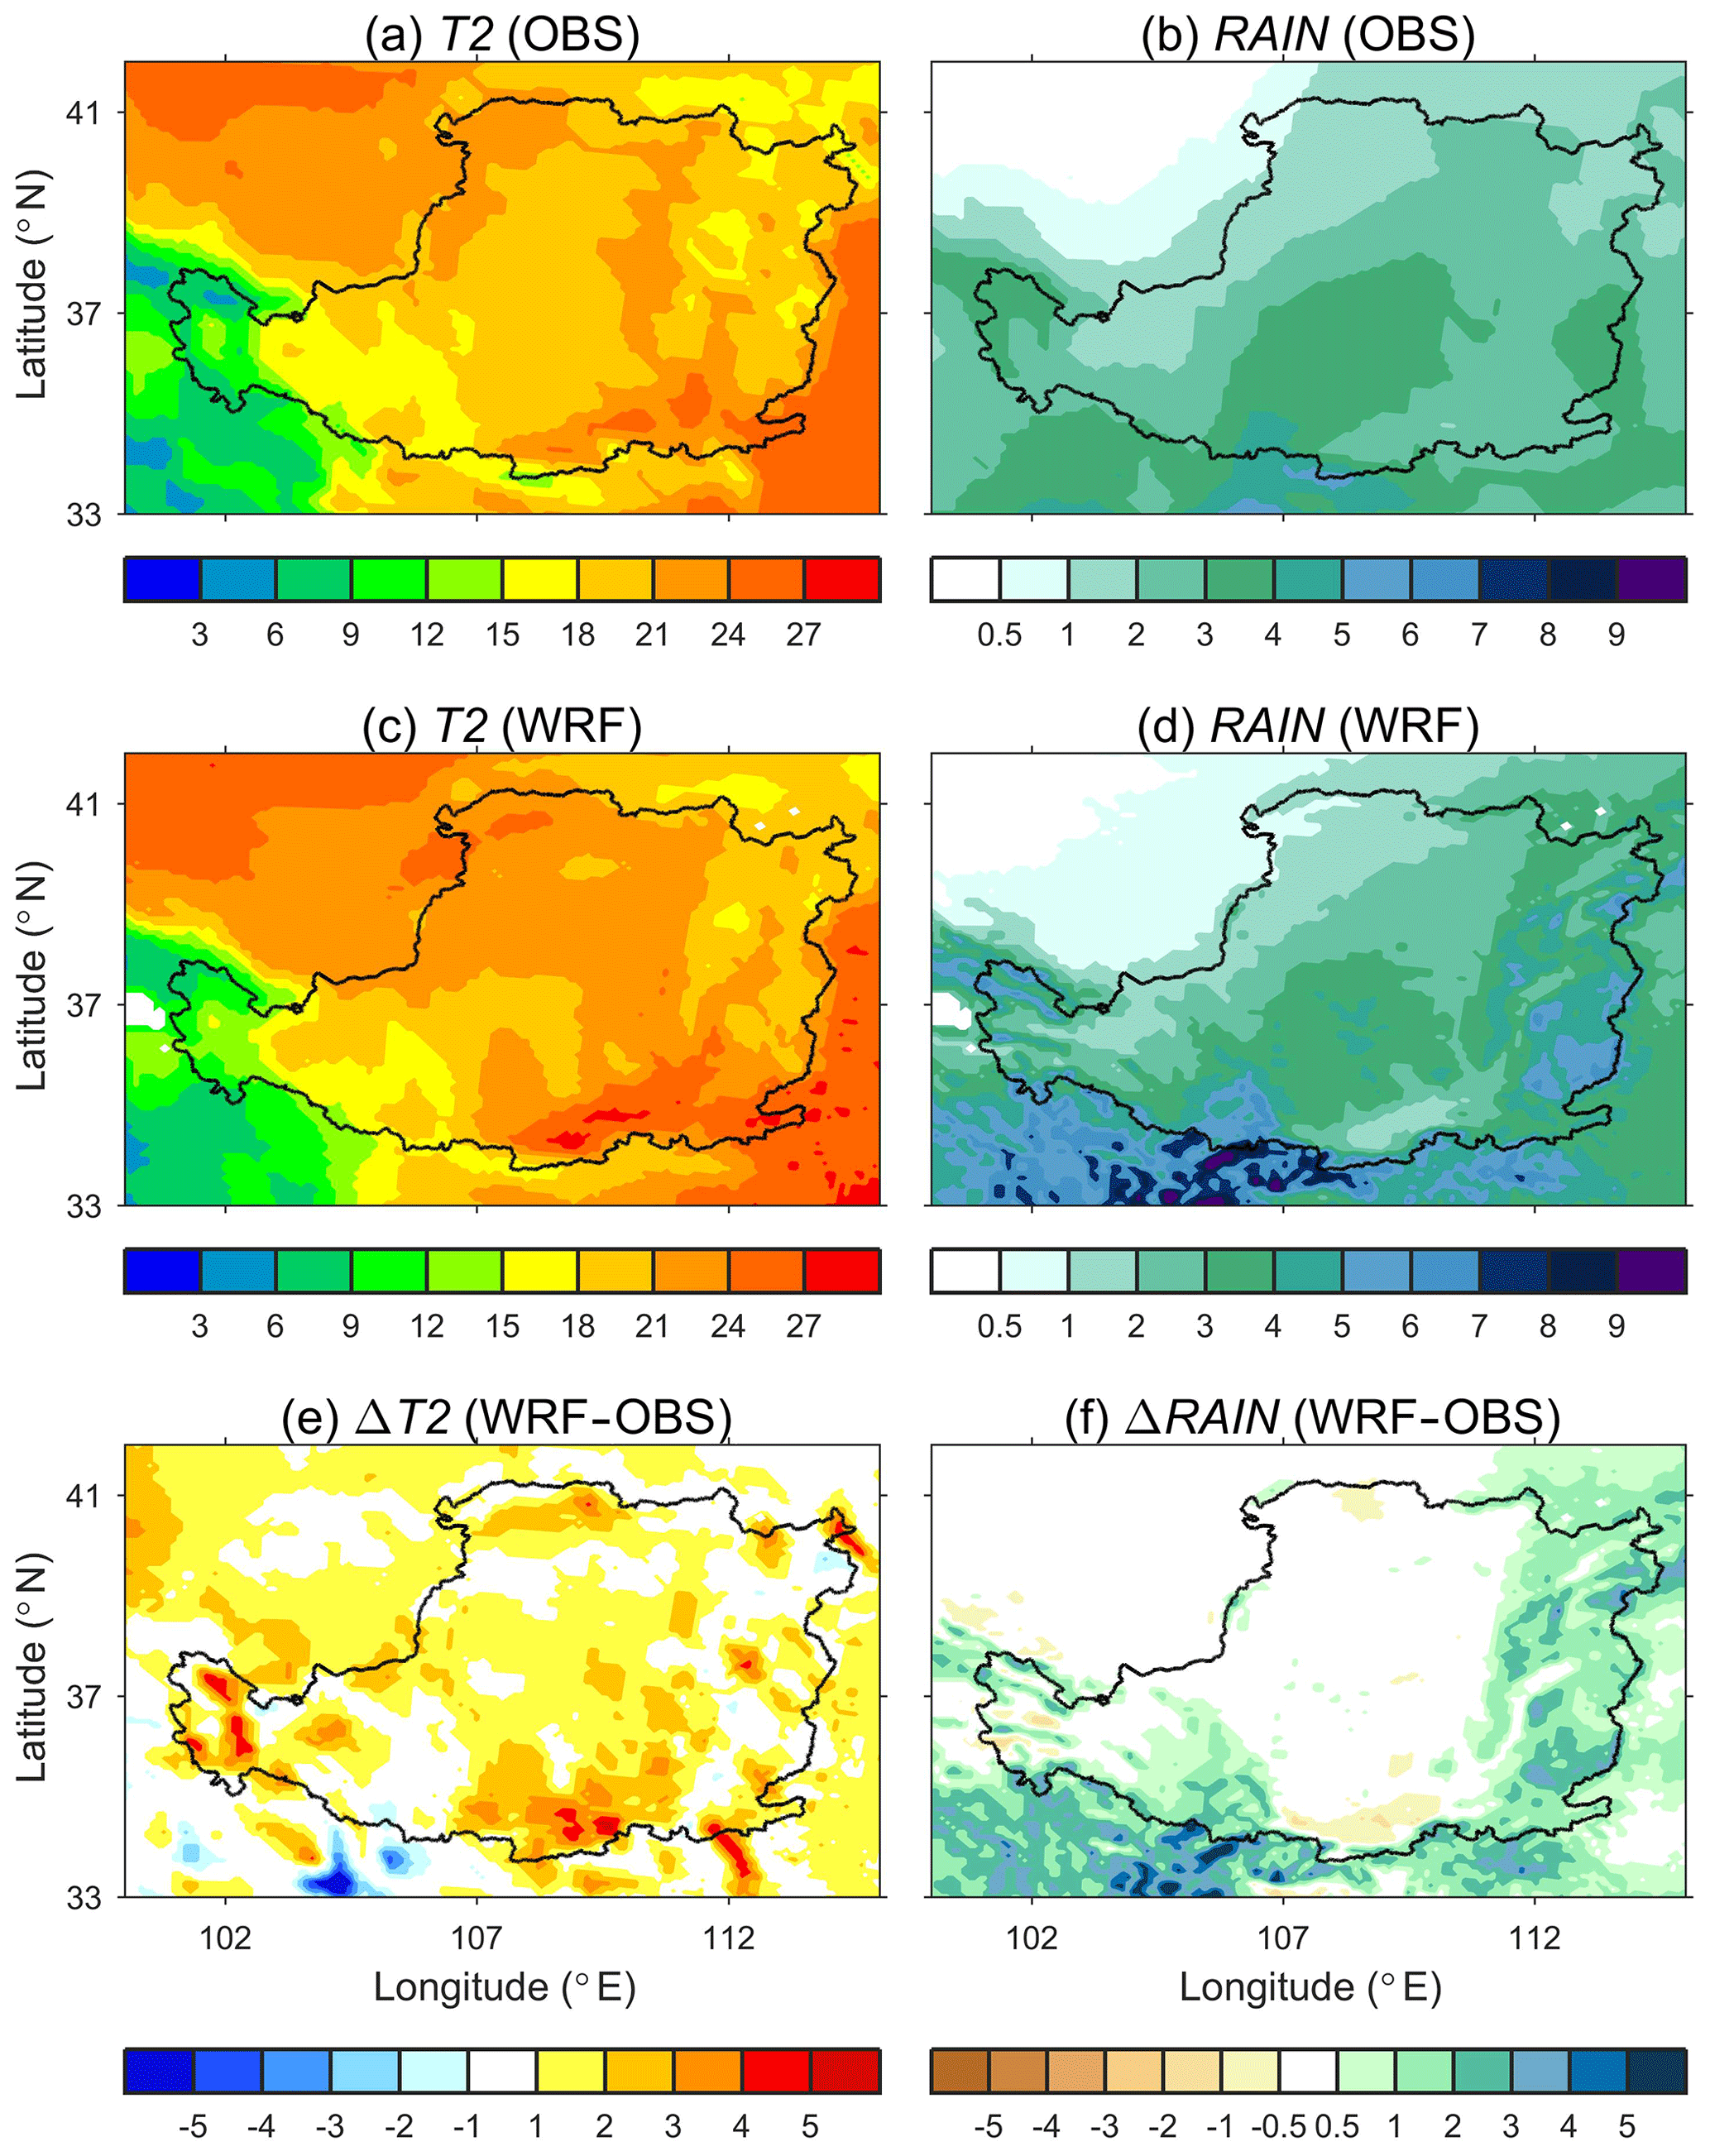
Figure 4June–July–August–September (JJAS) mean (a) observed surface air temperature (∘C), (b) observed rainfall (mm d−1), (c) simulated surface air temperature (∘C), (d) simulated rainfall (mm d−1), (e) the differences between observed and simulated surface air temperature (∘C; simulation minus observation), and (f) the differences between observed and simulated rainfall (mm d−1; simulation minus observation) over the Loess Plateau in 2001. The observed surface air temperature and rainfall are from the gridded observation dataset developed by the National Meteorological Information Center of the China Meteorological Administration. The simulated surface air temperature and rainfall are obtained by averaging the 11 members (with different initial conditions) of LCENS2001.
3.2 Impacts on surface fluxes
We first examine the change in the land surface radiation budget, energy, and water fluxes, as these are directly impacted by changes in land cover type and the surface biogeophysical parameters. Comparing LC2001 and LC2015 (LC2015–LC2001), land surface net radiation (Rnet), latent heat flux (QE) and sensible heat flux (QH) changes mainly occur where the land cover type and land surface biogeophysical parameters are changed, suggesting a strong local effect on Rnet, QE, and QH. Rnet increases by around 5–20 W m−2 (Fig. 5a) over most of the region due to a reduction in α (Fig. 3e). While QE increases by 10–30 W m−2 (Fig. 5c), QH reduces by around 10 W m−2 (Fig. 5e), mostly in SLP and ELP as a result of increased VEGFRA, LAI, and Z0 (Fig. 3a, c, g). Changes in Rnet and QE are statistically significant at a 95 % confidence level over most of the region, but statistically significant changes in QH are mostly limited to SLP and ELP (see the embedded subplots in each panel, Fig. 5a, c, e). As a consequence of further revegetation (LCfutr–LC2001), Rnet, QE, and QH changes are intensified (Fig. 5b, d, f), especially in SLP where large areas of croplands are converted to forest leading to large changes in land surface biogeophysical parameters in LCfutr (Figs. 2, 3).
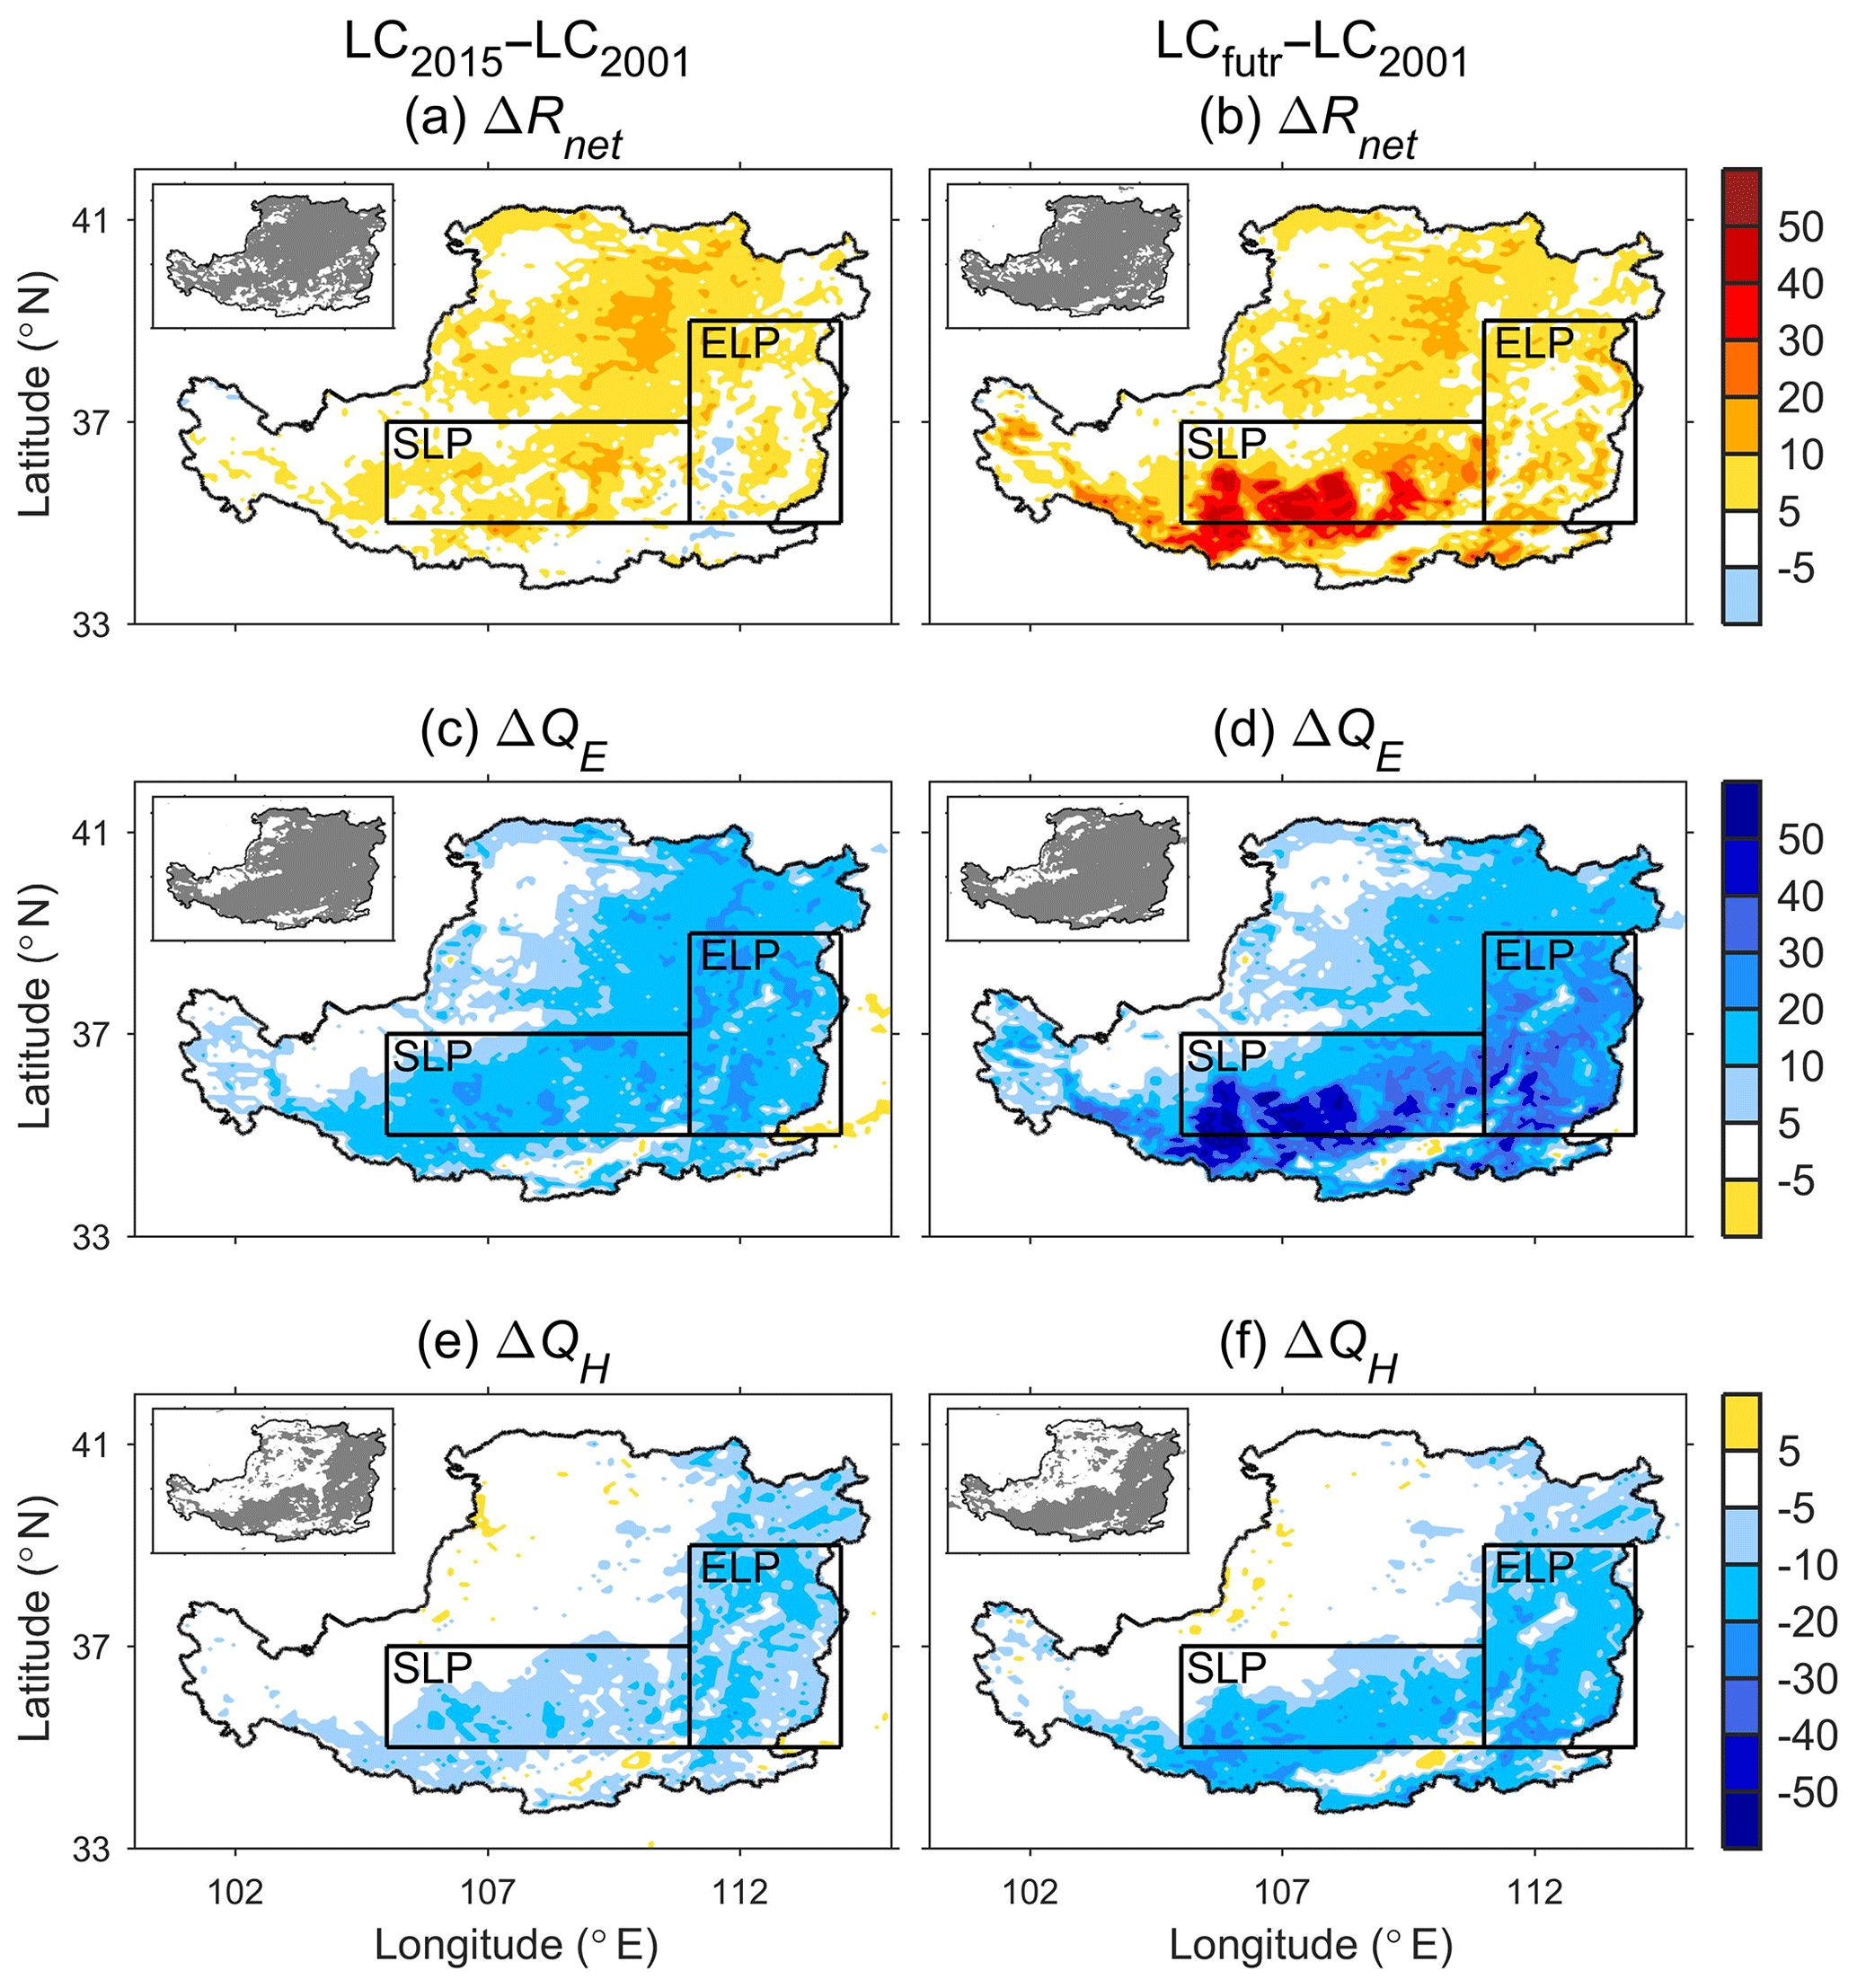
Figure 5Changes in June–July–August–September mean (a, b) land surface net radiation (W m−2), (c, d) latent heat flux (W m−2), and (e, f) sensible heat flux (W m−2) between the LC2001 and LC2015 (LC2015–LC2001; a, c, and e) and between the LC2001 and LCfutr (LCfutr–LC2001; b, d, and f) over the Loess Plateau from 1996 to 2015. The south Loess Plateau (SLP) and east Loess Plateau (ELP) regions are defined in Fig. 2. The map of the statistical significance test is shown in the inset figure in the upper-left corner of each panel. Gray denotes that the local change is statistically significant at a 95 % confidence level using a two-tailed Student's t test.
Focusing on SLP, the increase in evapotranspiration (ET) is 0.49 mm d−1 between LC2001 and LC2015 (Fig. 6a). WRF simulates further water loss (0.85 mm d−1) through ET if the revegetation is continued in the future (Fig. 6c). For ELP, where relatively fewer croplands or barren areas can be further converted to forests in LCfutr, the future ET increase is still considerable (0.72 mm d−1; Fig. 6b, d). The values of the regional mean ET change among the 20 members of LC2015–LC2001 and LCfutr–LC2001 remain consistently positive over SLP and ELP. This indicates that the simulated higher ET is a consistent result from WRF as a consequence of revegetation since the launch of the GFGP and is likely to be further strengthened by continued revegetation over the Loess Plateau.
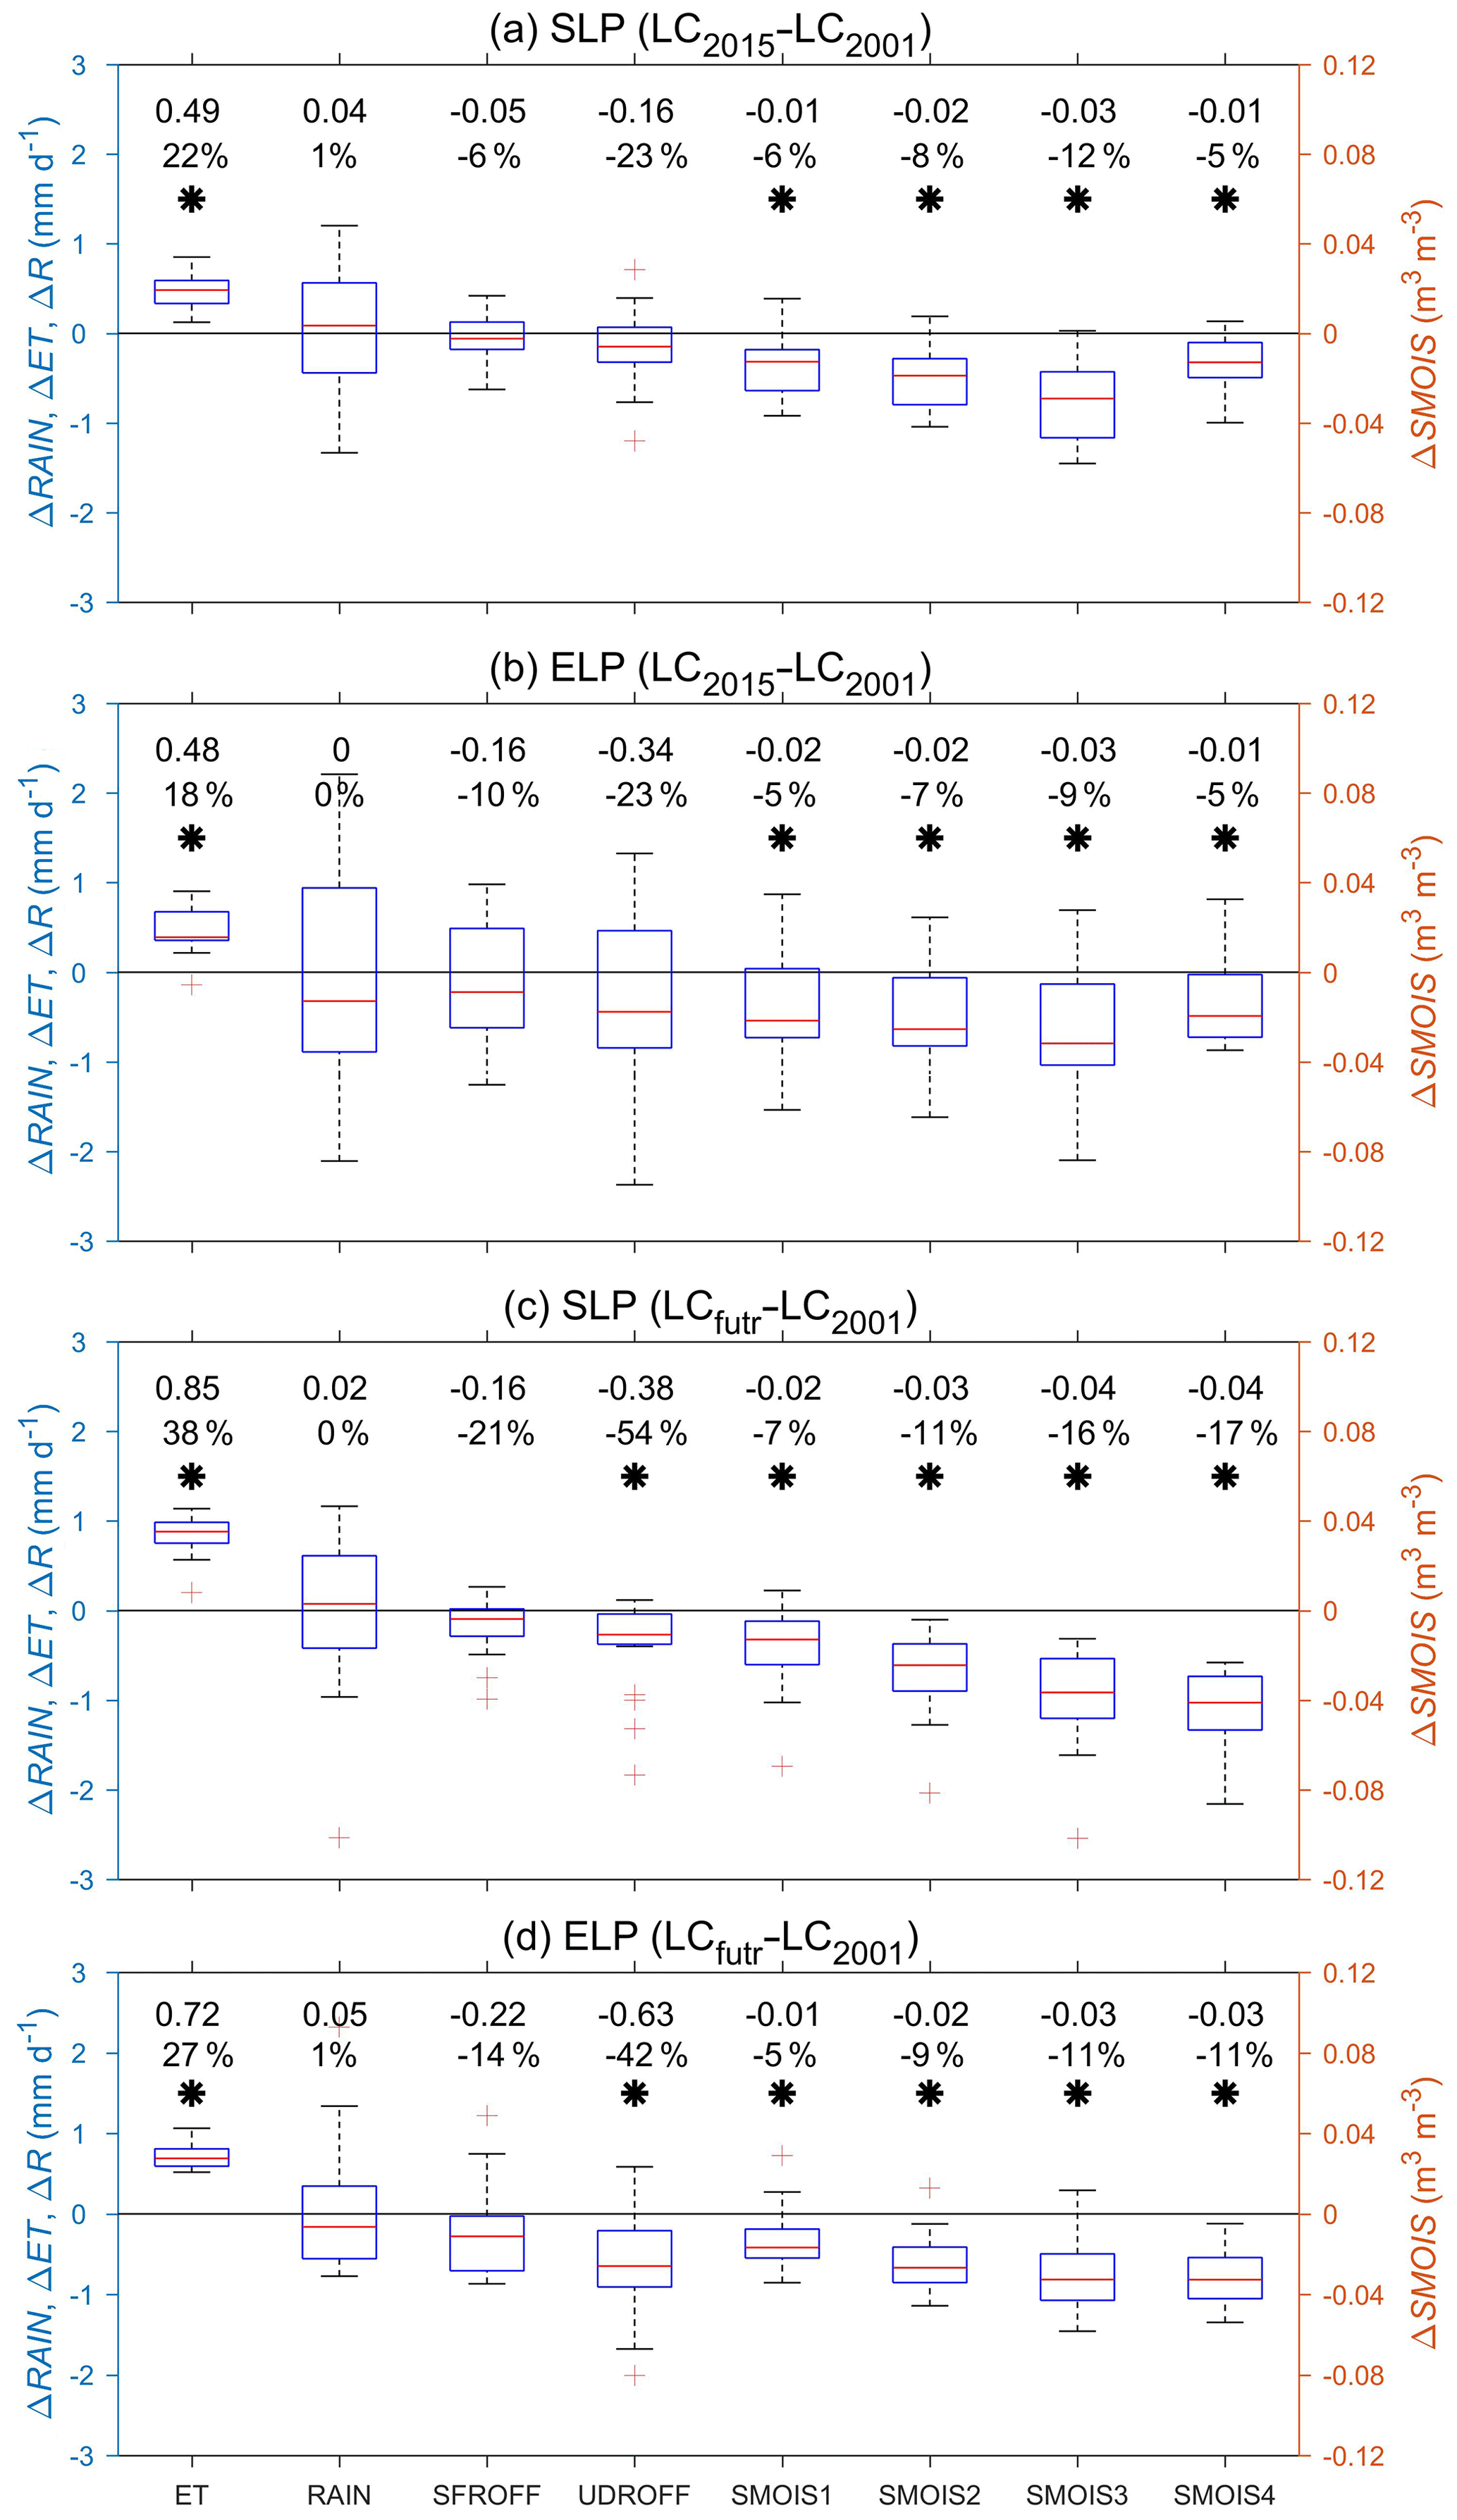
Figure 6Box plot of changes in June–July–August–September mean evapotranspiration (ET, mm d−1), rainfall (RAIN, mm d−1), surface runoff (SFROFF, mm d−1), underground runoff (UDROFF, mm d−1), and soil moisture (m3 m−3) of the first layer (SMOIS1, 0–10 cm), the second layer (SMOIS2, 10–40 cm), the third layer (SMOIS3, 40–100 cm), and the fourth layer (SMOIS4, 100–200 cm) averaged over (a, c) the south Loess Plateau and (b, d) the east Loess Plateau between LC2001 and LC2015 (LC2015–LC2001; a, b) and between LC2001 and LCfutr (LCfutr–LC2001; c, d) from 1996 to 2015. The south Loess Plateau (SLP) and east Loess Plateau (ELP) regions are defined in Fig. 2. The first and second line members denote absolute and relative changes averaged by 20 members. The black asterisk denotes that the change is statistically significant at a 95 % confidence level using a two-tailed Student's t test.
3.3 Impacts on rainfall
Increased ET can contribute to the formation of clouds and rainfall; therefore, we examine whether this is the case for the Loess Plateau. The RAIN is composed of convective rainfall (RAINC), calculated by the cumulus convection scheme, and non-convective rainfall (RAINNC), calculated by microphysics scheme, in WRF. Thus we separate RAINC and RAINNC changes in addition to the RAIN change in Fig. 7. As for LC2015–LC2001, the change in RAIN is spatially heterogeneous, with an increase of up to 1.2 mm d−1 in small parts of the northeast and a decrease of around −1.0 mm d−1 along the southeast border of the Loess Plateau (Fig. 7a). The RAIN change is divided almost evenly between RAINC and RAINNC (Fig. 7c, e). However, most of the RAIN, RAINC, and RAINNC changes are not statistically significant. In terms of LCfutr–LC2001, RAIN, RAINC, and RAINNC are not significantly changed by further revegetation (Fig. 7b, d, f). Moreover, the increased RAIN in the northeast Loess Plateau occurring in LC2015–LC2001 dissipates when further revegetation is implemented, while the changes in both land cover type and biophysical parameters are relatively small over this region. This increased RAIN should be maintained in LCfutr–LC2001 if the change in RAIN is robust for LC2015–LC2001. We will analyze the increased RAIN of the northeast Loess Plateau in LC2015–LC2001 in Sect. 3.6.
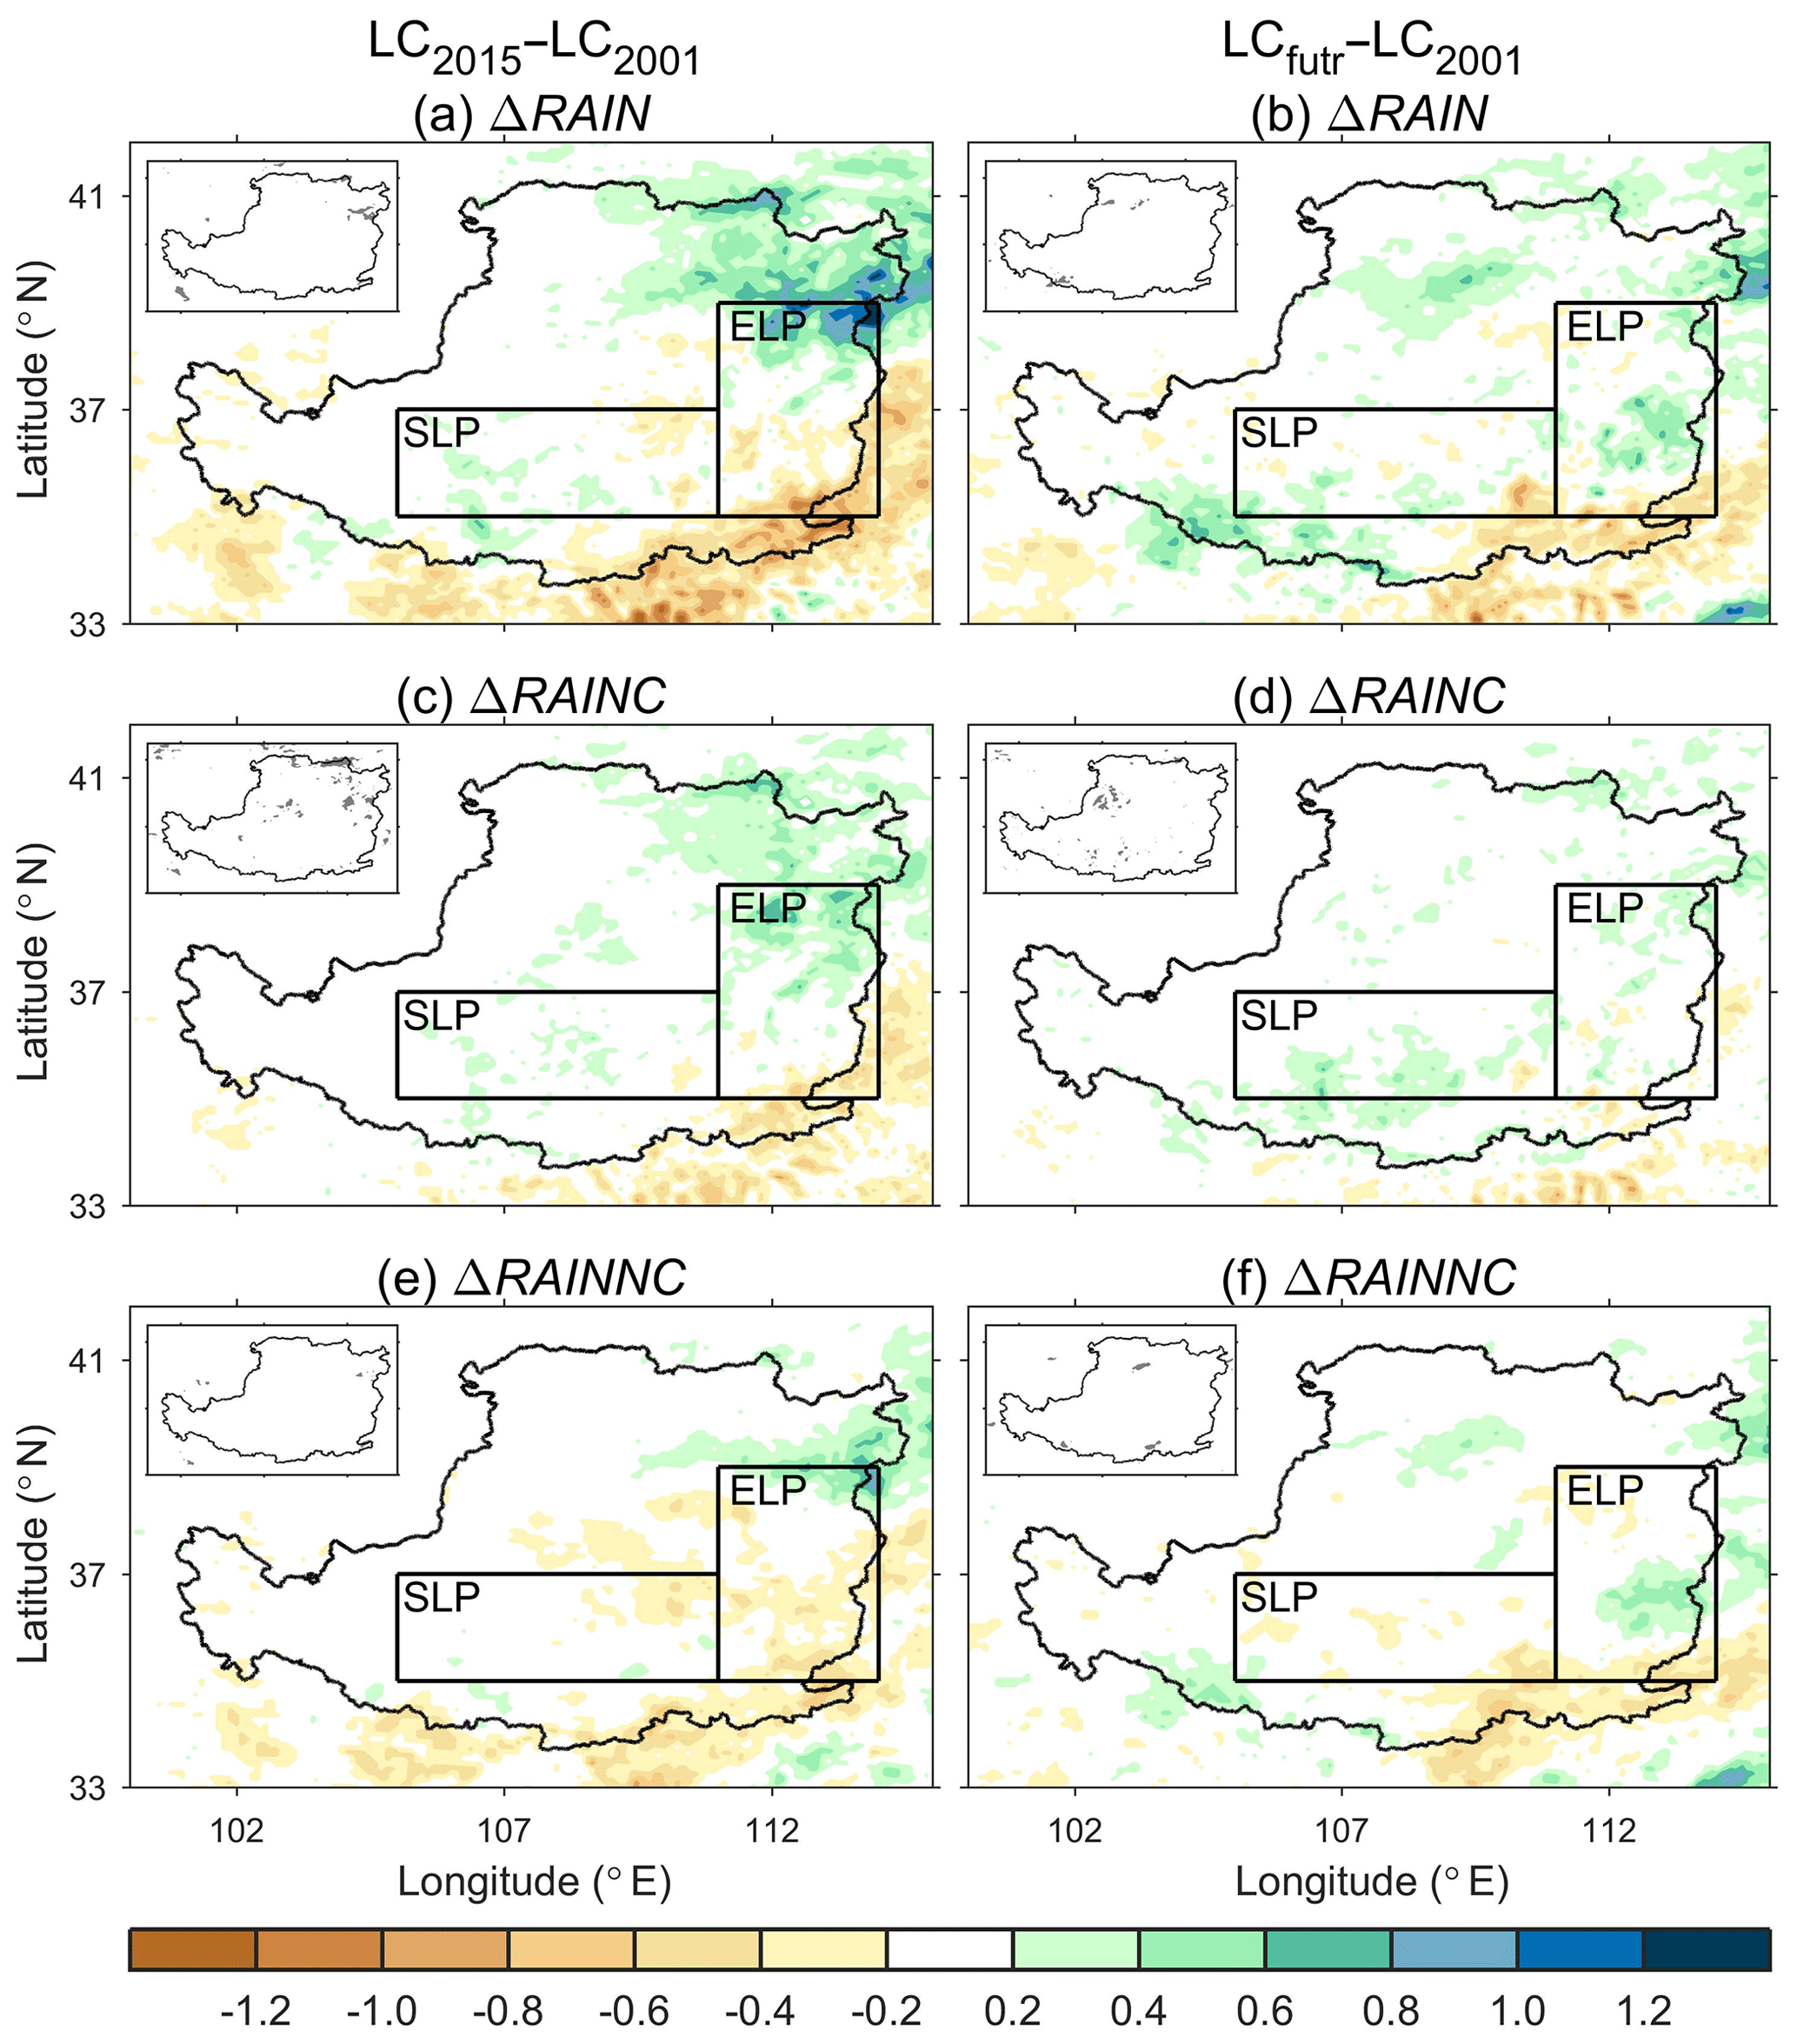
Figure 7Same as in Fig. 5 but for (a, b) total rainfall (mm d−1), (c, d) convective rainfall (mm d−1), and (e, f) non-convective rainfall (mm d−1). The south Loess Plateau (SLP) and east Loess Plateau (ELP) regions are defined in Fig. 2.
For both LC2015–LC2001 and LCfutr–LC2001, most RAIN changes seem to be randomly scattered around the Loess Plateau instead of being located coincident with SLP or ELP where land cover type, land surface biogeophysical parameters, and land surface fluxes are most strongly modified (Fig. 7a, b). In contrast, the RAIN change is negligible over SLP and ELP for both LC2015–LC2001 and LCfutr–LC2001 (Figs. 6, 7). However, the RAIN change in individual realizations is not small, e.g., the RAIN change varies from −2.11 to 2.21 mm d−1 over the ELP for LC2015–LC2001 (Fig. 6b). Thus, averaging the divergent RAIN changes among the 20 members causes a negligible RAIN change overall. This large variability in RAIN changes among the 20 members can be attributed to either different boundary conditions (background climate), which cause the impact of land cover change to diverge (Pitman et al., 2011), or model internal variability. This will be further analyzed in Sect. 3.6.
3.4 Impacts on runoff
As a consequence of the significant ET increase and negligible and statistically insignificant RAIN change, underground runoff (UDROFF) is reduced by up to 1.5 mm d−1 locally for LC2015–LC2001 (Fig. 8c). Averaged over the SLP and ELP, the UDROFF decreases by 0.16 mm d−1 (−23 %) and 0.34 mm d−1 (−23 %) for SLP and ELP, respectively (Fig. 6a, b). These UDROFF changes are not statistically significant and vary strongly among the 20 members, suggesting a large uncertainty in the UDROFF change. WRF simulated a larger UDROFF decrease due to further revegetation (Fig. 8d), especially over SLP and ELP where the regional mean UDROFF decreases by 0.38 mm d−1 (−54 %) and 0.63 (−42 %), respectively (Fig. 6c, d). These UDROFF decreases are statistically significant at a 95 % confidence level for both SLP and ELP. Moreover, the upper quartile of UDROFF changes among the 20 members systematically shift below 0 mm d−1 for both the SLP and ELP. These results indicate a larger chance of a UDROFF decrease if revegetation is continued over the SLP and ELP. Moreover, the spatial change in UDROFF is consistent with that of the net budget of RAIN and ET (RAIN–ET) for both LC2015–LC2001 and LCfutr–LC2001 (Fig. 8e, f), suggesting that the UDROFF change can be mostly explained by the change in RAIN–ET. We also note some UDROFF changes in adjacent regions of the Loess Plateau (Fig. 8c, d) associated with RAIN changes (Fig. 7a, b).

Figure 8Same as Fig. 5 but for (a, b) surface runoff (mm d−1), (c, d) underground runoff (mm d−1), and (e, f) rainfall minus evapotranspiration (mm d−1). The south Loess Plateau (SLP) and east Loess Plateau (ELP) regions are defined in Fig. 2.
Compared with the UDROFF change, the surface runoff (SUROFF) change is mostly small for both LC2015–LC2001 and LCfutr–LC2001 (Fig. 8a, b). However, the relative change of SUROFF is considerable, especially for LCfutr–LC2001 in which SUROFF decreased by 21 % for SLP and 14 % for ELP (Fig. 6c, d). We also find that the upper quartile of the SUROFF change systematically shifts below 0 mm d−1, although the SUROFF change is not statistically significant for LCfutr–LC2001.
3.5 Impacts on soil moisture
In addition to the decline in runoff, the soil moisture (SMOIS) of each layer is significantly reduced over the Loess Plateau for LC2015–LC2001 (Fig. 9a, c, e, g) with larger decreases in the middle two layers. The regional mean SMOIS for the SLP decreases by 0.02 m m−3 (−8 %) and 0.03 m m−3 (−12 %) for the second and third layers, respectively (Fig. 6a). WRF simulated further falls in soil moisture following further revegetation, with a larger impact on deeper soil layer moisture (Fig. 9b, d, f, h). For example, the decrease in the regional mean soil moisture of the bottom layer for the SLP varies from −0.01 (or −5 %) in LC2015–LC2001 (Fig. 6a) to −0.04 (or −17 %) in LCfutr–LC2001 (Fig. 6c). Similar to the UDROFF change, the spatial change in SMOIS for each layer is consistent with that of RAIN–ET for both LC2015–LC2001 and LCfutr–LC2001 (Fig. 8e, f).
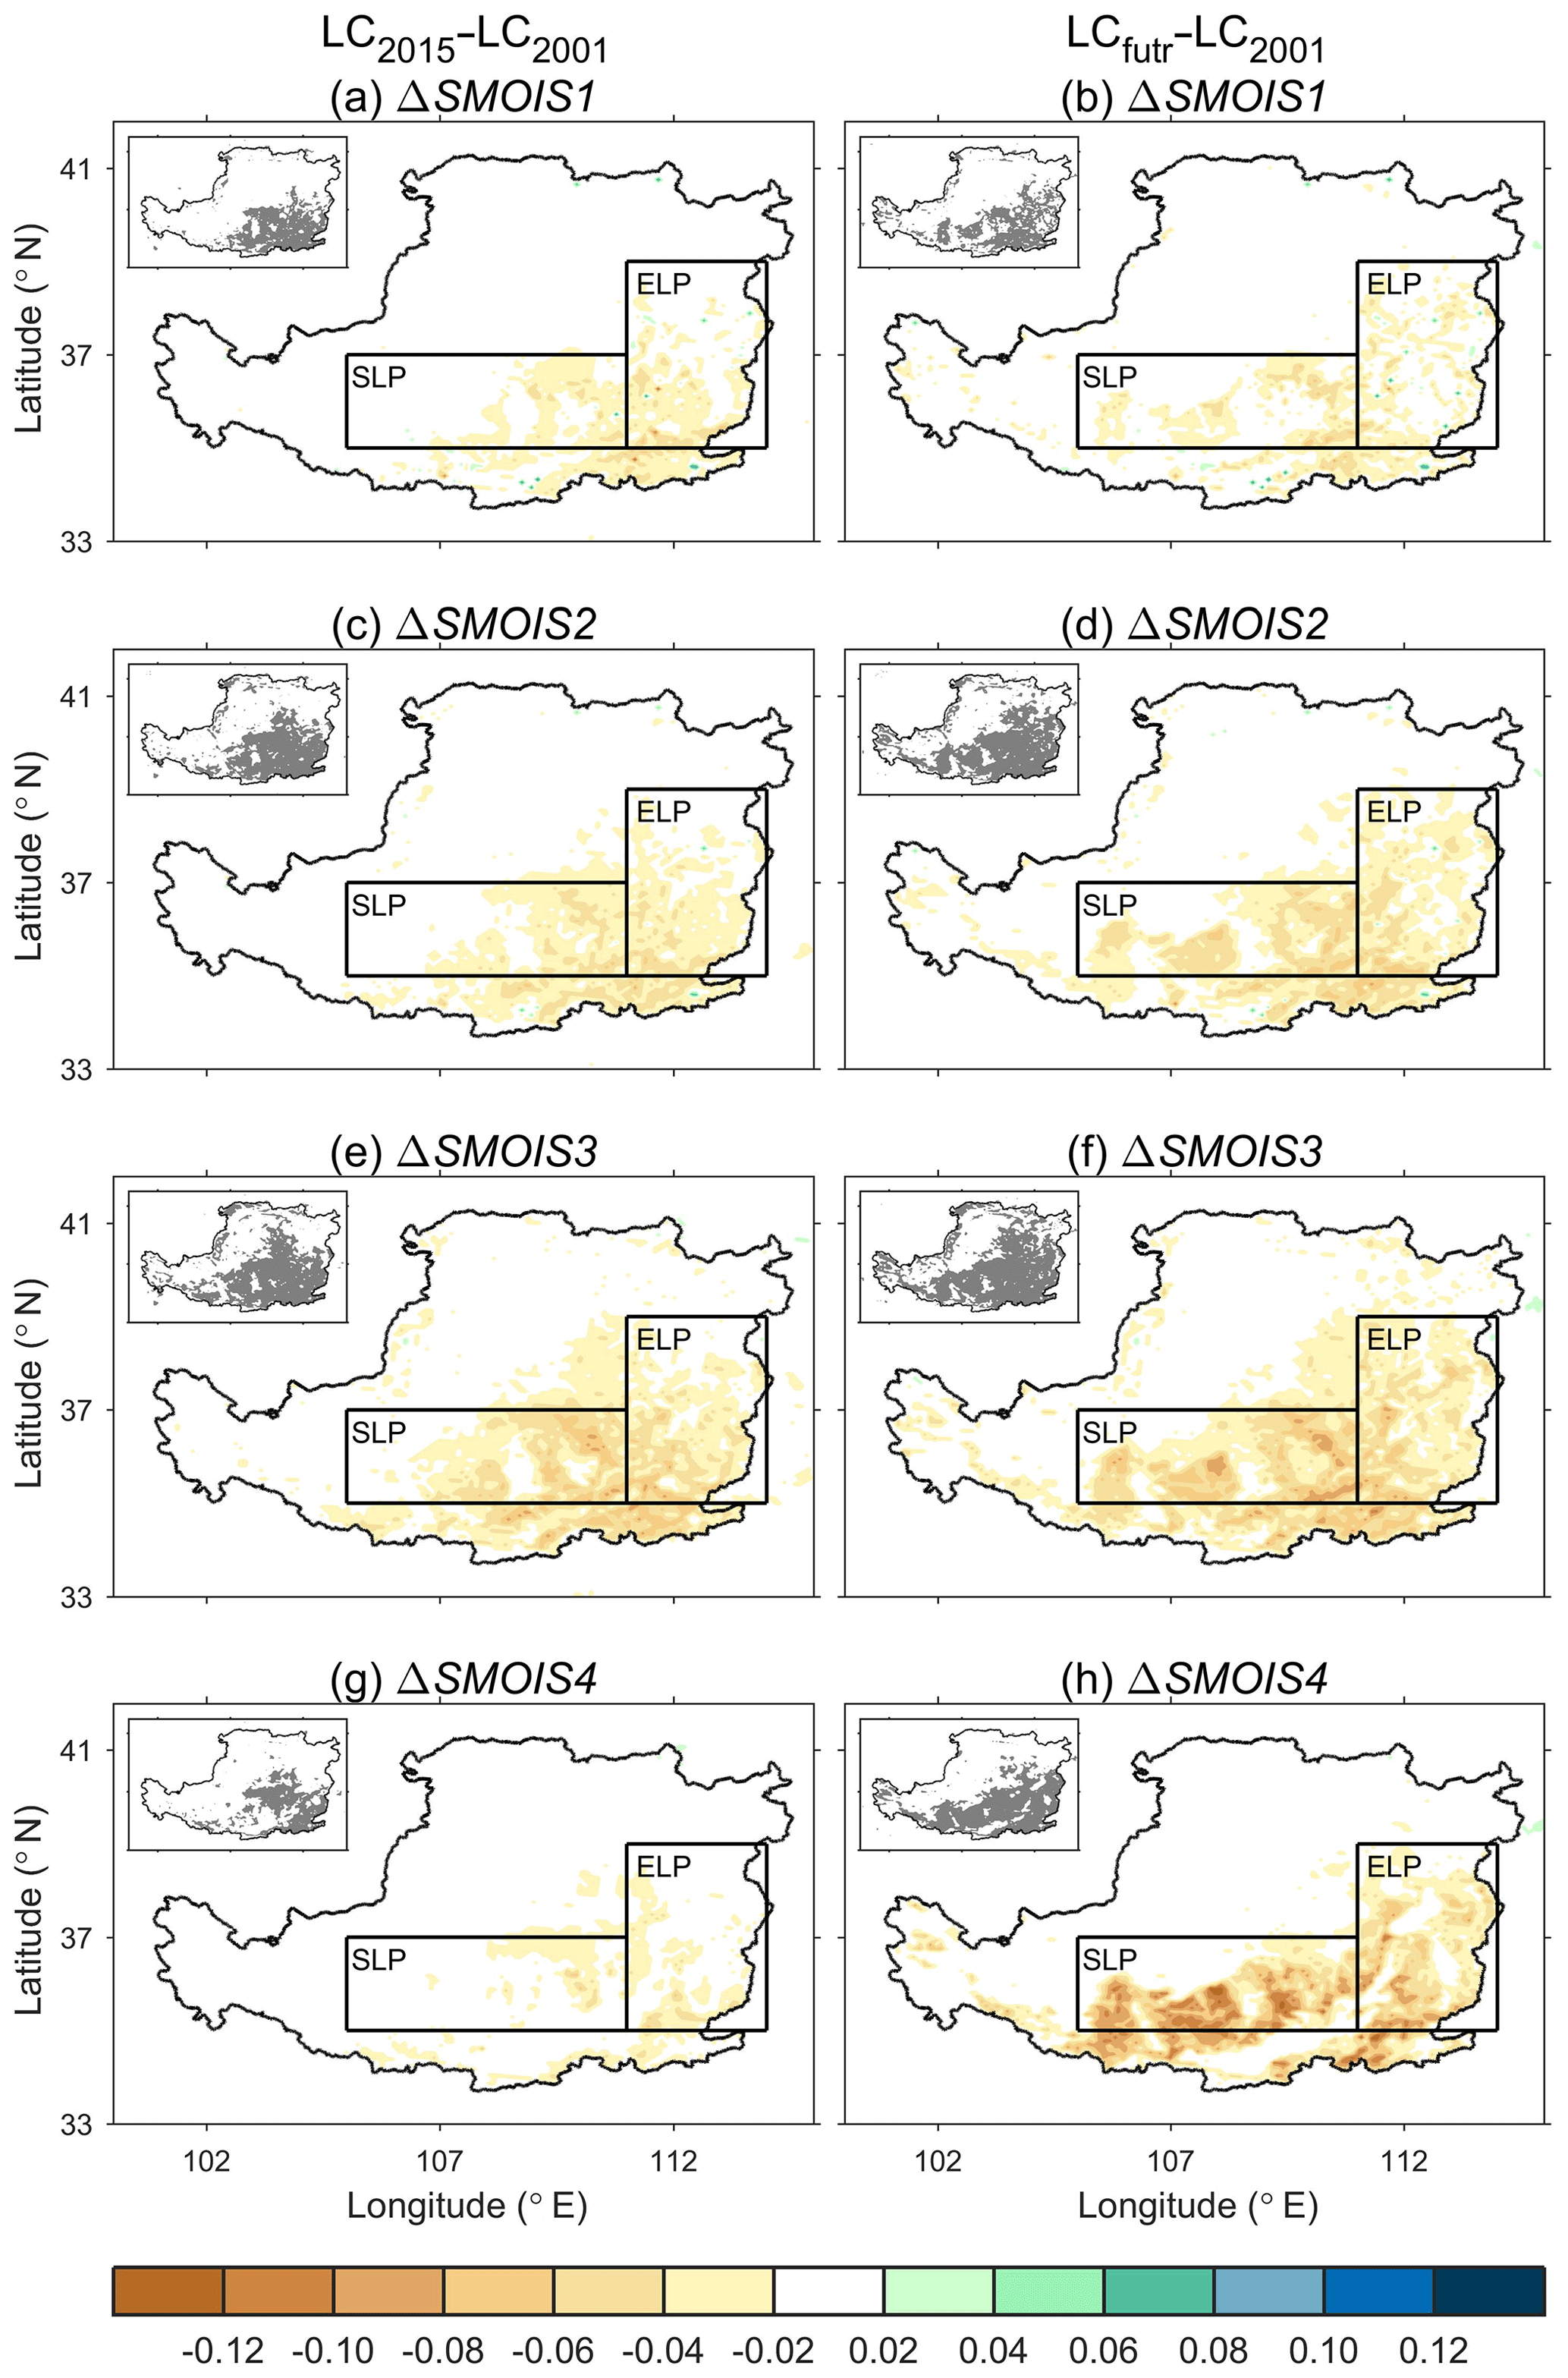
Figure 9Same as Fig. 5 but for the soil moisture change (m3 m−3) of (a, b) the first layer (0–10 cm), (c, d) the second layer (10–40 cm), (e, f) the third layer (40–100 cm), and (g, h) the fourth layer (100–200 cm). The south Loess Plateau (SLP) and east Loess Plateau (ELP) regions are defined in Fig. 2.
3.6 Robust identification of rainfall change
We found a large variability in changes in RAIN among the 20 members over the SLP and ELP for both LC2015–LC2001 and LCfutr–LC2001. We next examine whether these can be attributed to revegetation. We first show the RAIN change in individual members for LC2015–LC2001 (Fig. 10). Large variability in RAIN changes among the 20 members occurs throughout the study region. Even the increase in RAIN over the northeast Loess Plateau (Fig. 7a), which is available by comparing multiyear mean RAIN between LC2001 and LC2015, is not consistent for every year. As for the northeast Loess Plateau, the RAIN shows an increase in 8 years (1997, 2001, 2003, 2004, 2007, 2010, 2012, and 2015), a decrease in 5 years (1996, 1999, 2006, 2009, and 2014), and negligible change in the other 7 years. This results in a net increase in RAIN over the 20 years, but a different selection of years could show an overall decrease (the result is similar for LCfutr–LC2001, not shown). Similarly, other statistically significant RAIN changes occur in the study region (e.g., decreased RAIN to the southwest Loess Plateau shown in Fig. 7a), but these are not consistent across the 20 years. As mentioned earlier, this large variability in RAIN changes among the 20 members is possibly attributed to different boundary conditions (background climate); we next examine whether this is true over the Loess Plateau.
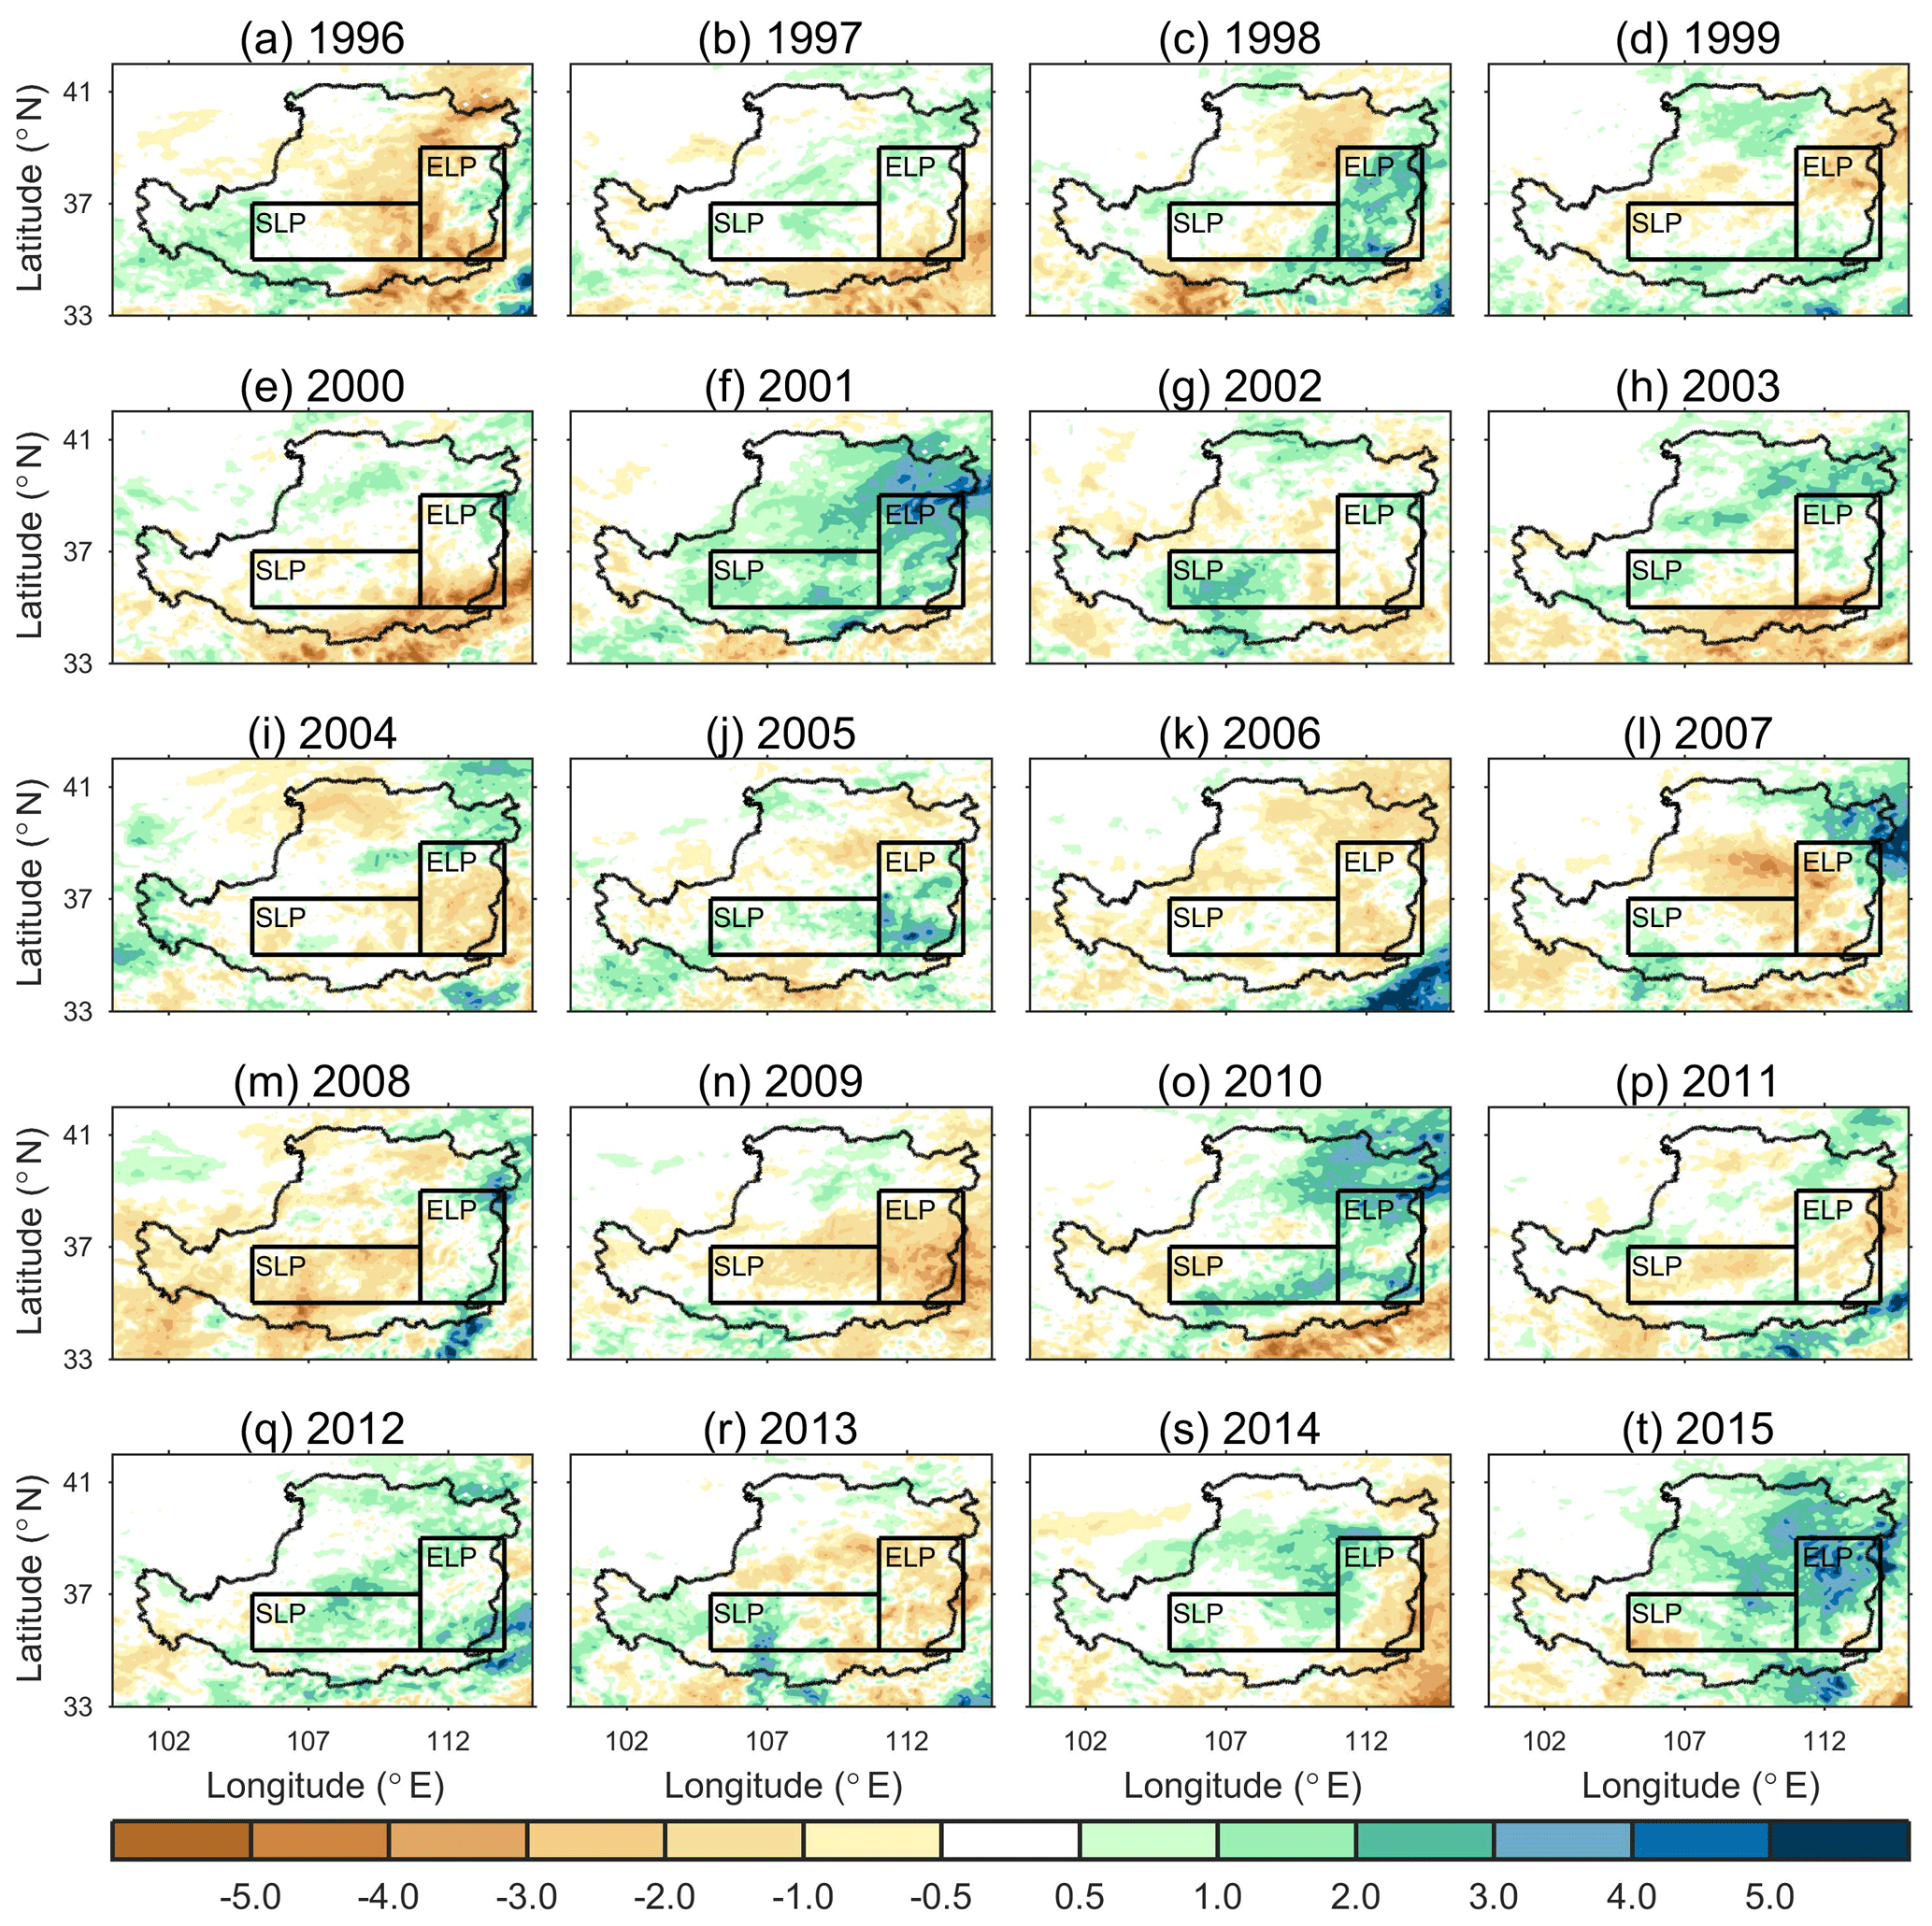
Figure 10Changes in the June–July–August–September mean rainfall (mm d−1) of each realization member (years) between the LC2001 and LC2015 (LC2015–LC2001) over the Loess Plateau from 1996 to 2015. The south Loess Plateau (SLP) and east Loess Plateau (ELP) regions are defined in Fig. 2.

Figure 11Changes in the June–July–August–September mean rainfall (mm d−1) of each realization member (a–k) and ensemble mean (l) between the LCENS2001 and LCENS2015 (LC2015–LC2001) over the Loess Plateau in 2001. The south Loess Plateau (SLP) and east Loess Plateau (ELP) regions are defined in Fig. 2. The map of the statistical significance test is shown in the inset figure in the upper-left corner of panel (l). Gray denotes that the local change is statistically significant at a 95 % confidence level using a two-tailed Student's t test.
We note that the pattern of RAIN change in 2001 is very similar to the multiyear averaged pattern, although with a larger magnitude (Figs. 7a, 10f). The RAIN increase of the northeast Loess Plateau in only 2001 explains about 30 % of the multiyear mean RAIN increase in the same region. Therefore, we show the RAIN change in each realization for LCENS2015–LCENS2001 in Fig. 11. These 11 ensemble members share the same boundary conditions with small differences in initial conditions. In contrast with the increased RAIN obtained from setting the initial date to 1 May (Fig. 10f), the RAIN changes are modified by an advance of 1 to 10 d in initial conditions. For example, WRF cannot simulate the increased RAIN over the northeast Loess Plateau when using an initial date of 22, 25, 27, or 30 April, highlighting that the RAIN change is very sensitive to the initial conditions. Thus, the RAIN increase in 2001 with an initial date of 1 May is likely associated with internal variability rather than revegetation. In another words, the RAIN change due to revegetation is negligible relative to the RAIN change induced by internal variability. Thus, we conclude that the multiyear averaged RAIN increase over northeast Loess Plateau for LC2015–LC2001 (Fig. 7a) cannot be robustly linked to revegetation.
3.7 How many members do we need to get a robust signal?
Model internal variability is inevitable when we use models to investigate the impact of land cover change on climate. The model internal variability can be minimized as the number of individual realizations is increased to form a larger sample to calculate any average. Therefore, we examine the relationship between the RAIN change and the number of realization members (Fig. 12). Focusing on the SLP and ELP, the range of RAIN change decreases as the number of realizations increases. For example, the RAIN change over the ELP varies from −0.97 to 1.07 mm d−1 when only three members are included. The range of RAIN is narrowed to between −0.25 and 0.24 mm d−1 when 15 members are simulated. It is similar for LCENS2015–LCENS2001: the range in the change in RAIN decreases as the number of simulation members increases. The change in RAIN suggests an increase of 0.48 and 0.40 mm d−1 for SLP and ELP, respectively, when the simulation members are increased to 11.

Figure 12The relationship between the changes in the June–July–August–September mean rainfall (mm d−1) and the number of members. The number of members ranges from 1 to 20 for (a, b) LC2015–LC2001 and (c, d) LCfutr–LC2001 and from 1 to 11 for (e, f) LCENS2015–LCENS2001. The mean rainfall change is averaged over (a, c, e) the south Loess Plateau and (b, d, f) the east Loess Plateau, respectively. The south Loess Plateau (SLP) and east Loess Plateau (ELP) regions are defined in Fig. 2. For a given number of realizations, the rainfall is averaged over these members. The gray area denotes the range of rainfall changes from all possible combinations of a given number of members. The red dashed line denotes the 5th and 95th percentile of the rainfall changes from all possible combinations of a given number of members.
Following the launch of the GFGP by China in the late 1990s, the Loess Plateau has shown a significant greening trend, although with simultaneous concerns about water security for agriculture and other human activities. We investigated the impact of revegetation on the hydrology of the Loess Plateau since the launch of the GFGP using WRF. Simulations show that the revegetation of the plateau is associated with a decrease in runoff and soil moisture as a consequence of higher evapotranspiration and little feedback from rainfall. Our results on changes of evapotranspiration, soil moisture, and runoff are broadly consistent with both field (Jia et al., 2017; Jian et al., 2015; Jin et al., 2011) and satellite (Feng et al., 2017; Li et al., 2016; Xiao, 2014) observations. For example, the spatial pattern of our simulated soil moisture decline in the growing season is similar to observations from the Advanced Microwave Scanning Radiometer on the Earth Observing System by the Japanese Aerospace Exploration Agency (Feng et al., 2017). Although the increased evapotranspiration due to revegetation of the Loess Plateau has been examined before (e.g., Cao et al., 2017, 2019; Li et al., 2018; Lv et al., 2019b), the reduction in runoff and soil moisture in response to revegetation of the Loess Plateau, which is consistent with observations, has rarely been reported in modeling results to date. Moreover, our simulated weak response of rainfall to the revegetation of the Loess Plateau, which is hard to determine from observations, is useful in assessing the hydrometeorology of this region.
We also investigated the potential future impact on the hydrology of the Loess Plateau if revegetation was continued, which has not been assessed before but is important for both scientific communities and policymakers. WRF suggests that further revegetation would exacerbate soil moisture and runoff declines with particularly large effects on the underground runoff and soil moisture in deeper layers. Our simulations suggested that the potential revegetation that could still be achieved would have larger consequences than those simulated since the launch of the GFGP. Our results provide useful advances in our understanding of the impact of further revegetation on the Loess Plateau. For example, both Feng et al. (2016) and S. L. Zhang et al. (2018) estimated the current vegetation over the Loess Plateau is approaching or may have exceeded the threshold of ecological equilibrium. They omitted the potential response of rainfall to further revegetation over the Loess Plateau when predicting future thresholds (Feng et al., 2016; S. L. Zhang et al., 2018). Our result demonstrate that there is almost no feedback of rainfall associated with further revegetation, supporting the approach of Feng et al. (2016) and S. L. Zhang et al. (2018) in this specific region. That said, our approach does not attempt to incorporate changes in climate over the Loess Plateau; thus, the viability of large-scale reforestation in this region is not something that we attempted to assess.
We focused on the response of rainfall to revegetation over the Loess Plateau, which is probably the most uncertain of the hydrological components. WRF shows little response of rainfall to revegetation since the launch of the GFGP, which contradicts earlier results (Cao et al., 2017, 2019; Li et al., 2018; Lv et al., 2019b). Moreover, the rainfall is weakly affected by further revegetation despite a large increase in evapotranspiration. We also demonstrate that the rainfall change is strongly affected by internal variability and a large number of realizations are required before any impact of revegetation on rainfall might be robustly identified. We suggest that some previous studies (Cao et al., 2017, 2019; Lv et al., 2019b) based on model simulations may have exaggerated the impact of revegetation on rainfall over the Loess Plateau due to the lack of sufficient realizations. For example, Cao et al. (2017, 2019) and Lv et al. (2019b) used the same WRF to perform only three- or five-member simulations, and concluded a significant change in rainfall caused by revegetation over the Loess Plateau. More interestingly, Cao et al. (2017, 2019) obtained different conclusions on the rainfall change over the Loess Plateau with same WRF model. They used a broadly similar experimental design but a different spatial resolution (30 and 10 km, respectively) and simulations from 2001 to 2002 with three ensembles and consecutive simulation from 2000 to 2004, respectively. We could also demonstrate large changes in rainfall over the plateau if we chose three to five members, but we could demonstrate either large increases or large decreases in three- to five-member averages. Returning to Fig. 6, ET shows a highly consistent increase in the response to revegetation among the 20 years, suggesting that ET change is robustly linked to revegetation. Although changes in runoff and soil moisture also show large variability among the 20 years, the distribution of the runoff and soil moisture changes are negatively biased. More importantly, the distribution of the runoff and soil moisture changes systematically shift towards negative values. This suggests that runoff and soil moisture changes are very likely linked to revegetation. The large variability in runoff or soil moisture changes is induced by the large variability of rainfall. Given the tight linkage between rainfall and runoff or soil moisture, the changes in runoff or soil moisture tend to be mistakenly represented if the rainfall change is not robustly examined, and this requires internal model variability to be thoroughly addressed.
Our studies are also subject to some caveats. First, observations of soil moisture declines associated with revegetation can be alleviated once trees mature (Jia et al., 2017; Jin et al., 2011). Our simulations only capture an initial decline in runoff and soil moisture linked to the higher evapotranspiration, and we note that the impact of revegetation on the long-time trend (25–50 years) would be valuable. Second, we used current boundary conditions (1996–2015) for WRF to predict the impact of further revegetation on the hydrology, which means that the boundary conditions do not change in the future in response to climate change. This suggests that we might underestimate the impact of further revegetation in the future if the future climate of the Loess Plateau suffers from large changes in response to global warming. Third, uncertainties exist in the current land surface model used to represent the response of vegetation to climate change in future. While using satellite observations to construct the land surface biogeophysical parameters helps overcome some land surface parameter limitations, this approach is obviously limited looking forward in terms of the status of future vegetation. Furthermore, we note that our results are likely model dependent, as we only used one model. Although we performed relatively high-resolution simulations (10 km for the nested domain), the cumulus convection scheme remains necessary and is a further potential source of uncertainty. These factors account for the discrepancy between our result and another model-based study (Li et al., 2018). Li et al. (2018) found a positive rainfall feedback to greening and, consequently, small changes in runoff and soil moisture over north China using a global climate model. In contrast, we demonstrate the rainfall change is too small to compensate for the strongly enhanced evapotranspiration, causing a reduction of runoff and soil moisture in response to revegetation over the Loess Plateau. A large ensemble of models, each with a reasonable number of realizations, is needed to build a model-independent assessment of the impact of revegetation; however, this is clearly beyond the scope of this study. Last, we investigated the impact of revegetation or greening, rather than GFGP, on the hydrology of the Loess Plateau. Directly linking our results to the impact of GFGP on the hydrology of the Loess Plateau should be avoided.
Overall, our results highlight how revegetation of the Loess Plateau led to increased evapotranspiration and how, as a consequence, the runoff and soil moisture declined. This is consistent with the understanding of land surface processes and how they respond to land cover change (Bonan, 2008). Critical in this impact of revegetation on the hydrology is what happens to rainfall. If the higher evapotranspiration increases rainfall, revegetation has the potential to increase soil moisture and runoff. It is very likely this would be the consequences in some regions, such as Amazonia (Lawrence and Vandecar, 2015; Perugini et al., 2017; Spracklen et al., 2018) and Sahel (Kemena et al., 2018; Xue and Shukla, 1996; Yosef et al., 2018). However, over the Loess Plateau we find no such result; thus, the higher evapotranspiration simply leads to lower soil moisture and runoff. Additionally, Bargues Tobella et al. (2014) reported a positive impact of trees on soil hydraulic properties influencing groundwater recharge when termite mounds are taken into account in Africa. However, termite mounds are rare over the Loess Plateau suggesting that this positive impact of trees is unlikely to occur. An implication of this result is that further revegetation, which requires water to be sustained, may not be viable. We also recognize that afforestation can help to sequester carbon, mitigate warming, and alleviate soil erosion. Therefore, if and how to implement further revegetation should be cautiously determined with the pros and cons of afforestation being carefully weighted for the Loess Plateau.
We evaluated how the growing season hydrology of the Loess Plateau has been impacted by revegetation since the launch of the “Grain for Green Program” and by further revegetation in the future using the WRF model. We used satellite observations to describe key biophysical parameters including decreased albedo and increased leaf area index and the fraction of photosynthetically active radiation. The observed greening trend increased evapotranspiration, but because the impact on rainfall was negligible the underground runoff and soil moisture both decreased. Further future revegetation enhanced evapotranspiration but still had little impact on rainfall. Thus, overall, revegetation over the Loess Plateau leads to higher evapotranspiration and, as a consequence, lower water availability for agriculture or other human demands. Considering the negative impact of revegetation on runoff and soil moisture and the lack of benefits on rainfall, we caution that further revegetation may threaten local water security over the Loess Plateau.
The MODIS land cover type product (MCD12Q1) and LAI/FPAR products (MCD15A2H and MOD15A2H) are available from NASA's Land Processes Distributed Active Archive Center (LP DAAC): https://lpdaac.usgs.gov/data/ (last access: 1 September 2018; Friedl and Sulla-Menashe, 2019; Myneni et al., 2015a, b). The GLASS albedo product is available from the Global Land Surface Satellite (GLASS) products download and service: http://glass-product.bnu.edu.cn/ (last access: 1 September 2018; Liang and Liu, 2012). The ERA-Interim reanalysis data are available from the European Centre for Medium-Range Weather Forecasts (ECMWF) data server: https://www.ecmwf.int/en/forecasts/datasets/reanalysis-datasets/era-interim (Dee et al., 2011). The gridded observation dataset is available from the National Meteorological Information Center of the China Meteorological Administration: http://data.cma.cn/data/cdcindex.html (Zhao et al., 2014). The code for the Weather Research and Forecasting model is available from http://www2.mmm.ucar.edu/wrf/users/ (last access: 1 September 2018; Skamarock et al., 2008).
CF, JG, and WG developed the scientific hypotheses and designed the research. JG, AJP, and BZ analyzed the data and wrote the paper. All authors contributed to the discussion of the results and to revising the paper.
The authors declare that they have no conflict of interest.
This work is supported by the Jiangsu Collaborative Innovation Center for Climate Change. The model simulations were conducted on the NCI (National Computational Infrastructure) at the Australian National University, Canberra. The authors gratefully acknowledge financial support from the China Scholarship Council. The authors also acknowledge Xing Yuan and two anonymous reviewers for their constructive comments on this work.
This research has been supported by the Natural Science Foundation of China (grant nos. 41775075 and 41475063) and the Australian Research Council via the Centre of Excellence for Climate Extremes (grant no. CE170100023).
This paper was edited by Xing Yuan and reviewed by two anonymous referees.
Anderson, R. G., Canadell, J. G., Randerson, J. T., Jackson, R. B., Hungate, B. A., Baldocchi, D. D., Ban-Weiss, G. A., Bonan, G. B., Caldeira, K., Cao, L., Diffenbaugh, N. S., Gurney, K. R., Kueppers, L. M., Law, B. E., Luyssaert, S., and O'Halloran, T. L.: Biophysical considerations in forestry for climate protection, Front. Ecol. Environ., 9, 174–182, https://doi.org/10.1890/090179, 2011.
Bargues Tobella, A., Reese, H., Almaw, A., Bayala, J., Malmer, A., Laudon, H., and Ilstedt, U.: The effect of trees on preferential flow and soil infiltrability in an agroforestry parkland in semiarid Burkina Faso, Water Resour. Res., 50, 3342–3354, https://doi.org/10.1002/2013WR015197, 2014.
Bonan, G. B.: Forests and climate change: Forcings, feedbacks, and the climate benefits of forests, Science, 320, 1444–1449, https://doi.org/10.1126/science.1155121, 2008.
Bright, R. M., Zhao, K. G., Jackson, R. B., and Cherubini, F.: Quantifying surface albedo and other direct biogeophysical climate forcings of forestry activities, Global Change Biol., 21, 3246–3266, https://doi.org/10.1111/gcb.12951, 2015.
Bryan, B. A., Gao, L., Ye, Y. Q., Sun, X. F., Connor, J. D., Crossman, N. D., Stafford-Smith, M., Wu, J. G., He, C. Y., Yu, D. Y., Liu, Z. F., Li, A., Huang, Q. X., Ren, H., Deng, X. Z., Zheng, H., Niu, J. M., Han, G. D., and Hou, X. Y.: China's response to a national land-system sustainability emergency, Nature, 559, 193–204, https://doi.org/10.1038/s41586-018-0280-2, 2018.
Cao, Q., Yu, D. Y., Georgescu, M., and Wu, J. G.: Substantial impacts of landscape changes on summer climate with major regional differences: The case of China, Sci. Total Environ., 625, 416–427, https://doi.org/10.1016/j.scitotenv.2017.12.290, 2017.
Cao, Q., Wu, J. G., Yu, D. Y., and Wang, W.: The biophysical effects of the vegetation restoration program on regional climate metrics in the Loess Plateau, China, Agr. Forest Meteorol., 268, 169–180, https://doi.org/10.1016/j.agrformet.2019.01.022, 2019.
Cao, S. X., Chen, L., Shankman, D., Wang, C. M., Wang, X. B., and Zhang, H.: Excessive reliance on afforestation in China's arid and semi-arid regions: Lessons in ecological restoration, Earth-Sci. Rev., 104, 240–245, https://doi.org/10.1016/j.earscirev.2010.11.002, 2011.
Chen, L., Ma, Z. G., Mahmood, R., Zhao, T. B., Li, Z. H., and Li, Y. P.: Recent land cover changes and sensitivity of the model simulations to various land cover datasets for China, Meteorol. Atmos. Phys., 129, 395–408, https://doi.org/10.1007/s00703-016-0478-5, 2017.
Chen, Y. P., Wang, K. B., Lin, Y. S., Shi, W. Y., Song, Y., and He, X. H.: Balancing green and grain trade, Nat. Geosci., 8, 739–741, https://doi.org/10.1038/ngeo2544, 2015.
Christensen, O. B., Gaertner, M. A., Prego, J. A., and Polcher, J.: Internal variability of regional climate models, Clim. Dynam., 17, 875–887, https://doi.org/10.1007/s003820100154, 2001.
Dee, D. P., Uppala, S. M., Simmons, A. J., Berrisford, P., Poli, P., Kobayashi, S., Andrae, U., Balmaseda, M. A., Balsamo, G., Bauer, P., Bechtold, P., Beljaars, A. C. M., van de Berg, L., Bidlot, J., Bormann, N., Delsol, C., Dragani, R., Fuentes, M., Geer, A. J., Haimberger, L., Healy, S. B., Hersbach, H., Holm, E. V., Isaksen, L., Kallberg, P., Kohler, M., Matricardi, M., McNally, A. P., Monge-Sanz, B. M., Morcrette, J. J., Park, B. K., Peubey, C., de Rosnay, P., Tavolato, C., Thepaut, J. N., and Vitart, F.: The ERA-Interim reanalysis: Configuration and performance of the data assimilation system, Q. J. Roy. Meteor. Soc., 137, 553–597, https://doi.org/10.1002/qj.828, 2011 (data available at: https://www.ecmwf.int/en/forecasts/datasets/reanalysis-datasets/era-interim, last access: 1 September 2018).
Deng, X. Z., Shi, Q. L., Zhang, Q., Shi, C. C., and Yin, F. Impacts of land use and land cover changes on surface energy and water balance in the Heihe River Basin of China, 2000–2010, Phys. Chem. Earth, 79–82, 2–10, https://doi.org/10.1016/j.pce.2015.01.002, 2015.
de Noblet-Ducoudre, N., Boisier, J. P., Pitman, A., Bonan, G. B., Brovkin, V., Cruz, F., Delire, C., Gayler, V., van den Hurk, B. J. J. M., Lawrence, P. J., van der Molen, M. K., Muller, C., Reick, C. H., Strengers, B. J., and Voldoire, A.: Determining Robust Impacts of Land-Use-Induced Land Cover Changes on Surface Climate over North America and Eurasia: Results from the First Set of LUCID Experiments, J. Climate, 25, 3261–3281, https://doi.org/10.1175/JCLI-D-11-00338.1, 2012.
Dudhia, J.: Numerical study of convection observed during the winter monsoon experiment using a mesoscale two-dimensional model, J. Atmos. Sci., 46, 3077–3107, https://doi.org/10.1175/1520-0469(1989)046<3077:NSOCOD>2.0.CO;2, 1989.
Ek, M. B.: Implementation of Noah land surface model advances in the National Centers for Environmental Prediction operational mesoscale Eta model, J. Geophys. Res.-Atmos., 108, 8851, https://doi.org/10.1029/2002JD003296, 2003.
Fan, X. G., Ma, Z. G., Yang, Q., Han, Y. H., Mahmood, R., and Zheng, Z. Y.: Land use/land cover changes and regional climate over the Loess Plateau during 2001–2009. Part I: observational evidence, Climatic Change, 129, 427–440, https://doi.org/10.1007/s10584-014-1069-4, 2015
Feng, X. M., Fu, B. J., Piao, S. L., Wang, S. A., Ciais, P., Zeng, Z. Z., Lu, Y. H., Zeng, Y., Li, Y., Jiang, X. H., and Wu, B. F.: Revegetation in China's Loess Plateau is approaching sustainable water resource limits, Nat. Clim. Change, 6, 1019, https://doi.org/10.1038/NCLIMATE3092, 2016.
Feng, X. M., Li, J. X., Cheng, W., Fu, B. J., Wang, Y. Q., Lu, Y. H., and Shao, M. A.: Evaluation of AMSR-E retrieval by detecting soil moisture decrease following massive dryland re-vegetation in the Loess Plateau, China, Remote Sens. Environ., 196, 253–264, https://doi.org/10.1016/j.rse.2017.05.012, 2017.
Findell, K. L., Knutson, T. R., and Milly, P. C. D.: Weak simulated extratropical responses to complete tropical deforestation, J. Climate, 19, 2835–2850, https://doi.org/10.1175/JCLI3737.1, 2006.
Friedl, M. and Sulla-Menashe, D.: MCD12Q1 MODIS/Terra+Aqua Land Cover Type Yearly L3 Global 500m SIN Grid V006 [MCD12Q1], NASA EOSDIS Land Processes DAAC, https://doi.org/10.5067/MODIS/MCD12Q1.006, 2019.
Fu, B. J., Wang, S., Liu, Y., Liu, J. B., Liang, W., and Miao, C. Y.: Hydrogeomorphic Ecosystem Responses to Natural and Anthropogenic Changes in the Loess Plateau of China, Annu. Rev. Earth Pl. Sc., 45, 223–243, https://doi.org/10.1146/annurev-earth-063016-020552, 2017.
Ge, J., Pitman, A. J., Guo, W. D., Wang, S. Y., and Fu, C. B.: Do Uncertainties in the Reconstruction of Land Cover Affect the Simulation of Air Temperature and Rainfall in the CORDEX Region of East Asia? J. Geophys. Res.-Atmos., 124, 3647–3670, https://doi.org/10.1029/2018JD029945, 2019.
Giorgi, F. and Bi, X. Q.: A study of internal variability of a regional climate model, J. Geophys. Res.-Atmos., 105, 29503–29521, https://doi.org/10.1029/2000JD900269, 2000.
He, J. J., Yu, Y., Yu, L. J., Liu, N., and Zhao, S. P.: Impacts of uncertainty in land surface information on simulated surface temperature and precipitation over China, Int. J. Climatol., 37, 829–847, https://doi.org/10.1002/joc.5041, 2017.
Hong, S. Y. and Lim, J. O. J.: The WRF Single-Moment 6-Class Microphysics Scheme (WSM6), J. Kor. Meteorol. Soc., 42, 129–151, 2006.
Hong, S. Y., Noh, Y., and Dudhia, J.: A new vertical diffusion package with an explicit treatment of entrainment processes, Mon. Weather Rev., 134, 2318–2341, https://doi.org/10.1175/MWR3199.1, 2006.
Jia, X. X., Shao, M. A., Zhu, Y. J., and Luo, Y.: Soil moisture decline due to afforestation across the Loess Plateau, China, J. Hydrol., 546, 113–122, https://doi.org/10.1016/j.jhydrol.2017.01.011, 2017.
Jian, S. Q., Zhao, C. Y., Fang, S. M., and Yu, K.: Effects of different vegetation restoration on soil water storage and water balance in the Chinese Loess Plateau, Agr. Forest Meteorol., 206, 85–96, https://doi.org/10.1016/j.agrformet.2015.03.009, 2015.
Jimenez, P. A., Dudhia, J., Gonzalez-Rouco, J. F., Navarro, J., Montavez, J. P., and Garcia-Bustamante, E.: A Revised Scheme for the WRF Surface Layer Formulation, Mon. Weather Rev., 140, 898–918, https://doi.org/10.1175/MWR-D-11-00056.1, 2012.
Jin, T. T., Fu, B. J., Liu, G. H., and Wang, Z.: Hydrologic feasibility of artificial forestation in the semi-arid Loess Plateau of China, Hydrol. Earth Syst. Sci., 15, 2519–2530, https://doi.org/10.5194/hess-15-2519-2011, 2011.
Kain, J. S.: The Kain-Fritsch convective parameterization: An update, J. Appl. Meteorol. Clim., 43, 170–181, https://doi.org/10.1175/1520-0450(2004)043<0170:TKCPAU>2.0.CO;2, 2004.
Kemena, T. P., Matthes, K., Martin, T., Wahl, S., and Oschlies, A.: Atmospheric feedbacks in North Africa from an irrigated, afforested Sahara, Clim. Dynam., 50, 4561–4581, https://doi.org/10.1007/s00382-017-3890-8, 2018.
Kumar, A., Chen, F., Barlage, M., Ek, M. B., and Niyogi, D.: Assessing Impacts of Integrating MODIS Vegetation Data in the Weather Research and Forecasting (WRF) Model Coupled to Two Different Canopy-Resistance Approaches, J. Appl. Meteorol. Clim., 53, 1362–1380, https://doi.org/10.1175/JAMC-D-13-0247.1, 2014.
Lawrence, D. and Vandecar, K.: Effects of tropical deforestation on climate and agriculture, Nat. Clim. Change, 5, 27–36, https://doi.org/10.1038/NCLIMATE2430, 2015.
Li, D., Bou-Zeid, E., Barlage, M., Chen, F., and Smith, J. A.: Development and evaluation of a mosaic approach in the WRF-Noah framework, J. Geophys. Res.-Atmos., 118, 11918–11935, https://doi.org/10.1002/2013JD020657, 2013.
Li, J. J., Peng, S. Z., and Li, Z.: Detecting and attributing vegetation changes on China's Loess Plateau, Agr. Forest Meteorol., 247, 260–270, https://doi.org/10.1016/j.agrformet.2017.08.005, 2017.
Li, S., Liang, W., Fu, B. J., Lu, Y. H., Fu, S. Y., Wang, S., and Su, H. M.: Vegetation changes in recent large-scale ecological restoration projects and subsequent impact on water resources in China's Loess Plateau, Sci. Total Environ., 569, 1032–1039, https://doi.org/10.1016/j.scitotenv.2016.06.141, 2016.
Li, Y., Piao, S. L., Li, L. Z. X. Chen, A. P., Wang, X. H., Ciais, P., Huang, L., Lian, X., Peng, S. S., Zeng, Z. Z., Wang, K., and Zhou, L. M.: Divergent hydrological response to large-scale afforestation and vegetation greening in China, Sci. Adv., 4, eaar4182, https://doi.org/10.1126/sciadv.aar4182, 2018.
Liang, S. L. and Liu, Q.: Global Land Surface Products: Albedo Product Data Collection (1985–2010), Beijing Normal University, 2012, https://doi.org/10.6050/glass863.3001.db, 2012.
Liang, W., Bai, D., Wang, F. Y., Fu, B. J., Yan, J. P., Wang, S., Yang, Y. T., Long, D., and Feng, M. Q.: Quantifying the impacts of climate change and ecological restoration on streamflow changes based on a Buddy hydrological model in China's Loess Plateau, Water Resour. Res., 51, 6500–6519, https://doi.org/10.1002/2014WR016589, 2015.
Liu, J. G., Li, S. X., Ouyang, Z. Y., Tam, C., and Chen, X. D.: Ecological and socioeconomic effects of China's policies for ecosystem services, P. Natl. Acad. Sci. USA, 105, 9477–9482, https://doi.org/10.1073/pnas.0706436105, 2008.
Liu, N. F., Liu, Q., Wang, L. Z., Liang, S. L., Wen, J. G., Qu, Y., and Liu, S. H.: A statistics-based temporal filter algorithm to map spatiotemporally continuous shortwave albedo from MODIS data, Hydrol. Earth Syst. Sci., 17, 2121–2129, https://doi.org/10.5194/hess-17-2121-2013, 2013.
Liu, Z. Y., Notaro, M., Kutzbach, J., and Liu, N.: Assessing global vegetation-climate feedbacks from observations, J. Climate, 19, 787–814, https://doi.org/10.1175/JCLI3658.1, 2006.
Lorenz, R., Pitman, A. J., and Sisson, S. A.: Does Amazonian deforestation cause global effects; can we be sure? J. Geophys. Res.-Atmos., 121, 5567–5584, https://doi.org/10.1002/2015JD024357, 2016.
Lv, M. X., Ma, Z. G., Li, M. X., and Zheng, Z. Y.: Quantitative analysis of terrestrial water storage changes under the Grain for Green Program in the Yellow River basin, J. Geophys. Res.-Atmos., 124, 1336–1351, https://doi.org/10.1029/2018JD029113, 2019a.
Lv, M. X., Ma, Z. G., and Peng, S. M.: Responses of terrestrial water cycle components to afforestation within and around the Yellow River basin, Atmos. Ocean. Sci. Lett., 12, 116–123, https://doi.org/10.1080/16742834.2019.1569456, 2019b.
Ma, D., Notaro, M., Liu, Z. Y., Chen, G. S., and Liu, Y. Q.: Simulated impacts of afforestation in East China monsoon region as modulated by ocean variability, Clim. Dynam., 41, 2439–2450, https://doi.org/10.1007/s00382-012-1592-9, 2013.
Miao, C. Y., Ni, J. R., and Borthwick, A. G. L.: Recent changes of water discharge and sediment load in the Yellow River basin, China, Prog. Phys. Geog., 34, 541–561, https://doi.org/10.1177/0309133310369434, 2010.
Mlawer, E. J., Taubman, S. J., Brown, P. D., Iacono, M. J., and Clough, S. A.: Radiative transfer for inhomogeneous atmospheres: RRTM, a validated correlated-k model for the longwave, J. Geophys. Res.-Atmos., 102, 16663–16682, https://doi.org/10.1029/97JD00237, 1997.
Myneni, R., Knyazikhin, Y., and Park, T.: MCD15A2H MODIS/Terra+Aqua Leaf Area Index/FPAR 8-day L4 Global 500m SIN Grid V006 [MCD15A2H], NASA EOSDIS Land Processes DAAC, https://doi.org/10.5067/MODIS/MCD15A2H.006, 2015a.
Myneni, R., Knyazikhin, Y., and Park, T.: MOD15A2H MODIS/Terra Leaf Area Index/FPAR 8-Day L4 Global 500m SIN Grid V006 [MOD15A2H], NASA EOSDIS Land Processes DAAC, https://doi.org/10.5067/MODIS/MOD15A2H.006, 2015b.
Peng, J., Chen, S. L., and Dong, P.: Temporal variation of sediment load in the Yellow River basin, China, and its impacts on the lower reaches and the river delta, Catena, 32, 135–147, https://doi.org/10.1016/j.catena.2010.08.006, 2010.
Perugini, L., Caporaso, L., Marconi, S., Cescatti, A., Quesada, B., de Noblet-Ducoudre, N., House, J. I., and Arneth, A.: Biophysical effects on temperature and precipitation due to land cover change, Environ. Res. Lett., 12, 0530012, https://doi.org/10.1088/1748-9326/aa6b3f, 2017.
Piao, S. L., Yin, G. D., Tan, J. G., Cheng, L., Huang, M. T., Li, Y., Liu, R. G., Mao, J. F., Myneni, R. B., Peng, S. S., Poulter, B., Shi, X. Y., Xiao, Z. Q., Zeng, N., Zeng, Z. Z., and Wang, Y. P.: Detection and attribution of vegetation greening trend in China over the last 30 years, Glob. Change Biol., 21, 1601–1609, https://doi.org/10.1111/gcb.12795, 2015.
Pitman, A. J., de Noblet-Ducoudre, N., Cruz, F. T., Davin, E. L., Bonan, G. B., Brovkin, V., Claussen, M., Delire, C., Ganzeveld, L., Gayler, V., van den Hurk, B. J. J. M., Lawrence, P. J., van der Molen, M. K., Muller, C., Reick, C. H., Seneviratne, S. I., Strengers, B. J., and Voldoire, A.: Uncertainties in climate responses to past land cover change: First results from the LUCID intercomparison study, Geophys. Res. Lett., 36, L14814, https://doi.org/10.1029/2009GL039076, 2009.
Pitman, A. J., Avila, F. B., Abramowitz, G., Wang, Y. P., Phipps, S. J., and de Noblet-Ducoudre, N.: Importance of background climate in determining impact of land-cover change on regional climate, Nat. Clim. Change, 1, 472–475, https://doi.org/10.1038/NCLIMATE1294, 2011.
Sato, T. and Xue, Y. K.: Validating a regional climate model's downscaling ability for East Asian summer monsoonal interannual variability, Clim. Dynam., 41, 2411–2426, https://doi.org/10.1007/s00382-012-1616-5, 2013.
Skamarock, W. C., Klemp, J. B., Dudhia, J., Gill, D. O., Barker, D. M., Duda, M. G., Barker, D. M., Huang, X. Y., Wang, W., and Powers, J. G.: A description of the advanced research WRF version 3, NCAR Tech. Note NCAR/TN-475+STR, 133 pp., https://doi.org/10.5065/D68S4MVH, 2008.
Spracklen, D. V., Baker, J. C. A., Garcia-Carreras, L., and Marsham, J. H.: The Effects of Tropical Vegetation on Rainfall, Annu. Rev. Env. Resour., 43, 193–218, https://doi.org/10.1146/annurev-environ-102017-030136, 2018.
Sulla-Menashe, D., Gray, J. M., Abercrombie, S. P., and Friedl, M. A.: Hierarchical mapping of annual global land cover 2001 to present: The MODIS Collection 6 Land Cover product, Remote Sens. Environ., 222, 183–194, https://doi.org/10.1016/j.rse.2018.12.013, 2019.
Sun, Q. H., Miao, C. Y., Duan, Q. Y., and Wang, Y. F.: Temperature and precipitation changes over the Loess Plateau between 1961 and 2011, based on high-density gauge observations, Global Planet. Change, 132, 1–10, https://doi.org/10.1016/j.gloplacha.2015.05.011, 2015.
Tang, X., Miao, C. Y., Xi, Y., Duan, Q. Y., Lei, X. H., and Li, H.: Analysis of precipitation characteristics on the loess plateau between 1965 and 2014, based on high-density gauge observations, Atmos. Res., 213, 264–274, https://doi.org/10.1016/j.atmosres.2018.06.013, 2018.
Wang, S., Fu, B. J., Gao, G. Y., Yao, X. L., and Zhou, J.: Soil moisture and evapotranspiration of different land cover types in the Loess Plateau, China, Hydrol. Earth Syst. Sci., 16, 2883–2892, https://doi.org/10.5194/hess-16-2883-2012, 2012.
Wang, S., Fu, B. J., Piao, S. L., Lu, Y. H., Ciais, P., Feng, X. M., and Wang, Y. F.: Reduced sediment transport in the Yellow River due to anthropogenic changes, Nat. Geosci., 9, 38–41, https://doi.org/10.1038/NGEO2602, 2016.
Wang, Y. L., Feng, J. M., and Gao, H.: Numerical simulation of the impact of land cover change on regional climate in China, Theor. Appl. Climatol., 115, 141–152, https://doi.org/10.1007/s00704-013-0879-z, 2014.
Winckler, J., Reick, C. H., and Pongratz, J.: Robust Identification of Local Biogeophysical Effects of Land-Cover Change in a Global Climate Model, J. Climate, 30, 1159–1176, https://doi.org/10.1175/JCLI-D-16-0067.1, 2017.
Xiao, J. F.: Satellite evidence for significant biophysical consequences of the “Grain for Green” Program on the Loess Plateau in China, J. Geophys. Res.-Biogeo., 119, 2261–2275, https://doi.org/10.1002/2014JG002820, 2014.
Xue, Y. K. and Shukla, J.: The influence of land surface properties on Sahel climate .2. Afforestation, J. Climate, 9, 3260–3275, https://doi.org/10.1175/1520-0442(1996)009<3260:TIOLSP>2.0.CO;2, 1996.
Yosef, G., Walko, R., Avisar, R., Tatarinov, F., Rotenberg, E., and Yakir, D.: Large-scale semi-arid afforestation can enhance precipitation and carbon sequestration potential, Sci. Rep., 8, 996, https://doi.org/10.1038/s41598-018-19265-6, 2018.
Yu, E. T., Sun, J. Q., Chen, H. P., and Xiang, W. L.: Evaluation of a high-resolution historical simulation over China: climatology and extremes, Clim. Dynam., 45, 2013–2031, https://doi.org/10.1007/s00382-014-2452-6, 2015.
Zhai, J., Liu, R. G., Liu, J. Y., Huang, L., and Qin, Y. W.: Human-Induced Landcover Changes Drive a Diminution of Land Surface Albedo in the Loess Plateau (China), Remote Sens., 7, 2926–2941, https://doi.org/10.3390/rs70302926, 2015.
Zhang, L. J., Wang, C. Z., Li, X. X., Zhang, H. W., Li, W. L., and Jiang, L. Q. Impacts of agricultural expansion (1910s–2010s) on the water cycle in the Songneng Plain, Northeast China, Remote Sens., 10, 1108, https://doi.org/10.3390/rs10071108, 2018.
Zhang, S. L., Yang, D. W., Yang, Y. T., Piao, S. L., Yang, H. B., Lei, H. M., and Fu, B. J.: Excessive afforestation and soil drying on China's Loess Plateau, J. Geophys. Res.-Biogeo., 123, 923–935, https://doi.org/10.1002/2017JG004038, 2018.
Zhao, T. B., Guo, W. D., and Fu, C. B.: Calibrating and evaluating reanalysis surface temperature error by topographic correction, J. Climate, 21, 1440–1446, https://doi.org/10.1175/2007JCLI1463.1, 2008.
Zhao, Y. F., Zhu, J., and Xu, Y.: Establishment and assessment of the grid precipitation datasets in China for recent 50 years, J. Meteorol. Sci., 34, 414–420, https://doi.org/10.3969/2013jms.0008, 2014 (data available at: http://data.cma.cn/data/cdcindex.html, last access: 1 September 2018).