the Creative Commons Attribution 4.0 License.
the Creative Commons Attribution 4.0 License.
 | 26 Feb 2020
Field-based estimation and modelling of distributed groundwater recharge in a Mediterranean karst catchment, Wadi Natuf, West Bank
Clemens Messerschmid
Martin Sauter
Jens Lange
While groundwater recharge is one of the most prominently covered subjects in hydrogeology, the spatial distribution of recharge has been given relatively little attention, especially in semi-arid, karstic aquifers. Under conditions of highly diverse geology, relief, vegetation and land use, the complexity and variability of spatially distributed hydrological processes remains a challenge in many regions around the world. This is particularly true for hitherto ungauged basins, such as Wadi Natuf, a 103 km2 large karstic Eastern Mediterranean watershed in the Palestinian upstream mountain and recharge area of the Western Aquifer Basin (WAB), which is shared with Israel in the coastal plain. In this first in a series of two papers, distributed recharge is estimated and represented, based on 7 years of extensive field observations and measurements and based conceptually on observable physical landscape features such as geology, land use and land cover (LU/LC) and especially soil conditions. For the first time in the WAB, a forward calculated soil moisture and percolation model (SMSP) was set up with parameters directly gained from field observations. The model was parameterised in a strictly parsimonious manner, as a one-dimensional model (a.k.a. “tank”, bucket or box model). This is based on dominant hydrological processes, in particular saturation excess in the soil column, and identifying patterns of linkage between different landscape features. Average soil thickness was encountered at the range of decimetres, rarely above one metre. Both soil thickness and LU/LC features, such as terraced olive groves or forests as well as grassland or barren rock outcrops, were found to be highly formation specific. This linkage allowed us to further simplify the model and its requirements in a realistic manner for eight soil moisture stations, chosen at six different geological formations with typical soil and LU/LC representations. The main result of the model was the determination of formation-specific recharge coefficients, spatially ranging between 0 % and almost 60 % of annual rainfall or up to 300 mm a−1 in Wadi Natuf's climate. The karstified main aquifers showed recharge coefficients (RC) above 40 % and even the less prominent slightly aquitardal local aquifers reached RC values above 30 %. The model was separately tested on two conceptual levels: on the level of basin form (soil moisture) and basin response (signatures of peak recharge and local spring discharge events) under well-controlled conditions in isolated sub-catchments. In principle, our approach is applicable in many of the scarcely gauged karstic groundwater basins around the world with a highly diverse landscape and geology.
- Article
(6256 KB) - Companion paper
- BibTeX
- EndNote


Knowledge about distributed recharge is important for the exploration, sustainable management, protection and equitable allocation of water resources. Acquiring recharge information remains complex and challenging for hydrogeological research, especially in the many ungauged basins around the world and particularly in karstified aquifers, which supply about one quarter of the world's population (Ford and Williams, 2007). One key issue of water negotiations in shared groundwater basins is the spatial distribution of water resources in the different zones, such as the recharge zones of an aquifer.
1.1 Global and specific problems in distributed recharge assessment
A general problem in recharge studies worldwide is that most basins remain poorly gauged or ungauged, particularly with respect to basin function, i.e. the description and drivers of hydrological processes that are usually variable, both spatially and temporally. Such a lack of empirical and local knowledge from the field cannot readily be circumvented by evermore sophisticated modelling approaches and mathematical methods. A second general problem is encountered in karstified aquifer formations with their non-Darcian, anisotropic flow fields, where data from the discharge area cannot be readily used to infer process or parameter information for the upstream recharge areas (Hartmann et al., 2012a, b; Dafny, 2009; Dafny et al., 2010).
The study of groundwater recharge and its spatial variability in karst regions ranging from semi-arid to sub-humid can be approached through three research venues: observations of surface water (where available), of the saturated and of the unsaturated zone (Scanlon et al., 2002, 2006). In addition, Dörhöfer and Jesopait (1997) subdivided the field into direct and indirect research approaches or methods (Lerner et al., 1990) – not to be confused with direct and indirect recharge (see also Bredenkamp et al., 1995; Simmers, 1988; De Vries et al., 2002). While direct approaches determine recharge-governing parameters near the surface by observing runoff, interflow and soil moisture, indirect approaches model the basin behaviour balancing integral measurements of the discharge of springs or rivers at the catchment scale with abstraction rates and aquifer storage based on groundwater level measurements. In specific, for the Western Aquifer Basin (WAB; see Sect. 1.3 below), such indirect approaches cannot be employed in the recharge area, where any groundwater access and thus observations in the saturated zone, like drilling monitoring boreholes, are prevented due to the political circumstances of a long-standing water conflict and occupation. In addition, most WAB catchments carry no surface water, except for occasional storm runoff events, particularly in the recharge zone, such as Wadi Natuf (Messerschmid et al., 2018). The research is left only with direct approaches to determine deep percolation from the soil into the bedrock, which is equated with recharge in this study (see also Schmidt et al., 2014).
1.2 Dealing with spatial variability
Hartmann et al. (2013) emphasised the need to focus on process-based approaches; this is especially true for hydrological predictions in ungauged basins (PUB). In the absence of field data describing the dominant hydrological processes and functioning of a basin, it was often recommended to make use of the more readily accessible and measurably physical basin form (Savenije, 2010) and then to differentiate landscape units according to a hydrologically meaningful landscape classification metric to translate form into function (subject of the follow-up paper by Messerschmid et al., 2020). For the link between physical features and basin response, Eder et al. (2003) and Hartmann et al. (2013) suggested the use of so-called hydrological system signatures to describe emergent properties of a system – both quantitatively or qualitatively – such as flow duration curves or spring hydrographs.
Most of the PUB literature, such as Sivakumar et al. (2013) and Hrachowitz et al. (2013), stressed the need for parsimony in hydrological modelling, especially under the presence of equifinality in calibrated parameters. For more information, see also Grayson and Blöschl (2000); Woods (2002); Sivapalan et al. (2003a); McDonnell and Woods (2004); Sivakumar (2004, 2008); Wagener et al. (2007); Young and Ratto (2009) and Olden et al. (2012). Such parsimonious models stick to the description of simple local processes and the identification of a few realistic and observable physical parameters and hydrological drivers governing these process (Franchini and Pacciani, 1991; Zomlot et al., 2015). Sivapalan et al. (2003b) pointed out that despite the heterogeneity of local parameters and processes, the response at the catchment scale is often characterised by surprising process simplicity. Hence a small number of field observations may describe the main characteristics of a process (Seibert and Beven, 2009), even in ungauged basins and with short time series data only (Juston et al., 2009; Seibert and Beven, 2009; Blume et al., 2008; Nash, 1957; Dooge, 1959; Lambert, 1969).
So far, most studies have focused on runoff rather than on recharge (Sivapalan et al., 2003b; Batelaan and de Smedt, 2001, 2007), but there have been some notable exceptions: for example, Aish et al. (2010) determined recharge distribution in the Gaza Strip; however, here, local data on groundwater depth were available for the recharge zone. The bulk of recharge models worldwide have been using lumped or only partially distributed approaches because they do not require detailed spatial information, but they rather transfer input into output by a set of equations on a basin-wide scale (Jeannin and Sauter, 1998; Hartmann et al., 2013; Abusaada, 2011). This also applies to the Western Aquifer Basin.
1.3 Existing recharge studies in the Western Aquifer Basin (WAB)
The Western Aquifer Basin (Aujah-Tamaseeh in Arabic and Yarkon-Tanninim in Hebrew) is the largest, freshest and most productive groundwater basin in all of Historical Palestine, spanning from the sub-humid Mt Carmel in the north into the Sinai in the south and from the West Bank mountains to the Mediterranean Sea with an area of 14 148 km2 (SUSMAQ, 2003; ESCWA-BGR, 2013; see Fig. 1). The WAB is a classical transboundary water basin, subject to negotiations over equitable allocations under international water law (UN-GA, 1997). The intensive use of the basin dates back to the early 1960s starting with deep well drilling in the coastal plain and in the adjacent foothills area. The basin rapidly became one of the single largest sources of Israeli water and also has the potential to become one of the largest future sources of Palestinian water in the West Bank. On the other hand, the WAB's recharge and accumulation areas, which are located in the mountains, slopes and foothills of the West Bank, remain relatively untouched, ungauged and unexplored, due in large part to the continued restrictions imposed on Palestinian water sector and infrastructure development (World Bank, 2009). Within this recharge zone lies Wadi Natuf, a 103 km2 large surface watershed stretching from the crest of the West Bank mountains, which is north of Ramallah, down to the Green Line (that separates Israel from the Palestinian West Bank under Israeli military occupation; see Sect. 2).
Also in the Western Aquifer Basin, the preferred choice of most of the existing studies were fully lumped models. This was done primarily to avoid problems with spatial differentiation and over-parameterisation (Goldschmidt and Jacobs, 1958; Guttman et al., 1988; Guttman and Zukerman, 1995; Guttman, 2000; Berger, 1999; Abusaada, 2011; and Abusaada and Sauter, 2017). Some researchers created partially distributed models. Sheffer (2009) and Sheffer et al. (2010) for example applied a distributed basin-wide recharge model to the WAB, which however only distinguished coarsely between two units: permeable carbonatic formations and less permeable, chalky or marly rock outcrop. In addition, crucial model parameters, such as soil characteristics, were taken from the literature (Dingman, 1994), not gained from in situ findings in the field (see also Dvory et al., 2016; Weiss and Gvirtzman, 2007; Schmidt et al., 2014). Truly spatially distributed and field-based approaches so far are restricted to studies on the local scale of less than 1 km2 (Frumkin et al., 1994; Lange et al., 2003, 2010; Arbel et al., 2010; Steinmann, 2010; Grodek et al., 2011). However these studies mainly focussed on runoff rather than recharge. Sprinkler tests on a plot scale (10 m×18 m) by Lange et al. (2003) pointed to the importance of soil saturation excess for surface runoff and recharge. Similar observations were published by Ries et al. (2015, 2017) in the neighbouring Eastern Aquifer Basin (EAB) that drains towards the Jordan Rift Valley and the Dead Sea.
The so-called “object-oriented” recharge model of the WAB by Hughes and Mansour (2005) and Hughes et al. (2008) separated runoff, spring flow, soil infiltration and deep percolation (recharge) into individually calculated compartments. At first, each compartment had a high spatial resolution but then was lumped into an integrated basin-wide model. Moreover the entire model input was based on a priori estimated parameters, not local field knowledge, which has been found to often result in little consistency (Kapangaziwiri et al., 2012). Such simplified, lumped water budget approaches of course contribute little to the understanding of the spatial variability of distributed recharge, particularly on a local scale, where the hydrostratigraphy is more complex (as explained in Sect. 2). Abusaada (2011) in his three-dimensional integrated flow model of both plains and slopes called for refined data input on land use, soil, geology and structural characteristics in the WAB (see also Martínez-Santos and Andreu, 2010).
1.4 PUB paradox and recommendations
These findings point to the so-called PUB paradox, according to which data-rich catchments are needed to test methods for data-poor environments as Seibert and Beven (2009) noted. Their “hydrologically intelligent choice”, focused on the correct interpretation of the dominant process features and on keeping observations at the necessary minimum, for reasons of practicality (e.g. measurement costs and field accessibility). Such an intelligent design remains a learning process starting with insufficient data and adding data as required by the application (Binley and Beven, 2003; Seibert and Beven, 2009). In order to improve the conceptual realism, Pomeroy (2011) summarised three principle aims: to demonstrate the value of observations, to reduce the reliance on calibration and to enhance the capability to predict based on process understanding. In addition, Beven and Kirkby (1979) suggested a three way compromise between (a) the advantages of model simplicity, (b) the complex spatial variability of basin hydrological response and (c) the economic limitations on field parameter measurements.
To summarise, firstly, only one of the three general venues to estimate recharge (Scanlon et al., 2002) are applicable to Wadi Natuf: the saturated zone is inaccessible for field measurements and observations, and surface water bodies are absent (see Sect. 2). Secondly, the severe lack of primary empirical field data cannot be circumvented by evermore sophisticated advances in modelling. Therefore, thirdly, new surface- and process-based direct methods are called for that are firmly based in field observation and measurements of observable features and that find ways to conceptualise, describe, classify and measure the spatially variable and complex recharge processes while simultaneously adhering to the goal of parsimony and avoiding exhaustive calibration associated with the problems of equifinality.
1.5 Aims, motivation and approach
The objective of this study is to investigate spatially distributed recharge in a largely ungauged karst aquifer catchment in order to develop formation-specific recharge coefficients (RC) in the central WAB for the first time. The understanding of the process and physical model parameters were based on specifically targeted measurements (McDonnell et al., 2007) and firmly grounded on fundamental physical laws and theories, as well as local knowledge of the observable landscape and climate controls of hydrological processes as stressed by Sivapalan (2003) and Hrachowitz et al. (2013). A parsimonious soil and epikarst reservoir or tank model for laterally disconnected one-column elements (Schmidt et al., 2014; Hrachowitz and Clark, 2017) was performed in daily steps and based on observable physical features and empirical field measurements for core parameters of the soil water budget, thus avoiding the need for retrofitting. The model was examined and tested in a novel combination of both quantitative and semi-qualitative basin observations. On the one hand, at the level of basin form (physical soil parameters) the modelled soil moisture content was compared to the field measurements. On the other hand, on the level of basin response, the signatures of measured spring flow events (peak discharge periods) were compared to the modelled periods of deep percolation (DP). Finally, the model results of spatially distributed annual recharge coefficients were compared to literature results from former recharge studies in the WAB.
Wadi Natuf is a 103 km2 catchment stretching from the mountain plateau at the crest of the West Bank at 816 m above sea level (a.s.l.) down to its foothills at 138 m a.s.l. (Fig. 1). In the eastern mountain region, the topography is characterised by rocky mountain crests and high plains with steep terraced slopes towards the central Wadi Natuf further west. Here, in the midstream catchment, undulating hills with deeply incised ephemeral rivers (wadis) dominate, descending further down to the gentle slopes and plains in the lower Natuf region near the outlet of the main wadi bordering the coastal plain. Within the Natuf catchment, all sub-aquifer formations of the WAB and some of the overlying cover series crop out (Fig. 2a, b) and are therefore exposed to direct infiltration. The climate is typically Eastern Mediterranean with precipitation occurring from November to April, monotonously rising from the semi-arid western foothills (500–600 mm a−1) to sub-humid conditions in the eastern mountains (above 600 mm a−1). Wadi Natuf drains westwards towards the Mediterranean Sea and has a remarkably low overall runoff coefficient of approximately 0.11 %, mainly due to high percolation rates into the bedrock under shallow soils and due to considerable transmission losses (Messerschmid et al., 2018) into the karstified carbonate materials underlying the wadis.
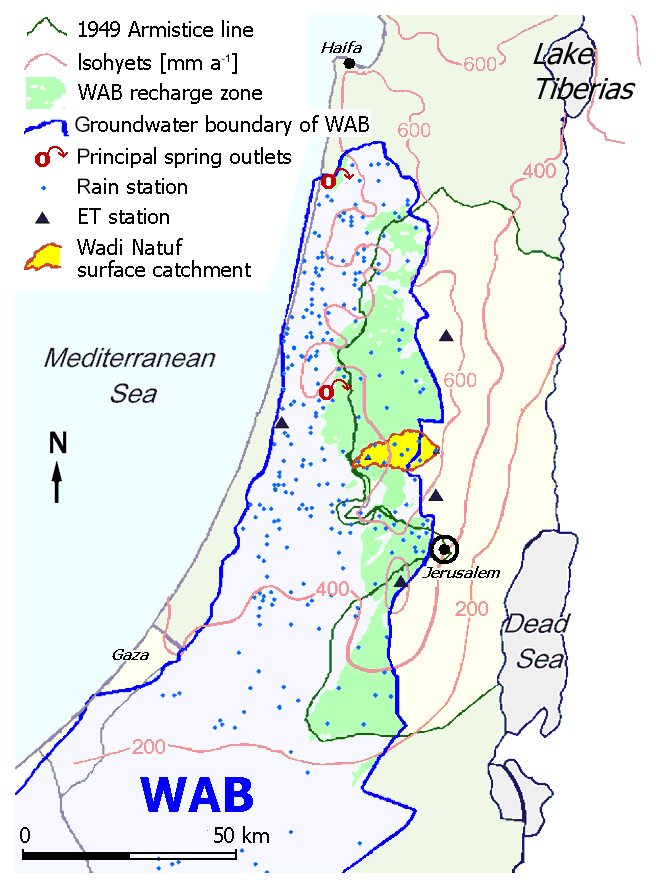
Figure 1Western Aquifer Basin (WAB) overview and Natuf location map. Wadi Natuf (in yellow) lies in the uphill recharge zone (shaded green) of the groundwater of the Western Aquifer Basin, whereas the easternmost part of its surface catchment belongs to the Western Aquifer Basin. Isohyets indicate a climate in Wadi Natuf ranging from semi-arid to sub-humid. The two former principle spring outlets of the WAB have all but dried up, due to excessive pumpage in Israel. Four evapotranspiration (ET) stations around Wadi Natuf were complemented by two automatic weather stations in this study. Sources: modified after Sheffer et al. (2010), SUSMAQ (2001), Abusaada (2011) and ESCWA-BGR (2013).
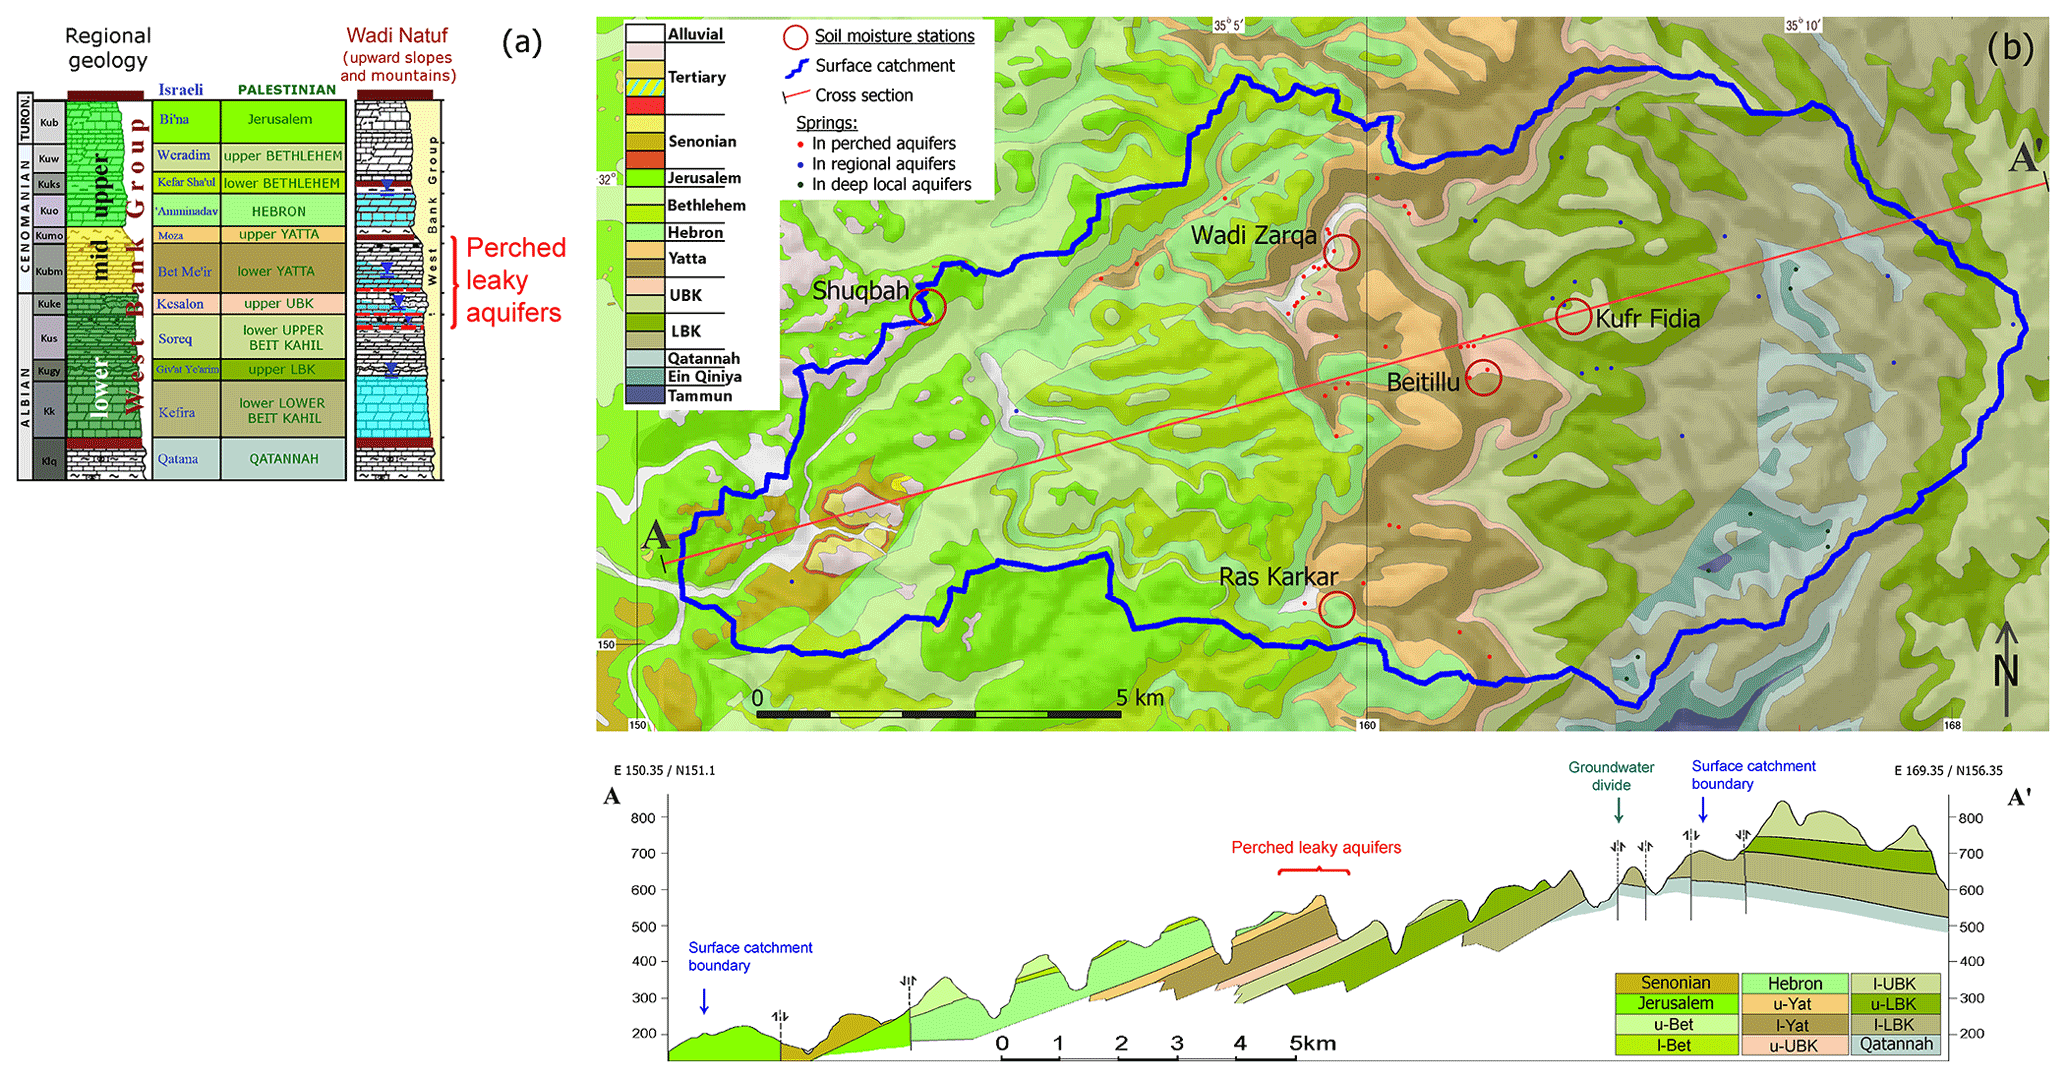
Figure 2Stratigraphic column (a) and geological relief map with cross section (b). (a) The stratigraphic column shows the regional hydrostratigraphy of the lower, middle and upper West Bank group (known in Israel as the Judea group) with only two aquifers (left side), such as the Lower Aquifer (“lower” group) and the Upper Aquifer (“upper” group), separated by the yellow “mid” group (left side). On the local scale, they can be differentiated into several sub-units of aquiferal and aquitardal series with three separate perched aquifers in the middle, e.g. the lower Yatta formation, upper UBK formation and the top of lower UBK formation (abbreviated to l-Yat, u-UBK and top of l-UBK). The middle columns show the Israeli and Palestinian formation names. (b) The geological relief map indicates a selection of the many small local springs, mostly fed by the perched aquifers in central Wadi Natuf (red dots), partly also locally from within the regional aquifers (blue dots) or from the deep local aquifers (green dots). Red circles inside the map indicate the five areas of the eight soil moisture stations. The cross section indicates the surface catchment of Wadi Natuf and, further to the west, the groundwater divide that separates the Western and Eastern Aquifer Basins at a stratigraphically low position where the Lower Aquifer is fully eroded and the deep aquifers crop out. Sources: stratigraphic column, modified after Dafny (2009); geological map, modified after GSI (2000, 2008); cross section: this study.
Conventionally and on a regional scale, the WAB is subdivided into two main regional aquifer units of mostly karstified carbonates. The “Lower Aquifer” is of Lower Albian age (ca. 113–106 million years), and the “Upper Aquifer” is of Upper Cenomanian–Turonian age (ca. 95–89 million years). Together they make up around two thirds (64.4 %) of the outcrops in Wadi Natuf (Fig. 2b). The remaining third of the catchment consists of aquitards from marl and chalk. According to this conventional view, the regional aquifers are divided by some 100 to 150 m thick marly, chalky and carbonatic series of the so-called “Middle Aquitard” (Bartov, 1981; SUSMAQ, 2002; ESCWA-BGR, 2013). However, closer scrutiny reveals that both the regional aquifers can be further subdivided into more permeable and more impermeable sections (Fig. A3a, A3c). Also the regional Middle Aquitard can be subdivided into an aquitard or even aquiclude section of yellow soft marl (upper Yatta formation or u-Yat) and a more carbonatic, partly karstified intermediate perched aquifer horizon (lower Yatta formation or l-Yat; see Fig. 2a) (Messerschmid et al., 2003a, b). Lower Yatta is underlain by another perched aquifer (upper Upper Beit Kahil formation or u-UBK), which consists of a cliff-forming very permeable reefal limestone series (Fig. A3b). The third perched aquifer on a local scale is formed by the top of lower Upper Beit Kahil formation (l-UBK), a more chalky and marly limestone series that is underlain by an impermeable twin marl band (Fig. A3c). The three perched local aquifers can be found in central Wadi Natuf where they give rise to over 100 small local contact springs (Fetter, 1994), as shown in Fig. 2b. Together, their outcrops account for about 13 % of the catchment area. On a regional scale, the two perched aquifer series within Upper Beit Kahil formations are considered part of the Lower Aquifer. By contrast to the perched aquifers, most other parts of the regional Lower Aquifer as well as the entire Upper Aquifer within Wadi Natuf are void of springs.
The soil cover in Wadi Natuf consists of terra rossa, mostly with thicknesses in the decimetre range (Fig. A2, Appendix A). Although regional maps (Dan et al., 1975) indicate small portions of rendzina in the central part (near Ras Karkar, Fig. 2b), no such types of soils were found during intensive field reconnaissance and measurement campaigns. The soils were found to have high silt and clay contents. In the dry season, the soils disintegrate into fist-size crumbs and form desiccation cracks. These cracks can act as preferential pathways for infiltration during the early half of the winter season (as also found by Gimbel, 2015). Soil thickness >1 m was only found at small agricultural plains overlying the aquitard series such as the upper Yatta formation (u-Yat; see Fig. A1, Table 1).
An important and recurring observation during the field work was a pattern where soil thickness is associated to certain types of both underlying bedrock lithology of formations and to the type of land use and land cover (LU/LC); carbonates show thin soils, while over argillaceous rock, thicker soil covers develop. Equally, soil cover over grassland and terraces were found thin, whereas agricultural cultivated fields and garden plots were located over thick soil stratum (see Fig. A2 and Table 1). In other words, typical land forms and soil depths can be identified for the different geological formations in Wadi Natuf, such as the perched aquifers (l-Yat, u-UBK and top l-UBK) and the Hebron (Heb) and Jerusalem formations (Jerus) of the Upper Cenomanian–Turonian main regional aquifer (see also Appendix D). This association of soil depths with other land features will be subject to a follow-up paper on regionalisation, Messerschmid et al. (2020).
A prevailing feature in Wadi Natuf, as in most of the Mountain Aquifer (Schmidt et al., 2014), was the finding of a thick unsaturated zone in the karstified aquifers up to hundreds of metres thick underlying thin soil cover; hence, all percolation from the soil into the underlying bedrock was considered as deep percolation.
This study presents a distributed groundwater recharge model for a karst catchment based on extensive hydrological field measurements of three types, namely climatic drivers (like precipitation, radiation and temperature), hydrological processes (such as soil moisture saturation and spring flow) and physical features (soil characteristics, geology and land use/land cover), as shown in Fig. 3. The forward-calculating model is parsimonious, i.e. based only on daily precipitation and evapotranspiration (ET; as well as temporally stable location-specific soil parameters) in order to translate soil moisture saturation into deep percolation, which here is equated with recharge (Schmidt et al., 2014). The one-dimensional soil water balance model was designed as a soil tank with an upper boundary towards the atmosphere and a lower boundary towards the underlying karstified bedrock.
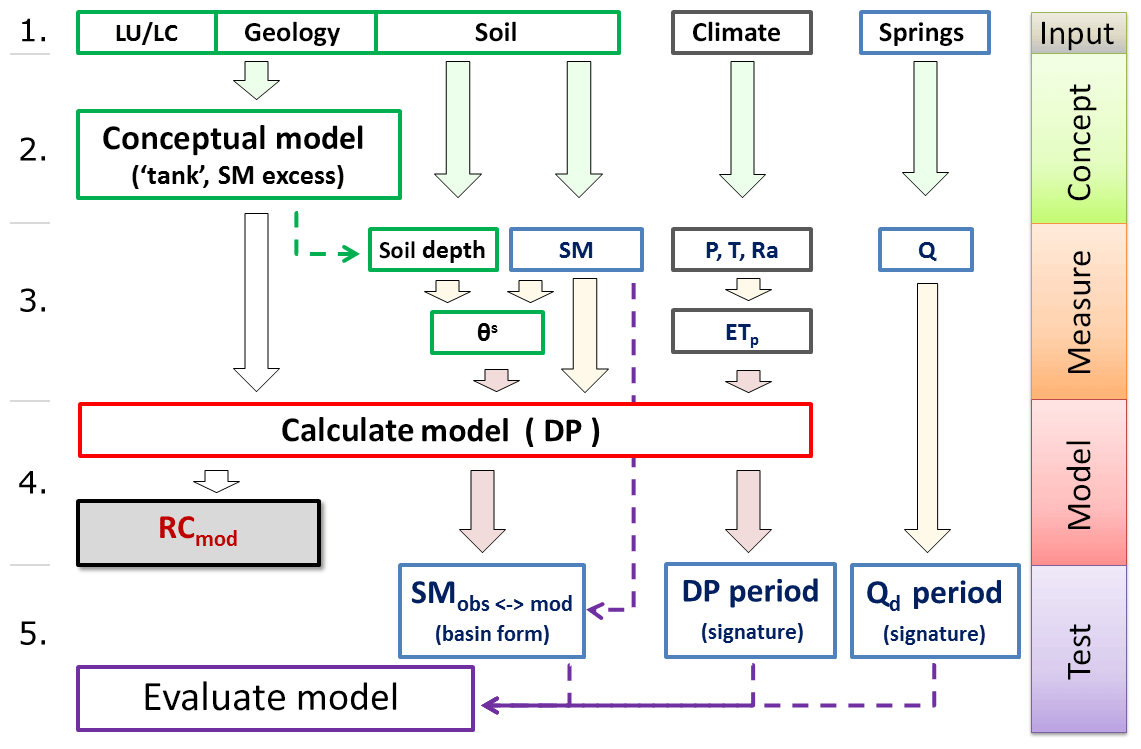
Figure 3Conceptual flow chart of the work steps for the model. First row: measured and observed input such as climate, spring flow, land use and land cover (LU/LC), etc. Second row: conceptualisation of the one-reservoir tank model. Third row: actual measurements of daily values for soil moisture (SM), precipitation (P), temperature (T), solar radiation (Ra), spring flow (Q), etc.. Fourth row: modelling of deep percolation (DP) and transformation into annual recharge coefficients for each of the modelled formations (RCmod). Last row: model evaluation by different tests such as quantitative comparison between observed and modelled soil moisture contents (SMobs and SMmod) and semi-qualitative comparison between periods of percolation events and peak discharge at the daily measured springs.
3.1 Climatic drivers: rainfall and evapotranspiration
The measurement period for precipitation and evaporation spanned over nine seasons, from 2003–2004 until 2011–2012. A complete set of weighted area rainfall data for the five sub-catchments (Fig. 4) was obtained from Messerschmid et al. (2018), originally measured in 5 min steps at 10 stations distributed evenly in upper, central and lower Wadi Natuf. The automated rain gauges (tipping buckets) with Eijkelkamp loggers were run in event mode. The model in this study used the weighted area rainfall precipitation at the five sub-catchments in daily steps (see Table 2 and Fig. 4).
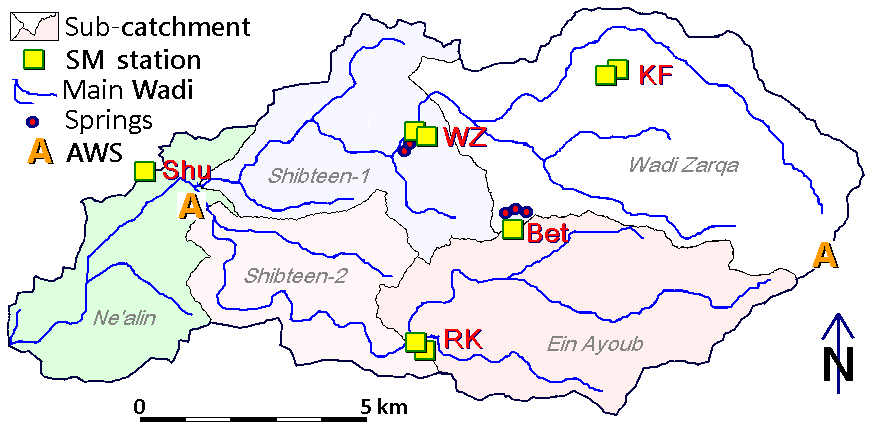
Figure 4Drainage and measurement stations. Main branches of the northern and southern branches of Wadi Natuf. Soil moisture (SM) stations at Shuqbah (Shu), Wadi Zarqa (WZ), Beitillu (Bet), Kufr Fidiah (KF) and Ras Karkar (RK). Daily measured springs at Beitillu and Wadi Zarqa. Automatic weather stations (AWSs) at Shibteen (west) and Birzeit (east). Sub-catchments (in grey) at Ne'alin (west), Shibteen-1 (midstream; north), Shibteen-2 (midstream; south), Ein Ayoub (southeast) and Wadi Zarqa (northeast).
Daily minimum and maximum temperature and solar radiation data were collected at two automatic weather stations (AWSs) for the calculation of potential evaporation (Fig. 4). The readings were taken with two automatic weather stations from Campbell Scientific with a CR10X data logger and an HMP45D (Y3520067) sensor. One station was installed upstream at Birzeit University at the mountain crest; the downstream station at Shibteen well no. 4 was located at the transition between the foothills and coastal plain to the west. Missing records were filled up with corrected temperature data from Jerusalem (IMS, 2017), which represented intermediate values between the relatively cool conditions in Birzeit and the relatively warm conditions downstream in Shibteen.
Potential evapotranspiration (ETp) was calculated by the formula of Hargreaves and Samani (1985). The Hargreaves approach was developed and applied for similar semi-arid conditions (e.g. Ryu et al., 2008) and in comparable areas, such as the adjacent EAB (Schmidt et al., 2014). ETp is calculated by Eq. (1).
where Ra is the daily sum of extra-terrestrial solar radiation (MJ d−1), Tmean is the daily mean air temperature (calculated as average of daily minimum and maximum temperature in ∘C), Tmax−Tmin is the daily temperature range, and λ is the latent heat of vaporisation in order to obtain ETp in mm d−1.
3.2 Hydrological measurements: soil moisture and springs
Soil moisture (SM) content was monitored at eight different stations over a period of 7 years (see Table 1). Due to budget limitations and reduced field accessibility (particularly during the height of the Second Intifada), the measurements were kept at a minimum (as recommended by Beven, 2002, and by Seibert and Beven, 2009; see Sect. 1.2, 1.4). It was therefore decided to increase the number of different SM locations and to decrease the duration of measurements at each station (ranging between 1 and 4 years, see Table 1). All in all, 13 years of soil moisture measurements were carried out at the eight locations. The locations were chosen at places with minimum slope and without lateral water input from upslope overland runoff.
The target of the soil moisture measurements was daily time series data of the overall available water content (θ). SM was measured at different depths by each sensor and then normalised to total water content of the respective soil column. Initially two sets of frequency domain reflectometry soil moisture sensors (ML2-Theta probes, Delta-T Devices Ltd.) were used. Due to malfunction and vandalism they were replaced by two ECH2O loggers (EM50, Decagon Devices Inc.), each connected to two or three sensors (5TM, Decagon Devices, Inc.) that measured volumetric water content (as a percentage) based on the difference of dielectric permittivity between water and soil matrix. The loggers recorded in 30 min intervals. The readings were averaged into daily values for the purpose of the model. The sensor installation depth varied between a minimum of 5 cm and a maximum of 75 cm at the thickest soils (Table 1). Technical problems with the equipment are discussed in Appendix B (Tables B1–B3).
In order to better relate the spatially discrete SM stations to the overall catchment area, soil samples (150–550 g) were collected randomly at different depths and different times; the absolute water content of the samples was determined by oven weighing at the Birzeit laboratory. These results also served to reconfirm and calibrate the sensor readings.
Each of the sensor readings of volumetric water content (as a percentage) from different soil depths was multiplied with the thickness of the individual soil sections (in metres) and then combined to an overall water content of the soil column (as millimetres of the water column within the soil). The continuous soil moisture hydrographs were then analysed separately for each location, resulting in a typical and annually returning minimum (SMmin) and maximum water content (SMmax) as temporally stable but spatially distributed parameters. The representativeness of each SM station was further confirmed by the many hand-collected SM samples from the same formations but at other locations. The maximum soil water storage capacity or storage capacity at saturation (θs) was then calculated for each SM station and according to Eq. (2).
whereby SMmax and SMmin were used as the measured water content per soil segment volume (m3 m−3), SMmax, 1 indicates the maximum water content at the first near-surface soil section and deeper sections are indicated by successive numbers (2 and 3), and b indicates the soil thickness (in metres) of the respective soil sections (1, 2 and 3) or the overall soil thickness (bΣ). θs represents the normalised effective maximum storage content in metres (or millimetres) of the whole soil column (see Sheffer, 2009; Sheffer et al., 2010). It should be noted that θs was derived directly from the field-measured values of SMmax and SMmin, the range of which indicates the maximum amounts of soil water available for evapotranspiration before percolation sets in (see also Sects. 3.4 and 5.1 and Fig. 5).
The sensor readings included brief periods of water storage beyond field capacity, such as water in desiccation cracks (especially in heavy storm events during late autumn and early winter); these peak levels can be noticed as brief spikes of SM readings (here indicated as SMpeak) above the otherwise stable levels of annually recurring SMmax. It should however be emphasised here that the model in its daily budgets fully accounts for these additional water amounts (see Sect. 4.1 and Appendix B).
Daily spring flow measurements were used as a model check. This high-resolution spring flow record, the first for the WAB mountains, enabled the detection of signatures, i.e. the temporal patterns of low and peak discharge for comparison with simulated recharge by the soil moisture saturation and percolation (SMSP) model. From the large number of over 100 springs discharging from the perched aquifers, five springs from two spring groups (Fig. 4) were selected that can be considered representative for the total spring group discharge, due to their position and proximity to the soil moisture stations. At these springs, daily flow measurements were carried out continuously by metering (by hand) throughout almost the entire period (spring data coverage; see Appendix C, Table C1). Three of these springs belong to the so-called “Beitillu spring group”; the two other springs belong to the “Wadi Zarqa spring group” (near the Wadi Zarqa SM station, see Figs. 2b, 4). Their representativeness is discussed in Appendix F.
3.3 Model parameterisation (soil thickness)
The soils in Wadi Natuf were found to consist only of one prevailing soil type, terra rossa (see Sect. 2); field investigations, sampling and granulometric lab tests showed that the soil was mostly silty clayey, with some samples also showing higher clay contents (Messerschmid et al., 2018). This allowed for an important simplification for the soil moisture saturation and percolation model to only account for one uniform soil type throughout the study area. By contrast, soil thickness (b) plays an important role as a quantifiable parameter in the SMSP model. Therefore it was necessary to determine the typical soil thicknesses at the different geological formations and LU/LC types and to ensure that the selected soil moisture measurement plots were representative for the typical conditions of a given formation. The spatial distribution of soil thickness was established by digging up the soil down to the soil–rock interface. The soil thickness differed between sampling locations, which led to variable sampling depths down to the respective horizon, where in situ lithology prevailed. The results of the soil depth survey are shown in a soil thickness matrix for different LU/LC types and lithostratigraphic units (see also Appendix D and Table D1).
3.4 Parsimonious soil moisture saturation and percolation modelling: design and processes
The SMSP model implies a classical soil moisture balance approach; soils dry up to minimum water content during summer and then accumulate and store water with successive rainfall during autumn and winter. SM content above SMmin is subject to direct evaporation and plant transpiration and has to be deducted in daily steps from the SM content accumulated successively by precipitation. When soil conditions reach saturation (full effective storage capacity; θs), deep percolation into the bedrock is triggered, here equated with groundwater recharge (Fig. 5). ETa is limited downwards by available water content (θi) and upwards by ETp.
where θi is available soil moisture (in millimetres), P is daily rainfall (in millimetres), ETa is the daily actual evapotranspiration (in millimetres) and ETp is the daily potential evapotranspiration (in millimetres).
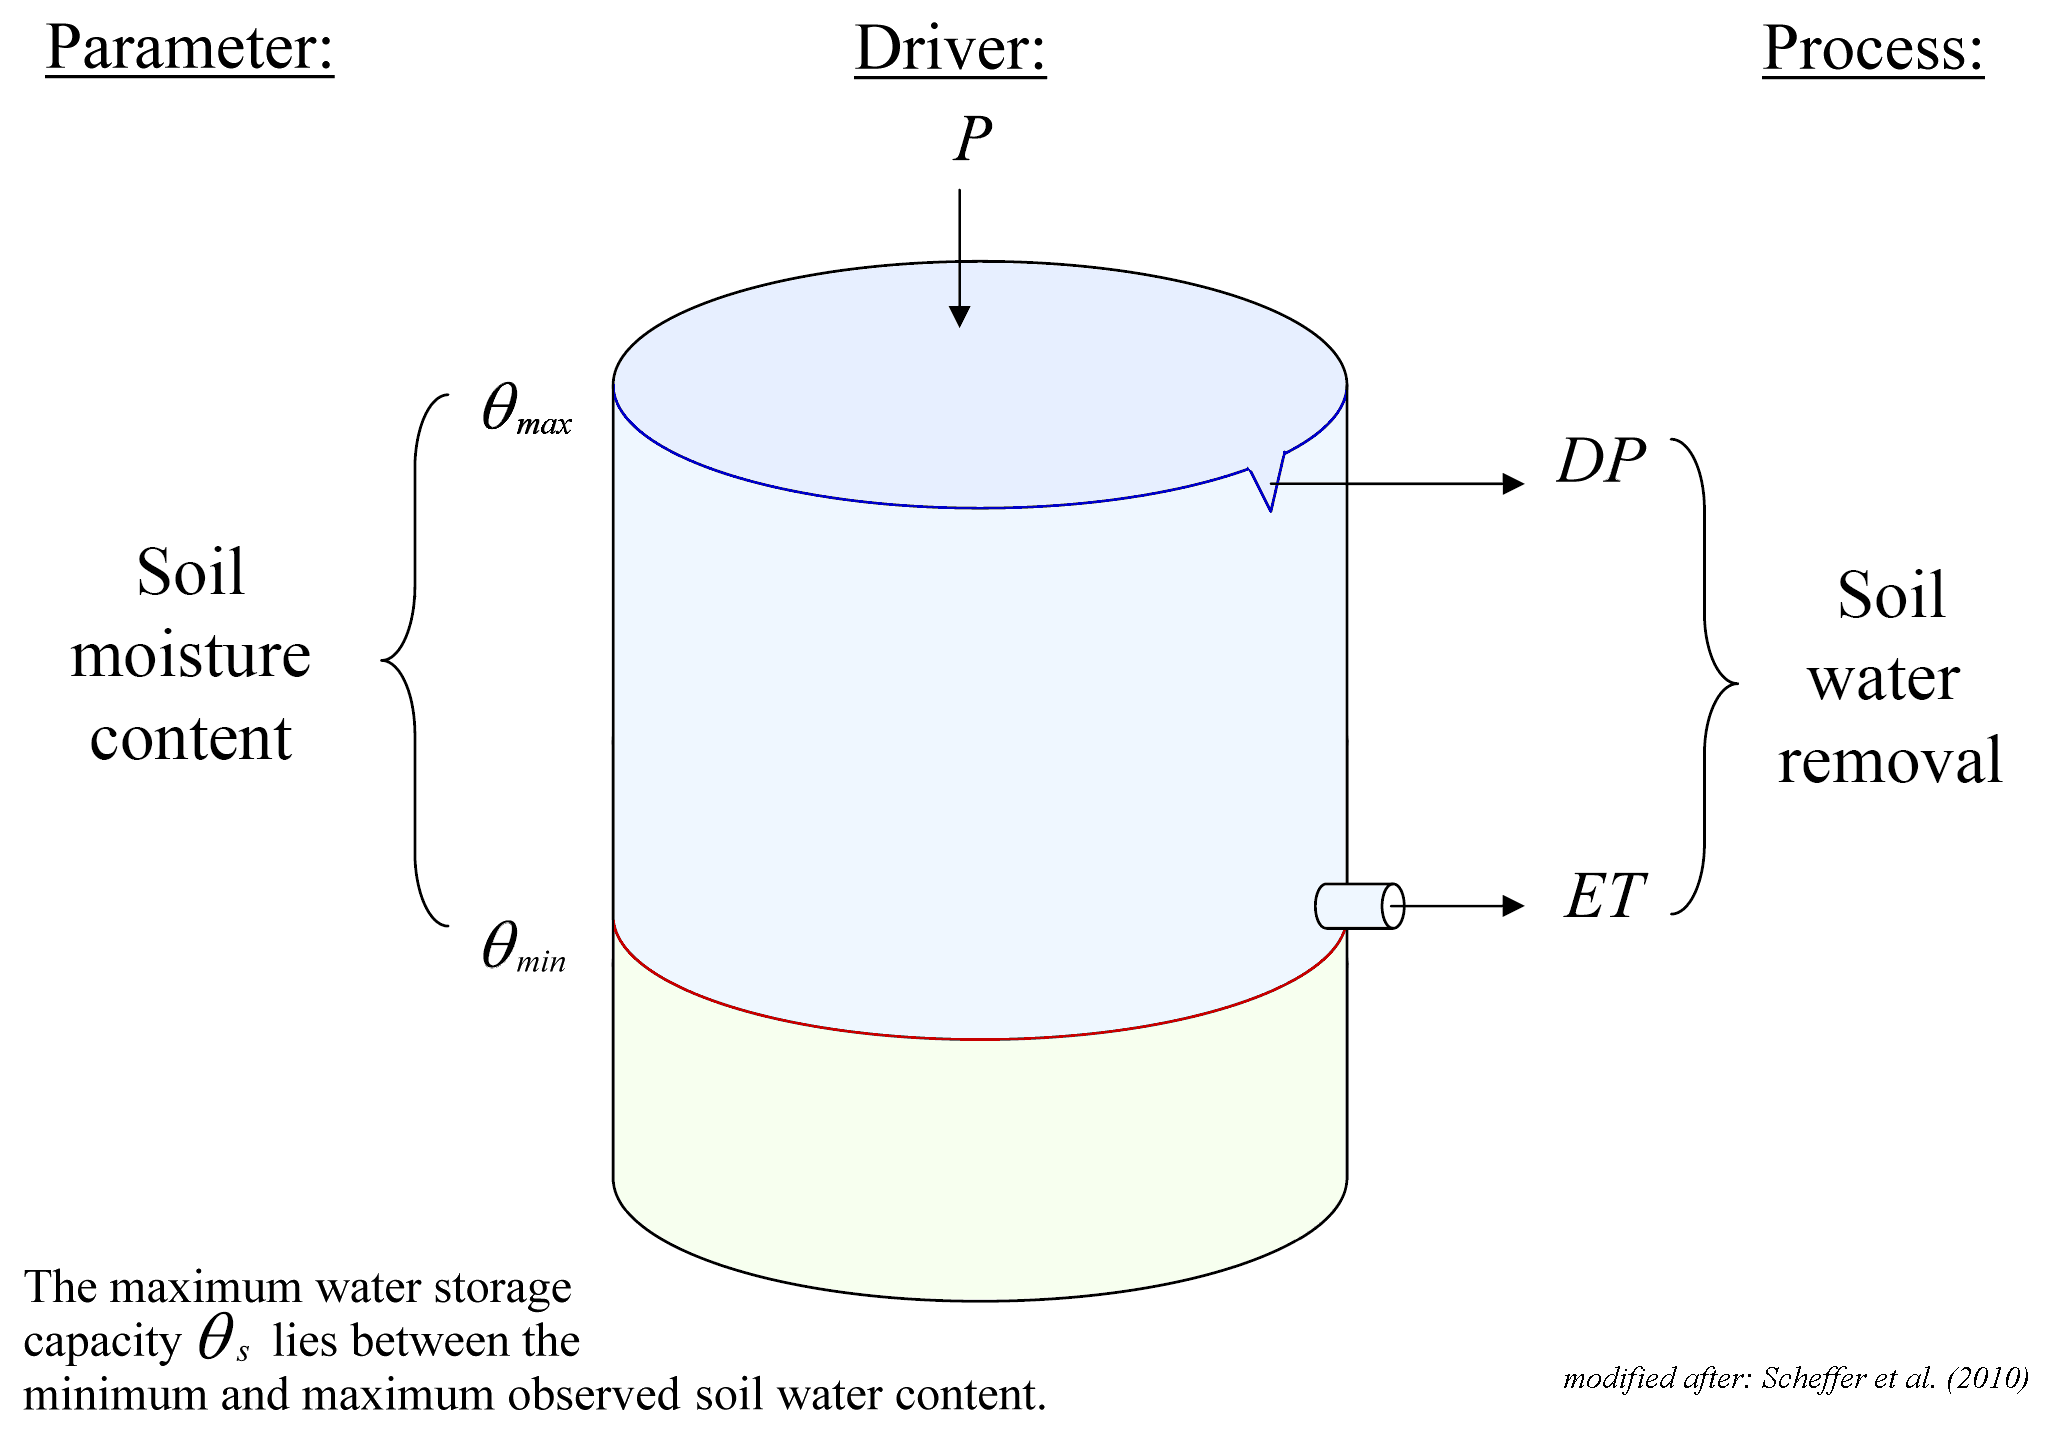
Figure 5Parsimonious SMSP model of “one-reservoir saturation excess” (modified after Sheffer et al., 2010). Parameters and drivers (top) were field measured for every station and model. The available water content, shown as θ (between SMmax and SMmin), is seasonally variable but location specific. Discounting runoff, soil water removal is accounted for in two ways: as SM saturation (red line) increases (above SMmin), evapotranspiration (ET) is triggered first; when θs reaches SMmax, deep percolation (DP) is initiated. Precipitation (P) was measured; potential evapotranspiration was calculated from weather station data and transformed into actual ET values (Sect. 3.2).
All additional rainfall infiltrating from the surface and beyond the daily evapotranspiration losses can either be added to the available water storage or, when limits of θs are exceeded, considered to percolate into the bedrock and represent recharge.
where θmax is the effective maximum soil water storage and DP is daily deep percolation, i.e. groundwater recharges (in millimetres). The testing of the model was reached in two independent ways, by a quantitative comparison of modelled and observed SM values and by a semi-qualitative comparison of recharge periods (DP events) with times of observed spring discharge peaks. In other words, one examination was done on the reliability of the model to produce the observed physical feature of SM, and the other was done by using the hydrologic response signature of spring flow responding to recharge.
3.5 Annual and mean recharge coefficients
First, the annual DP rates (mm a−1) are divided by annual station rainfall delivered annual recharge coefficients (as a percentage) for each modelled SM station. Secondly, DP rates from the model for the different stations representing different formations (Table 1) were referred to the outcrop sizes of the respective formations in Wadi Natuf to obtain annual recharge amounts (R; in m3 a−1). Then, thirdly, at each station (or for each formation) the seven different annual RC values were transformed into an average recharge coefficient (RCavg). This simplified approach assumes that our 7-year rain observation period fairly represented the long-term averages and inter-annual distribution patterns of precipitation (see Sect. 3.1 and Appendix E). In order to verify the representativeness of our 7-year observation period for long-term conditions (>30 years) and since no long-term precipitation record for Wadi Natuf was available, the temporal precipitation patterns were compared on the level of the entire WAB and based on long-term records from HSI (2016). The comparison and its results are documented in Appendix E (Table E1 and Fig. E1).
4.1 Seasonal soil moisture patterns
Table 1 presents the eight locations of soil measurements, used for the percolation models, with their respective bedrock formations and soil depths as well as the recurring maximum and minimum soil moisture levels, from which the maximum water storage capacity (θs) of each location was derived.
Table 1Soil moisture measurement data by location (in mm and %).

θpeak is a brief, episodically occurring available water storage above saturation storage capacity (θs). The soil moisture (SM) values SMmax and SMmax represent the highest and lowest recurring soil water contents measured in the field at different sensor depths (summed up in millimetres over the entire soil column or averaged as a percentage of the volumetric share of the total soil volume).
The thin soils in Wadi Natuf showed a low water retention capacity (Sect. 4.2, Fig. 6); in summer, soil usually dried up rapidly to an SM content between 5 % and 10 %. Table 1 also shows two exceptions: in one case, the plot near the greenhouses in Wadi Zarqa (WZ-gh), some summer irrigation of crops cannot be excluded. However, it was assured that no irrigation took place during the crucial winter modelling period. In the second case, the extremely low moisture content (SMmin of 0.5 %) at Kufr Fidiah (KF-E), was a result of vandalism (a dug-up measurement pit with artificially reduced soil moisture at the then-exposed deeper sections of the soil cover). In any case, such low soil moisture is not representative and the data of this station had to be taken with caution. In addition, the soil depth of almost 1 m encountered at KF-E, an abandoned agricultural plot, overgrown with bushes, is a rare exception, and according to our soil depth survey it is not representative for usual conditions at the top of l-UBK formation (compare soil depth matrix, Appendix D, Table D1).
In contrast to minimum recorded SM values, maximum moisture levels showed a more consistent pattern, which is important because soil saturation is crucial for the SMSP model. In line with our saturation excess model (Sect. 3.4), it should be noted that once this maximum soil moisture level was reached, it remained stable for days and weeks and did not rise any further. Throughout the measured period and at almost all stations, it was found that maximum soil moisture is spatially highly variable and can be associated with the local soil depth, as apparent from Table 1 and discussed below. Another special case however is the occurrence of brief periods with extreme moisture above saturation storage capacity. They only occurred during extreme storms or during the early winter months, when desiccation cracks enabled preferential flow and rapid infiltration into deeper soil layers (see also Appendix B) and lasted usually less than 1 d.
Spatially, the distribution of seasonal soil saturation can be differentiated as follows: at locations with thinner soil cover, such Ras Karkar (RK), Wadi Zarqa greenhouses and especially in Shuqbah (Shu), full saturation (θs) was usually reached by mid or late November. In the thicker soils, such as in Kufr Fidiah and the Wadi Zarqa upper terrace (WZ-upT), saturation was usually reached later, by mid-December. In most years, full saturation conditions prevailed during January and February, on rare occasions until April. The season 2005–2006 experienced the most intensive rain event of the entire measurement period, occurring very late in winter, between 1 and 5 April 2006 (Messerschmid et al., 2018). Figure 6 gives an example for the time series of observed and modelled soil moisture (station RK-W). As can be seen, recharge (deep percolation) only occurred when full saturation was reached and in the form of relatively distinct events of a few days per year, depending on the high-resolution temporal rain distribution of a given season.
In each year the level of calculated soil moisture was the result of a unique set of different climatic drivers and of location-specific parameters and physical features (and thus a result of different overlapping processes). Yet, it could be observed that the levels of available soil moisture (i.e. the water content above SMmin), usually dropped to zero within 1 or 2 months after the last major rainfall event of a given season (effectively ending evapotranspiration during summer; see Fig. 6).
4.2 Quantitative examination of the model (by physical parameters)
Figure 6, which presents modelled and observed soil moisture contents, indicates the performance of the soil moisture percolation model. It should be stressed here that no calibration of the model was performed.
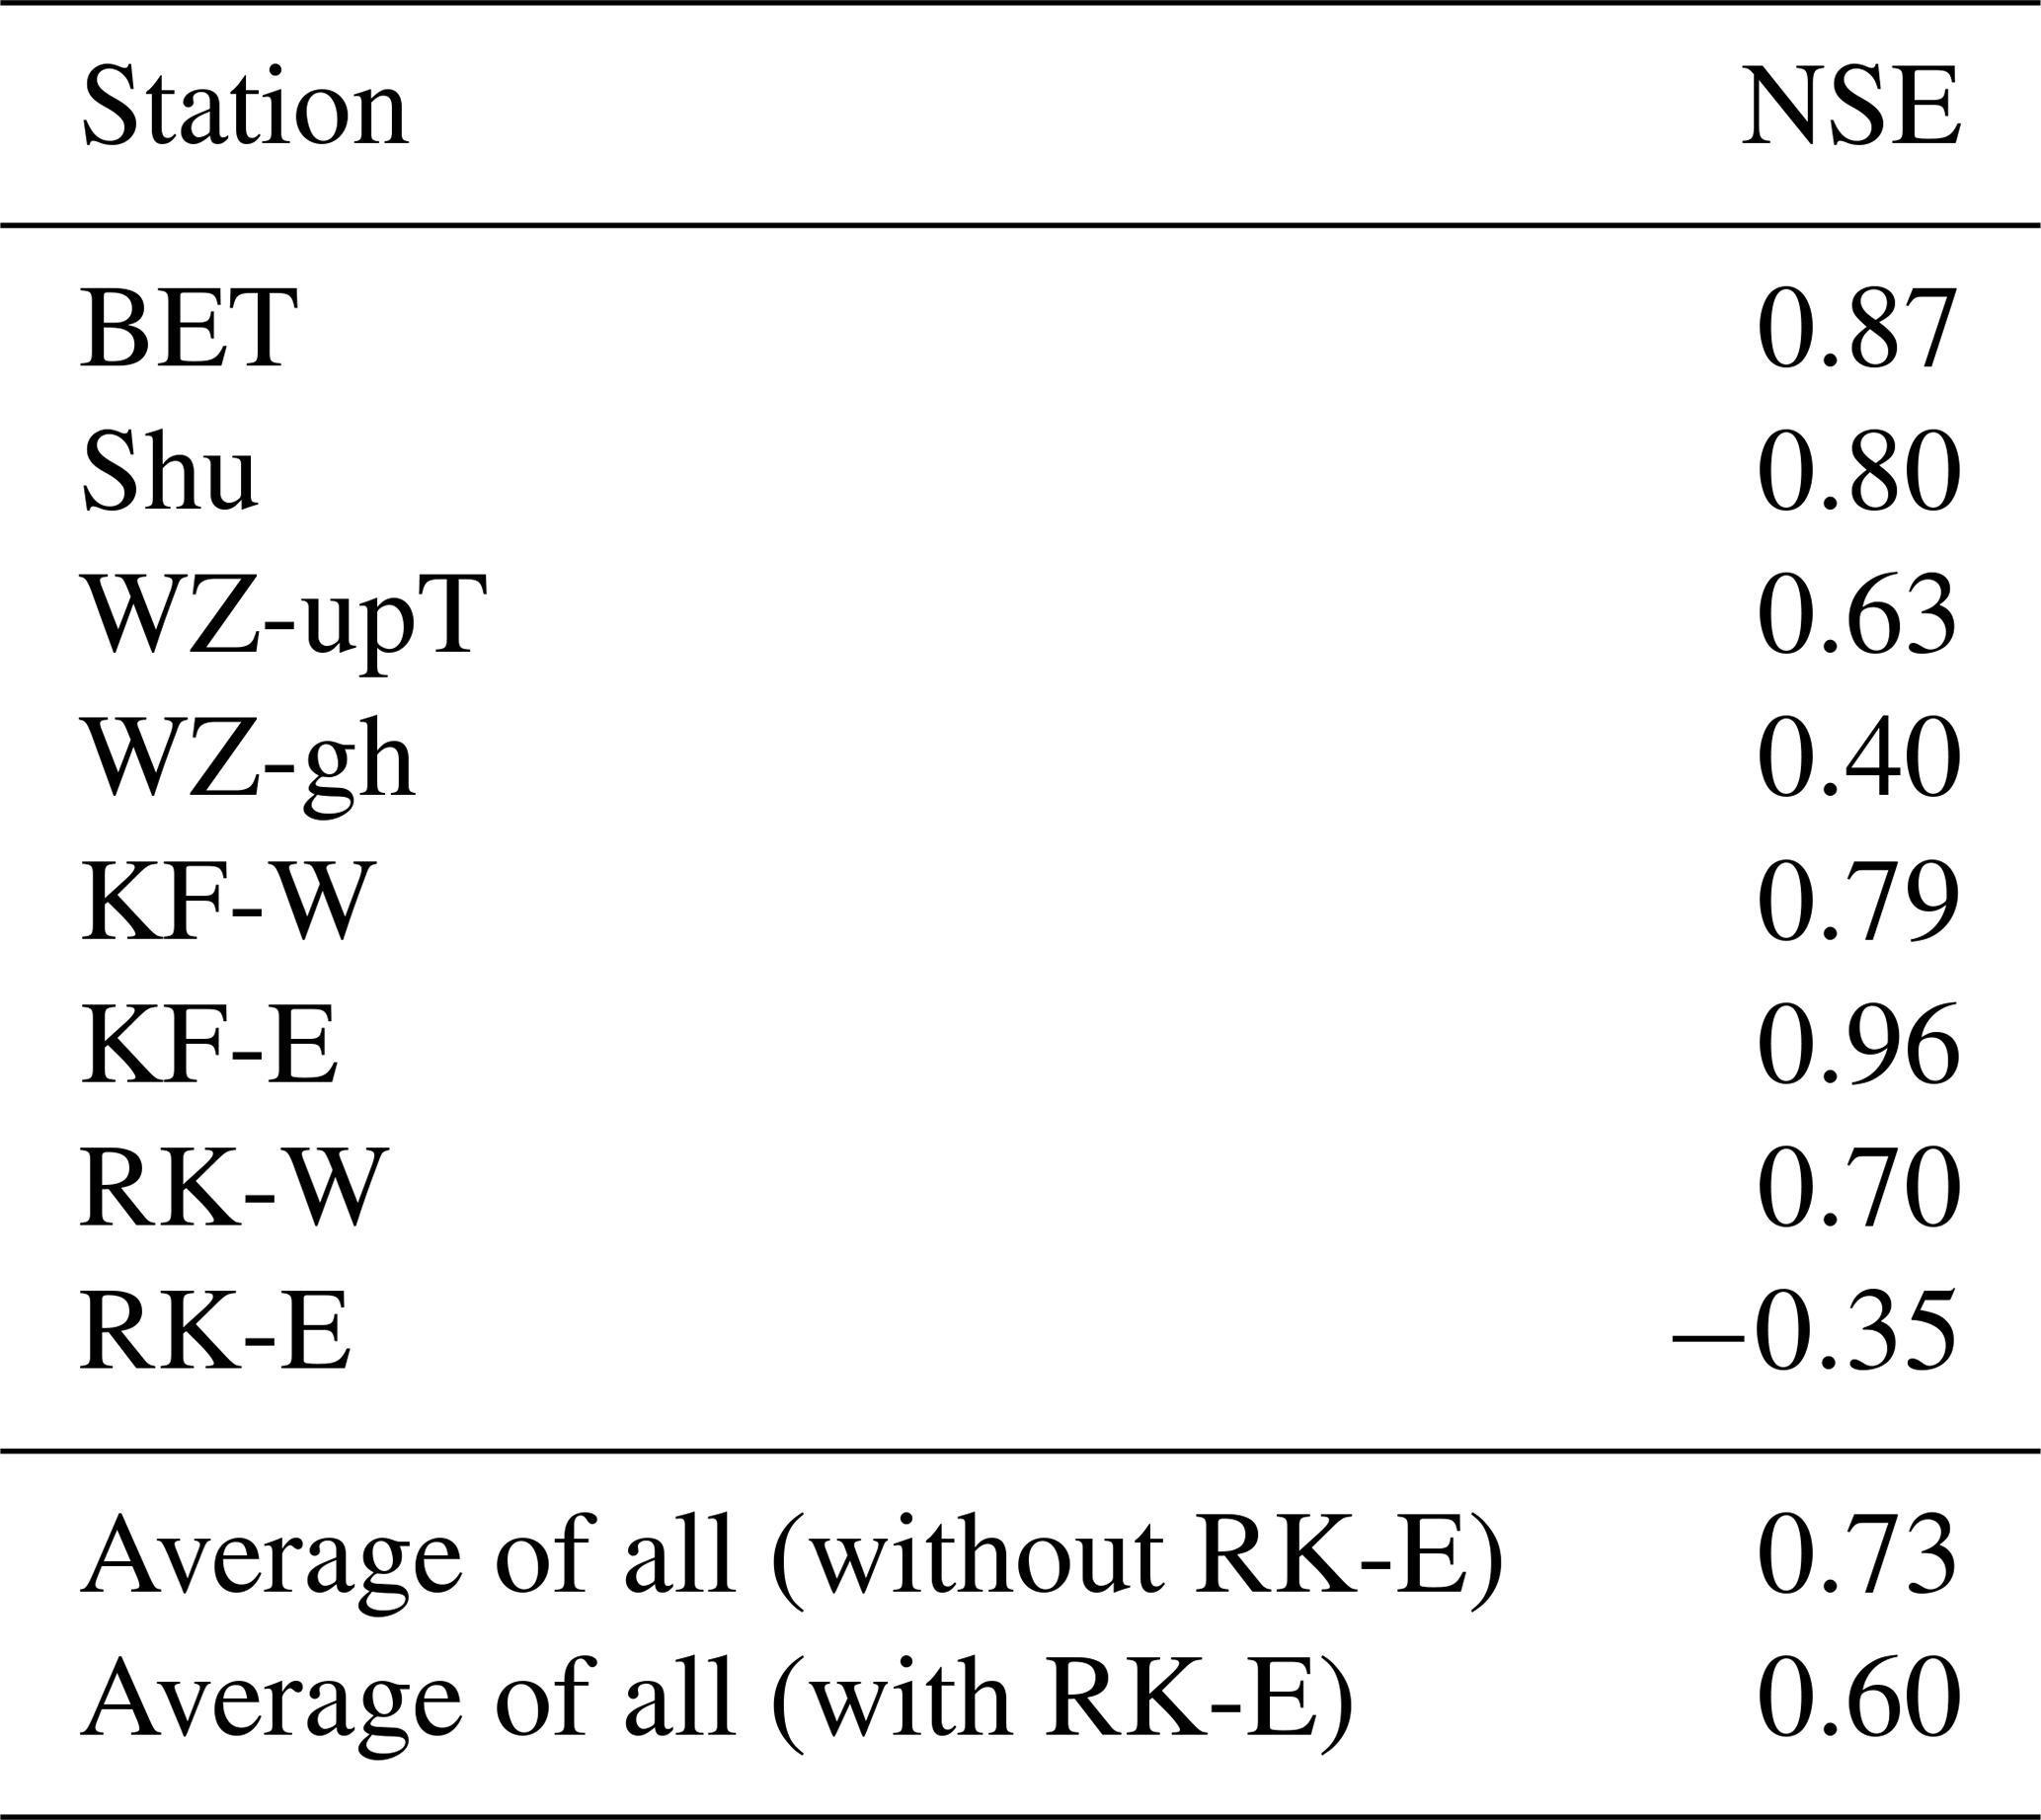
Some of the readings show a mismatch between observed and modelled SM values; these periods are indicated as a dashed green line, where recorded soil moisture exceeded modelled SM values. In some cases, recorded moisture levels even surpassed accumulated seasonal rain (which clearly hinted to equipment failure of the SM sensors). Both issues are further discussed in Sect. 5 and Appendix B. However, a comparison between observed and modelled soil moisture (Fig. 6) showed similar performance, with an average Nash–Sutcliffe efficiency (NSE) coefficient of 0.73 for all stations, except RK-E (which had a negative coefficient of −0.35 and was excluded from further analysis). In Shuqbah and Beitillu, NSE was found between 0.8 and 0.87; in Wadi Zarqa it was 0.63; at KF-W and KF-E it was between 0.79 and 0.96; and at the RK-W station it was at 0.7 (Appendix B, Table B3; note that the stations names ending with “-W” and “-E” are the western and eastern regions of the area).
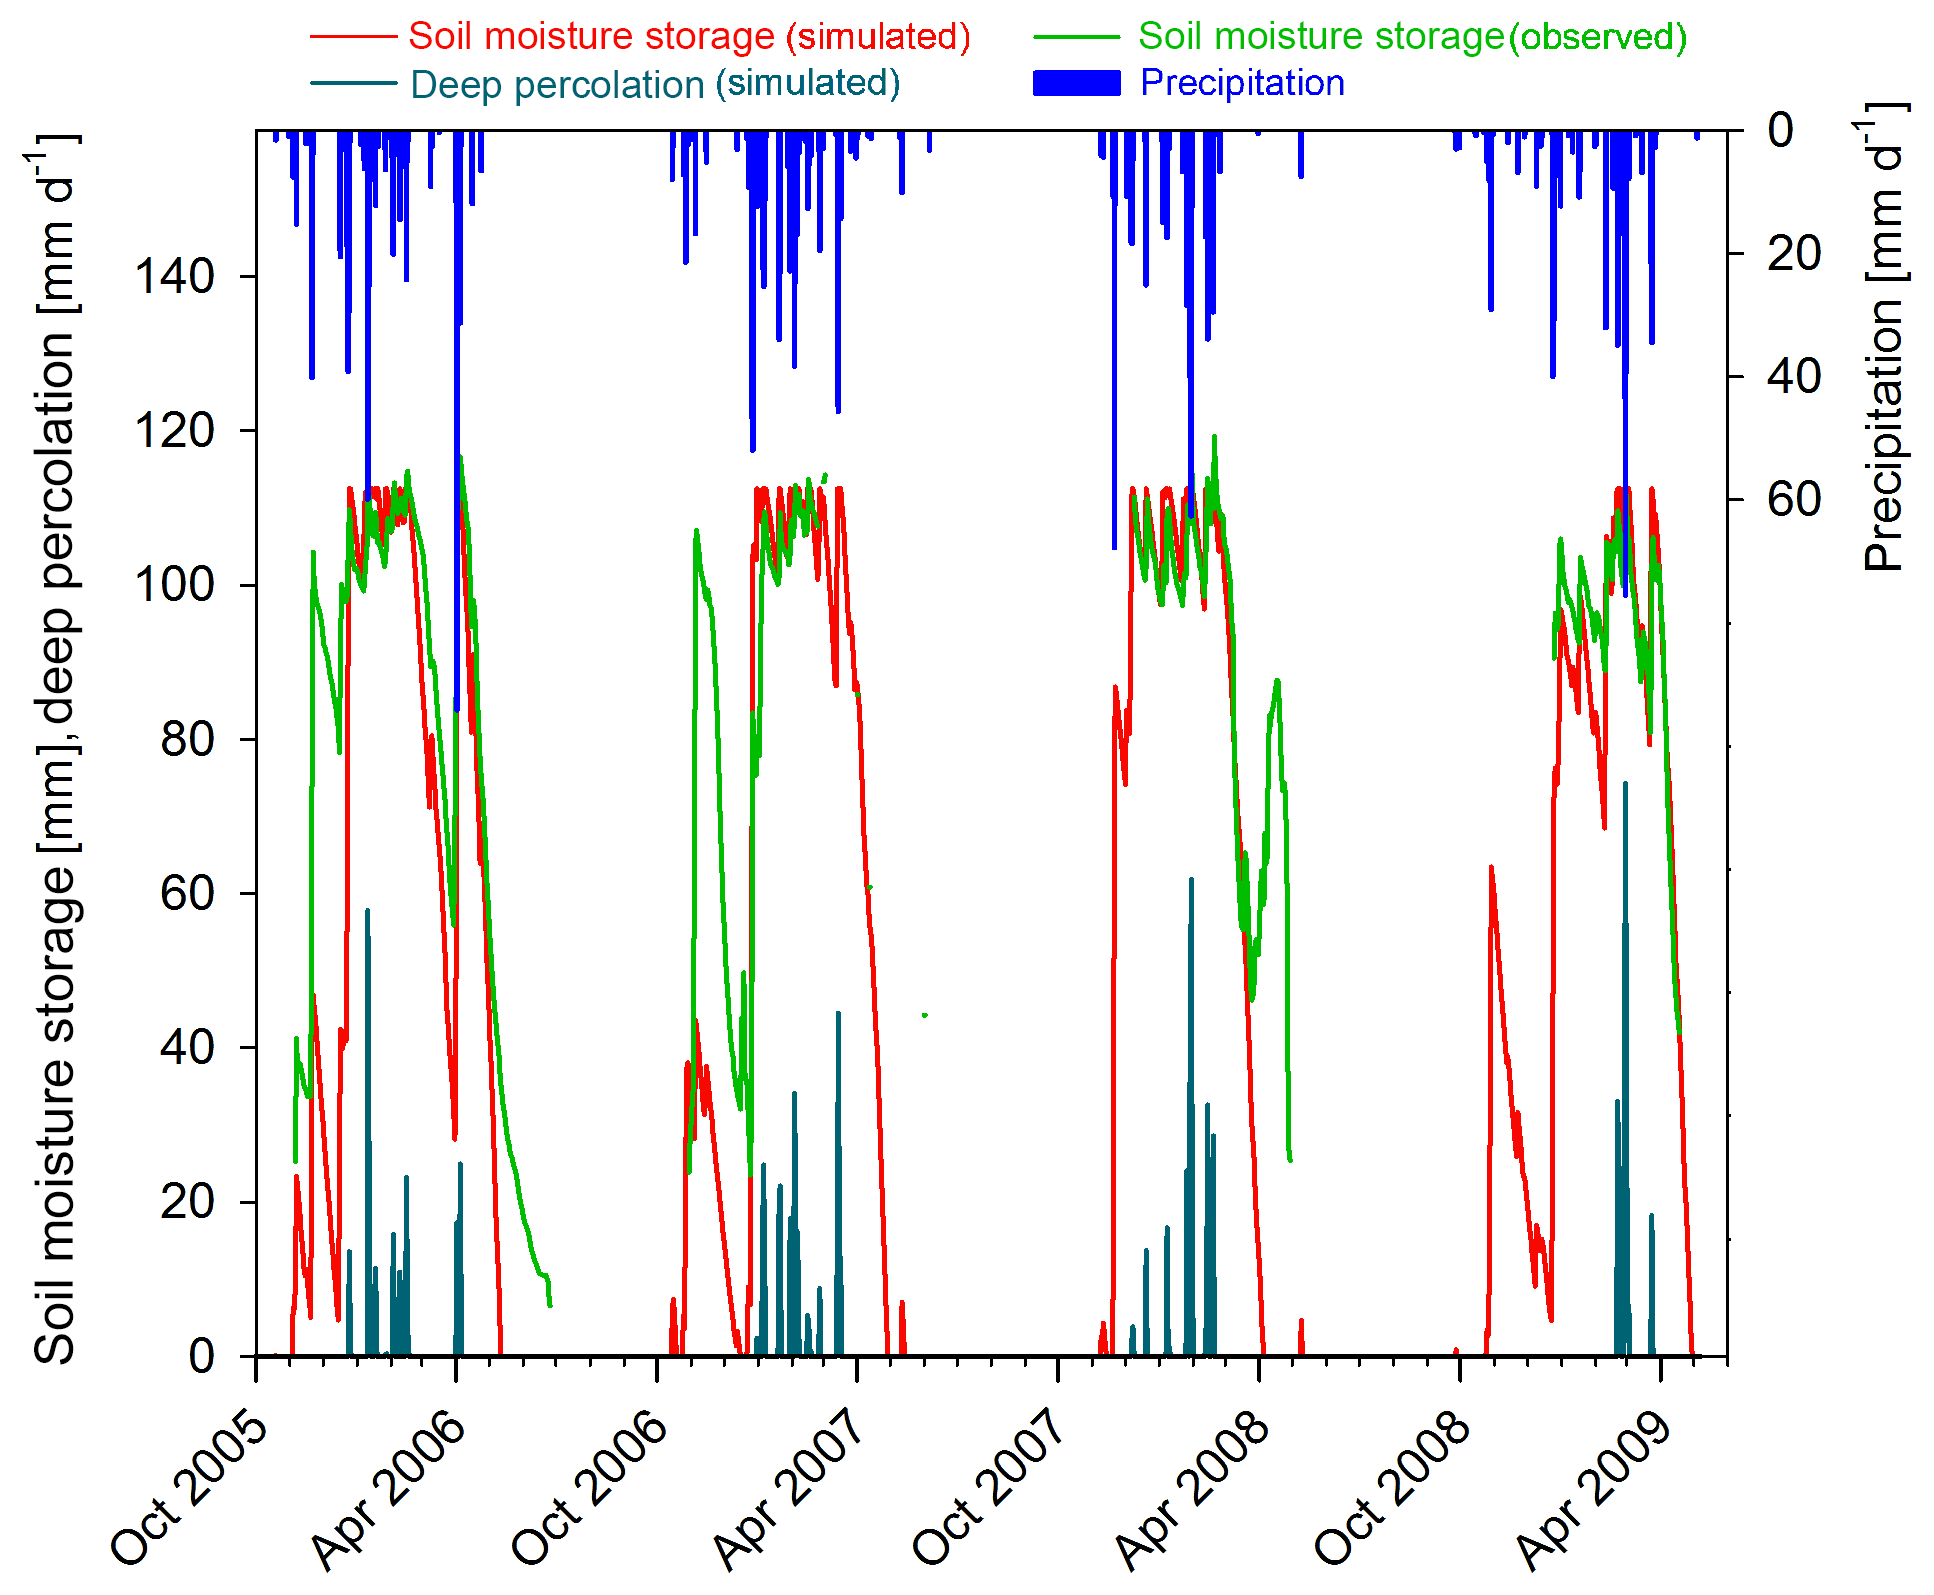
Figure 6Comparison of observed and modelled available soil moisture at Ras Karkar West (RK-W) from 2005–2006 to 2008–2009. Maximum water storage capacity (θs; at 112.5 mm) of the modelled moisture level (red) matched well with the observed maximum moisture (green). Brief periods of dashed green lines show questionable and erroneous soil moisture readings (see also Sect. 5 and Appendix B). Deep percolation (triggered above θs) is indicated as a dark-blue column (bottom of the graph); daily rainfall is indicated as blue columns (at the top).
4.3 Semi-qualitative examination of the model (by spring flow signatures)
For an additional check, we compared periods of deep percolation with the signature periods of peak spring discharge, as shown in Fig. 7. In most stations, recharge occurred during a period between 11 and 21 d per year. During very wet winters it occurred at a maximum of up to 31 d per year (e.g. in WZ-gh); during very dry winters a minimum of only 5 d per year (e.g. KF-E) were recorded. Precipitation thresholds that triggered DP varied between different years and SM stations, e.g. from 74 mm of accumulated seasonal precipitation as a minimum (in Shu) to 470 mm as the highest threshold (in KF-E). For the different years, the gaps between average station thresholds ranged between 206 mm (in 2004–2005) and 396 mm (in 2008–2009), with a multi-annual mean of 290 mm.
Figure 7 shows a very close match of temporal patterns. Observed spring flow in the local perched aquifers responded with almost no delay, usually within 1 d after the first modelled recharge event. This demonstrates both the karstic nature of the aquifers with rapid flow connections and the very local recharge conditions on the isolated hillsides.
The two most productive springs of the respective groups were Salem (Wadi Zarqa spring group) and Al-Qos (Beitillu spring group). Average spring flow was between 1.3 (Bibi) and 12.4 (Qos) m3 d−1. The smallest spring (Bibi) had a maximum discharge of 9 m3 d−1, while the largest (Al-Qos) had one of 78 m3 d−1. Both values were approximately 6 times larger than annual averages. Every slight rise of the observed daily spring flow (by as low as 8 % of the amount of average discharge) was connected to simulated deep percolation or recharge (Fig. 7). Comparing the dates of peak spring flow with that of DP events, a complete congruence of the respective dates was apparent. This analysis was performed for the period until September 2009, during which all springs had been measured reliably (see Appendix C, Table C1). All days with more than 1 m3 d−1 of increase in discharge at the Al-Qos spring were found to show simulated percolation; at Salem spring, the strongest spring in the Wadi Zarqa spring group, this was true for all days with more than a 0.7 m3 d−1 rise and at the 'Akkari spring for all days with an increase larger than 0.66 m3 d−1.
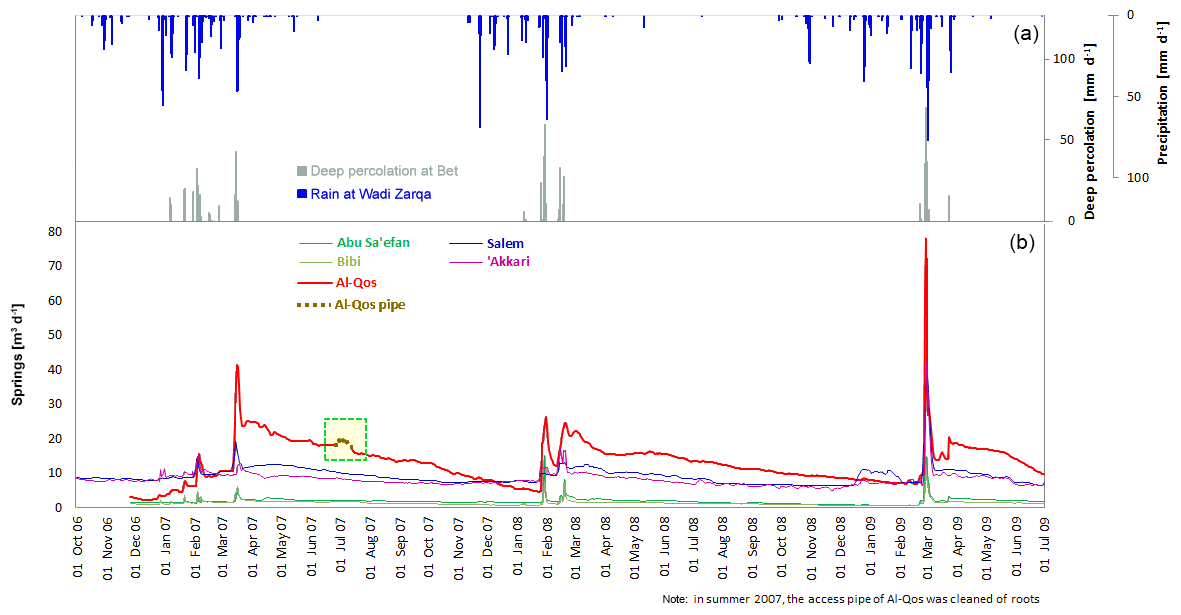
Figure 7Signatures of peak spring flow and DP events. Yellow-shaded box: temporary increase in spring discharge caused by the cleaning of plant roots from the access pipe at the Al-Qos spring (July 2007). Daily measured spring flow at the Beitillu spring group is shown in red, olive and green (b). At the Wadi Zarqa group in blue and purple, daily deep percolation is shown as grey columns (upper half), and precipitation is shown as blue columns (a).
Finally, annual recharge coefficients were calculated and compared to literature values (see also Appendix H, Table H1). Table 2 shows annual DP rates, annual recharge coefficients and the average of these annual RC values (between 30 % and 57 %) for the entire period, according to the soil thickness at each station, ranging between 30 and 90 cm.
Table 2Annual precipitation and recharge rates (DP) modelled at representative SM locations.
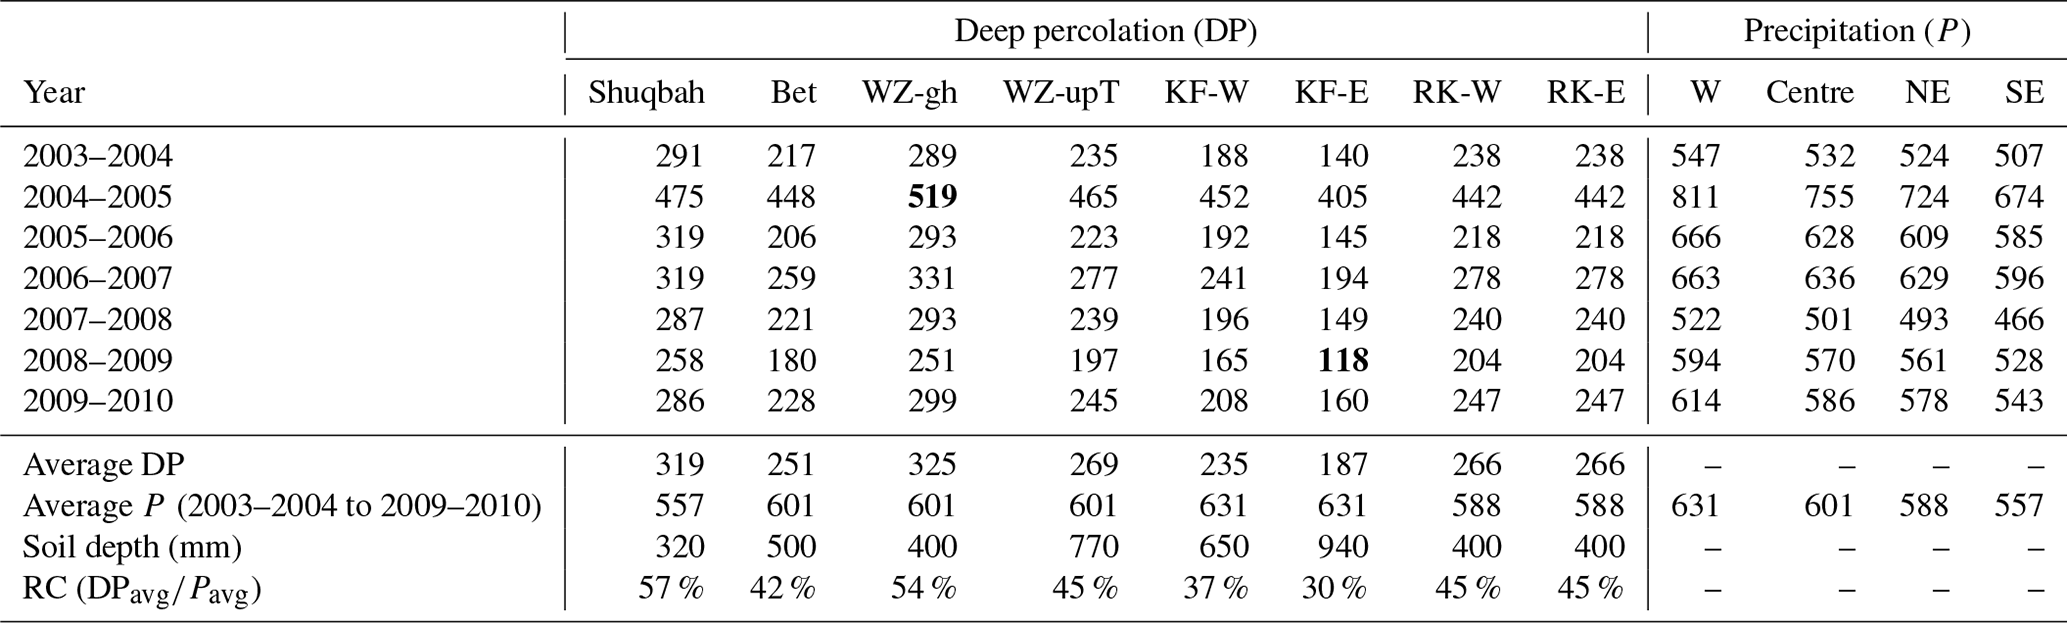
The table shows area precipitation of the respective sub-catchments of the SM stations (from Messerschmid et al., 2018). West (W) uses the average rain of the Ne'alin and Shibteen-1 sub-catchments. Centre refers to the average between Shibteen-1 and Wadi Zarqa. Northeast (NE) is the precipitation in Wadi Zarqa. Southeast (SE) represents the average of the Shibteen-2 and Ein Ayoub catchments (Fig. 4). The daily rates of deep percolation were modelled with these area precipitation values. Minimum and maximum values of DP are bold (WZ-gh in 2004–2005; KF-E in 2008–2009). All units are in mm a−1, except for the soil depth (mm) and recharge coefficients (expressed as DPavg∕Pavg as a percentage).
4.4 Summary of model results on annual levels
The annual percolation rate did not only depend on the annual precipitation, but it also depended on its seasonal distribution. For most years, a rise in annual recharge coincided with a rise in total annual rainfall, as shown in Fig. 8. The wettest winter (2004–2005 with a rainfall of 742 mm a−1) showed the highest recharge in each of the stations. However, the driest year (2007–2008 with 496 mm a−1) did not generate the lowest recharge, due to the seasonal distribution of very strong precipitation events that triggered high rates of percolation. This disconnection demonstrated the necessity to first calculate and model recharge in daily time steps in order to account for the event character of temporal rainfall distribution (Sheffer et al., 2010; Cheng et al., 2017) before these results can then be used for annual recharge calculations. It is also important to note the strictly reciprocal relationship between soil thicknesses and recharge coefficients. At all stations except for one (WZ-upT), the thinnest soils showed the highest recharge, and the thickest soils showed the lowest recharge (see Fig. 8). This general pattern confirmed our conceptual approach that closely linked soil depth with recharge.
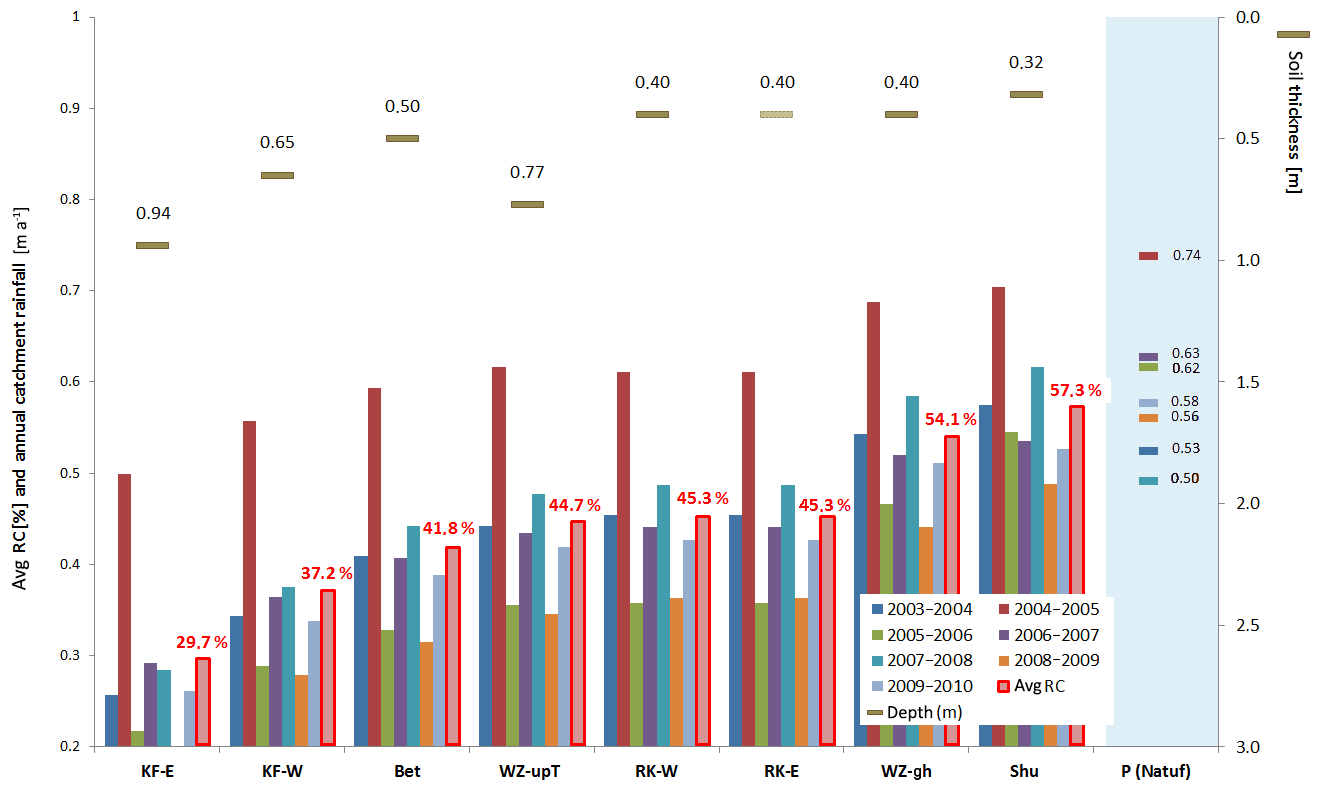
Figure 8Annual recharge coefficients, annual precipitation and soil depth (stations ordered by increasing RC). The coloured lines present annual recharge coefficients by station (x axis), increasing from left to right (as a percentage). Average annual RC values (red numbers) are reciprocal to the respective soil depths (as brown bars, with the exception of WZ-upT as a beige bar). The blue-shaded column at the right indicates annual precipitation – shown as P (Natuf) – as the area average (in m a−1).
Figure 8 plots different measurement stations with ascending soil depths on the x axis against annual recharge rates on the y axis with a marked and almost consistent linkage between the two (except for WZ-upT). This pattern of association forms the basis of our extrapolation and attribution approach for entire formations and their recharge coefficients (for the representativeness of the soil depths at our SM stations, see Appendix D, Table D1).
5.1 General approach of process representation
Our results demonstrate that even in ungauged basins a realistic model of distributed groundwater recharge can be obtained through limited field observations of key parameters of the complex percolation process. Unlike previous studies in the WAB, the direct and location-specific assessment of water storage capacity from long-term soil moisture readings was generated as robust and realistic “local knowledge” to determine recharge because the rate of modelled percolation (recharge) was a direct function of SM storage, which was highly location specific. Since distinct land forms of LU/LC and typical soil depths could be related to each geological formation (Table D1), the SM plots and their RC values were formation specific. Existing literature often only provides values for permanent wilting points (pwp) and field capacities (Fc), which are similar but not identical with our measured maximum and minimum SM values. The θs value is a direct measure of the mobile, available water inside the soil column, subject to accumulation, evapotranspiration, saturation and deep percolation (recharge). In reality, the processes of soil moisture accumulation, deficit and saturation are complex and depth dependent. Indeed our sensors installed at different depths indicated slightly different temporal SM dynamics. Deeper soil segments reacted later in the season but arrived at a relatively stable maximum plateau value at about the same times as the shallower sensors. On the other hand, they dried up at a slower pace in summer. This was in line with the generally known and expected dominant processes of accumulation, storage, and loss through evaporation and transpiration from roots. It should be noted here that most of our soils were only about half a metre thick or less and that even the lowermost soil segments were within the reach of most plants (Mediterranean trees, bushes and shrubs), resulting in a low retention capacity. Our calculation method of adding up the measured water contents of all sections accounted for the different conditions and processes at varying soil depths, and by this they provided a simplified yet realistic representation of total soil moisture throughout the soil column.
Adhering to the PUB goal of parsimony, our SM saturation and percolation model only accounted for two climatic drivers (P and ETp) and one spatially distributed physical parameter (θs), each set up in daily time steps. The model is a simple one-dimensional tank or combined-reservoir model as already used by Sheffer et al. (2010) and Schmidt et al. (2014) (see Fig. 5). This parsimonious modelling approach is based on two conceptual but field-observed assumptions of dominant processes. Firstly, the model only accounts for direct recharge (as DP) from in situ soil infiltration. Whereas some local lateral water movement on and inside the soils and within the range of a few metres distance has to be expected, this nonetheless is conceptually included here under local processes and therefore quantitatively accounted for as direct recharge. This particularly applies to epikarst outcrops with soil pockets. Moreover, as discussed in Sect. 2, no signs of indirect recharge processes were observed in the field (with the notable exception of transmission losses; discussed below). Ponding as a sign of lateral surface accumulation was restricted to small puddles of a few metres in diameter at their maximum and within clearly discernible, very small topographic depressions. Lange et al. (2003) in their runoff generation sprinkler and tracer tests close to Wadi Natuf also observed such near-surface runoff–runon processes and found them to occur in a radius of decimetres, at maximum metres (see also Ries et al., 2015). This lead to surface runoff generation on hillslopes, which was largely lost by the aforementioned transmission losses through the gravel beds of the wadis. While this point and line infiltration along wadi beds could be considered as indirect recharge, previous studies by Messerschmid et al. (2018) had shown that overall runoff generation in Wadi Natuf was very low (<1 % of annual area precipitation). Hence, runoff, though important during single high intensity events (see also Ettinger, 1996), could be neglected as a significant part of the catchment's overall water budget, thus also adhering to the PUB goal of simplification and parsimony. Secondly, our model accounts for only one dominant recharge generation process: deep percolation from the soil into the bedrock under SM saturation excess. This is in line with the already discussed findings from other studies in the WAB and adjacent basins (Ries et al., 2015, 2017; Sheffer, 2009; Messerschmid et al., 2018; Lange et al., 2003) that agreed that deep percolation or recharge, as much as surface runoff, must be described as a process of soil moisture saturation excess (see Sect. 1.3). For further discussions on the applicability of soil moisture balance models in the WAB, see Hughes and Mansour (2005), Hughes et al. (2008).
5.2 Spatial and temporal variability of precipitation and recharge
The main focus of our approach was the spatial differentiation of recharge, although our model also considered temporal patterns. Our annual recharge coefficients were based on a model which was run in daily steps and therefore fully accounted for the temporal distribution of rainfall, especially storm events. The model results of annual recharge coefficients suggested a relationship between spatial and temporal variability. When the standard deviations for annual recharge and annual precipitation were plotted against each other, we found that standard deviations for rainfall increased with annual rainfall (except for the year 2005–2006), whereas spatial variability of recharge diminished (see Appendix G, Fig. G1).
Although 7 years of modelling may not be enough to draw far-reaching conclusions, we can still conclude that the question of spatial variability of recharge deserves greater attention than that given in most recharge studies, particularly in the Western Aquifer Basin. Within this study, average RC values were calculated from the individually calculated annual values (Sect. 3.5). This somewhat extrapolative approach does not fully reflect the temporal variability and seasonal distribution of rainfall, which may lead to different recharge rates even in years with identical annual rainfall amounts. However, since our study focussed on spatial rather than temporal recharge variability, this inaccuracy seems justified and is in line with the PUB recommendations for simplification (Seibert and Beven, 2009). While our long-term average RC values thus remain somewhat of an approximation, it can already be stated here that it appears likely that a true reflection of seasonal rainfall distribution would lead to a slight but not significant change in the overall average of multi-annual recharge coefficients.
5.3 Annual recharge coefficients: comparison with other studies
As observed by Lerner et al. (1990), recharge is a temporally highly variable process that is most adequately investigated on the event level (in the WAB a time span of 0.5 to 5 d). While the model with its daily steps fully reflects the event character during the measurement period, the generalisation of annual recharge coefficients always carries some range of uncertainty. However, as already presented, the individual recharge coefficients calculated for the different formations cropping out in Wadi Natuf ranged between a minimum of 0 % (for non-recharging aquitards like the upper Yatta formation) and a maximum of 57 % for highly permeable and intensively karstified limestone aquifers such as the Jerusalem formation (see Table 1). These overall recharge values fall well within the range usually quoted for the WAB. Table H1 in Appendix H lists the regional and other reported recharge coefficients both for annual and event-based calculations and together with the methods applied therein.
This study provided formation-specific distributed recharge coefficients in a Mediterranean karst area with a highly variable lithostratigraphy from a one-dimensional soil water balance model, relating percolation to SM saturation excess (SMSP model) applicable in comparable basins all over the world. The parsimonious forward-calculating model was restricted to key factors driving recharge with observed spatially distributed formation-specific maximum water storage capacities. The analysis was solidly grounded in intensive field measurements, and no calibration of model parameters was performed. The observed formation-specific correlation with soil depth and land form ensured the representativeness of the maximum water storage capacity over each formation and for long-term conditions of wet and dry years.
The model was based on the observed key process understanding, namely that groundwater recharge can be simplified and described as a soil saturation process in a variety of local conditions with a wide range of land features. Hereby, daily modelling steps were found to be appropriate to respond to the typically Mediterranean variability of meteorological events (storms) driving recharge. Equally, it was found that our 7 years of observation covered the entire range and variability of long-term climatic conditions (30-year maxima and minima). The model was tested by a comparison between modelled and observed soil moisture and by a temporal overlay of peak spring discharge and deep percolation events.
A follow-up study will regionalise the formation-specific recharge coefficients presented here to all formations in the entire Natuf catchment (Messerschmid et al., 2020). The gained recharge coefficients can also be used for a basin-wide distributed recharge model of the entire WAB. The methodology presented here can be applied in many of the still ungauged groundwater basins worldwide.
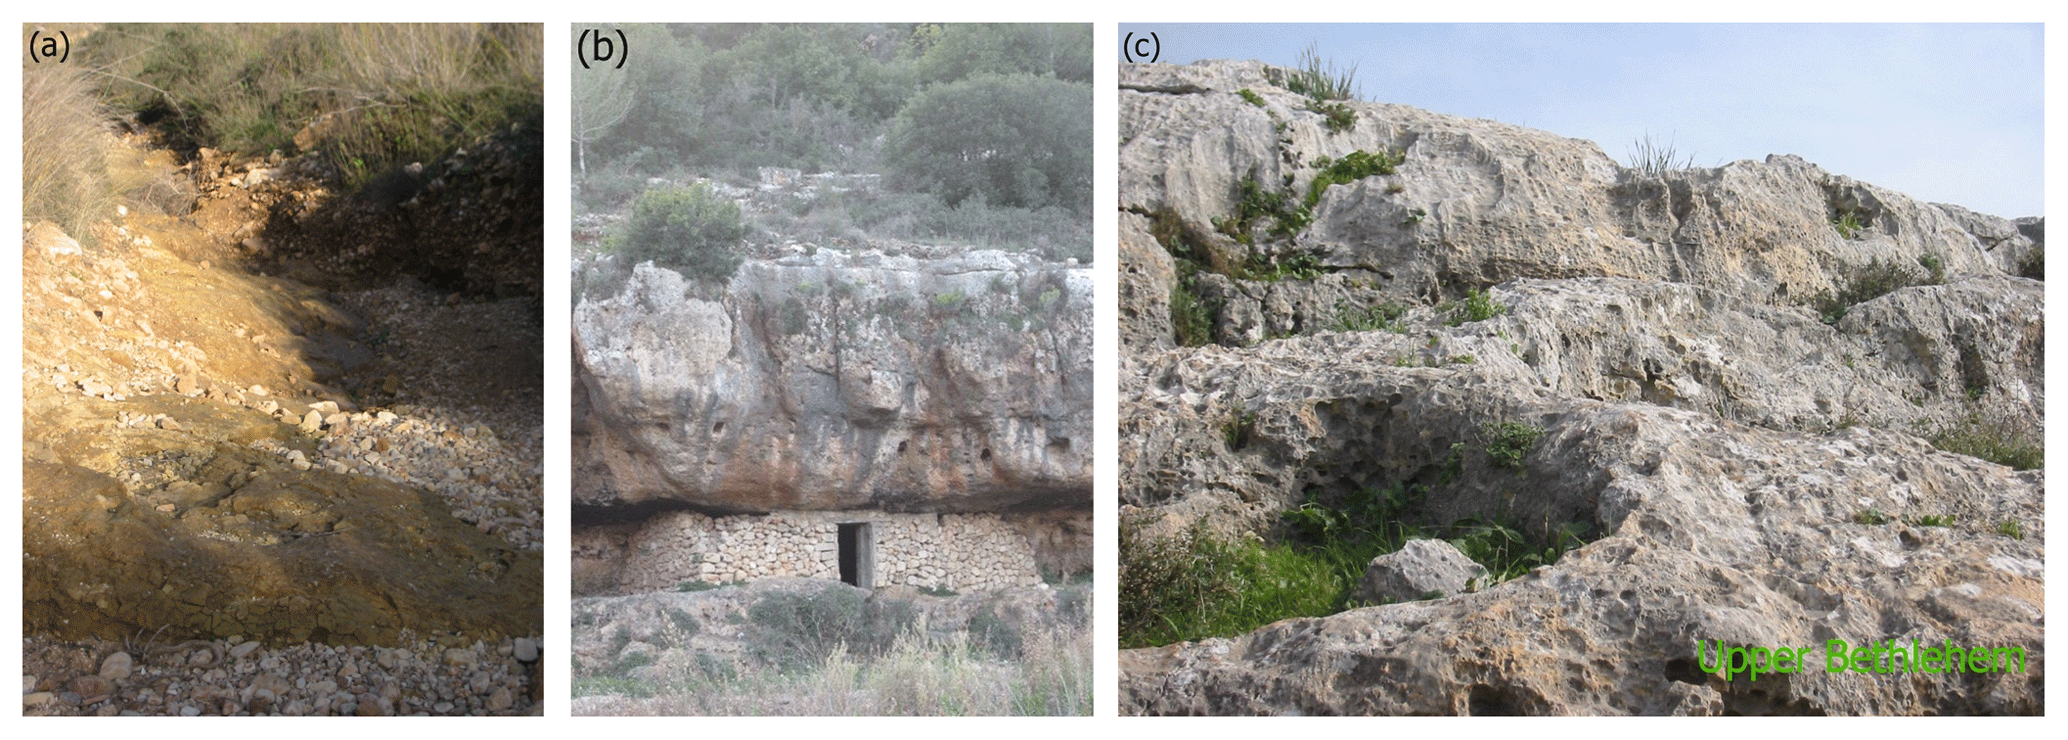
Figure A1Formation outcrops. Rare outcrops of yellow marls, forming the main regional aquiclude (upper Yatta formation) near Ras Karkar (a); reefal limestone cliff at Wadi Zarqa (u-UBK formation) with high primary porosity and the development of karst and epikarst (b); karstic karren landscape (upper Bethlehem formation) with a relatively rare example of discontinuous soil cover (soil pockets) in Wadi Natuf (c).
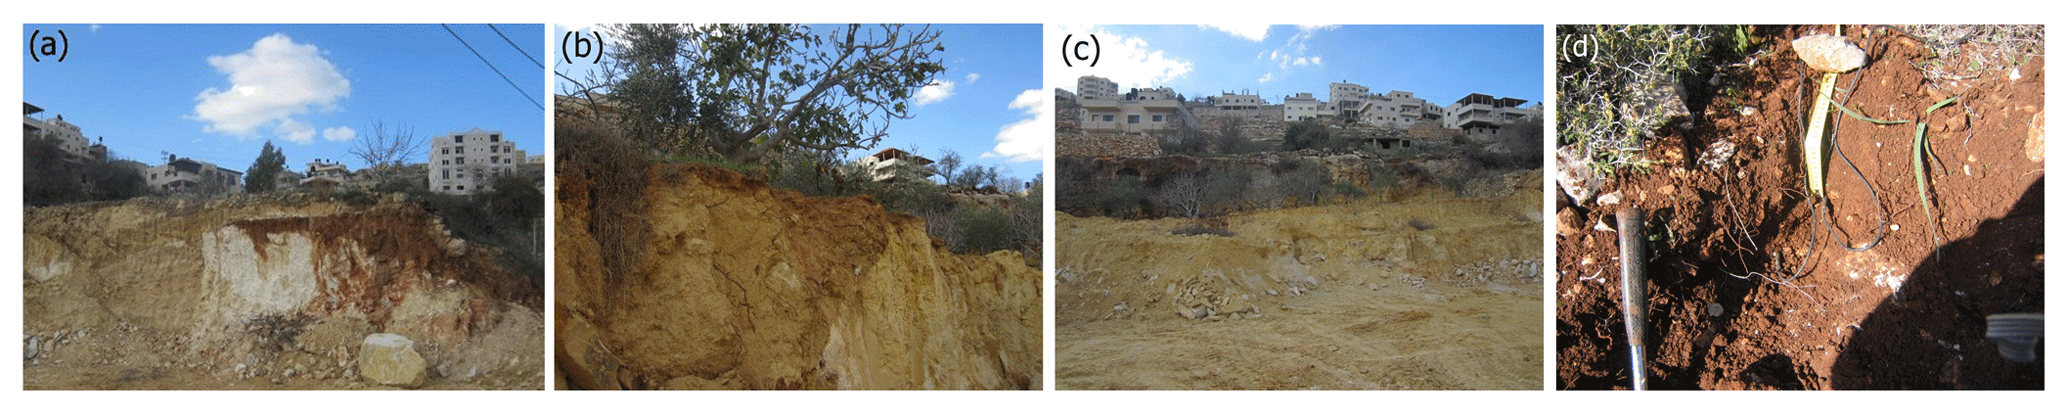
Figure A2Soil cover. Soil covering marly limestone (bottom Hebron/top Yatta formation), with some white caliche-type “Nari” crust (a, b, c); Ras Karkar soil measurement station (RK-W; lower Hebron formation) on natural terraces of thin terra rossa soil (d).
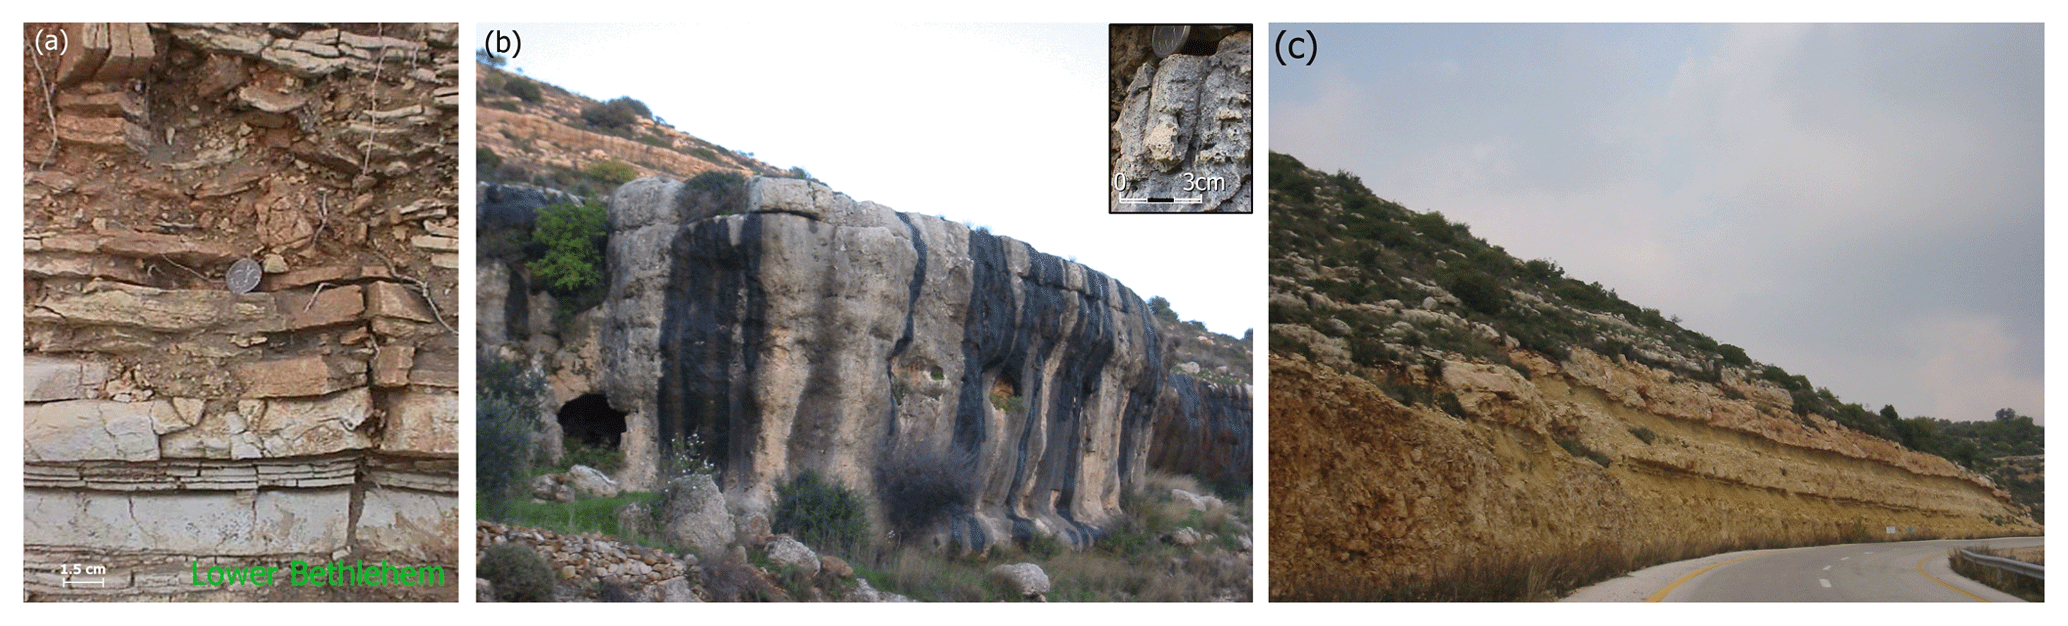
Figure A3Lithostratigraphic formations. Colourful, thinly plated limestone of the lower Bethlehem formation (l-Bet) with a more impermeable facies of fine marl intercalations (a) can act as a confining layer beneath upper Bethlehem (u-Bet). Cliff-forming coral-reef limestone of the upper UBK formation at Wadi Zarqa with high primary porosity but also with signs of karstification; the inlet photo shows a 1.5 cm thick remnant of coral branches (b). Twin band of soft yellow marls, located 2.5 km SE of Beitillu (c); it acts as confining layer beneath the local perched aquifer at the top of the lower UBK formation (top l-UBK) and the main part of l-UBK beneath.
Some technical equipment and interpretation problems were encountered at three of the eight SM stations (RK-W, KF-W and WZ-upT), resulting in unreasonable measurement records or misreadings. “Misreadings” here is understood as a general term for strong deviations between SMobs and SMmod or as unreasonable measurement values, either with alleged SM contents above cumulative rain heights or apparent moisture increase during dry spells. The reasons for such deviations of SMobs from SMmod are manifold: first, the model could be inadequate; secondly, the interpretation of recorded field data could have been affected by additional factors; or thirdly, the measurement equipment could have malfunctioned. It seemed clear that at least when levels of SMobs surpassed preceding seasonal precipitation, technical malfunctions occurred. This interpretation was strengthened by the following field observations: during summer and late autumn, before soil moisture slowly started to accumulate in the soil column, a lumpy-to-blocky aggregate structure was encountered in the silty and clayey terra rossa soils, which had dried up and shrunk during summer. These soil aggregates then formed about fist-size lumps, separated by desiccation cracks. By this, preferential flow paths were formed along these cracks, which are known to enable increased rates of rapid infiltration and soil moisture accumulation, as observed by Gimbel (2015) further north in the West Bank. The temporary presence of free water within the desiccation cracks may have caused unrealistic moisture levels if a sensor happened to cross such a crack. However, it is difficult to assess such a possibility in hindsight since the desiccation cracks are a transient soil pattern and their temporary position during measurements remained unknown. It is however important to note that such unreasonable SM readings did not occur in winter during the recharge events when the swelling soil had already closed the temporary desiccation cracks. In addition, soil samples collected by hand during the peak rainy season with independent control readings in the laboratory confirmed the validity of field readings at the automatic SM gauges. In only one instance were unrealistic SM readings also encountered during the end of the rainy season (April 2008); this was at station RK-W. Equipment failure is the most probable explanation here. However, this isolated late event happened long after the period of SM saturation and recharge and did not affect the results of the model calculations.
In addition to these conceptual interpretations, the overall reliability of SM readings was also assessed and analysed statistically. Table B1 lists the days with erroneous and questionable readings (together 147 d in four stations).
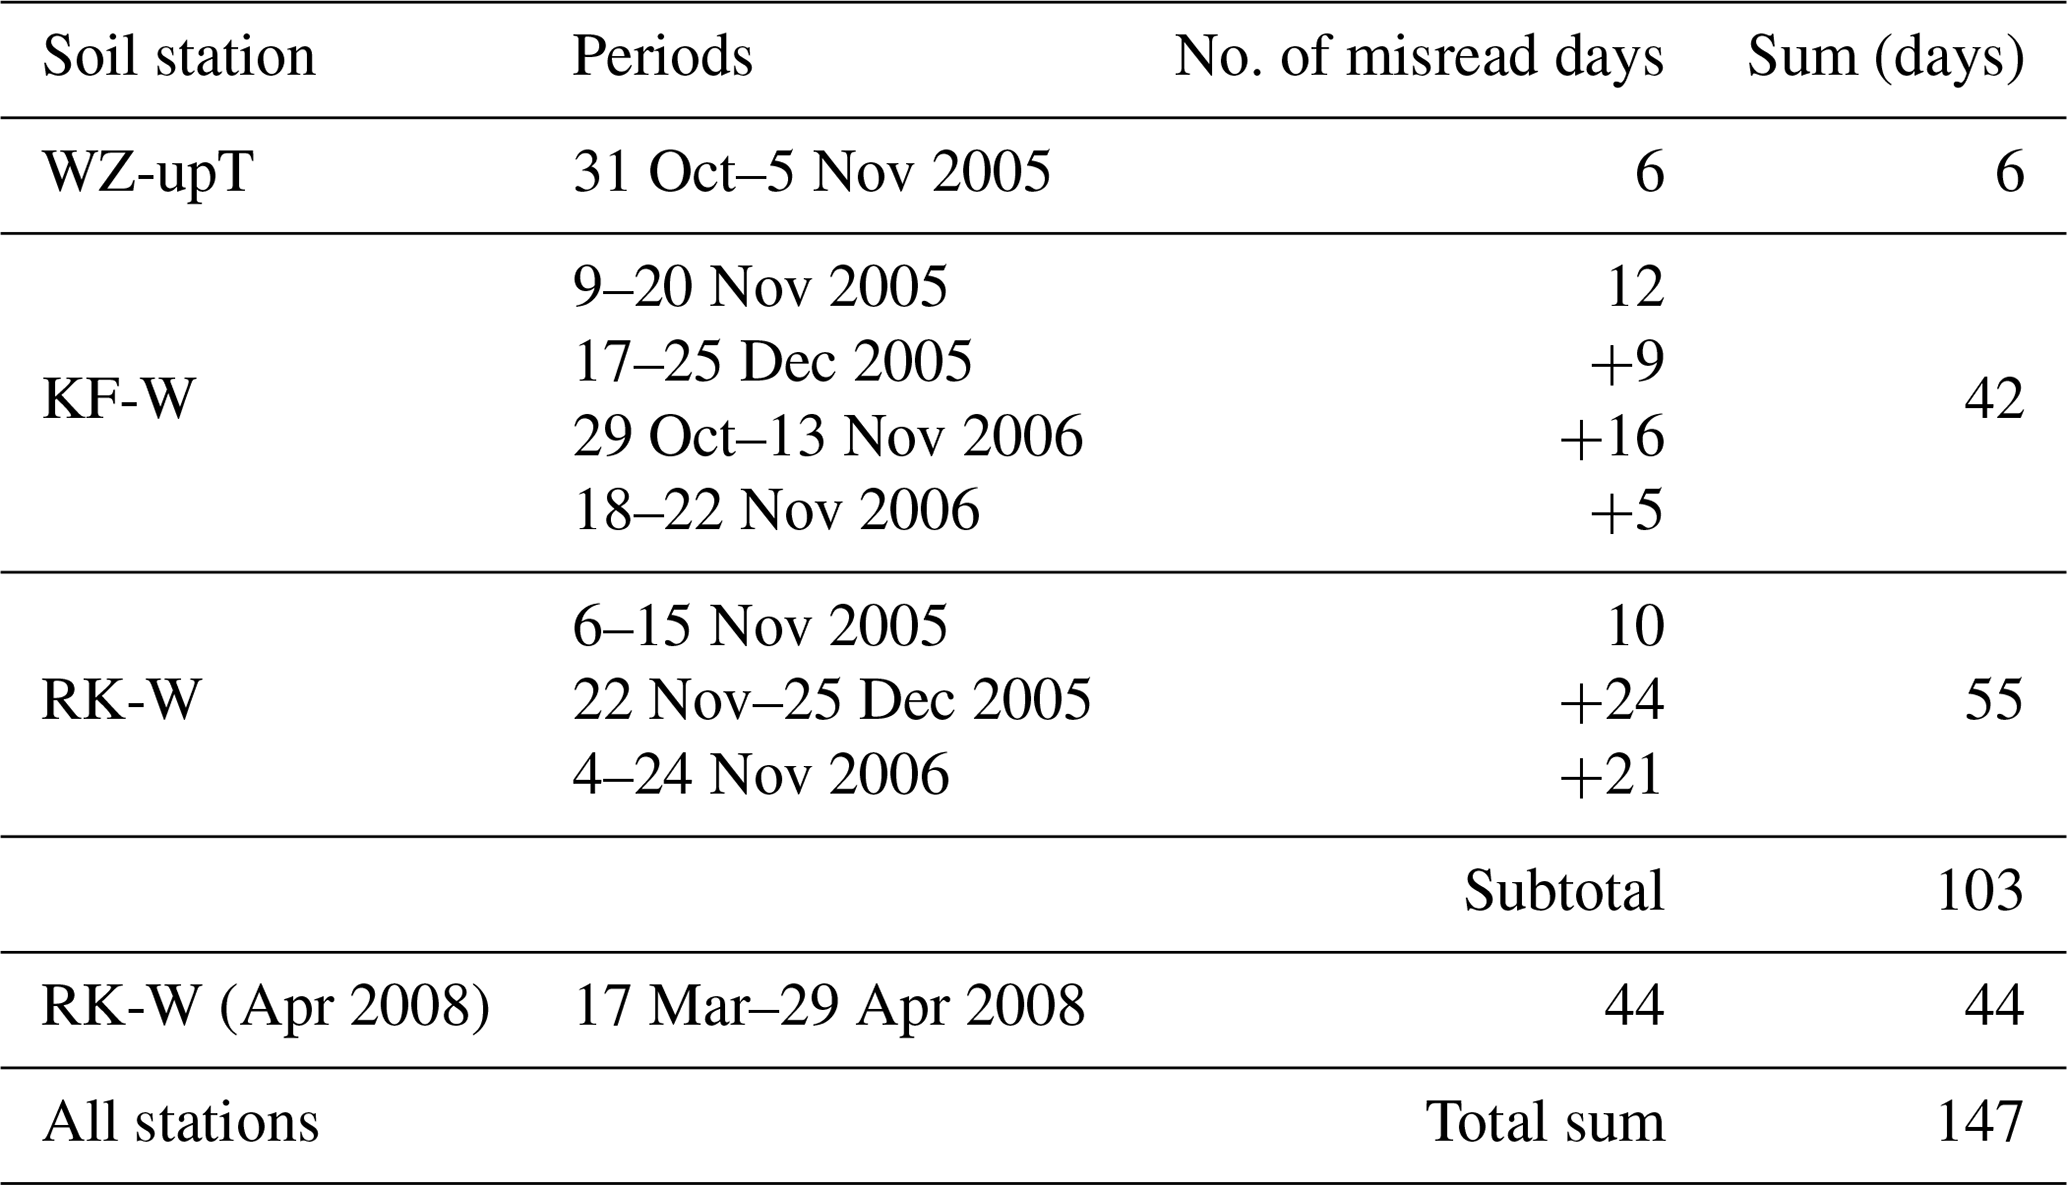
Table B2 compares the days with such misreadings to the total number of days measured and modelled, and it indicates their respective shares.
Together, the 147 d of questionable measurement records in three stations represent 8.09 % of all days recorded (147 d out of 1818 d of total SM readings) and 0.72 % of the total model period (20 456 d for the eight stations over a 7-year period).
In WZ-upT, only 6 d of error occurred (November 2005), equivalent to 2.90 % of recording days.
In KF-W, 42 d (or 14.95 %) of error occurred over the entire read-out period.
In RK-W, 55 d of error occurred in early winter 2005 and 2006 (with SMobs>Pcumulative), equivalent to 8.91 % of recorded days, in addition to 44 d (7.13 %) in April 2008 (totalling 16.05 % of failed readings).
Table B2Periods and shares of days with misreadings.

Percentages are rounded to the second digit after the decimal point.
Table B3 presents the Nash–Sutcliffe efficiency coefficients for the eight SM stations. All stations (except one, RK-E) show NSE values between 0.40 and 0.96. The one station with a bad match, RK-E (with an NSE of −0.35) was excluded from further calculations; its results were not used for the analysis of annual recharge coefficients. As a result, we can state that such periods of malfunctioning soil moisture probes are extremely short and rare; therefore, modelled SM can be considered a valid representation of actual SM developments over time and for different spatial units. In addition, the quantities of additional soil water above the maximum storage capacity are fully accounted for by the daily budgets of the percolation model.
Daily spring readings were carried out by hand (with a stopwatch and bucket) and by different personnel in the respective spring groups. The Beitillu spring group was fully covered for 3 years. In the first season (2003–2004), measurements started late in the season and then were read most of the days in winter and scarcely in summer. In the season 2009–2010, continuous readings continued until February 2010. The two springs at the Wadi Zarqa spring group (Salem and 'Akkari) had the same coverage as the Beitillu group in 2003–2004 and were almost uninterruptedly read from December 2005 (season 2005–2006) until February 2010. Hence, high coverage was achieved during almost six seasons in Wadi Zarqa and during nearly five seasons in Beitillu.
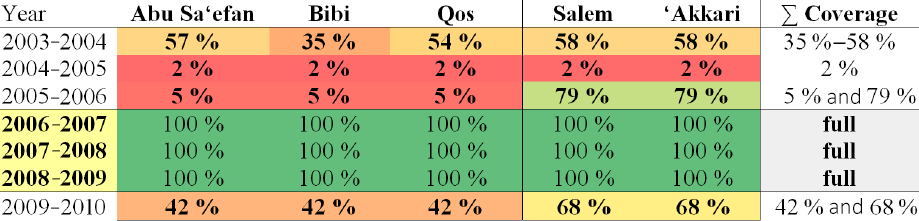
Table D1Soil depth matrix.
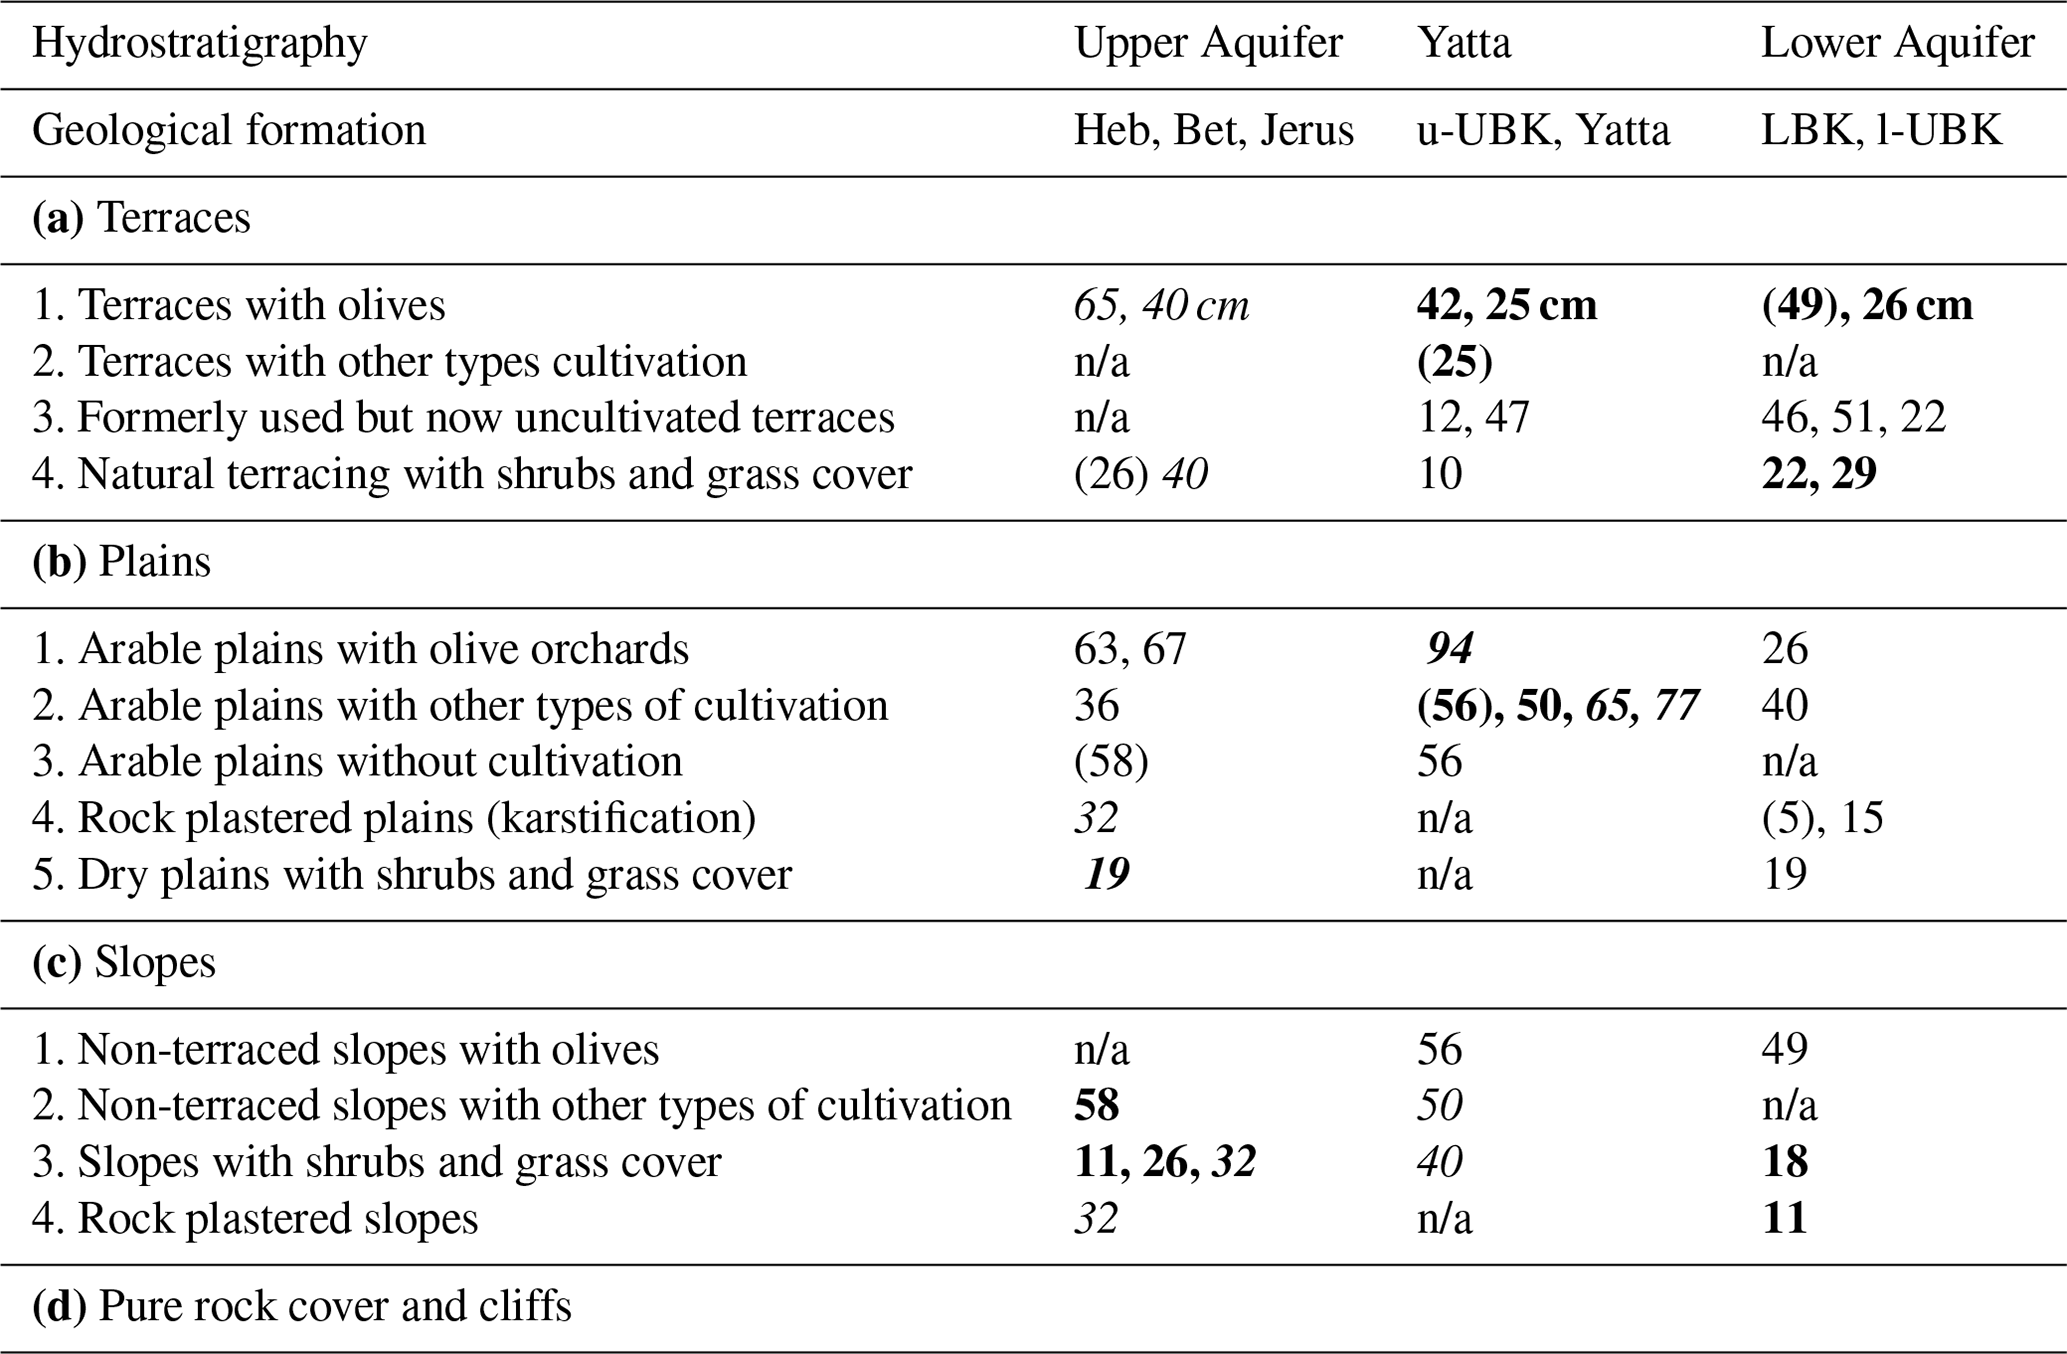
The soil thickness survey was carried out at representative locations of every outcropping formation, such as different types of vegetation, relief, land use and natural land cover. The table simplifies the results for an overview over different typical soil depths for the regional units of Upper and Lower Aquifers and the regional Middle Aquitard (with the individual formations indicated in line 2). Values that were also encountered at the SM stations are shown in italics. Main land form types are shown in bold. The values for the l-UBK formation are representative of the main body of the formation but not for the top of l-UBK (see second row, right column). Cells marked as n/a represent untypical vegetation and land form types for the respective formations. LBK: Lower Beit Kahil formation.
If the 7 years covered in this study (2003–2004 to 2009–2010) are to be used for calculations of multi-annual averages, they must reflect the range of long-term climatic conditions in the basin. Since no long-term climatic records are available for Wadi Natuf, the representativeness of the 7 years modelled was compared on the level of the entire WAB area. The Hydrological Service of Israel (HSI, 2016) presents records of annual area precipitation for six different sub-basins (cell groups) within the Western Aquifer Basin from north to south (Fig. E1). Wadi Natuf lies at the border between the northern and central cell group of the WAB and near the Jerusalem cell group, and it was found to be best represented by a mixture of the central, northern and Jerusalem cells of the WAB.
The period of documented precipitation records spans 44 years from 1970–1971 to 2013–2014. Only 2 years of these were drier and only 12 years were wetter than the 7 years studied here. Out of these 12 wet years, only 5 years (or 11 % of the 44 years) were wetter than the maximum in the range of the 7 years by more than 20 %. And if we allow for a 10 % margin of rainfall deviation, 82 % of all 44 years (36 of 44 years) lie within the total range.
For each cell group (north – 210, centre – 211 and Jerusalem – 212) the arithmetic mean precipitation was calculated over 44 years and over the 7-year period, respectively. Then the average of the three mean values for each cell group was formed for both the entire and the 7-year period. These values were 610 mm a−1 for the entire 44 years and 621 mm a−1 for the 7 years studied here. In other words, the 7 years were slightly wetter than the average of all 44 years (for the spatial averages of three cell groups), but this was only by 1.7 % (101.7 % of the 44-year average, marked underlined in Table E1).
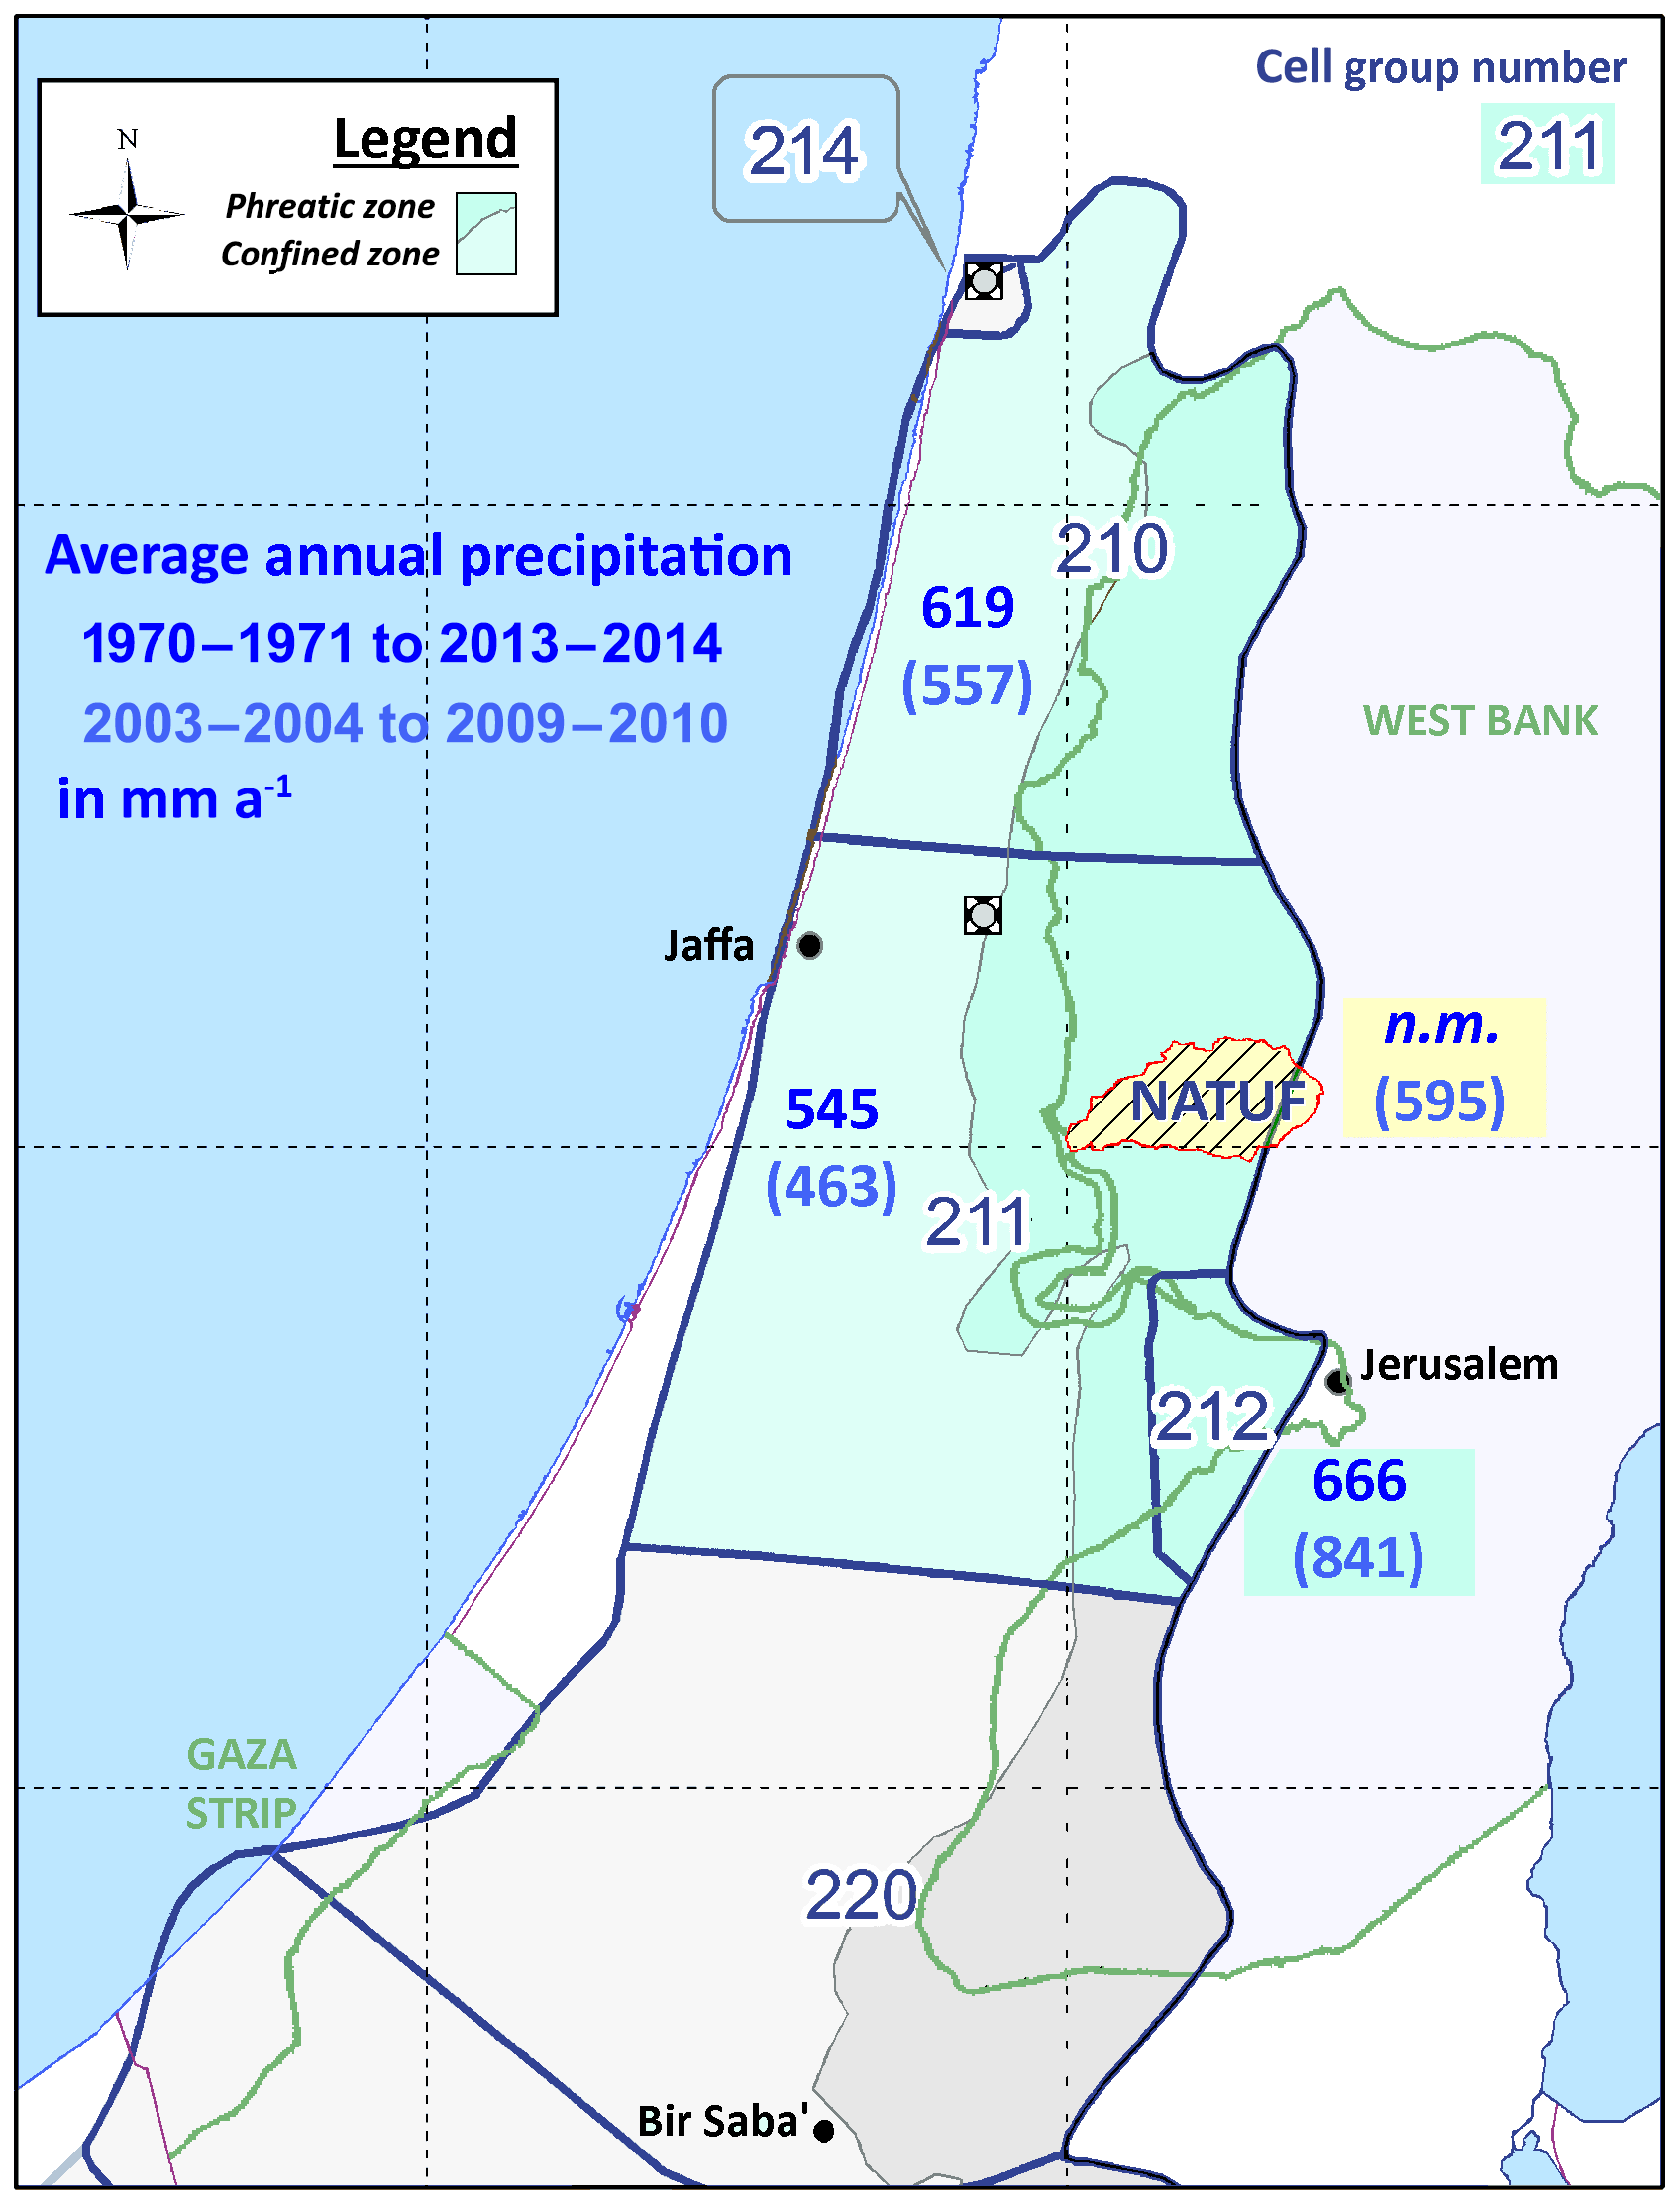
Figure E1WAB cells of area precipitation (modified after HSI, 2016). The map indicates area precipitation for two periods: long term (1970–1971 to 2013–2014) and the 7 years of this study. Long-term area rainfall data for Wadi Natuf are not available; the 7-year period was measured by tipping buckets. Precipitation data for the three cells groups, nos. 210, 211 and 212, were taken from HSI (2016) (n.m. represents areas which were not measured.)
When the same analysis was done for the median instead of the arithmetic mean, long-term conditions resulted in 600 mm a−1, and the 7-year period had 624 mm a−1. The long-term and short-term median values were also compared in each cell group independently (their averages are indicated as underlined in Table E1). Table E1 shows the two different calculation methods and the end results of the analysis together with the individual results for each cell group.
Table E1Comparison of average rainfall in WAB cell groups: long term and the seven years from 2003–2004 to 2009–2010.
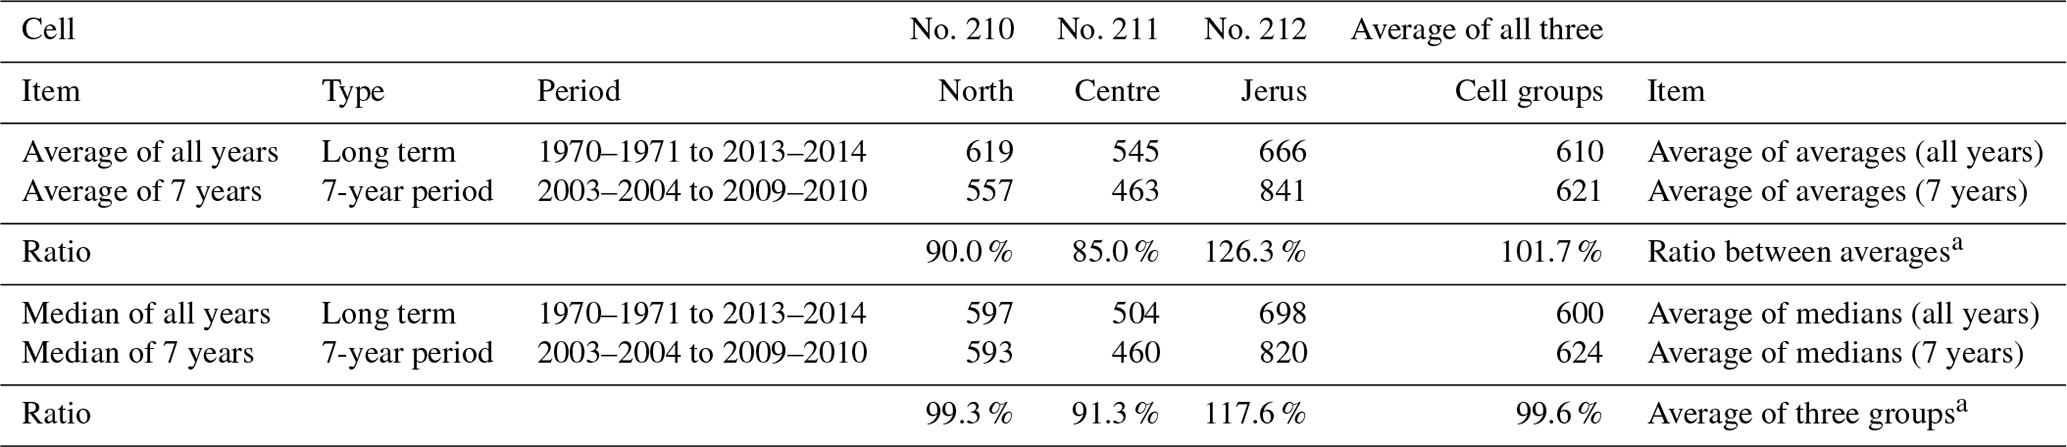
a The above calculation uses the average between resulting means (610 and 621 mm a−1, respectively). The calculations below show the average of the ratios, formed in each cell group. WAB annual precipitation was based on data from the Hydrological Service of Israel (HSI, 2016). All rain heights are in mm a−1; the ratios are percentages.
Thus, it can be shown that the 7 years of rainfall observation in Wadi Natuf cover almost the entire range of long-term annual rain distribution. Only a single year, the winter of 1991–1992 with its century rainfall, clearly lies outside the rainfall range covered by our measurement period.
When signatures of peak spring flow periods were compared with those of recharge (DP), it had to be assured that the discharge of the selected daily measured springs was representative for the spring groups draining the respective aquifers. This could be affirmed by the analysis shown below. In addition to the five springs that were daily measured, all springs in Wadi Natuf were measured during four key date campaigns. The tables below show that the ratios between the discharge at the combined daily measured springs and the entire spring group discharge were very stable; their relative shares deviated only slightly, as shown by the low standard deviation values in Tables F1 and F2.
Table F1Comparison of spring discharge (and the standard deviation) between daily measured springs and the entire Beitillu (Harat al-Wad) spring group during key date campaigns.
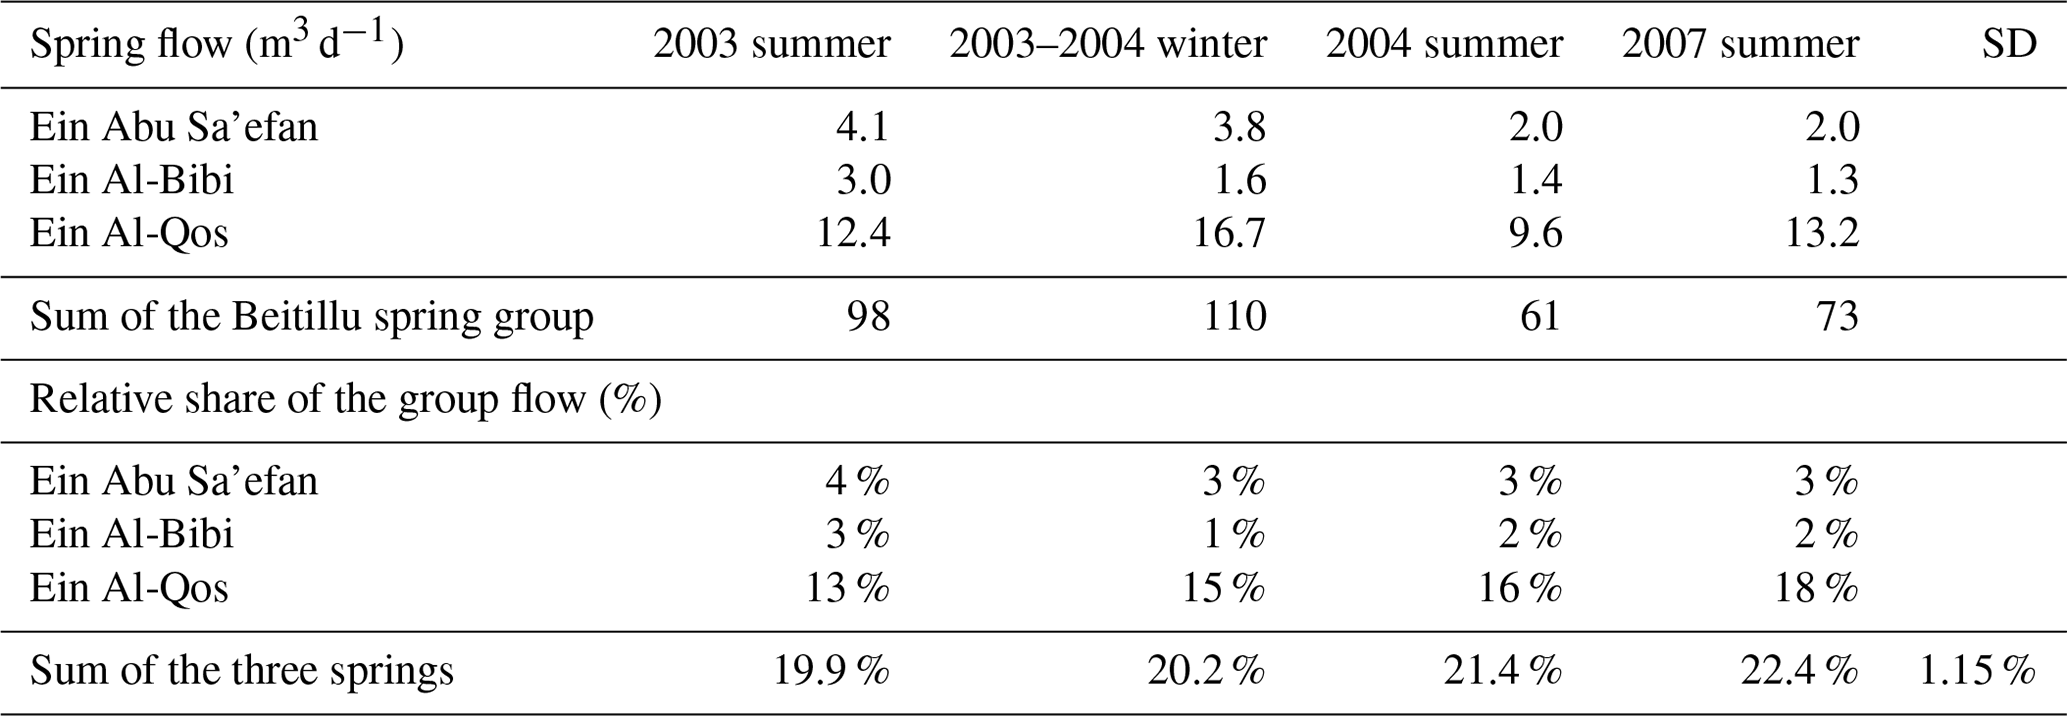
Table F2Comparison of spring discharge (and the standard deviation) between daily measured springs and the entire Wadi Zarqa spring group during key date campaigns.
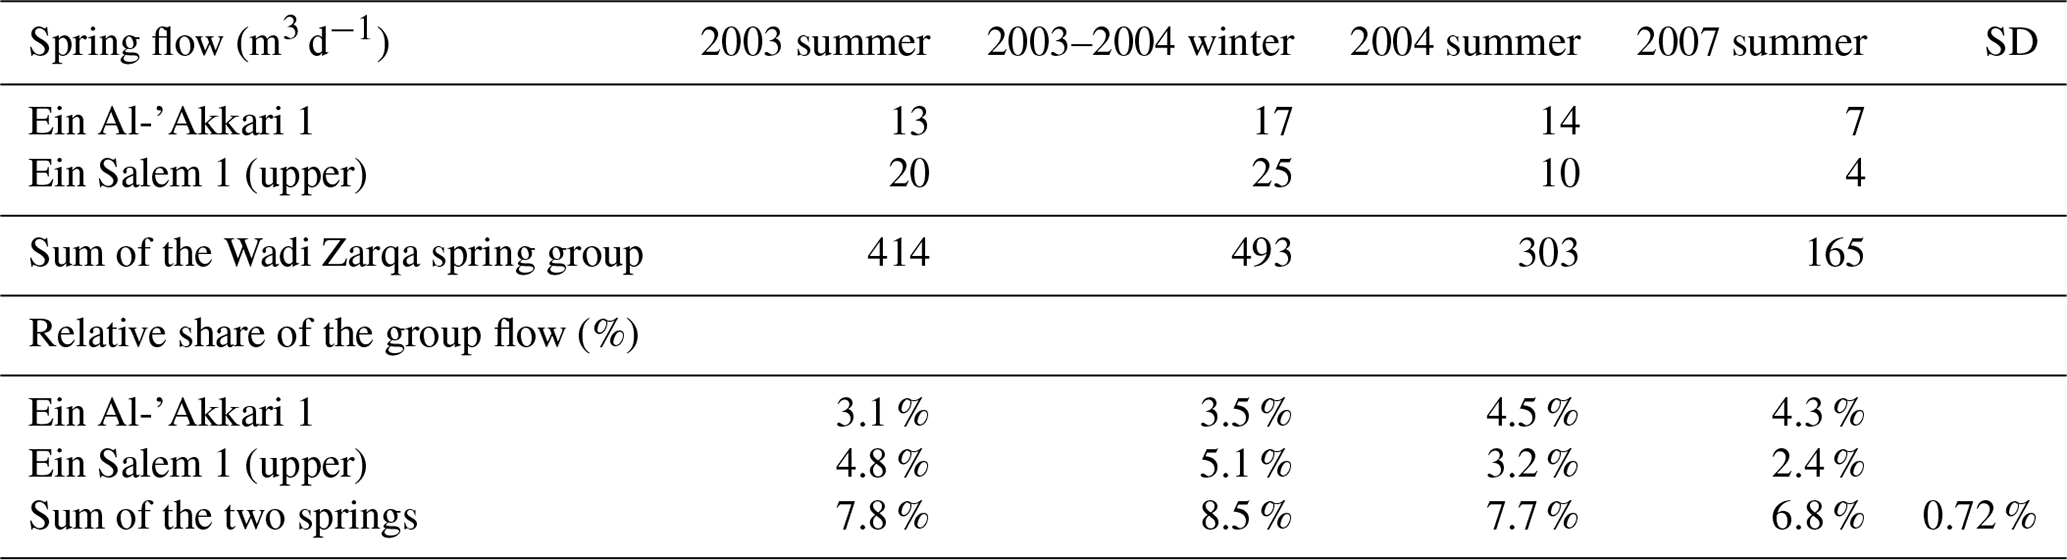
At the four key date campaigns, total spring outflow at the Beitillu spring group (Table F1) was between 61 and 110 m3 d−1. The three daily monitored springs combined made up 20 %–22 % of total spring group flow with a standard deviation of 1.15 %. At the four key date campaigns, the total spring outflow at the Wadi Zarqa spring group (Table F2) was between 165 and 493 m3 d−1. The two daily monitored springs combined made up 6.8 %–8.5 % of the total spring group flow with a standard deviation of 0.72 % (bottom right cell).
In most years, the variability of precipitation was reciprocal to the variability of recharge. In other words, the wetter the year was, the higher the spatial variability of rainfall was, but the lower the spatial variability of recharge was. Variability here is expressed as the standard deviation (σ) for the values of the different stations. Although a single year (2005–2006) plotted far from the trend line, the otherwise quite pronounced pattern of the diagram shows that indeed spatial variability of recharge deserves more attention than it has given so far since in the WAB, most studies focussed on temporal recharge variability. The trend is in line with general observations worldwide that basin responses in relatively dry climates are more variable than those in wet climates. A similar response pattern was observed for runoff in Messerschmid et al. (2018), where strong precipitation events triggered runoff in all areas alike, whereas weaker rainfall events showed different responses in different areas.
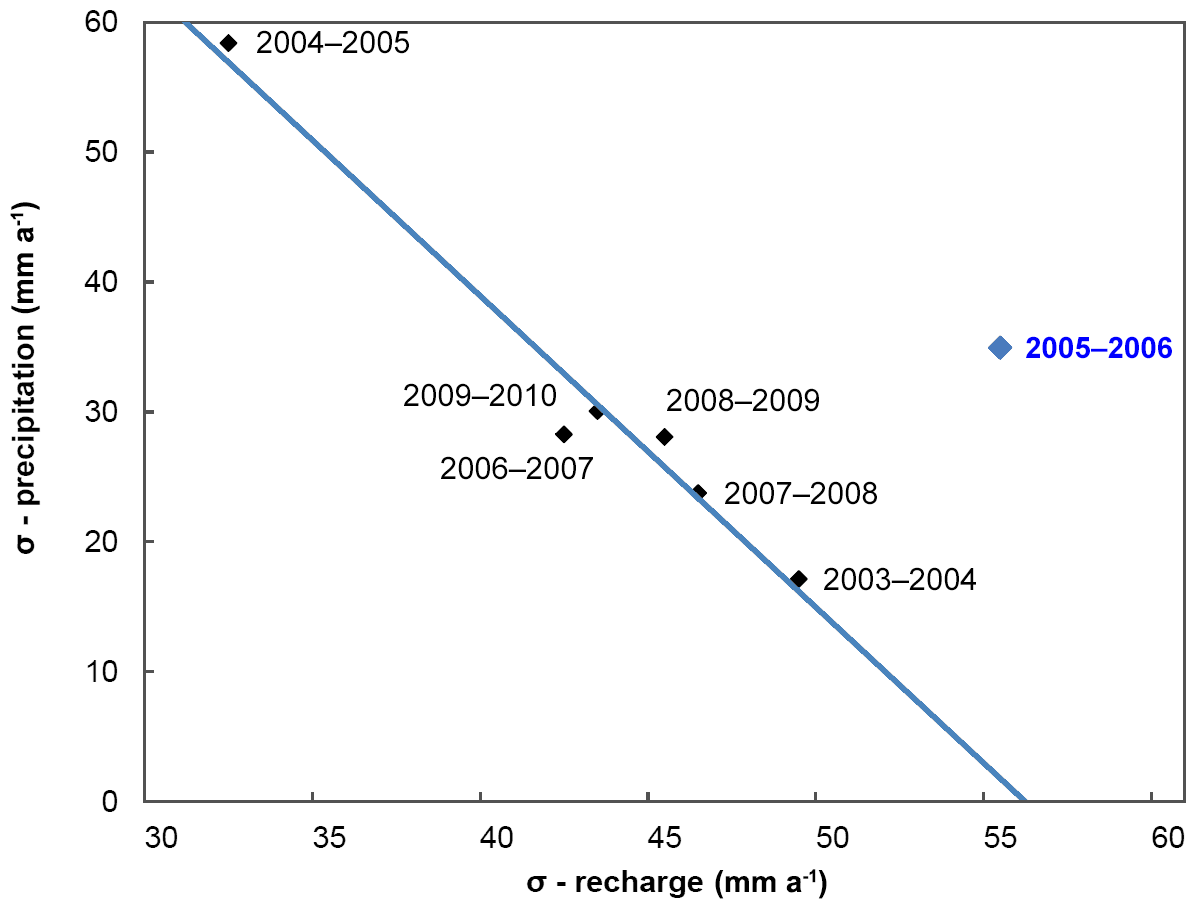
Figure G1The axes are the scaling of standard deviations (σ) of P and DP. Note that the linear trend line excludes the year 2005–2006, which deviates from the trend of the other years. In this year, spatial variability of recharge was quite high but nonetheless, spatial variability of recharge was high as well. 2005–2006 was a special year because it had an exceptionally intensive storm event (and the strongest during the entire measurement period) very late in the season (early April 2006). The different stations were affected differently by the relatively long dry period before the event and the high precipitation during the event, depending on the soil thickness and therefore on the speed of the drying of the soils and consequent soil saturation during the event.
Recharge rates (in mm a−1 or calculated as coefficients as a percentage) have been reported in numerous studies within the WAB and adjacent basins of the Mountain Aquifer (such as the Eastern Aquifer Basin). Table H1 presents a collection of findings in the literature from both the WAB as well as other regions of the world and from a large variety of different research methods (highly relevant studies marked in bold). The table shows that with an average area recharge coefficient between 41 % and 47 % (for the WAB portion of Wadi Natuf; see Messerschmid et al., 2020), and with RC values between 30 % and 57 % for the individual aquiferous formations (not the aquitards), the findings of the model match very well with the ranges from the literature. While the lowest figures reported only 9 %–40 % of RC, the highest figures reached over 50 % and up to 60 % of recharge coefficients (in the Mt Carmel basin with a very similar geology and climate as in Wadi Natuf). For a small groundwater catchment overlapping with the Wadi Natuf surface catchment, Weiss and Gvirtzman (2007) found a long-term average of 47 % (see note below Table H1). Both the temporal and spatial variability of reported values are impressive (temporal variability can be detected by comparing the average with maximum RC values; spatial variability emerges from the differences between different basins and sub-basins both within and outside the WAB). In this respect, Wadi Natuf is highly representative of many basins with similar climatic, geological, soil type and landscape conditions.
Table H1Recharge coefficients in the literature. Models included in the figure are the following. The MOSST model incorporates climate change scenarios and simulates spring outflow of a karstic spring using an ensemble of five lumped hydrological models that consider karst hydrological processes in various ways and complexities (see Hartmann et al., 2012c). “TRAIN-ZIN is a hydrological model that has been developed for simulating hydrological processes and water balances in semi-arid and arid areas and combines conceptual and physically-based approaches.” (Gunkel and Lange, 2016) TRAIN (TRAnspiration and INterception) describes the vertical flow, and ZIN describes the horizontal flow (Menzel, 2011).
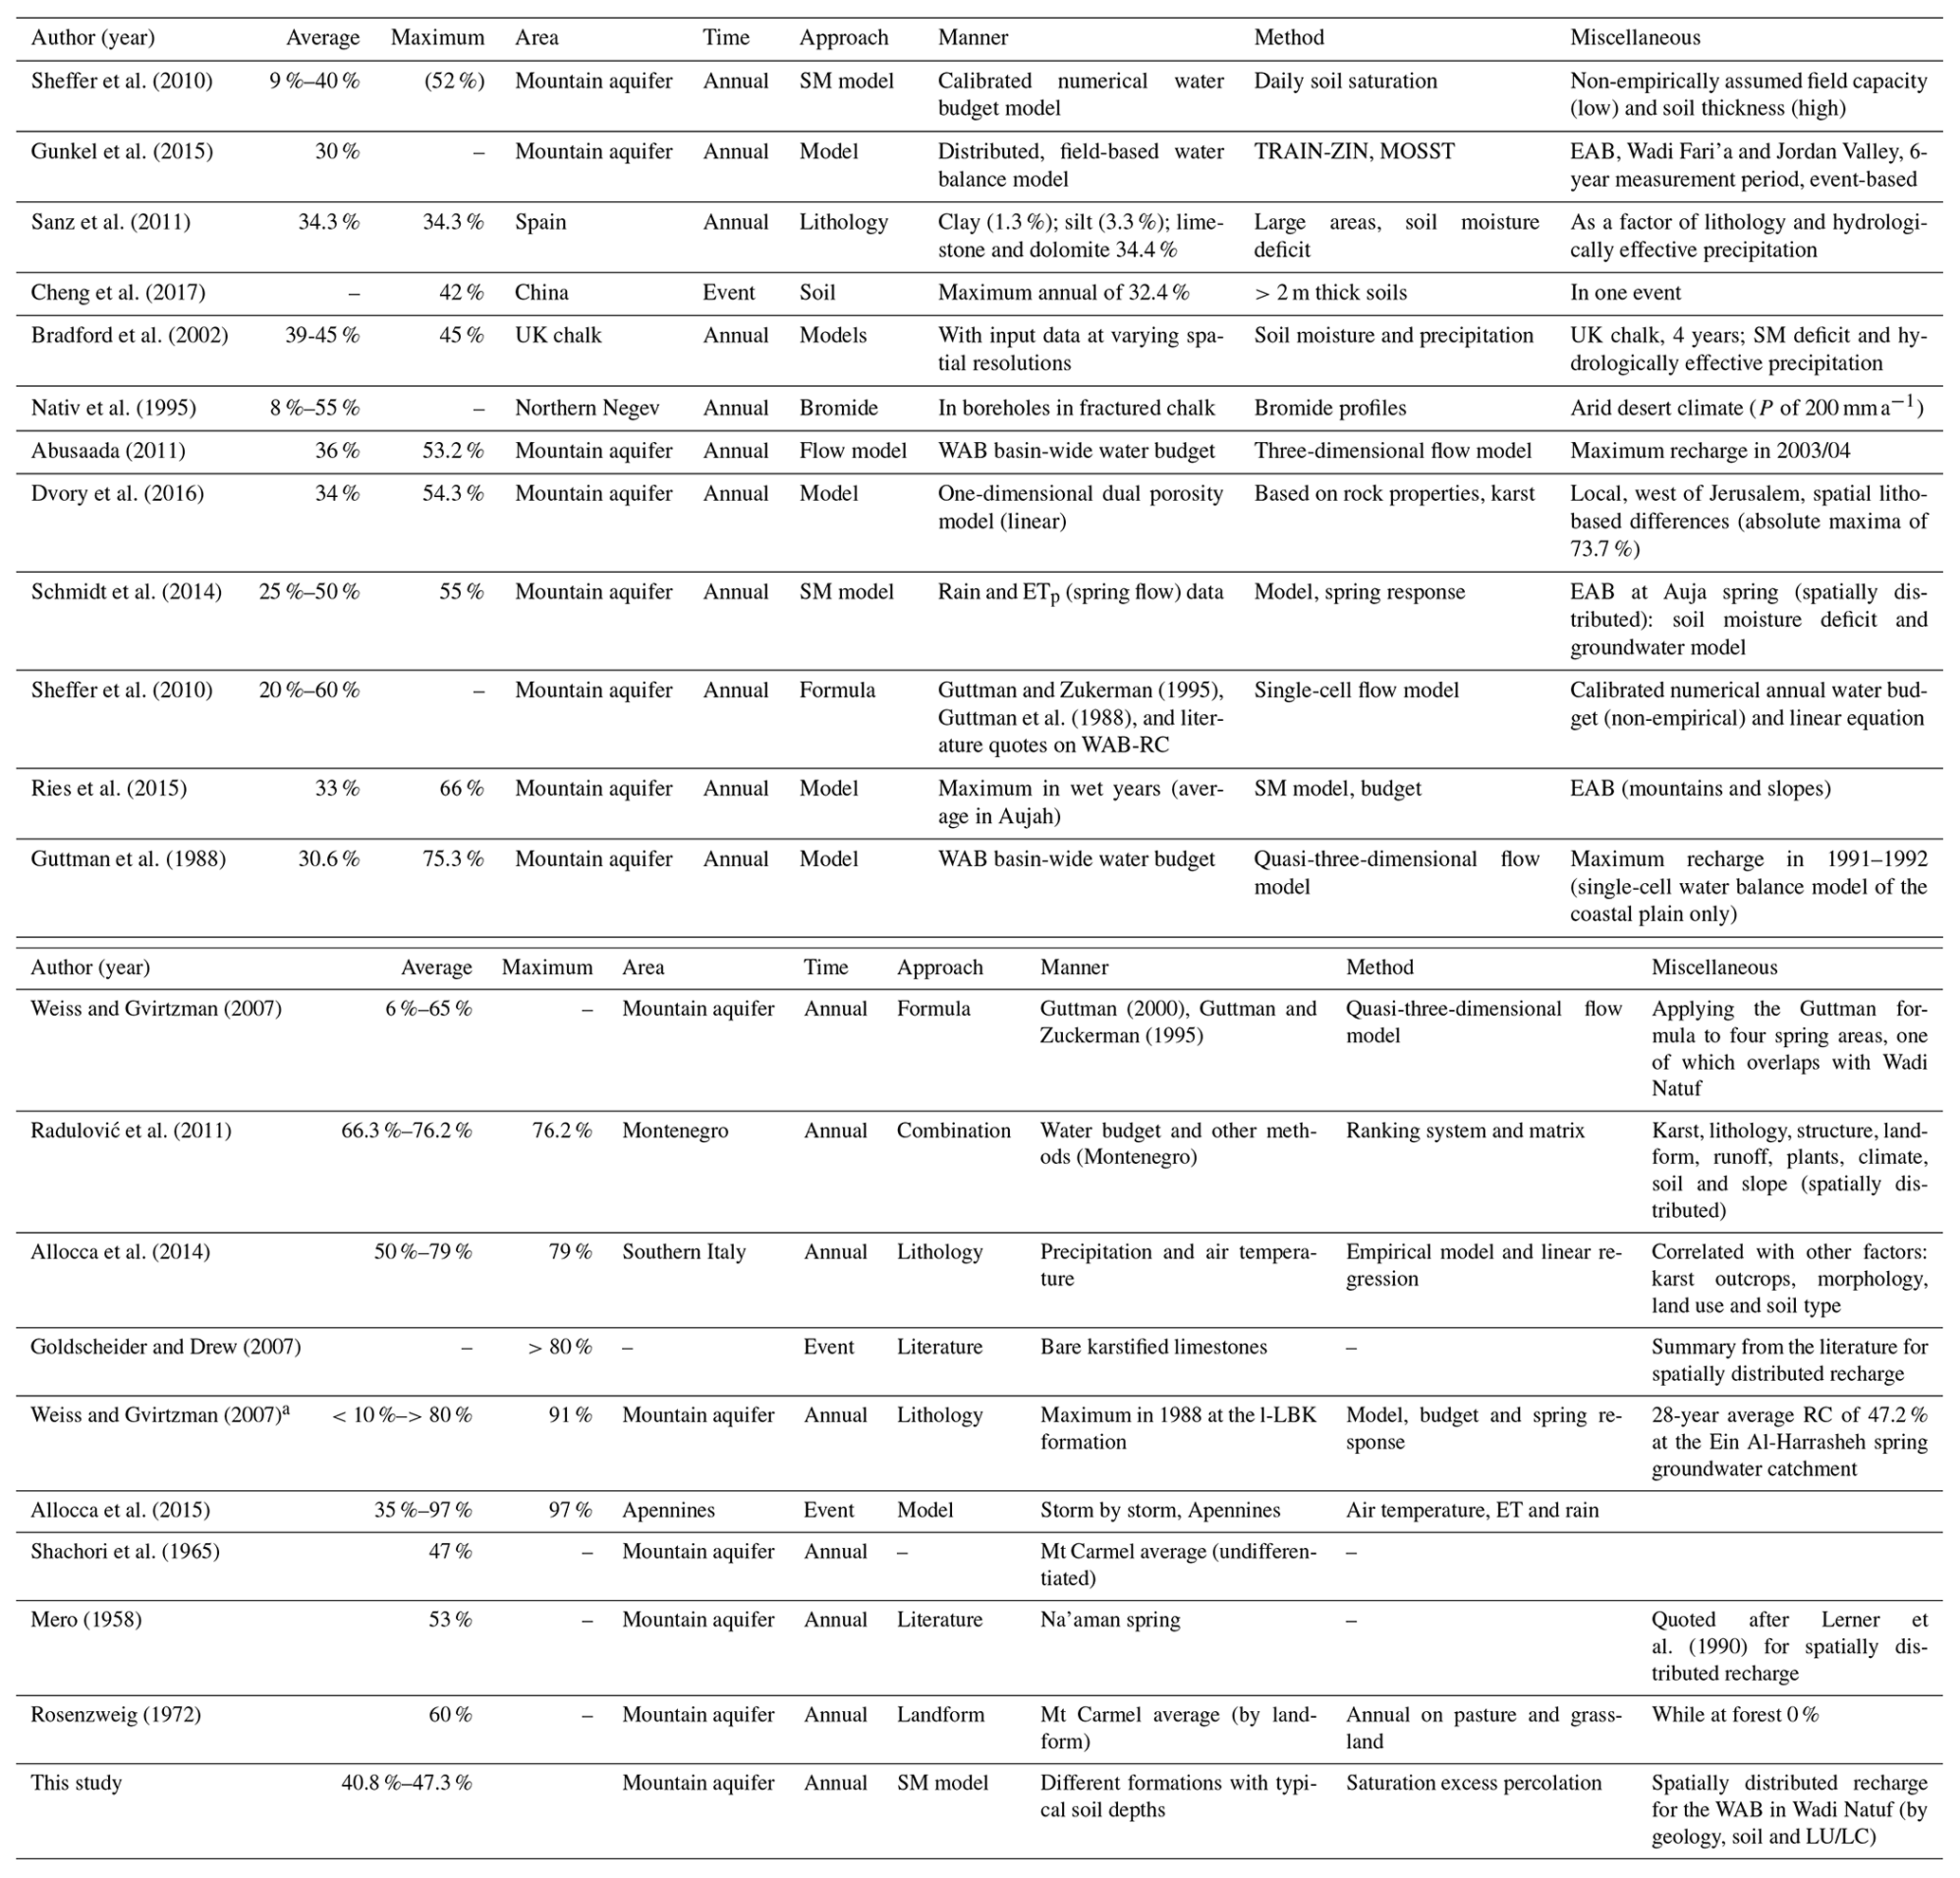
a For the groundwater catchment of the Ein Al-Harrasheh spring, which overlaps with the Natuf surface catchment, Weiss and Gvirtzman (2007) reported a 28-year average recharge coefficient of 47.2 %.
The geological map data can be downloaded as image files from https://www.gov.il/he/departments/general/map-1-50000 (last access: 29 January 2020). The GIS vector files for the geological map data were provided by the GSI upon request. Areal rainfall and soil moisture time series data are partly archived at the database of the author and of the SUSMAQ project follow-up organisation HWE (http://hwe.org.ps/, last access: 29 January 2020). It is required to obtain the data from either of these organisations or authors, and it is not possible to make the data publicly available. Field sampling and measurements were undertaken by the SUSMAQ project and the lead author. Selected data can be requested from the author or SUSMAQ follow-up organisation HWE. Selected AWS data inputs and outputs are archived at the lead author; HWE and PWA and can be made available upon request at PWA (http://www.pwa.ps/page.aspx?id=5W6F7La2541180510a5W6F7L, last access: 29 January 2020). ETp data for the Jerusalem station can be requested from the Israel Meteorological Service (http://www.ims.gov.il/en, last access: 29 January 2020) or downloaded from https://eca.knmi.nl/ (last access: 29 January 2020). A full set of data is available upon request to the lead author (clemensmesserschmid@yahoo.de).
CM undertook all practical elements of this study, including field observation and selection, purchase, instrumentation, and the reading out of measurements. CM also performed the site selection and conceptual approach. CM carried out all calculations, analysis and modelling. CM produced all graphs and figures, maps, tables, and diagrams. CM wrote the original draft. JL and MS reviewed and edited the draft.
The authors declare that they have no conflict of interest.
This article is part of the special issue “Environmental changes and hazards in the Dead Sea region (NHESS/ACP/HESS/SE inter-journal SI)”. It is not associated with a conference.
The initial concept and design and the first two measurement seasons of this project were conducted by the Palestinian–British Sustainable Use of West Bank and Gaza Aquifers (SUSMAQ) research and development project between the Palestinian Water Authority and University of Newcastle upon Tyne and were funded by DFID. This work would not have been possible without the unselfish efforts and invaluable contributions by many, particularly the daily spring readings by Majdi Zaydah, Ahmad Bajes and Ahmad Falah. The authors would like to thank Sebastian Schmidt for his version of the spreadsheet model and the ETp input, as well as the reviewers and the editor Christian Siebert for their patience and their detailed and helpful comments. Gratitude is also owed to Ivonne Mansbach for many field trips and unwavering support throughout. This article is dedicated to Almut Hoffmann, my beloved partner who tragically was torn out of life in March 2015.
This research was supported by the German Research Foundation (DFG) and the University of Freiburg as part of the Open Access Publishing funding programme. The study was supported by the University of Göttingen and the BMBF for funding within the context of the MedWater and SMART-MOVE projects.
This paper was edited by Christian Siebert and reviewed by Okke Batelaan and five anonymous referees.
Abusaada, M. J.: Flow Dynamics and Management Options in Stressed Carbonate Aquifer System, The Western Aquifer Basin, Palestine, PhD Thesis, University of Göttingen, available at: https://d-nb.info/1042263574/34 (last access: 19 April 2017), 2011.
Abusaada, M. and Sauter, M.: Recharge Estimation in Karst Aquifers by Applying the Water Level Fluctuation Approach, Int. J. Earth Sci. Geophys., 3, 013, https://doi.org/10.35840/2631-5033/1813, 2017.
Aish, A. M., Batelaan, O., and De Smedt, F.: Distributed recharge estimation for groundwater modeling using WetSpass model, case study – Gaza strip, Palestine, Arab. J. Sci. Eng., 35, 155–164, 2010.
Allocca, V., Manna, F., and De Vita, P.: Estimating annual groundwater recharge coefficient for karst aquifers of the southern Apennines (Italy), Hydrol. Earth Syst. Sci., 18, 803–817, https://doi.org/10.5194/hess-18-803-2014, 2014.
Allocca, V., De Vita, P., Manna, F., and Nimmo, J. R.: Groundwater recharge assessment at local and episodic scale in a soil mantled perched karst aquifer in southern Italy, J. Hydrol., 529, 843–853, https://doi.org/10.1016/j.jhydrol.2015.08.032, 2015.
Arbel, Y., Greenbaum, N., Lange, J., and Inbar, M.: Infiltration processes and flow rates in developed karst vadose zone using tracers in cave drips, Earth Surf. Process. Landf., 35, 1682–1693, https://doi.org/10.1002/esp.2010, 2010.
Bartov, Y.: Regional stratigraphy of Israel: A guide to geological mapping, GSI, Jerusalem, 1981.
Batelaan, O. and De Smedt, F.: WetSpass: a flexible, GIS based, distributed recharge methodology for regional groundwater modelling, IAHS Publ., 11, 11–17, 2001.
Batelaan, O. and De Smedt, F.: GIS-based recharge estimation by coupling surface–subsurface water balances, J. Hydrol., 337, 337–355, 2007.
Berger, D.: Hydrological Model for the Yarqon-Taninim Aquifer, Mekorot Ltd., Tel Aviv, 50 pp., 1999 (in Hebrew).
Beven, K.: Towards a coherent philosophy for modelling the environment, Proc. Royal Soc., London, 458, 2465–2484, 2002.
Beven, K. J. and Kirkby, M. J.: A physically based, variable contributing area model of basin hydrology, Hydrol. Sci. Bull., 42, 43–69, 1979.
Binley, A. and Beven, K.: Vadose Zone Flow Model Uncertainty as Conditioned on Geophysical Data, Ground Water, 41, 119–127, 2003.
Blume, T., Zehe, E., and Bronstert, A.: Investigation of runoff generation in a pristine, poorly gauged catchment in the Chilean Andes I: a multi-method experimental study, Hydrol. Process., 22, 3661–3675, 2008.
Bradford, R. B., Ragab, R., Crooks, S. M., Bouraoui, F., and Peters, E.: Simplicity versus complexity in modelling groundwater recharge in Chalk catchments, Hydrol. Earth Syst. Sci., 6, 927–937, https://doi.org/10.5194/hess-6-927-2002, 2002.
Bredenkamp, D. B., Botha, L. J., van Tonder, G. J., and van Rensburg, H. J: Manual on quantitaive estimation of groundwater recharge and aquifer storativity: based on practical hydro-geological methods, Report (TT 73/95), Water Research Commission, Pretoria, South Africa, 1995.
Cheng, Y., Zhan, H., Yang, W., Dang, H., and Li, W.: Is annual recharge coefficient a valid concept in arid and semi-arid regions?, Hydrol. Earth Syst. Sci., 21, 5031–5042, https://doi.org/10.5194/hess-21-5031-2017, 2017.
Dafny, E.: Groundwater flow and solute transport within the Yarqon-Taninim aquifer, Israel, Diss. PhD Thesis, Hebrew University of Jerusalem, Israel, 2009.
Dafny, E., Burg, A., and Gvirtzman, H.: Effects of Karst and geological structure on groundwater flow: The case of Yarqon-Taninim Aquifer, Israel, J. Hydrol., 389, 260–275, https://doi.org/10.1016/j.jhydrol.2010.05.038, 2010.
Dan, Y., Raz, Z., Yaalon, D. H., and Koyumdjisky, H.: Soil map of Israel 1:500 000, available at: http://esdac.jrc.ec.europa.eu/images/Eudasm/Asia/images/maps/download/IL3002_SO.jpg (last access: 16 January 2019), Ministry of Agriculture, Agricultural Research Organization & Soil Consveration and Drainage Dept., Jerusalem, 1975.
De Vries, J. J. and Simmers, I.: Groundwater recharge: an overview of processes and challenges, Hydrogeol. J., 10, 5–17, 2002.
Dingman, S. L.: Physical/Hydrology, Macmillan, New York, USA, 1994.
Dooge, J. C.: A general theory of the unit hydrograph, J. Geophys. Res., 64, 241–256, 1959.
Dörhöfer, G. and Jesopait, V.: Grundwasserneubildung und ihre Ermittlung – eine Anmerkung zum Beitrag von Hölting: Modellrechnungen zur Grundwasserneubildung, Grundwasser, 2, 77–80, https://doi.org/10.1007/s767-1997-8523-3, 1997.
Dvory, N. Z., Livshitz, Y., Kuznetsov, M., Adar, E., and Yakirevich, A.: The effect of hydrogeological conditions on variability and dynamic of groundwater recharge in a carbonate aquifer at local scale, J. Hydrol., 535, 480–494, https://doi.org/10.1016/j.jhydrol.2016.02.011, 2016.
Eder, G., Sivapalan, M., and Nachtnebel, H. P.: Modelling water balances in an Alpine catchment through exploitation of emergent properties over changing time scales, Hydrol. Process., 17, 2125–2149, 2003.
ESCWA-BGR: Inventory of shared water resources in Western Asia, Chapter 16 Western Aquifer Basin, available at: http://waterinventory.org/groundwater/western-aquifer-basin (last access: 14 May 2018), United Nations Economic and Social Commission for Western Asia (UN-ESCWA) and Federal Institute for Geosciences and Natural Resources (BGR), Beirut, 23 pp., 2013.
Ettinger, H.: Spatial Analysis of extreme Storms and Floods in the Ayalon-Yarqon Catchment, Phys. Geogr. Dept., Inst. Earth Sci., Hebrew Univ., Jerusalem, 55 pp., 1996.
Fetter, C. W.: Applied Hydrogeology, Prentice Hall, New Jersey, NJ, 691 pp., 1994.
Ford, D. and Williams, P.: Karst hydrology and geomorphology, John Wiley & Sons Ltd., West Sussex, England, 2007.
Franchini, M. and Pacciani, M.: Comparative analysis of several conceptual rainfall–runoff models, J. Hydrol., 122, 161–219, 1991.
Frumkin, A., Schwarz, H. P., and Ford, D. C.: Evidence for isotopic equilibrium in stalagmites from caves in a dry region: Jerusalem, Israel, Isr. J. Earth Sci., 43, 221–230, 1994.
Gimbel, K.: Influence of Artificial Drought on Soil Hydrology of Temperate Forest Ecosystems, Dissertation, University of Freiburg i.Br, Hydrology Dept., Freiburg, Germany, 110 pp., 2015.
Goldscheider, N. and Drew, D. (Eds.): Methods in Karst Hydrogeology, International Contribution to Hydrogeology, IAH, 26, 264 pp., Taylor and Francis/Balkema, London, 2007.
Goldschmidt, M. J. and Jacobs, M.: Precipitation over and replenishment of the Yarqon and Nahal Hatteninim underground catchments, Hydrological Paper 3, Hydrological Service of Israel, Jerusalem, 1958.
Grayson, R. and Blöschl, G. (Eds.): Summary of pattern comparison and concluding remarks, Chapter 14, in: Spatial patterns in catchment hydrology: observations and modelling, Cambridge University Press, Cambridge, 355–367, 2000.
Grodek, T., Lange, J., Lekach, J., and Husary, S.: Urban hydrology in mountainous middle eastern cities, Hydrol. Earth Syst. Sci., 15, 953–966, https://doi.org/10.5194/hess-15-953-2011, 2011.
GSI: Geological Map of Israel, Sheet 8-IV: Ramallah, Geological Map by: Shachnai, E., available at: https://www.gov.il/he/departments/general/ramallah-map (last access: 16 March 2018), GSI – Geological Survey of Israel, Jerusalem, 2000.
GSI: Geological Map of Israel, Sheet 8-III: Lod, Geological Map by: Yechieli, Y., available at: https://www.gov.il/he/departments/general/lod-map (last access: 16 March 2018), GSI – Geological Survey of Israel, Jerusalem, 2008.
Gunkel, A. and Lange, J.: A technical report on TRAIN-ZIN, description of a hydrological model for semi-arid and arid areas, Freiburg HydroNotes Series paper 3, 48 pp., Univ. Freiburg/Br., available at: http://www.hydrology.uni-freiburg.de/publika/hydronotes/HNS_003.pdf (last access: 31 January 2020), 2016.
Gunkel, A., Shadeed, S., Hartmann, A., Wagener, T., and Lange, J.: Model signatures and aridity indices enhance the accuracy of water balance estimations in a data-scarce Eastern Mediterranean catchment, J. Hydrol.-Reg. Stud., 4, 487–501, https://doi.org/10.1016/j.ejrh.2015.08.002, 2015.
Guttman, J.: Multi-Lateral Project B: Hydrogeology of the Eastern Aquifer in the Judea Hills and Jordan Valley, Mekorot Water Company, Report No. 468, Tel Aviv, Israel, 2000.
Guttman, J. and Zukerman, H.: Yarqon-Taninim-Beer Sheeba Basin, flow model, Tahal Consult. Eng., Tel Aviv, Israel, 37 pp., 1995.
Guttman, J., Goldshtoff, I., Baida, A., and Mercado, A.: A two-layer model of flow regime and salinity in the Yarqon-Taninim Aquifer, Tahal Consult. Eng., (Rep. 01/88/23), Tel Aviv, Israel, 19 pp., 1988.
Hargreaves, G. H. and Samani, Z. A.: Reference crop evapotranspiration from temperature, Appl. Eng. Agr., 1, 96–99, 1985.
Hartmann, A., Kralik, M., Humer, F., Lange, J., and Weiler, M.: Identification of a karst system's intrinsic hydrodynamic parameters: upscaling from single springs to the whole aquifer, Environ Earth Sci., 65, 2377–2389, https://doi.org/10.1007/s12665-011-1033-9, 2012a.
Hartmann, A., Lange, J., Weiler, M., Arbel, Y., and Greenbaum, N.: A new approach to model the spatial and temporal variability of recharge to karst aquifers, Hydrol. Earth Syst. Sci., 16, 2219–2231, https://doi.org/10.5194/hess-16-2219-2012, 2012b.
Hartmann, A., Lange, J., Aguado, À. V., Mizyed, N., Smiatek, G., and Kunstmann, H.: A multi-model approach for improved simulations of future water availability at a large Eastern Mediterranean karst spring, J. Hydrol., 468, 130–138, 2012c.
Hartmann, A., Weiler, M., Wagener, T., Lange, J., Kralik, M., Humer, F., Mizyed, N., Rimmer, A., Barberá, J. A., Andreo, B., Butscher, C., and Huggenberger, P.: Process-based karst modelling to relate hydrodynamic and hydrochemical characteristics to system properties, Hydrol. Earth Syst. Sci., 17, 3305–3321, https://doi.org/10.5194/hess-17-3305-2013, 2013.
Hrachowitz, M. and Clark, M. P.: HESS Opinions: The complementary merits of competing modelling philosophies in hydrology, Hydrol. Earth Syst. Sci., 21, 3953–3973, https://doi.org/10.5194/hess-21-3953-2017, 2017.
Hrachowitz, M., Savenije, H. H., Blöschl, G., McDonnell J. J., Sivapalan, M., Pomeroy, J. W., Arheimer, B., Blume T., Clark, M. P., Ehret, U., and Fenicia, F.: A decade of Predictions in Ungauged Basins (PUB) – a review, Hydrol. Sci. J., 58, 1198–255, 2013.
HSI: Development of utilization and status of water resources in Israel until Autumn 2014, available at: http://water.gov.il/Hebrew/ProfessionalInfoAndData/Data-Hidrologeime/Pages/water-resources-2014.aspx (last access: 17 May 2018), State of Israel, Water commission, Hydrological service, Annual report, Jerusalem, 509 pp., 2016 (in Hebrew).
Hughes, A. G. and Mansour, M. M.: Recharge modeling for the West Bank aquifers, BGS – British Geological Survey, Commissioned Report, CR/05/087, Keyworth, Nottingham, UK, 90 pp., 2005.
Hughes, A. G., Mansour, M. M., and Robins, N. S.: Evaluation of distributed recharge in an upland semi-arid karst system: the West Bank Mountain Aquifer, Middle East, Hydrogeol. J., 16, 845–854, https://doi.org/10.1007/s10040-008-0273-6, 2008.
IMS – Israel Meteorological Service: online database of the Israel Meteorological Service, Bet Dagan, available at: http://data.gov.il/ims/3, last access: 1 October 2017.
Jeannin, P. Y. and Sauter, M.: Analysis of karst hydrodynamic behaviour using global approaches: a review, Bull. Hydrogéol. (Neuchâtel), 16, 31–48, 1998.
Juston, J., Seibert, J., and Johansson, P. O.: Temporal sampling strategies and uncertainty in calibrating a conceptual hydrological model for a small boreal catchment, Hydrol. Process., 23, 3093–3109, 2009.
Kapangaziwiri, E., Hughes, D. A., and Wagener, T.: Constraining uncertainty in hydrological predictions for ungauged basins in southern Africa, Hydrol. Sci. J., 57, 1000–1019, 2012.
Lambert, A. O.: A comprehensive rainfall-runoff model for an upland catchment, J. Instn Wat. Engrs, 23, 231–238, 1969.
Lange, J., Greenbaum, N., Husary, S., Ghanem, M., Leibundgut, C., and Schick, A. P.: Runoff generation from successive simulated rainfalls on a rocky, semi-arid, Mediterranean hillslope, Hydrol. Process., 17, 279–296, https://doi.org/10.1002/hyp.1124, 2003.
Lange, J., Arbel, Y., Grodek, T., and Greenbaum, N.: Water percolation process studies in a Mediterranean karst area, Hydrol. Process., 24, 1866–1879, 2010.
Lerner, D. N., Issar, A. S., and Simmers, I.: Groundwater recharge: A guide to understanding and estimating natural recharge, International Contributions to Hydrogeology, 8, 375 pp., Verlag Heinz Heise, Hannover, 1990.
Martínez-Santos, P. and Andreu, J. M.: Lumped and distributed approaches to model natural recharge in semiarid karst aquifers, J. Hydrol., 388, 389–398, https://doi.org/10.1016/j.jhydrol.2010.05.018, 2010.
McDonnell, J. J. and Woods, R.: On the need for catchment classification, J. Hydrol., 299, 2–3, 2004.
McDonnell, J. J., Sivapalan, M., Vaché, K., Dunn, S., Grant, G., Haggerty, R., Hinz, C., Hooper, R., Kirchner, J., Roderick, M. L., Selker, J., and Weiler, M.: Moving beyond heterogeneity and process complexity: a new vision for catchment hydrology, Water Resour. Res., 43, W07301, https://doi.org/10.1029/2006WR005467, 2007.
Menzel, L.: Das hydrologische Modell TRAIN, Research Note at Univ. Heidelberg, December 2011, 6 pp., http://www.geog.uni-heidelberg.de/md/chemgeo/geog/hydro/train-beschreibung_dez2011.pdf, 2011.
Mero, F.: Hydrological investigation of the Na'aman spring region, Tahal, Water Planning for Israel, Rep. P.N. 45, Tel Aviv, 1958.
Messerschmid, C., Aliewi, A., Kalbouneh, A., Sayfi, E. and Ziada, M.: Field trips to the springs in Wadi Natuf, Final Report – SUSMAQ-NAT # 65 V 0.1, prepared by: SUSMAQ TEAM, Palestinian Water Authority, Palestine, Water Resource Systems Research Laboratory, University of Newcastle upon Tyne, UK, July 2003, Ramallah, 2003a.
Messerschmid, C., Kalbouneh, A., Zayed, O., and Sayfi, E.: Conceptual Model of Wadi Natuf Groundwater Recharge, Final Report – SUSMAQ-NAT # 64 V 0.3, prepared by: SUSMAQ TEAM, Palestinian Water Authority, Palestine, Water Resource Systems Research Laboratory, University of Newcastle upon Tyne, UK, November 2003, Ramallah, 2003b.
Messerschmid, C., Lange, J., and Sauter, M.: Assessment of transmission loss in a Mediterranean karstic watershed (Wadi Natuf, West Bank), Hydrol. Process., 32, 1375–1390, https://doi.org/10.1002/hyp.11496, 2018.
Messerschmid, C., Sauter, M., and Lange, J.: Regionalization of distributed groundwater recharge and leakage calculations in a Mediterranean karst catchment, Wadi Natuf, West Bank, in preparation, 2020.
Nash, J. E.: The form of the instantaneous unit hydrograph, International Association of Scientific Hydrology, 3, 114–121, 1957.
Nativ, R., Adar, E., Dahan, O., and Geyh, M.: Water recharge and solute transport through the vadose zone of fractured chalk under desert conditions, Water Resour. Res., 31, 253–261, 1995.
Olden, J. D., Kennard, M. J., and Pusey, B. J.: A framework for hydrologic classification with a review of methodologies and applications in ecohydrology, Ecohydrology, 5, 503–518, 2012.
Pomeroy, J.: IAHS Decade for Predictions in Ungauged Basins, PUB, Presentation at IAHS-PUB 11 May 2011, Canmore, Canada, available at: http://www.usask.ca/hydrology/pub2011/presentations/Pomeroy_PUB2011_Weds11May.pdf (last access: 17 December 2018), 2011.
Radulović, M. M., Stevanović, Z., and Radulović, M.: A new approach in assessing recharge of highly karstified terrains – Montenegro case studies, Environ. Earth Sci., 65, 2221–2230, https://doi.org/10.1007/s12665-011-1378-0, 2011.
Ries, F., Lange, J., Schmidt, S., Puhlmann, H., and Sauter, M.: Recharge estimation and soil moisture dynamics in a Mediterranean, semi-arid karst region, Hydrol. Earth Syst. Sci., 19, 1439–1456, https://doi.org/10.5194/hess-19-1439-2015, 2015.
Ries, F., Schmidt, S., Sauter, M., and Lange, J.: Controls on runoff generation along a steep climatic gradient in the Eastern Mediterranean, J. Hydrol.-Reg. Stud., 9, 18–33, https://doi.org/10.1016/j.ejrh.2016.11.001, 2017.
Rosenzweig, A.: Study of the difference in effects of forest and other vegetative covers on water yield, Final report, Project A-10-FS-13, State of Israel, Ministry of Agriculture, Soil Conservation and Drainage Division Research Unit, Rishon LeTsiyon, Israel, 1972.
Ryu, Y., Baldocchi, D. D., Ma, S., and Hehn, T.: Interannual variability of evapotranspiration and energy exchange over an annual grassland in California, J. Geophys. Res., 113, D09104, https://doi.org/10.1029/2007JD009263, 2008.
Sanz, E., Menéndez Pidal de Navascués, I., and Távara, C.: Calculating the average natural recharge in large areas as a factor of their lithology and precipitation, Hydrol. Earth Syst. Sci. Discuss., 8, 4753–4788, https://doi.org/10.5194/hessd-8-4753-2011, 2011.
Savenije, H. H. G.: HESS Opinions “Topography driven conceptual modelling (FLEX-Topo)”, Hydrol. Earth Syst. Sci., 14, 2681–2692, https://doi.org/10.5194/hess-14-2681-2010, 2010.
Scanlon, B. R., Healy, R. W., and Cook, P. G.: Choosing appropriate techniques for quantifying groundwater recharge, Hydrogeol. J., 10, 18–39, https://doi.org/10.1007/s10040-002-0200-1, 2002.
Scanlon, B. R., Keese, K. E. A., Flint, L., Flint, L. E., Gaye, C. B., Edmunds, W. M., and Simmers, I.: Global synthesis of groundwater recharge in semiarid and arid regions, Hydrol. Process., 20, 3335–3370, https://doi.org/10.1002/hyp.6335, 2006.
Schmidt, S., Geyer, T., Guttman, J., Marei, A., Ries, F., and Sauter, M.: Characterisation and modelling of conduit restricted karst aquifers – example of the Auja spring, Jordan Valley, J. Hydrol., 511, 750–763, 2014.
Seibert, J. and Beven, K. J.: Gauging the ungauged basin: how many discharge measurements are needed?, Hydrol. Earth Syst. Sci., 13, 883–892, https://doi.org/10.5194/hess-13-883-2009, 2009.
Shachori, A., Michaeli, A., and Rosenzweig, D.: Hydrologic Studies on a Representative Karst Catchment in Israel, Symposium of Budapest, International Union of Geodesy and Geophysics, 333–346, 1965.
Sheffer, N. A.: Variable scale recharge measurement and modeling using the hydrometeorological DREAM, PhD dissertation, Hebrew Univ. of Jerusalem, Israel, 97 pp., 2009.
Sheffer, N. A., Dafny, E., Gvirtzman, H., Navon, S., Frumkin, A., and Morin, E.: Hydrometeorological daily recharge assessment model (DREAM) for the Western Mountain Aquifer, Israel: Model application and effects of temporal patterns, Water Resour. Res., 46, W05510, https://doi.org/10.1029/2008WR007607, 2010.
Simmers, I. (Ed.): Estimation of Natural Groundwater Recharge, D. Reidel Publishing Company, Dordrecht, the Netherlands, 510 pp., 1988.
Sivakumar, B.: Dominant processes concept in hydrology: Moving forward, Hydrol. Process., 18, 2349–2353, 2004.
Sivakumar, B.: Dominant processes concept, model simplification and classification framework in catchment hydrology, Stochastic Environ. Res. Risk Assess., 22, 737–748, 2008.
Sivakumar, B., Singh, V. P., Berndtsson, R., and Khan, S. K.: Catchment classification framework in hydrology: challenges and directions, J. Hydrol. Eng., 20, A4014002, https://doi.org/10.1061/(ASCE)HE.1943-5584.0000837, 2013.
Sivapalan, M.: Prediction in ungauged basins: a grand challenge for theoretical hydrology, Hydrol. Process., 17, 3163–3170, 2003.
Sivapalan, M., Blöschl, G., Zhang, L., and Vertessy, R.: Downward approach to hydrological prediction, Hydrol. Process., 17, 2101–2111, 2003a.
Sivapalan, M., Takeuchi, K., Franks, S. W., Gupta, V. K., Karambiri, H., Lakshmi, V., Liang, X., McDonnell, J. J., Mendiondo, E. M., O'Connell, P. E., Oki, T., Pomeroy, J. W., Schertzer, D., Uhlenbrook, S., and Zehe, E.: IAHS Decade on Predictions in Ungauged Basins (PUB), 2003–2012: Shaping an exciting future for the hydrological sciences, Hydrol. Sci. J., 48, 857–880, https://doi.org/10.1623/hysj.48.6.857.51421, 2003b.
Steinmann, A.: Runoff generation in Mediterranean areas, Dissertation, University of Freiburg i.Br, Hydrology Dept., Freiburg, Germany, 159 pp., 2010.
SUSMAQ: Boundaries of the Western Aquifer Basin and the Eocene Aquifer in the Northeastern Aquifer Basin, SUSMAQ-MOD Report No. # 6.1 V1.0, The Sustainable Management for the West Bank and Gaza Aquifers, available at: http://www.hwe.org.ps/Projects/SUSMAQ_Reports/Flow% 20 Modeling/Boundaries% 20of% 20the% 20Western% 20Aquifer % 20Basinand% 20and% 20the% 20Eocene% 20Aquifer% 20 in% 20the% 20Northeastern% 20 Aquifer% 20Basin.pdf (last access: 2 April 2015), Palestinian Water Authority and University of Newcastle upon Tyne, UK, Ramallah, Palestine, 56 pp., 2001.
SUSMAQ: Compiled Base Data for the Numerical Groundwater Flow Model of the Western Aquifer Basin. Volume 1 – General Background, SUSMAQ-MOD Report No. #07 V0.4, The Sustainable Management for the West Bank and Gaza Aquifers, Palestinian Water Authority and University of Newcastle upon Tyne, UK, Ramallah, Palestine, 306 pp., 2002.
SUSMAQ: Steady State Flow Model of the Western Aquifer Basin, SUSMAQ-MOD Report No. #23 V0.2, The Sustainable Management for the West Bank and Gaza Aquifers, Palestinian Water Authority and University of Newcastle upon Tyne, UK, Ramallah, Palestine, 99 pp., 2003.
UN-GA: Convention on the Law of the Non-navigational Uses of International Watercourses, adopted by the General Assembly of the United Nations on 21 May 1997, New York, United Nations, available at: http://legal.un.org/ilc/texts/instruments/english/conventions/8_3_1997.pdf (last access: 19 January 2019), 1997.
Wagener, T., Sivapalan, M., Troch, P., and Woods, R.: Catchment classification and hydrologic similarity, Geography compass, 1, 901–931, 2007.
Weiss, M. and Gvirtzman, H.: Estimating ground water recharge using flow models of perched karstic aquifers, GroundWater, 45, 761–773, 2007.
Woods, R. A.: Seeing catchments with new eyes, Hydrol. Process., 16, 1111–1113, 2002.
World Bank: West Bank and Gaza – Assessment of restrictions on Palestinian water sector development, available at: http://documents.worldbank.org/curated/en/7754914681397822 40/West-Bank-and-Gaza-Assessment-of-restrictions-on-Palestinian-water-sector-development (last access: 17 December 2018), World Bank, Washington, D.C., 2009.
Young, P. C. and Ratto, M.: A unified approach to environmental systems modeling, Stoch. Env. Res. Risk A., 23, 1037–1057, 2009.
Zomlot, Z., Verbeiren, B., Huysmans, M., and Batelaan, O.: Spatial distribution of groundwater recharge and base flow: Assessment of controlling factors, J. Hydrol. Reg. Stud., 4, 349–368, https://doi.org/10.1016/j.ejrh.2015.07.005, 2015.
- Abstract
- Introduction
- Study area
- Methodology
- Results
- Discussion
- Conclusions
- Appendix A
- Appendix B
- Appendix C
- Appendix D
- Appendix E
- Appendix F
- Appendix G
- Appendix H
- Data availability
- Author contributions
- Competing interests
- Special issue statement
- Acknowledgements
- Financial support
- Review statement
- References